Embed Size (px)
DESCRIPTION
can be found at: American Politics Research Additional services and information for P olitical activists such as Ralph Nader argue that there are few meaning- spending, defense spending, and party ideology. 5 For example, the govern- ment spending question is Table 1 Who Are They? Perceptions of Differences by Selected Demographics and Attitudes (in percentages)
Citation preview
http://apr.sagepub.com
American Politics Research
DOI: 10.1177/1532673X07303755 2007; 35; 905 American Politics Research
Craig Goodman and Gregg R. Murray Voting Behavior
Do You See What I See? Perceptions of Party Differences and
http://apr.sagepub.com/cgi/content/abstract/35/6/905 The online version of this article can be found at:
Published by:
http://www.sagepublications.com
can be found at:American Politics Research Additional services and information for
http://apr.sagepub.com/cgi/alerts Email Alerts:
http://apr.sagepub.com/subscriptions Subscriptions:
http://www.sagepub.com/journalsReprints.navReprints:
http://www.sagepub.com/journalsPermissions.navPermissions:
http://apr.sagepub.com/cgi/content/refs/35/6/905SAGE Journals Online and HighWire Press platforms):
(this article cites 37 articles hosted on the Citations
distribution.© 2007 SAGE Publications. All rights reserved. Not for commercial use or unauthorized
by Juan Pardo on November 14, 2007 http://apr.sagepub.comDownloaded from
American Politics ResearchVolume 35 Number 6
November 2007 905-931© 2007 Sage Publications
10.1177/1532673X07303755http://apr.sagepub.com
hosted athttp://online.sagepub.com
905
Do You See What I See?Perceptions of Party Differences and Voting BehaviorCraig GoodmanGregg R. MurrayTexas Tech University, Lubbock
We approach the issues of partisanship and voting behavior by focusingspecifically on a seldom-studied group—the substantial proportion of citizenswho see little to no important differences between the major parties.Motivated by the heuristics and burgeoning behavioral economics literatures,we conclude that party cues help reduce uncertainty for voters. More specifi-cally, for voters lacking these cues, we expect that there will be a bias towardthe incumbent candidate or party, which is motivated by the desire to decreasethe potential costs of postdecision regrets. Similarly, we expect that these indi-viduals are likely to delay choosing between candidates and may abstain fromvoting altogether, which is driven by a shortage of justifications on which tobase the decision. We develop measures of perceived party differences basedon symbolic and operational differences using data from the AmericanNational Election Study and find significant support for our hypotheses in thecontext of presidential elections.
Keywords: party identification; political parties; voting; elections; heuristics;partisan cues; behavioral economics; partisanship
Political activists such as Ralph Nader argue that there are few meaning-ful differences between Republicans and Democrats in contemporary
American politics, but the party platforms adopted every 4 years tell a differ-ent story. At the aggregate level, growing levels of elite polarization (Brewer& Stonecash, 2007; Fiorina, Abrams, & Pope, 2005; Hetherington, 2001;Poole & Rosenthal, 1997) have contributed to each party’s adopting moredistinctive policy positions and greater emphasis on mobilizing basesupporters (Abramson, Aldrich, & Rohde, 2006; Pomper, 2005). However,whereas political elites become increasingly polarized, a substantial mass ofAmerican citizens do not perceive any significant differences between theparties and seem to agree with Nader. American National Election Study(ANES) data from 1952 to 2004 reveal that on average, 37% of Americans
distribution.© 2007 SAGE Publications. All rights reserved. Not for commercial use or unauthorized
by Juan Pardo on November 14, 2007 http://apr.sagepub.comDownloaded from
906 American Politics Research
do not perceive differences between Democrats and Republicans in presi-dential election years, despite a significant decline in 2004. This phenomenonis even more pronounced for midterm elections, as an average of 46% ofAmericans do not perceive differences between the major parties during thesame time period.
For many Americans, partisanship is the most important predictor ofpolitical behavior, and there is empirical evidence suggesting that the effectof partisanship has increased (Bartels, 2000). If partisanship is an importantpredictor of political behavior, but Americans do not perceive differencesbetween the parties, this presents us with a puzzle. How constructive is par-tisanship for political decision making? To address this question, we explorethe political behavior of citizens who do not perceive significant differencesbetween the major parties. In particular, we focus on the vote choice and thetiming of voting decisions of these citizens in an effort to better understandwhy party cues are a valuable heuristic for voters.
Drawing on the burgeoning literature in behavioral economics, we con-clude that party cues help reduce uncertainty for voters. For voters lackingthese cues, we suggest that there will be a bias toward the incumbent party,which is motivated by the desire to decrease the potential costs of postdecisionregret. Similarly, we suggest that voters who do not perceive party differencesare likely to delay choosing between candidates and may abstain from votingaltogether, which is driven by the emotional costs imposed by uncertaintyresulting from a shortage of justifications on which to base the decision.
As such, our investigation proceeds as follows. In the next section, we pro-vide the theoretical foundations for our argument by discussing the role ofpartisanship as a heuristic and the effects of uncertainty in decision-makingprocesses. We then detail our hypotheses and the operationalization of ourvariables. The results of our empirical analyses follow. We conclude with adiscussion of the results and the significant implications these results have forunderstanding voting behavior in the United States.
Heuristics and Decision Making
Elections in the United States provide citizens with an important oppor-tunity to choose their government representatives and influence the directionof public policies. Americans are asked to vote more often and make morepolitical choices than citizens in most other democracies, and for even themost informed citizens this process can be complex. Given the complicatedissues that voters face at both the national and the state levels, it makes sense
distribution.© 2007 SAGE Publications. All rights reserved. Not for commercial use or unauthorized
by Juan Pardo on November 14, 2007 http://apr.sagepub.comDownloaded from
that most voters look for some kind of shortcut because it is often irrationalto invest the time and effort necessary to be well informed on most politicalissues (Downs, 1957; Riker & Ordeshook, 1968).
However, social cognition research has offered a mechanism throughwhich democracy may endure the complexities of the political process andchallenges of less-than-ideal citizens. Research in heuristics theory suggeststhat everyone has and uses decision-making shortcuts, which serve to com-pensate for a lack of knowledge and to manage the overwhelming flow ofinformation. According to Lau and Redlawsk (2001), heuristics can bethought of as “problem-solving strategies (often employed automatically orunconsciously)” (p. 952) that regulate information-processing requirementsand prevent them from exceeding cognitive capacity. Heuristic processing isvital because the alternative is decision-making paralysis, which wouldresult from a lack of appropriate information on which to base a decision, oran overwhelmed cognitive process, which would treat all new information asunique.
Much to the relief (and sometimes concern) of those apprehensive aboutthe viability of democracy, there is substantial evidence that political deci-sions are subject to heuristic processing (e.g., Brady & Sniderman, 1985;Hamill, Lodge, & Blake, 1985; Kam, 2005; Lau & Redlawsk, 2001; Lodge &Hamill, 1986; Lupia, 1994; McDermott, 2005, 2006; Mondak, 1993; Ottati,1990; Rahn, 1993; Scholz & Lubell, 1998; Sniderman, Hagen, Tetlock, &Brady, 1986). In his seminal work, Downs (1957) argued that voters reducethe cost of voting by relying on informational shortcuts disseminated bytrusted experts and those with greater knowledge who share the voters’ polit-ical goals. The most prominent political heuristic that citizens use whenmaking decisions is party affiliation (Lau & Redlawsk, 2001). Campbell,Converse, Miller, and Stokes (1960) argued that voters tend to develop apsychological attachment to one of the major parties, and this provides themwith a lens through which to evaluate political events and political actors.Rahn (1993) found that the public stereotypes the parties with “rich cogni-tive categories containing not only policy information but group alliances,trait judgments, specific examples of group members, and performanceassessments” (p. 474). This provides citizens with a shortcut to decisionmaking, therefore reducing the time and effort required to evaluate theirpolitical environment. It also suggests that party cues enable citizens to clar-ify their political choices and vote in a rational, informed manner withoutinvesting a lot of resources to educate themselves (Calvert, 1985; McKelvey& Ordeshook, 1986; for a critique of the accuracy of political cues, seeBartels, 1996; Kuklinski & Hurley, 1994; Lau & Redlawsk, 2001). Through
Goodman, Murray / Voting Behavior 907
distribution.© 2007 SAGE Publications. All rights reserved. Not for commercial use or unauthorized
by Juan Pardo on November 14, 2007 http://apr.sagepub.comDownloaded from
these cues, voters can assess the histories of the behavior of the political parties, which can then be used to anticipate the behavior of each party’scandidates if elected to office. This greatly simplifies the informationaldemands placed on voters, particularly those motivated by issues. Instead ofevaluating each individual candidate, the voter evaluates the two commonbrands of candidates and chooses the brand that is most appealing (Aldrich,1995; Cox & McCubbins, 1993; Snyder & Ting, 2002). Also, there is con-siderable evidence that partisan cues are strong and important to voter deci-sion making (e.g., Lau & Redlawsk, 2001; Rahn, 1993). Furthermore, theaffective attachment party identifiers feel may motivate them to participateas a manifestation of party support in otherwise unattractive political activ-ities (Verba, Nie, & Kim, 1978).
What happens, then, when cues are not available to distinguish betweenthe parties? The literature on nonpartisan elections provides some indicationof the consequences when this information is institutionally deprived. Oneconsequence is that voters depend on other types of cues. For example, innonpartisan elections, voters have been found to take cues from racial or eth-nic identification (Lineberry & Fowler, 1967; Pomper, 1966; Squire & Smith,1988), name recognition or incumbency (Jacobson, 2004; Jewell & Breaux,1988; Lineberry & Fowler, 1967; Schaffner, Streb, & Wright, 2001), andgroup endorsements (Lupia, 1994). Another consequence is that turnout isdepressed (Lineberry & Fowler, 1967; Schaffner et al., 2001). Studies of non-partisan judicial elections suggest that a consequence of the lack of party cuesabout state supreme court candidates is unstructured voting decisions(Dubois, 1979; Squire & Smith, 1988), an increase in the number of voterswho held no opinion on an election (Squire & Smith, 1988), a significant shiftin vote preference (Squire & Smith, 1988), and an increase in idiosyncraticresults (Dubois, 1979). Furthermore, in the absence of party labels instatewide nonjudicial races, survey respondents with less education were lesslikely to express a vote preference, and respondents who did have a vote pref-erence were less capable of structuring their vote choice by partisanship(Schaffner & Streb, 2002).
Why Cues Matter
Although there is ample evidence that partisan cues matter, the discussionabout why they matter remains unsettled. That is, why does the lack of partycues decrease the probability that a person will vote or increase the probabilitythat a person will vote for the incumbent or recognized name? One poten-tially fruitful approach resides in the literature on behavioral economics and,
908 American Politics Research
distribution.© 2007 SAGE Publications. All rights reserved. Not for commercial use or unauthorized
by Juan Pardo on November 14, 2007 http://apr.sagepub.comDownloaded from
more broadly, judgment and decision making. The rational–emotional modelof decision avoidance portrays decision making as a process in which choicesare driven by the calculation of expected probabilities and outcomes, whichin turn are subject to anticipatory emotions that influence affective goals(Anderson, 2003). Among other things, this perspective asserts that satisfac-tory decisions require reasons or justifications. When those reasons or justi-fications are absent, citizens face more uncertainty, and the consequence is aninability to make a decision in anticipation of an increased probability ofpostdecisional regret. Similarly, perceiving only small differences betweenalternatives increases preference uncertainty, and citizens will defer makinga decision (Dhar, 1997). Furthermore, individuals who are presented withsimilarly attractive alternatives tend to desire additional alternatives, andthose who are presented with weak alternatives tend to extend the search forbetter ones (Tversky & Shafir, 1992). In the end, this model asserts that pref-erence uncertainty is an important contributor to selection difficulty. Andselection difficulty, in turn, causes decision avoidance manifested by a pref-erence for the status quo and/or choice deferral or refusal.
Preference for the status quo has been associated with increased emotionalcosts related to regret (Anderson, 2003). Respondents attempt to reduce oravoid the emotional costs of postdecisional regret by choosing the alternativethat represents the status quo (Inman & Zeelenberg, 2002). This alternativeconstitutes the choice with which, often, individuals already have had a tol-erable experience or, if there is no previous experience, with which theyassume they will have a tolerable experience in the future. In vote choice, thismodel implies a bias toward the incumbent candidate or party in the absenceof party cues. That is, the lack of partisan cues reduces the potential reasonsan individual has to vote for a challenger and, therefore, increases the proba-bility and potential cost of postdecisional regret if voting for the challenger.This leads an individual to attempt to reduce the probability of postdecisionalregret by voting for the candidate with which she or he has probably had atolerable experience, the incumbent. Of course, this implication is consistentwith voters’ tendencies in nonpartisan elections to turn to cues from namerecognition or incumbency to make their vote choices (Jacobson, 2004;Jewell & Breaux, 1988; Lineberry & Fowler, 1967; Schaffner et al., 2001).
On the other hand, choice deferral has been associated with increasedemotional costs related to the difficulty of justifying a decision under con-flict (Tversky & Shafir, 1992), the desire to avoid negative emotions gener-ated by making trade-offs between alternatives (Luce, 1998), and the effortrequired to overcome the uncertainty caused by choosing between similaralternatives (Dhar, 1997). This reasoning comports well with the calculus of
Goodman, Murray / Voting Behavior 909
distribution.© 2007 SAGE Publications. All rights reserved. Not for commercial use or unauthorized
by Juan Pardo on November 14, 2007 http://apr.sagepub.comDownloaded from
voting. Very simply, the model of decision avoidance implies that the lack ofperceived differences between the major parties (i.e., justifications for a votechoice) increases selection difficulty and, therefore, the emotional costs ofvoting, which by the logic of the calculus of voting decreases the probabil-ity that an individual will vote.
Heuristics and behavioral economic theories, then, may provide impor-tant leverage on our understanding of voting behavior. Using this approach,we expect that incumbent-party candidates enjoy an advantage among vot-ers who do not perceive significant differences between the parties becausethose voters fall back on other cues such as name recognition or tolerableexperience with the status quo. We also expect that voters who do not per-ceive differences are more likely to defer or even avoid (i.e., abstain) the votedecision as the uncertainty increases selection difficulty and, therefore, theemotional costs of voting.
Data and Methods
To evaluate our research questions, we rely on data from ANES for theyears 1984 to 2004.1 Following the rational–emotional model of decisionavoidance, we focus on uncertainty in the decision-making process, which wecapture by measuring the differences respondents perceive between the majorparties.2 Our measures of perceived differences fall into two categories: oper-ational and symbolic.3 Operational differences between the parties includespecific characteristics they exhibit that distinguish one from the other, suchas competing positions on important issues. Symbolic differences capture theabstract feelings individuals have toward the parties and system of partisan-ship. This conception of differences encompasses Rahn’s (1993) stereotypesthat involve information pertaining to policy positions as well as judgmentsabout considerations such as party traits and performance. In some sense,these two conceptions can be thought of as indications of uncertainty causedby a lack of factual knowledge of party differences (operational) and by atti-tudes about the lack of party differences (symbolic).
Our measure of perceived symbolic differences is the question “Do youthink there are any important differences in what the Republicans andDemocrats stand for?”4 A respondent who indicates that there are no impor-tant differences is coded 0, whereas an individual who indicates that thereare important differences is coded 1. Our measure of perceived operationaldifferences is an additive index of the differences between the placement ofthe major parties relative to each other on scales concerning government
910 American Politics Research
distribution.© 2007 SAGE Publications. All rights reserved. Not for commercial use or unauthorized
by Juan Pardo on November 14, 2007 http://apr.sagepub.comDownloaded from
spending, defense spending, and party ideology.5 For example, the govern-ment spending question is
Some people think the government should provide fewer services, even in areassuch as health and education, in order to reduce spending. Other people feelthat it is important for the government to provide many more services even ifit means an increase in spending. Where would you place the Democratic[Republican] Party on this scale?
The index of operational differences ranges from scores of 0 to 3 (mean =2.3, standard deviation = 1.0). Respondents who place the parties at differentpoints of the scale are coded 1, whereas those who place the parties at thesame point are coded 0.6 We then sum the three items to create an additiveindex ranging from 0 to 3, with higher numbers indicating that the respondentperceives more operational differences between the parties.
Although we might expect that citizens will have consistent views (i.e.,perceptions of symbolic and operational differences or vice versa), theextant work in public opinion (Zaller, 1992) suggests this might be an unrea-sonable expectation. To capture this differentiated effect, we also createthree indicator variables that are structured for comparison to respondentswho perceive both operational and symbolic differences. The first indicatorvariable represents respondents who see neither operational nor symbolicdifferences, the second represents respondents who see symbolic but notoperational differences, and the third represents the reverse—respondentswho see operational but not symbolic differences. In each case, the indica-tor variable is coded 1 for the specified type of respondent and 0 otherwise.To create this structure and for ease of interpretation and consistency withthe symbolic differences variable, we restructure the operational differencesvariable for these measures into the dichotomous form. Respondents whohave a score of 2 or 3 on the operational differences index are coded 1, and 0otherwise.
We begin with the distributions of our primary independent variables.From a sample of 5,157 respondents, 25% perceived no symbolic differencesbetween the major parties, whereas 7% perceived zero operational differ-ences, and another 17% perceived only one operational difference. In termsof the differentiated variables, those perceiving both types of differencescomprise 61% of the sample, and those perceiving neither comprise 9%. Onthe other hand, those discerning operational but not symbolic differences con-stitute 16% of respondents, and those discerning symbolic but not operationaldifferences constitute 14%.
Goodman, Murray / Voting Behavior 911
distribution.© 2007 SAGE Publications. All rights reserved. Not for commercial use or unauthorized
by Juan Pardo on November 14, 2007 http://apr.sagepub.comDownloaded from
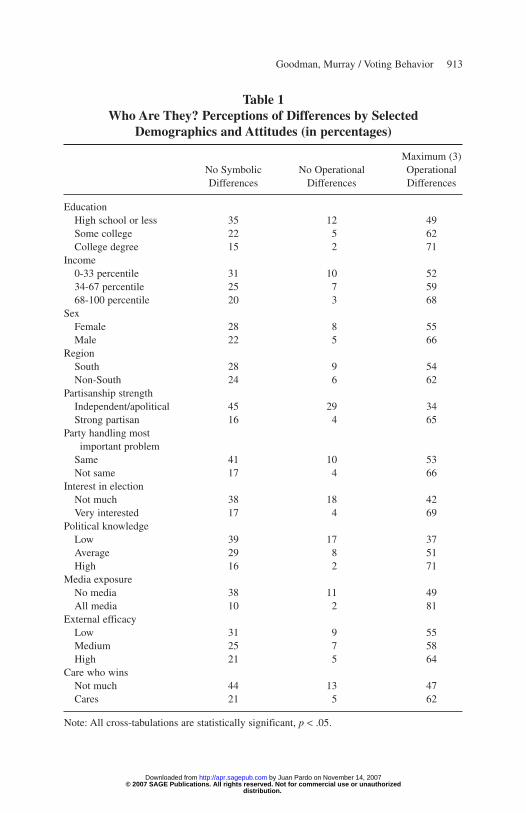
So, who are the people who see no differences? Table 1 indicates that theytend to have substantively and statistically less education, income, interest inthe elections, political knowledge, media exposure, and external efficacy. Forexample, 35% of respondents with only a high school education see no sym-bolic differences, whereas only 15% of those with a college degree perceivedno symbolic differences. Similarly, 12% of those with only a high school edu-cation see no operational differences, whereas only 2% of those with a col-lege degree see none. Conversely, about half of those with only a high schooleducation perceive the maximum number of operational differences, whereas7 out of 10 of those with a college degree perceive them as well. In terms ofother characteristics, women, those who live in the South, and those who iden-tify as independents or apolitical are less likely to see differences. Furthermore,those who believe that both parties will handle the most important problemthe same and those who care less about who wins the election are less likelyto perceive differences. On the other hand, there appear to be no substantivedifferences by age, race or ethnicity, or trust in the government.
An initial look at the primary relationships of interest indicates that theperception of differences between the parties plays a nontrivial role in vot-ing behaviors. Bivariate analyses suggest that respondents who perceivedno operational differences were three times more likely to abstain thanthose who perceived the maximum differences (49% vs. 15%, χ2 = 177.21,p < .001), whereas those who perceived no symbolic differences were more than twice as likely to abstain as their counterparts (37% vs. 16%,χ2 = 167.94, p < .001). Similarly, though less dramatically, those who per-ceived no operational differences were more likely to vote for the incum-bent candidate or party than those who perceived the maximum differences(58% vs. 51%, χ2 = 8.84, p = .03) as were those who perceived no symbolicdifferences (53% vs. 50%, χ2 = 3.79, p = .05).
Given these meaningful bivariate relationships, next we model voters’support for the incumbent presidential candidate or party and vote choicedeferral or avoidance to examine more fully the effects of not perceivingdifferences between the parties.
Voting for the Incumbent
We turn first to the decision of voters to support the incumbent presidentand follow a model that is similar to the one employed by Nadeau andLewis-Beck (2001). Scholars have been analyzing the factors that contributeto the likelihood of an incumbent presidential candidate’s winning reelectionsince the ANES started collecting survey data on public attitudes. We expect
912 American Politics Research
distribution.© 2007 SAGE Publications. All rights reserved. Not for commercial use or unauthorized
by Juan Pardo on November 14, 2007 http://apr.sagepub.comDownloaded from
Goodman, Murray / Voting Behavior 913
Table 1Who Are They? Perceptions of Differences by Selected
Demographics and Attitudes (in percentages)
Maximum (3) No Symbolic No Operational Operational Differences Differences Differences
EducationHigh school or less 35 12 49Some college 22 5 62College degree 15 2 71
Income0-33 percentile 31 10 5234-67 percentile 25 7 5968-100 percentile 20 3 68
SexFemale 28 8 55Male 22 5 66
RegionSouth 28 9 54Non-South 24 6 62
Partisanship strengthIndependent/apolitical 45 29 34Strong partisan 16 4 65
Party handling most important problem
Same 41 10 53Not same 17 4 66
Interest in electionNot much 38 18 42Very interested 17 4 69
Political knowledgeLow 39 17 37Average 29 8 51High 16 2 71
Media exposureNo media 38 11 49All media 10 2 81
External efficacyLow 31 9 55Medium 25 7 58High 21 5 64
Care who winsNot much 44 13 47Cares 21 5 62
Note: All cross-tabulations are statistically significant, p < .05.
distribution.© 2007 SAGE Publications. All rights reserved. Not for commercial use or unauthorized
by Juan Pardo on November 14, 2007 http://apr.sagepub.comDownloaded from
that incumbent-party candidates enjoy an advantage among voters who donot perceive significant differences between the parties because those votersfall back on other incumbent-advantaging cues such as name recognition ortolerable experience with the status quo to make their vote choice. Followingthis, our first hypothesis is
Hypothesis 1: When respondents perceive no difference between the major parties,they will be more likely to vote for the incumbent candidate or party in the caseof an open-seat presidential election.
There is often a close correspondence between economic performance andthe fortunes of the incumbent party (Abramson, Aldrich, & Rohde, 2003).Although debate continues about which economic evaluations are salient, thebottom line is quite simple: If voters believe that the economy is performingwell, they can use this informational shortcut (Downs, 1957; Popkin, 1994)to simplify their decision-making process. Although there is evidence of astrong retrospective component to the voting decision (Fiorina, 1981), there isalso evidence that voters engage in prospective voting (MacKuen, Erikson, &Stimson, 1992). Nadeau and Lewis-Beck (2001) incorporate the retrospectiveand prospective economic dynamics of the vote decision in their model. Theyargue that when economic evaluations are above average, the incumbentparty benefits. We seek to build on these analyses by incorporating informa-tion on the extent to which citizens differentiate between the Democrats andthe Republicans.
Our dependent variable in Model 1 is the respondent’s self-reportedpresidential vote; respondents who voted for the incumbent or incumbentparty are coded 1, and 0 otherwise. The independent variables include individual-level measures of evaluations of retrospective and prospectiveeconomic performance (better coded 1, same coded 0, and worse coded –1),a dummy variable indicating the presence of a sitting incumbent in the racethat is interacted with each of the two economic evaluations, and a dummyvariable indicating the incumbent party (Democrat coded 1, Republicancoded –1) with interactions with a dummy variable for race (non-Whitecoded 1, White coded 0) and party identification (7-point scale with strongDemocrat coded 3 and strong Republican coded –3). Following Nadeau andLewis-Beck (2001), we expect retrospective and prospective evaluations ofthe economy to be associated positively with voting for the incumbent orincumbent party, incumbent party to be negatively associated; the incumbent-party interactions with party identification and race to be positively associated;and the no-incumbent interaction with retrospective economic evaluation
914 American Politics Research
distribution.© 2007 SAGE Publications. All rights reserved. Not for commercial use or unauthorized
by Juan Pardo on November 14, 2007 http://apr.sagepub.comDownloaded from
to be positively associated and the interaction with prospective economicevaluation to be negatively associated.
It is important to note that we present two specifications each for ourdependent variables of incumbent vote and vote choice deferral: a main-effects model and a differentiated-effects model. The main-effects modelsspecify the dichotomous measure of perceived symbolic differences and theordinal measure of operational differences. The differentiated-effects modelsspecify, in place of the main-effects variables, indicator variables for thosewho see neither symbolic nor operational differences, those who see sym-bolic but not operational differences, and those who see operational but notsymbolic differences. The pertinent comparison group in the differentiated-effects models is composed of those respondents who see both symbolic andoperational differences.
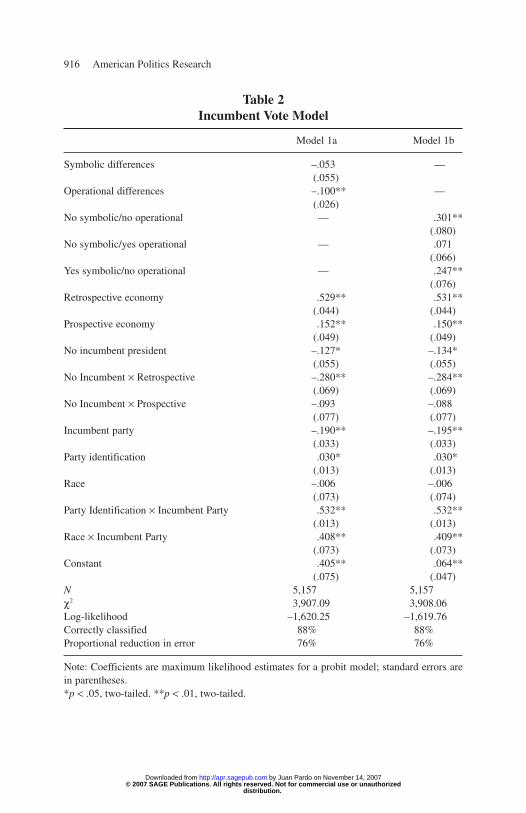
In Table 2, we present our empirical results (probit estimates) for the incum-bent presidential vote. The only noteworthy inconsistency between our find-ings and those of Nadeau and Lewis-Beck (2001) is the interaction betweenthe measure of no incumbent running and future economic assessment, whichis not statistically significant in our results. Although we feel this finding is inconsequential to this research, we believe one explanation may be thechanging role of economic assessment between the different time frames(1984-2004 compared to Nadeau and Lewis-Beck’s [2001] 1956-1996). Giventhis confirmation of the basic relationships, the results reported in Table 2 tellan important story. Model 1a, the main-effects model, suggests that the lack of perceived operational differences plays a significant role in people’s deci-sion to vote for the incumbent. More specifically, although the symbolic dif-ferences measure is not significant, the negative sign on the operationaldifferences variable indicates that a change from perceiving no operational differences to perceiving the maximum operational differences decreases theprobability of voting for the incumbent candidate or party from 0.71 to 0.60.7
We note that the marginal effect is statistically significant at p < .001.In Model 1b, the differentiated-effects model, the positive sign on the
variable indicating the perception of symbolic differences but not opera-tional differences implies that these respondents are 9 percentage points(0.60 to 0.69) more likely to vote for the incumbent than the comparisongroup composed of those who perceive both types of differences. In thesame model, the positive sign on the measure indicating respondents whosee neither symbolic nor operational differences suggests that those respon-dents are 11 percentage points (0.60 to 0.71) more likely to vote for theincumbent than those in the comparison group. We note that the marginaleffects are statistically significant at p ≤ .001. In all, these results support
Goodman, Murray / Voting Behavior 915
distribution.© 2007 SAGE Publications. All rights reserved. Not for commercial use or unauthorized
by Juan Pardo on November 14, 2007 http://apr.sagepub.comDownloaded from
916 American Politics Research
Table 2Incumbent Vote Model
Model 1a Model 1b
Symbolic differences –.053 —(.055)
Operational differences –.100** —(.026)
No symbolic/no operational — .301**(.080)
No symbolic/yes operational — .071(.066)
Yes symbolic/no operational — .247**(.076)
Retrospective economy .529** .531**(.044) (.044)
Prospective economy .152** .150**(.049) (.049)
No incumbent president –.127* –.134*(.055) (.055)
No Incumbent × Retrospective –.280** –.284**(.069) (.069)
No Incumbent × Prospective –.093 –.088(.077) (.077)
Incumbent party –.190** –.195**(.033) (.033)
Party identification .030* .030*(.013) (.013)
Race –.006 –.006(.073) (.074)
Party Identification × Incumbent Party .532** .532**(.013) (.013)
Race × Incumbent Party .408** .409**(.073) (.073)
Constant .405** .064**(.075) (.047)
N 5,157 5,157χ2 3,907.09 3,908.06Log-likelihood –1,620.25 –1,619.76Correctly classified 88% 88%Proportional reduction in error 76% 76%
Note: Coefficients are maximum likelihood estimates for a probit model; standard errors arein parentheses.*p < .05, two-tailed. **p < .01, two-tailed.
distribution.© 2007 SAGE Publications. All rights reserved. Not for commercial use or unauthorized
by Juan Pardo on November 14, 2007 http://apr.sagepub.comDownloaded from
Hypothesis 1 and suggest that the lack of perceived differences between theparties plays a significant role in respondents’ vote choice by increasing theprobability that they will vote for the incumbent candidate or party.8
Choosing to Participate (or Not)
Next, we suggest that the absence of perceived differences between themajor parties has implications for the length of time for which a voter deferscandidate choice or, more broadly, the voter’s determination to avoid the deci-sion by permanently deferring (i.e., abstaining). We believe that voters who donot perceive differences are more likely to defer the vote decision or to avoidthe decision by abstaining as the uncertainty increases selection difficulty and,therefore, the emotional costs of voting. As such, our second hypothesis is
Hypothesis 2: When respondents perceive no difference between the major parties,they will be more likely to defer their vote choice decisions until closer to elec-tion day or to avoid choosing altogether by abstaining.
Given that avoiding or permanently deferring the vote choice is a decisionnot to turn out, we believe that a model of turnout is an appropriate mecha-nism through which to examine vote choice deferral or avoidance. Previousresearch finds that a combination of individual- and macro-level factors influ-ences turnout. The most prominent individual-level characteristic is partisan-ship, as those with stronger party identification are more likely to vote(Campbell et al., 1960). In addition to partisanship, political knowledge andinterest as well as demographic variables such as age, education, wealth, andpolitical efficacy are positively associated with the likelihood of voting (e.g.,Rosenstone & Hansen, 1993; Verba & Nie, 1972; Wolfinger & Rosenstone,1980). The political context also affects the decision to vote. Party contactand personal canvassing (Gerber & Green, 2000; Hillygus, 2005; Rosenstone& Hansen, 1993), contact by political elites (Rosenstone & Hansen, 1993;Verba, Schlozman, & Brady, 1995), and close races (Jacobson, 2004;Rosenstone & Hansen, 1993) are associated with increased levels of voterturnout. Although Alvarez (1998) argued that voters who are uncertain areless supportive of presidential candidates and Abramson et al. (2003) foundthat voters who are neutral between the parties are equally likely to supportthe incumbent or the opposition party, voters who are unsure about the par-ties typically are not addressed in these analyses. We seek to extend theseanalyses by incorporating information on the extent to which citizens per-ceive differences between the two major parties.
Goodman, Murray / Voting Behavior 917
distribution.© 2007 SAGE Publications. All rights reserved. Not for commercial use or unauthorized
by Juan Pardo on November 14, 2007 http://apr.sagepub.comDownloaded from
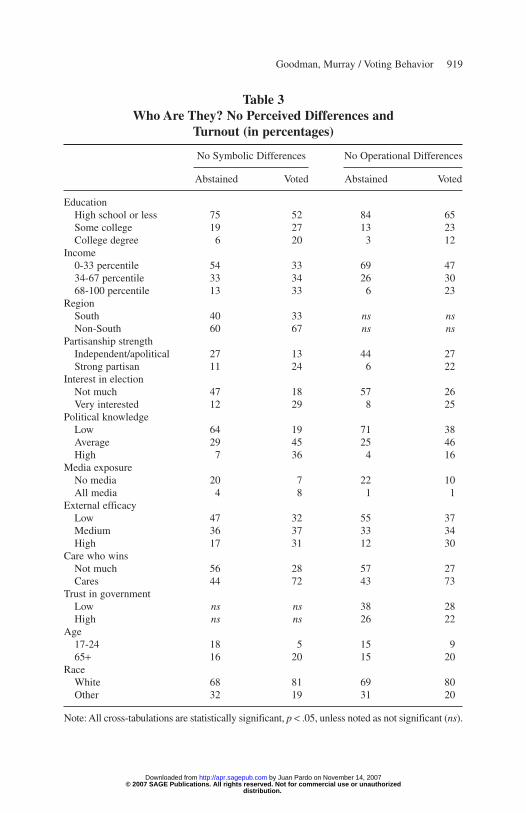
We turn first to a number of bivariate results to gain some intuition aboutthe characteristics of respondents who do not perceive differences betweenthe major parties and their self-reported turnout to vote. That is, how do thosewho do not see differences and do not vote differ from those who do not seedifferences but do vote? Table 3 indicates that those who failed to perceivedifferences and abstained tended to have less education, income, interest inthe election, political knowledge, media exposure, external efficacy, andinterest in who wins. For example, 75% of those who saw no symbolic dif-ferences and abstained held a high school degree or less compared to 52% ofthose who saw no symbolic differences but voted. Similarly, 69% of thosewho saw no operational differences and abstained were in the lowest incomepercentile versus 47% of those who saw no operational differences but voted.There is also evidence that these respondents tended to be younger, indepen-dent or apolitical, and non-White; there was also an indication that theytended to have less trust in government and to reside in the South. On theother hand, there appear to be no substantive differences by sex or belief inwhich party will handle the most important problem. Broadly speaking, theseresults suggest that voters and nonvoters who do not perceive differencesbetween the major parties are similar to voters and nonvoters in general (e.g.,Rosenstone & Hansen, 1993; Verba & Nie, 1972; Wolfinger & Rosenstone,1980), which highlights the independent effect of failing to perceive differ-ences on voting behavior.
The model we use to test the vote choice deferral and avoidance hypoth-esis is similar to Rosenstone and Hansen’s (1993) turnout model. Our depen-dent variable captures the time period when respondents decided who theywould support in the election. That is, respondents who knew for whom theywere going to vote all along (i.e., deferred least) are coded 1, and respon-dents who abstained (i.e., avoided the choice and permanently deferred) arecoded 7. The intervening decision points are when the candidate announced(coded 2), during the convention (coded 3), during the postconventionperiod (coded 4), during the last 2 weeks (coded 5), and on election day(coded 6). The independent variables include measures of income, educa-tion, age, race or ethnicity, homeownership, church attendance, years in thecommunity (logged), residence in the South, work status, internal and exter-nal political efficacy, strength of party identification, party and presidentialaffect, contact from a party, perceptions of closeness of the election, and theactual closeness of the election. Because the perception of no differencesbetween the major parties may be a proxy for a lack of political knowledgeor political interest, we also include controls for these constructs. FollowingRosenstone and Hansen, we expect residence in the South, the squared-age
918 American Politics Research
distribution.© 2007 SAGE Publications. All rights reserved. Not for commercial use or unauthorized
by Juan Pardo on November 14, 2007 http://apr.sagepub.comDownloaded from
Goodman, Murray / Voting Behavior 919
Table 3Who Are They? No Perceived Differences and
Turnout (in percentages)
No Symbolic Differences No Operational Differences
Abstained Voted Abstained Voted
EducationHigh school or less 75 52 84 65Some college 19 27 13 23College degree 6 20 3 12
Income0-33 percentile 54 33 69 4734-67 percentile 33 34 26 3068-100 percentile 13 33 6 23
RegionSouth 40 33 ns nsNon-South 60 67 ns ns
Partisanship strengthIndependent/apolitical 27 13 44 27Strong partisan 11 24 6 22
Interest in electionNot much 47 18 57 26Very interested 12 29 8 25
Political knowledgeLow 64 19 71 38Average 29 45 25 46High 7 36 4 16
Media exposureNo media 20 7 22 10All media 4 8 1 1
External efficacyLow 47 32 55 37Medium 36 37 33 34High 17 31 12 30
Care who winsNot much 56 28 57 27Cares 44 72 43 73
Trust in governmentLow ns ns 38 28High ns ns 26 22
Age17-24 18 5 15 965+ 16 20 15 20
RaceWhite 68 81 69 80Other 32 19 31 20
Note: All cross-tabulations are statistically significant, p < .05, unless noted as not significant (ns).
distribution.© 2007 SAGE Publications. All rights reserved. Not for commercial use or unauthorized
by Juan Pardo on November 14, 2007 http://apr.sagepub.comDownloaded from
term, and non-White race or ethnicity to be positively associated with defer-ral or avoidance, whereas we expect the remaining independent variables tobe negatively associated.
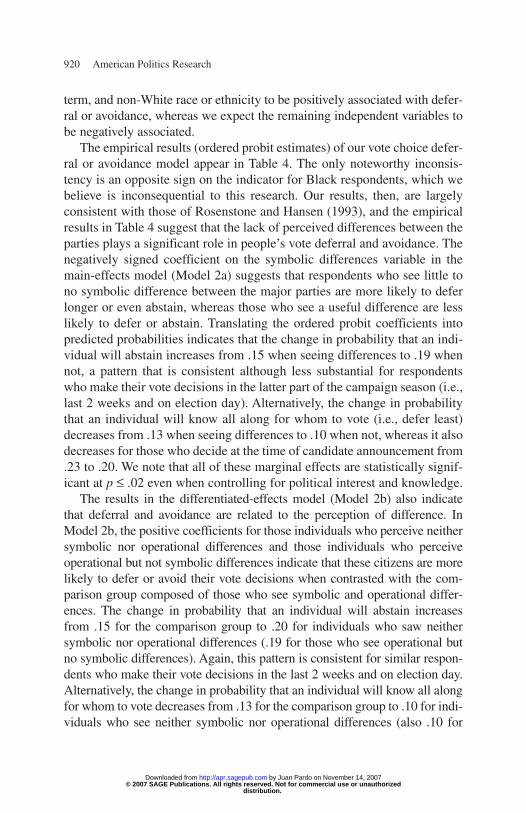
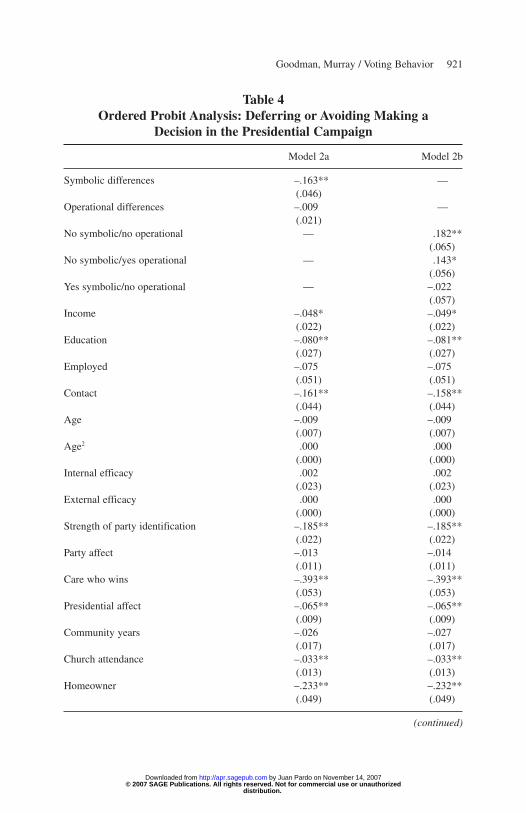
The empirical results (ordered probit estimates) of our vote choice defer-ral or avoidance model appear in Table 4. The only noteworthy inconsis-tency is an opposite sign on the indicator for Black respondents, which webelieve is inconsequential to this research. Our results, then, are largelyconsistent with those of Rosenstone and Hansen (1993), and the empiricalresults in Table 4 suggest that the lack of perceived differences between theparties plays a significant role in people’s vote deferral and avoidance. Thenegatively signed coefficient on the symbolic differences variable in themain-effects model (Model 2a) suggests that respondents who see little tono symbolic difference between the major parties are more likely to deferlonger or even abstain, whereas those who see a useful difference are lesslikely to defer or abstain. Translating the ordered probit coefficients intopredicted probabilities indicates that the change in probability that an indi-vidual will abstain increases from .15 when seeing differences to .19 whennot, a pattern that is consistent although less substantial for respondentswho make their vote decisions in the latter part of the campaign season (i.e.,last 2 weeks and on election day). Alternatively, the change in probabilitythat an individual will know all along for whom to vote (i.e., defer least)decreases from .13 when seeing differences to .10 when not, whereas it alsodecreases for those who decide at the time of candidate announcement from.23 to .20. We note that all of these marginal effects are statistically signif-icant at p ≤ .02 even when controlling for political interest and knowledge.
The results in the differentiated-effects model (Model 2b) also indicatethat deferral and avoidance are related to the perception of difference. InModel 2b, the positive coefficients for those individuals who perceive neithersymbolic nor operational differences and those individuals who perceiveoperational but not symbolic differences indicate that these citizens are morelikely to defer or avoid their vote decisions when contrasted with the com-parison group composed of those who see symbolic and operational differ-ences. The change in probability that an individual will abstain increasesfrom .15 for the comparison group to .20 for individuals who saw neithersymbolic nor operational differences (.19 for those who see operational butno symbolic differences). Again, this pattern is consistent for similar respon-dents who make their vote decisions in the last 2 weeks and on election day.Alternatively, the change in probability that an individual will know all alongfor whom to vote decreases from .13 for the comparison group to .10 for indi-viduals who see neither symbolic nor operational differences (also .10 for
920 American Politics Research
distribution.© 2007 SAGE Publications. All rights reserved. Not for commercial use or unauthorized
by Juan Pardo on November 14, 2007 http://apr.sagepub.comDownloaded from
Goodman, Murray / Voting Behavior 921
Table 4Ordered Probit Analysis: Deferring or Avoiding Making a
Decision in the Presidential Campaign
Model 2a Model 2b
Symbolic differences –.163** —(.046)
Operational differences –.009 —(.021)
No symbolic/no operational — .182**(.065)
No symbolic/yes operational — .143*(.056)
Yes symbolic/no operational — –.022(.057)
Income –.048* –.049*(.022) (.022)
Education –.080** –.081**(.027) (.027)
Employed –.075 –.075(.051) (.051)
Contact –.161** –.158**(.044) (.044)
Age –.009 –.009(.007) (.007)
Age2 .000 .000(.000) (.000)
Internal efficacy .002 .002(.023) (.023)
External efficacy .000 .000(.000) (.000)
Strength of party identification –.185** –.185**(.022) (.022)
Party affect –.013 –.014(.011) (.011)
Care who wins –.393** –.393**(.053) (.053)
Presidential affect –.065** –.065**(.009) (.009)
Community years –.026 –.027(.017) (.017)
Church attendance –.033** –.033**(.013) (.013)
Homeowner –.233** –.232**(.049) (.049)
(continued)
distribution.© 2007 SAGE Publications. All rights reserved. Not for commercial use or unauthorized
by Juan Pardo on November 14, 2007 http://apr.sagepub.comDownloaded from
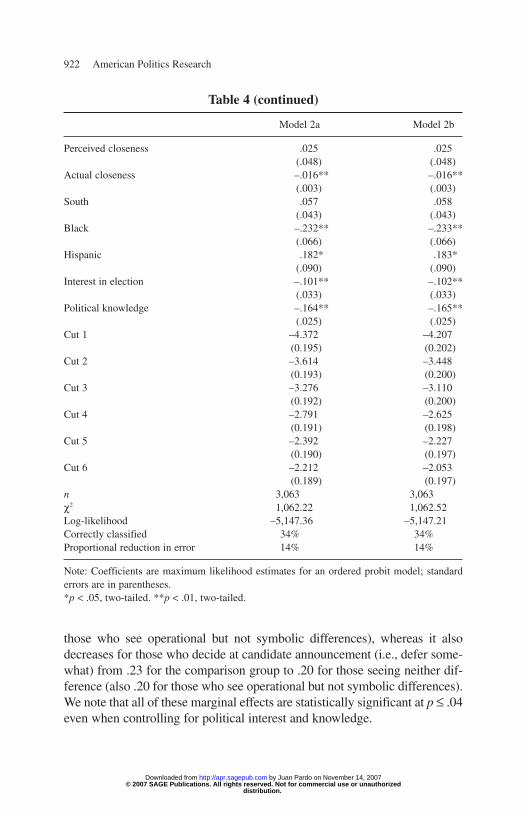
those who see operational but not symbolic differences), whereas it alsodecreases for those who decide at candidate announcement (i.e., defer some-what) from .23 for the comparison group to .20 for those seeing neither dif-ference (also .20 for those who see operational but not symbolic differences).We note that all of these marginal effects are statistically significant at p ≤ .04even when controlling for political interest and knowledge.
922 American Politics Research
Table 4 (continued)
Model 2a Model 2b
Perceived closeness .025 .025(.048) (.048)
Actual closeness –.016** –.016**(.003) (.003)
South .057 .058(.043) (.043)
Black –.232** –.233**(.066) (.066)
Hispanic .182* .183*(.090) (.090)
Interest in election –.101** –.102**(.033) (.033)
Political knowledge –.164** –.165**(.025) (.025)
Cut 1 –4.372 –4.207(0.195) (0.202)
Cut 2 –3.614 –3.448(0.193) (0.200)
Cut 3 –3.276 –3.110(0.192) (0.200)
Cut 4 –2.791 –2.625(0.191) (0.198)
Cut 5 –2.392 –2.227(0.190) (0.197)
Cut 6 –2.212 –2.053(0.189) (0.197)
n 3,063 3,063χ2 1,062.22 1,062.52Log-likelihood –5,147.36 –5,147.21Correctly classified 34% 34%Proportional reduction in error 14% 14%
Note: Coefficients are maximum likelihood estimates for an ordered probit model; standarderrors are in parentheses.*p < .05, two-tailed. **p < .01, two-tailed.
distribution.© 2007 SAGE Publications. All rights reserved. Not for commercial use or unauthorized
by Juan Pardo on November 14, 2007 http://apr.sagepub.comDownloaded from
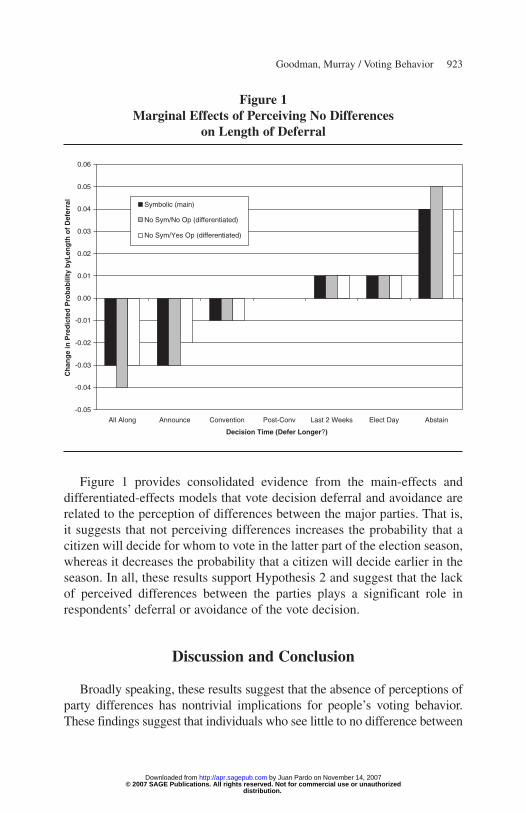
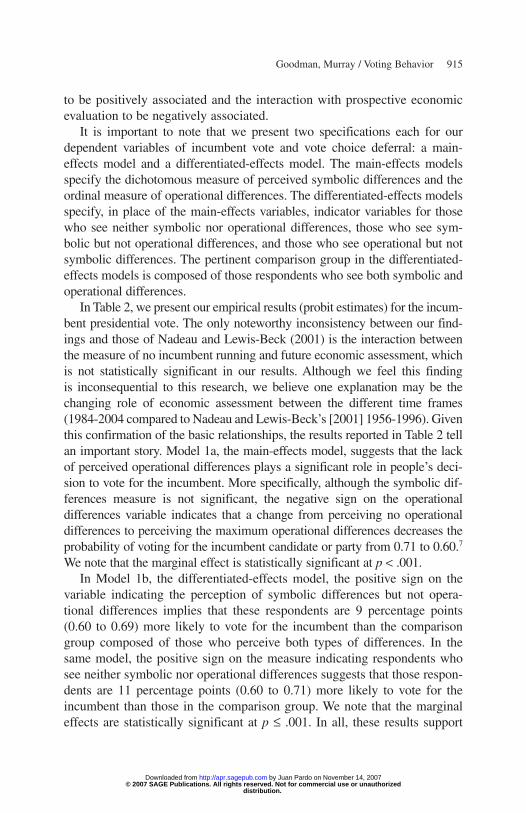
Figure 1 provides consolidated evidence from the main-effects and differentiated-effects models that vote decision deferral and avoidance arerelated to the perception of differences between the major parties. That is,it suggests that not perceiving differences increases the probability that acitizen will decide for whom to vote in the latter part of the election season,whereas it decreases the probability that a citizen will decide earlier in theseason. In all, these results support Hypothesis 2 and suggest that the lackof perceived differences between the parties plays a significant role inrespondents’ deferral or avoidance of the vote decision.
Discussion and Conclusion
Broadly speaking, these results suggest that the absence of perceptions ofparty differences has nontrivial implications for people’s voting behavior.These findings suggest that individuals who see little to no difference between
Goodman, Murray / Voting Behavior 923
-0.05
-0.04
-0.03
-0.02
-0.01
0.00
0.01
0.02
0.03
0.04
0.05
0.06
All Along Announce Convention Post-Conv Last 2 Weeks Elect Day Abstain
Decision Time (Defer Longer?)
Ch
ang
e in
Pre
dic
ted
Pro
bab
ility
byL
eng
th o
f D
efer
ral
Symbolic (main)
No Sym/No Op (differentiated)
No Sym/Yes Op (differentiated)
Figure 1Marginal Effects of Perceiving No Differences
on Length of Deferral
distribution.© 2007 SAGE Publications. All rights reserved. Not for commercial use or unauthorized
by Juan Pardo on November 14, 2007 http://apr.sagepub.comDownloaded from
the major parities are more likely to vote for the incumbent candidate or partyand are more likely to defer their vote decision or even to avoid it altogetherby abstaining. More specifically, the differentiated-effects models indicatethat the impact of discerning neither symbolic nor operational differences isrobust. Those who discern neither difference are more likely to vote forincumbents and are more likely to defer their vote decisions than those who discern both symbolic and operational differences. Furthermore, the differentiated-effects models suggest that differentiating respondents, thosewho perceive one type of difference but not the other, are more likely to votefor the incumbent candidate or party (Model 1b) and are more likely to defer(Model 2b) than those who perceive both types of differences. The lack ofperceived differences, as well, plays a specific and meaningful role in the main-effects models. Model 1a suggests that operational differences matter forpeople’s decision to vote for the incumbent or not, whereas Model 2a suggeststhat it is symbolic differences that are important for the decision to defer or not.
Our empirical results suggest that different factors (i.e., perceived sym-bolic and operational differences) matter to respondents when choosing toparticipate. We believe that the decision to vote may be subject to symbolicdifferences that reflect a gut feeling about politics and the system of parti-sanship. However, once voters have made the choice to participate, the per-ceived differences between the parties—the operational differences—exert a greater effect and serve as one justification for the vote choice.
The fields of behavioral economics and judgment and decision makingseem to provide a useful theoretical framework for why partisan cues matterand, more specifically, why the lack of partisan cues increases the probabil-ity that individuals will vote for the incumbent or defer or avoid their votedecisions. The results presented here support the proposed explanation ofwhy this may be the case. That is, the rational–emotional model of decisionavoidance asserts that satisfactory decisions require justifications. Whenthose justifications are absent, individuals face more preference uncertaintyand, therefore, more important, an increased probability of postdecisionalregret. People attempt to reduce the probability of this regret by deferring thedecision or avoiding it altogether. The model of decision avoidance implies,then, that the lack of perceived differences between the major partiesincreases selection difficulty and, therefore, the emotional costs of voting thatby the logic of the calculus of voting decreases the probability that an indi-vidual will vote. Similarly, individuals may be able to reduce the probabilityof postdecisional regret by choosing the alternative with which they alreadyhave had a tolerable experience or, if there is no previous experience, withwhich they assume they will have a tolerable experience. In vote choice, this
924 American Politics Research
distribution.© 2007 SAGE Publications. All rights reserved. Not for commercial use or unauthorized
by Juan Pardo on November 14, 2007 http://apr.sagepub.comDownloaded from
model implies a bias toward the incumbent candidate or party in the absenceof party cues. That is, the lack of partisan cues reduces the potential justifi-cations an individual has to vote for a challenger and, therefore, increases theprobability and potential cost of postdecisional regret if voting for the chal-lenger. This leads the voter to attempt to reduce the probability of postdeci-sional regret by voting for the candidate with which she or he has probablyhad a tolerable experience, the incumbent. Broadly speaking, then, the lackof partisan cues increases selection difficulty, which increases the cost of bothvoting in general (leading to decision deferral and avoidance) and voting fora challenger (leading to increased support for the incumbent).
Our results raise a number of interesting questions to be addressed infuture research. Primarily, who are these people who do not perceive differ-ences between the major parties? The bivariate relationships reported inTable 1 suggest that they tend to have lower socioeconomic status, interestin the elections, political knowledge, media exposure, and external efficacy,but the substantive import of the results reported here call for a more thor-ough analysis of who they are. For example, what is the nature of the miss-ing information? Do these individuals fail to demand differentiating politicalinformation, or are they overwhelmed by and/or unable to process effec-tively the supply of complicated information swirling about the politicalenvironment? To further understand these individuals, what differentiatesthem in terms of their political behavior? For instance, why do some of themturn out on election day whereas others do not? Why do some of them vote forthe incumbent and others do not? Are these people more likely to vote forminor party or independent candidates? Are they more likely to participateby other means such as through interest groups? These and many more ques-tions become viable given the significance of the attitudes reported here.
In all, the results suggest that a lack of perceived differences between themajor parties plays a theoretically, substantively, and statistically significantrole in people’s voting behavior. Compared to citizens who perceive differ-ences between the major parties, citizens who discern little to no difference aremore likely to defer their vote decisions or even abstain and are more likely tovote for the incumbent candidate or party. Although the scholarship on non-partisan elections speaks to the importance of party cues from an institutionalperspective, our findings speak to their importance from an attitudinal per-spective. Importantly, the two perspectives yield similar results. Our findingsand those of scholars of nonpartisan elections suggest that the absence of par-tisan information affects voting behavior. Whether partisan information is lim-ited by institutional barriers or by the perceptions of citizens, the lack ofpartisan information seems to affect voter choices meaningfully.
Goodman, Murray / Voting Behavior 925
distribution.© 2007 SAGE Publications. All rights reserved. Not for commercial use or unauthorized
by Juan Pardo on November 14, 2007 http://apr.sagepub.comDownloaded from
AppendixDescription of Variables
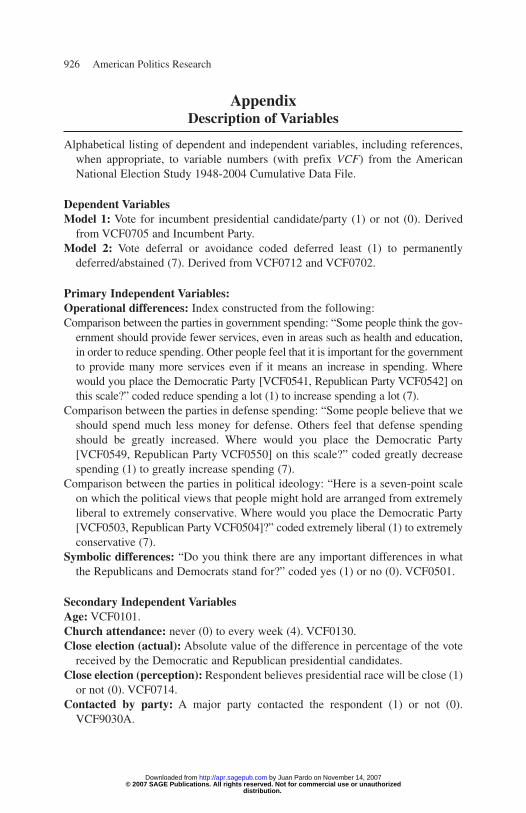
Alphabetical listing of dependent and independent variables, including references,when appropriate, to variable numbers (with prefix VCF) from the AmericanNational Election Study 1948-2004 Cumulative Data File.
Dependent VariablesModel 1: Vote for incumbent presidential candidate/party (1) or not (0). Derived
from VCF0705 and Incumbent Party.Model 2: Vote deferral or avoidance coded deferred least (1) to permanently
deferred/abstained (7). Derived from VCF0712 and VCF0702.
Primary Independent Variables:Operational differences: Index constructed from the following:Comparison between the parties in government spending: “Some people think the gov-
ernment should provide fewer services, even in areas such as health and education,in order to reduce spending. Other people feel that it is important for the governmentto provide many more services even if it means an increase in spending. Wherewould you place the Democratic Party [VCF0541, Republican Party VCF0542] onthis scale?” coded reduce spending a lot (1) to increase spending a lot (7).
Comparison between the parties in defense spending: “Some people believe that weshould spend much less money for defense. Others feel that defense spendingshould be greatly increased. Where would you place the Democratic Party[VCF0549, Republican Party VCF0550] on this scale?” coded greatly decreasespending (1) to greatly increase spending (7).
Comparison between the parties in political ideology: “Here is a seven-point scaleon which the political views that people might hold are arranged from extremelyliberal to extremely conservative. Where would you place the Democratic Party[VCF0503, Republican Party VCF0504]?” coded extremely liberal (1) to extremelyconservative (7).
Symbolic differences: “Do you think there are any important differences in whatthe Republicans and Democrats stand for?” coded yes (1) or no (0). VCF0501.
Secondary Independent VariablesAge: VCF0101.Church attendance: never (0) to every week (4). VCF0130.Close election (actual): Absolute value of the difference in percentage of the vote
received by the Democratic and Republican presidential candidates.Close election (perception): Respondent believes presidential race will be close (1)
or not (0). VCF0714.Contacted by party: A major party contacted the respondent (1) or not (0).
VCF9030A.
926 American Politics Research
distribution.© 2007 SAGE Publications. All rights reserved. Not for commercial use or unauthorized
by Juan Pardo on November 14, 2007 http://apr.sagepub.comDownloaded from
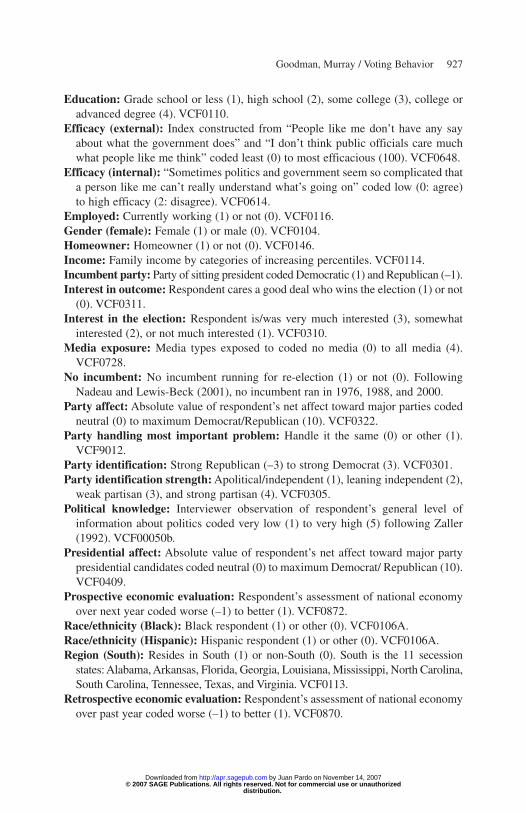
Education: Grade school or less (1), high school (2), some college (3), college oradvanced degree (4). VCF0110.
Efficacy (external): Index constructed from “People like me don’t have any sayabout what the government does” and “I don’t think public officials care muchwhat people like me think” coded least (0) to most efficacious (100). VCF0648.
Efficacy (internal): “Sometimes politics and government seem so complicated thata person like me can’t really understand what’s going on” coded low (0: agree)to high efficacy (2: disagree). VCF0614.
Employed: Currently working (1) or not (0). VCF0116.Gender (female): Female (1) or male (0). VCF0104.Homeowner: Homeowner (1) or not (0). VCF0146.Income: Family income by categories of increasing percentiles. VCF0114.Incumbent party: Party of sitting president coded Democratic (1) and Republican (–1).Interest in outcome: Respondent cares a good deal who wins the election (1) or not
(0). VCF0311.Interest in the election: Respondent is/was very much interested (3), somewhat
interested (2), or not much interested (1). VCF0310.Media exposure: Media types exposed to coded no media (0) to all media (4).
VCF0728.No incumbent: No incumbent running for re-election (1) or not (0). Following
Nadeau and Lewis-Beck (2001), no incumbent ran in 1976, 1988, and 2000.Party affect: Absolute value of respondent’s net affect toward major parties coded
neutral (0) to maximum Democrat/Republican (10). VCF0322.Party handling most important problem: Handle it the same (0) or other (1).
VCF9012.Party identification: Strong Republican (–3) to strong Democrat (3). VCF0301.Party identification strength: Apolitical/independent (1), leaning independent (2),
weak partisan (3), and strong partisan (4). VCF0305.Political knowledge: Interviewer observation of respondent’s general level of
information about politics coded very low (1) to very high (5) following Zaller(1992). VCF00050b.
Presidential affect: Absolute value of respondent’s net affect toward major partypresidential candidates coded neutral (0) to maximum Democrat/ Republican (10).VCF0409.
Prospective economic evaluation: Respondent’s assessment of national economyover next year coded worse (–1) to better (1). VCF0872.
Race/ethnicity (Black): Black respondent (1) or other (0). VCF0106A.Race/ethnicity (Hispanic): Hispanic respondent (1) or other (0). VCF0106A.Region (South): Resides in South (1) or non-South (0). South is the 11 secession
states: Alabama, Arkansas, Florida, Georgia, Louisiana, Mississippi, North Carolina,South Carolina, Tennessee, Texas, and Virginia. VCF0113.
Retrospective economic evaluation: Respondent’s assessment of national economyover past year coded worse (–1) to better (1). VCF0870.
Goodman, Murray / Voting Behavior 927
distribution.© 2007 SAGE Publications. All rights reserved. Not for commercial use or unauthorized
by Juan Pardo on November 14, 2007 http://apr.sagepub.comDownloaded from
Trust in government: Index coded least trusting of government (0) to most trusting(100). VCF0656.
Years in community: natural log of VCF9001.
Notes
1. The items that compose one of our primary independent variables, operational differ-ences, were not asked until 1984. As a result, we limit our analysis to the years 1984 to 2004(American National Election Study [ANES], 1995-2000).
2. This focus on uncertainty in the decision-making process is conceptually distinct frompolitical independence, which is associated with party identification and the psychologicalattachment to a party. It is conceivable, though, that political independence may contribute toor be affected by uncertainty in the decision-making process.
3. For a similar conceptualization of symbolic and operational differences, see the treatmentof operational and symbolic ideology (Free & Cantril, 1967; Robinson & Fleishman, 1984;Stimson, 2004).
4. This question has been asked since 1952 and is item VCF0501 in the 1948-2004 ANEScumulative data file.
5. These placement scales have been asked together in the ANES since 1984 and are iden-tified in the cumulative data file as items VCF0541/VCF0542 (government spending),VCF0549/VCF0550 (defense spending), and VCF0503/VCF0504 (party ideology). We focus onthese three measures because they were asked consistently from 1984 to 2004, unlike some of theother placement scales such as women’s equal role in society, which was asked only twice duringthe time frame, and because they often tap the most salient issues in presidential campaigns.
6. We do not distinguish whether respondents have placed the parties correctly because webelieve that perception of differences is more important than correct political knowledge.Furthermore, respondents were asked this battery of questions only if they had placed themselveson the 7-point scale. A closer examination of the data reveals that on each of the items used toconstruct our measure of operational differences, the percentage of respondents who placedboth themselves and the parties ranged from 74% (government services/spending) to 80%(liberal/conservative ideology). As such, we believe it is reasonable to conclude that nonresponseis not biasing our results.
7. We tried an alternative coding for our operational differences variable to account for themagnitude of the differences that respondents perceive. In the alternative coding, we coded arespondent as seeing an operational difference for a particular measure if her or his placement ofthe parties exceeded the mean difference perceived by all respondents. For example, the meandifference on the placement of the parties for government services and spending was 2.3, so arespondent whose absolute difference was greater than 2.3 was coded 1, and 0 otherwise. Werepeated this for the other two measures that composed the operational differences index. Theregression results were nearly identical to the original model using the alternative coding.
8. We estimated an alternative model in which the feeling thermometer for the incumbentparty candidate served as the dependent variable. This dependent variable provides moreobservations, but the results are substantively similar. Although the coefficient for symbolicdifferences is negative and statistically significant, the coefficient for operational differencesremains negative and statistically significant. Given the important differences between atti-tudes and behaviors, in this case we believe it is reasonable to focus on the more behaviorallyoriented vote choice measure.
928 American Politics Research
distribution.© 2007 SAGE Publications. All rights reserved. Not for commercial use or unauthorized
by Juan Pardo on November 14, 2007 http://apr.sagepub.comDownloaded from
References
Abramson, P. R., Aldrich, J. H., & Rohde, D. W. (2003). Change and continuity in the 2000 and2002 elections. Washington, DC: CQ Press.
Abramson, P. R., Aldrich, J. H., & Rohde, D. W. (2006). Change and continuity in the 2004elections. Washington, DC: CQ Press.
Aldrich, J. H. (1995). Why parties? The origin and transformation of political parties in America.Chicago: University of Chicago Press.
Alvarez, R. M. (1998). Information and elections (Rev. ed.). Ann Arbor: University of MichiganPress.
American National Election Study. (1995-2000). The ANES guide to public opinion and elec-toral behavior. Ann Arbor: University of Michigan, Center for Political Studies [Producerand Distributor]. Available from http://www.electionstudies.org/nesguide/nesguide.htm
Anderson, C. J. (2003). The psychology of doing nothing: Forms of decision avoidance resultfrom reason and emotion. Psychological Bulletin, 129, 139-167.
Bartels, L. M. (1996). Uninformed votes: Information effects in presidential elections. AmericanJournal of Political Science, 40, 194-230.
Bartels, L. M. (2000). Partisanship and voting behavior, 1952-1996. American Journal ofPolitical Science, 44, 35-50.
Brady, H. E., & Sniderman, P. M. (1985). Attitude attribution: A group basis for political rea-soning. American Political Science Review, 79, 1061-1078.
Brewer, M. D., & Stonecash, J. M. (2007). Split: Class and cultural divides in American politics.Washington, DC: CQ Press.
Calvert, R. L. (1985). The value of biased information: A rational choice model of political advice.Journal of Politics, 47, 530-555.
Campbell, A., Converse, P. E., Miller, W. E., & Stokes, D. E. (1960). The American voter. Chicago:University of Chicago Press.
Cox, G. W., & McCubbins, M. D. (1993). Legislative leviathan: Party government in the House.Berkeley: University of California Press.
Dhar, R. (1997). Consumer preferences for a no-choice option. Journal of Consumer Research,24, 215-231.
Downs, A. (1957). An economic theory of democracy. New York: HarperCollins.Dubois, P. L. (1979). The significance of voting cues in state supreme court elections. Law and
Society, 13, 757-779.Fiorina, M. P. (1981). Retrospective voting in American national elections. New Haven, CT:Yale
University Press.Fiorina, M. P., Abrams, S. J., & Pope, J. C. (2005). Culture war? The myth of a polarized America.
New York: Pearson Longman.Free, L. A., & Cantril, H. (1967). The political beliefs of Americans: A study of public opinion.
Rutgers, NJ: Rutgers University Press.Gerber, A. S., & Green, D. P. (2000). The effects of canvassing, telephone calls, and direct mail
on voter turnout: A field experiment. American Political Science Review, 94, 653-663.Hamill, R., Lodge, M., & Blake, F. (1985). The breadth, depth, and utility of class, partisan,
and ideological schemata. American Journal of Political Science, 29, 850-870.Hetherington, M. J. (2001). Resurgent mass partisanship: The role of elite polarization.
American Political Science Review, 95, 619-631.Hillygus, D. S. (2005). Campaign effects and the dynamics of turnout intention in election
2000. Journal of Politics, 67, 50-68.
Goodman, Murray / Voting Behavior 929
distribution.© 2007 SAGE Publications. All rights reserved. Not for commercial use or unauthorized
by Juan Pardo on November 14, 2007 http://apr.sagepub.comDownloaded from
Inman, J. J., & Zeelenberg, M. (2002). Regret in repeat purchase versus switching decisions:The attenuating role of decision justifiability. Journal of Consumer Research, 29, 116-128.
Jacobson, G. C. (2004). The politics of congressional elections (6th ed.) New York: Longman.Jewell, M. E., & Breaux, D. (1988). The effect of incumbency on state legislative elections.
Legislative Studies Quarterly, 13, 495-514.Kam, C. D. (2005). Who toes the party line? Cues, values, and individual differences. Political
Behavior, 27, 163-182.Kuklinski, J. H., & Hurley, N. L. (1994). On hearing and interpreting political messages:
A cautionary tale of citizen cue-taking. Journal of Politics, 56, 729-751.Lau, R. R., & Redlawsk, D. P. (2001). Advantages and disadvantages of cognitive heuristics
in political decision making. American Journal of Political Science, 45, 951-971.Lineberry, R. L., & Fowler, E. P. (1967). Reformism and public policies in American cities.
American Political Science Review, 61, 701-716.Lodge, M., & Hamill, R. (1986). A partisan schemata for political information processing.
American Political Science Review, 80, 505-520.Luce, M. F. (1998). Choosing to avoid: Coping with negatively emotion-laden consumer deci-
sions. Journal of Consumer Research, 24, 409-433.Lupia, A. (1994). Shortcuts versus encyclopedias: Information and voting behavior in
California insurance reform elections. American Political Science Review, 88, 63-76.MacKuen, M. B., Erikson, R. S., & Stimson, J. A. (1992). Peasants or bankers? The American
electorate and the U.S. economy. American Political Science Review, 86, 597-611.McDermott, M. L. (2005). Candidate occupations and voter information shortcuts. Journal of
Politics, 67, 201-219.McDermott, M. L. (2006). Not for members only: Group endorsements as electoral informa-
tion cues. Political Research Quarterly, 59, 249-257.McKelvey, R. D., & Ordeshook, P. C. (1986). Information, electoral equilibria, and the demo-
cratic ideal. Journal of Politics, 48, 909-937.Mondak, J. J. (1993). Public opinion and heuristic processing of source cues. Political Behavior,
15, 167-192.Nadeau, R., & Lewis-Beck, M. S. (2001). National economic voting in U.S. presidential elec-
tions. Journal of Politics, 63, 159-181.Ottati, V. C. (1990). Determinants of political judgments: The joint influence of normative and
heuristic rules of inference. Political Behavior, 12, 159-179.Pomper, G. M. (1966). Ethnic and group voting in nonpartisan municipal elections. Public
Opinion Quarterly, 30, 79-97.Pomper, G. M. (2005). The presidential election: The ills of American politics after 9/11. In
M. Nelson (Ed.), The elections of 2004. Washington, DC: CQ Press.Poole, K. T., & Rosenthal, H. (1997). Congress: A political-economic history of roll call vot-
ing. New York: Oxford University Press.Popkin, S. L. (1994). The reasoning voter: Communication and persuasion in presidential
campaigns. Chicago: University of Chicago Press.Rahn, W. M. (1993). The role of partisan stereotypes in information processing about political
candidates. American Journal of Political Science, 37, 472-496.Riker, W. H., & Ordeshook, P. C. (1968). A theory of the calculus of voting. American Political
Science Review, 62, 25-42.Robinson, J. P., & Fleishman, J. A. (1984). Public opinion polling: Ideological trends in
American public opinion. Annals of the American Academy of Political and Social Science,472, 50-60.
930 American Politics Research
distribution.© 2007 SAGE Publications. All rights reserved. Not for commercial use or unauthorized
by Juan Pardo on November 14, 2007 http://apr.sagepub.comDownloaded from
Rosenstone, S. J., & Hansen, J. M. (1993). Mobilization, participation, and democracy inAmerica. New York: MacMillan.
Schaffner, B. F., & Streb, M. (2002). The partisan heuristic in low-information elections.Public Opinion Quarterly, 66, 559-581.
Schaffner, B. F., Streb, M., & Wright, G. (2001). Teams without uniforms: The nonpartisanballot in state and local elections. Political Research Quarterly, 54, 7-30.
Scholz, J. T., & Lubell, M. (1998). Trust and taxpaying: Testing the heuristic approach to col-lective action. American Journal of Political Science, 42, 398-417.
Sniderman, P. M., Hagen, M. G., Tetlock, P. E., & Brady, H. E. (1986). Reasoning chains:Causal models of policy reasoning in mass publics. British Journal of Political Science, 16,405-430.
Snyder, J. M., Jr., & Ting, M. M. (2002). An informational rationale for political parties.American Journal of Political Science, 46, 90-110.
Squire, P., & Smith, E.R.A.N. (1988). The effect of partisan information on voters in nonpar-tisan elections. Journal of Politics, 50, 169-179.
Stimson, J. A. (2004). Tides of consent: How public opinion shapes American politics.Cambridge, UK: Cambridge University Press.
Tversky, A., & Shafir, E. (1992). Choice under conflict: The dynamics of deferred decision.Psychological Science, 3, 358-361.
Verba, S., & Nie, N. H. (1972). Participation in America: Political democracy and socialequality. New York: Harper and Row.
Verba, S., Nie, N. H., & Kim, J. (1978). Participation and political equality. Cambridge, UK:Cambridge University Press.
Verba, S., Schlozman, K. L., & Brady, H. E. (1995). Voice and equality: Civic volunteerism inAmerican politics. Cambridge, MA: Harvard University Press.
Wolfinger, R. E., & Rosenstone, S. J. (1980). Who votes? New Haven, CT: Yale UniversityPress.
Zaller, J. R. (1992). The nature and origins of mass opinion. New York: Cambridge UniversityPress.
Craig Goodman is an assistant professor of political science at Texas Tech University. Hisresearch investigates congressional organization and procedures.
Gregg R. Murray is an assistant professor of political science at Texas Tech University. Hisresearch focuses on the psychology of political behavior.
Goodman, Murray / Voting Behavior 931
distribution.© 2007 SAGE Publications. All rights reserved. Not for commercial use or unauthorized
by Juan Pardo on November 14, 2007 http://apr.sagepub.comDownloaded from


