Embed Size (px)
Citation preview
MEASUREMENT OF NONUNIFORM MAGNETIZED ARGON PLASMA DISCHARGE PARAMETERS
A THESIS SUBMITTED TOTHE GRADUATE SCHOOL OF NATURAL AND APPLIED SCIENCES
OFMIDDLE EAST TECHNICAL UNIVERSITY
BY
EBRU DAĞTEKİN
IN PARTIAL FULFILLMENT OF THE REQUIREMENTSFOR
THE DEGREE OFMASTER OF SCIENCE
INPHYSICS
DECEMBER 2006

Approval of the Graduate School of Natural and Applied Sciences.
Prof. Dr. Canan Özgen
Director
I certify that this thesis satisfies all the requirements as a thesis for the degree of Master of Science.
Prof. Dr. Sinan Bilikmen
Head of Department
This is to certify that we have read this thesis and that in our opinion it is fullyadequate, in scope and quality, as a thesis for the degree of Master of Science.
Prof. Dr. Sinan Bilikmen
Supervisor
Examining Committee Members
Prof. Dr. Arif Demir (Kocaeli Univ., PHYS)
Prof. Dr. Sinan Bilikmen (METU, PHYS)
Prof. Dr. Gülay Öke (METU, PHYS)
Assist. Prof. İsmail Rafatov (METU, PHYS)
Dr. Burak Yedierler (METU, PHYS)
“I hereby declare that all information in this document has been obtained and presented in accordance with academic rules and ethical conduct. I also declare that, as required by these rules and conduct, I have fully cited and referenced all material and results that are not original to this work."
Name Surname : EBRU DAĞTEKİN
Signature :
iii

ABSTRACT
MEASUREMENT OF NONUNIFORM MAGNETIZED ARGON PLASMA DISCHARGE PARAMETERS
Dağtekin, Ebru
M.Sc., Department of Physics
Supervisor: Prof. Dr. Sinan Bilikmen
December 2006, 63 pages.
Effects of a magnetic field on the double-probe technique are studied
experimentally by means of symmetric floating computer controlled fast double
probes in low and intermediate pressure plasmas. In addition, the effects of the
magnetic field on the electron temperature, electron density, and electric field have
been investigated. As it is expected, when there is no magnetic field, properties of the
discharge plasma are best described by Langmuir theory. Whereas, when there’s a
magnetic field of sufficient strength Schottky’s theory of ambipolar diffusion applies.
Keywords: Fast Langmuir probe, electron temperature, electron density, positive column, magnetic field.
iv

ÖZ
DÜZGÜN OLMAYAN ARGON PLAZMA BOŞALMASINDA PARAMETRELERİN MANYETİK ALAN İÇİNDE ÖLÇÜLMESİ
Dağtekin, Ebru
M.Sc., Department of Physics
Supervisor: Prof. Dr. Sinan Bilikmen
Aralık 2006, 63 sayfa.
Düşük ve orta basınçlı plazmalarda deneysel olarak, manyetik Alanın İkili
prob tekniği üzerine etkileri simetrik yalıtılmış bilgisayar kontrollü hızlı çift prob
yoluyla çalışılmıştır. Bununla birlikte manyetik alanın elektron sıcaklığına, elektron
yoğunluğuna ve elektrik alanına etkileri araştırılmıştır. Manyetik alan mevcut
değilken Langmuir’ in serbest iyon düşme teorisi boşalmalı plazma sisteminin
özelliklerini en iyi biçimde tanımlarken, yeterli güçte manyetik alanın varlığında,
Schottky’nin ambipolar difüzyon teorisi geçerlidir.
Anahtar Kelimeler: Hızlı Langmuir prob, elektron sıcaklığı, elektron yoğunluğu, pozitif kolon, manyetik alan.
v

...TO MY FAMILY
vi
ACKNOWLEDGEMENTS
I am grateful to all who have helped me to have the opportunity and possibility to
continue the graduate study and to prepare this thesis. My sincere gratitude and deep
appreciation to Prof. Dr. Sinan Bilikmen for his kind assistance and supervision. I
wish to thank Dr. Demiral Akbar for his guidance in the plasma lab and all staff of
electronic laboratory, to my graduate friends and my mother for her eternal patience
and support.
vi

TABLE OF CONTENTS
PLAGIARISM ....................................................................................................... iii
ABSTRACT .......................................................................................................... iv
ÖZ........................................................................................................................... v
DEDICATION....................................................................................................... vi
ACKNOWLEDGMENTS.................................................................................... vii
TABLE OF CONTENTS................................................................................... viii
LIST OF FIGURES.............................................................................................. x
CHAPTER 1 INTRODUCTION.......................................................................... 1
CHAPTER 2 DC GLOW DISCHARGE............................................................. 4
2.1 Basics .......................................................................................... 4
2.2 General Characterization of DC Glow Discharges..................... 8
2.3 The Cathode Region................................................................... 10
2.4 The Negative Glow and Faraday Dark Space................................. 11
2.5 The Positive Column....................................................................... 12
2.5.1 Theory of Positive Column in the absence of Magnetic Field... 13
2.5.2 Theory of Positive Column in Magnetic Field ..........................18
CHAPTER 3 ELECTRICAL LANGMUIR PROBE............................................. 21
3.1 Overview of Langmuir Probes ...................................................... 21 3.2 Probe Theory................................................................................. 22
3.3 Electrical Probe at Low Pressure Discharge................................. 23
3.3.1 Single Probe....................................................................... 23
vi

3.3.2 Double Probe....................................................................... 24
CHAPTER 4 EXPERIMENTAL APPARATUS................................................... 31
4.1 Discharge Tube and Double Probe System..................................... 31
4.2 The Pressure Measurement System................................................. 34
CHAPTER 5 RESULTS AND DISCUSSION ................................................ ..... 35
5.1 Current- Voltage Characteristics...................................................... 35
5.2 The Electron Temperature .............................................................. 48
5.3 The Electric Field............................................................................ 54
5.4 The Electron Density........................................................................ 59
CHAPTER 6 CONCLUSION AND DISCUSSION.............................................. 64
6.1 Conclusion...................................................................................... 64
REFERENCES ..................................................................................................... 67
ix
LIST OF FIGURES
FIGURES
Figure 2.1 Schematic I-V curve of a glow discharge[16]...................................…..6
Figure 2.2 Classification of the glow discharge [16]...............................................10
Figure 3.1 Electrical circuit for double probe measurement. . . . .……...................24
Figure 3.2 Characteristic of symmetric double probe ...…….................…….........25
Figure 3.3 Double probe potential:(a)Floating potential, no current through the probes; (b) Left-hand probe is strongly negative, and receivesionic saturation current.(c) Polarity reversal; the right-hand probe is strongly negative[16] ........... 26
Figure 4.1 Schematic diagram of experimental apparatus………………………....31
Figure 4.2 Schematic diagram of the double probe diagnostic system.…….. .........33
Figure 4.3 The electronic parts of the isolated computer controlled three couples of double probe (TCDP) system. . . . . . . . . . . . . . . . ………….........34
Figure 5.1 Double probe characteristic in argon gas at Id = 5 mA (B1)...................38
Figure 5.2 Double probe characteristic in argon gas at Id = 15 mA(B1)..................40
Figure 5.3 Double probe characteristic in argon gas at Id = 5 mA(B2)....................42
Figure 5.4 Double probe characteristic in argon gas at Id = 15 mA(B2)..................44
Figure 5.5 Double probe characteristic in argon gas at Id = 5 mA(B3)....................46
Figure 5.6 Double probe characteristic in argon gas at Id = 15 mA(B3)..................48
Figure 5.7 Electron temperature as a function of pR at Id = 5 mA,(B1).................. 49
Figure 5.8 Electron temperature as a function of pR at Id = 15 mA,(B1).................50
Figure 5.9 Electron temperature as a function of pR at Id = 5 mA,(B2)...................51
Figure 5.10 Electron temperature as a function of pR at Id = 15 mA,(B2)...............52
Figure 5.11 Electron temperature as a function of pR at Id = 5 mA,(B3).................52
Figure 5.12 Electron temperature as a function of pR at Id = 15 mA,(B3)...............53
Figure 5.13 Axial electric field as a function of pR at Id =5 mA , (B1)....................54
x

Figure 5.14 Axial electric field as a function of pR at Id =15 mA , (B1)..................55
Figure 5.15 Axial electric field as a function of pR at Id =5mA,(B2).......................56
Figure 5.16 Axial electric field as a function of pR at Id = 15 mA, (B2)..................56
Figure 5.17 Axial electric field as a function of pR at Id =5 mA, (B3)....................57
Figure 5.18 Axial electric field as a function of pR at Id =15 mA, (B3)..................58
Figure 5.19 Electron density as a function of pR at Id = 5 mA, (B1).....................59
Figure 5.20 Electron density as a function of pR at Id = 15 mA, (B1)...................60
Figure 5.21 Electron density as a function of pR at Id = 5 mA, (B2)....................61
Figure 5.22 Electron density as a function of pR at Id = 15 mA, (B2)....................62
Figure 5.23 Electron density as a function of pR at Id=5 mA, (B3).......................62
Figure 5.24 Electron density as a function of pR at Id=5 mA, (B3)........................63
xi


CHAPTER 1
INTRODUCTION
DC glow discharges have been used for plasma processing applications in
the low and intermediate pressure regimes in modern technology.
Because plasmas are conductive and respond to electric and magnetic fields
and can be efficient sources of radiation, they are usable in numerous applications
where such control is needed or when special sources of energy and radiation are
required [1].
The development of plasma science in the past three decades has been
propelled by applications such as fusion energy, space science and the need for
defense, and this support has resulted in significant progress [2].
The electric fields in the low temperature plasmas can reveal significant
energy to the electrons and ions but the plasmas are still cool enough to support a
multitude of chemical reactions, and they are critical to the processing of many
modern materials such as the fabrication of semiconductors. The plasma etching for
semiconductors and the surface modification and growth of new materials are some
of the important examples.
Other important uses of low temperature plasmas include the “cold”
pasteurization of foods, the sterilization of medical products, environmental
cleanup, gas discharge for lightning such as fluorescent lights and lasers, isotope
separation, switching and welding technology, and plasma-based space propulsion
systems.
The main working parameters-temperature and pressure of the vast majority
of technological processes are unavoidably increasing and therefore nowadays we
can mention from a Renaissance. It follows that more and more considerable part of
a processed material converts into the plasma state and an opinion arises that in the
coming century the considerable, if not the main, part of the materials and surface
processing will inevitably use the plasma technology.
1

The second reason of extreme rise of interest in this field follows from the
fact that, among the more or less easily obtainable objects, the low temperature gas
discharge plasmas are the most remote ones from the thermodynamic equilibrium.
As a result, a great variety of the plasmas are widely used as active media of optical
quantum generators and amplifiers. This extremely non-equilibrium property of the
plasmas are widely used as active media of optical quantum generators and
amplifiers. This also is the reason why the most exotic chemical synthesis, which
cannot be performed otherwise, is possible in the plasma state [3].
The main part of plasma science presently practiced in this domain is
gaseous electronics-based. In its original configuration, the gas discharge branch of
Langmuir’s plasma physics, founded in the early part of this century, focused on
electron conduction and breakdown in gases, electron emission and other cathode
phenomena, and excitation of atomic and molecular species by electron collisions.
Applications of the physical principles derived in this new field of science
developed rapidly, beginning with the carbon used as light source and followed by
gas-discharge rectification, high-power switch gear and welding arcs. The pervasive
use of plasmas in modern technology is a result of the range of parameters that can
be accessed and that is inaccessible by any other means. No other medium can
provide gas temperatures or energy densities as high as those of plasmas: no other
medium can excite atomic or molecular species to radiate as efficiently; no other
medium can be arranged to provide comparable transient and nonequilibrium
conditions [4].
Time is an important boundary limited agent in quantifying plasma
parameters especially ion currents and assembling data in a few seconds effects the
results. With the help of three couples of double probe system measurements has
been taken. The experiment is realized with using input/output data
acquisition/control board (NI 6014) from National Instruments connected to a
personal computer (PC). The time resolution of the system has a maximum value of
5 µs.
In this study taking into consideration of double Langmuir probes system
advantages, such as double probe system does not require the presence of a
grounded reference in contact with the plasma, it is used instead of single probe
system. Another advantage is that the total collected current is limited with the ion
2
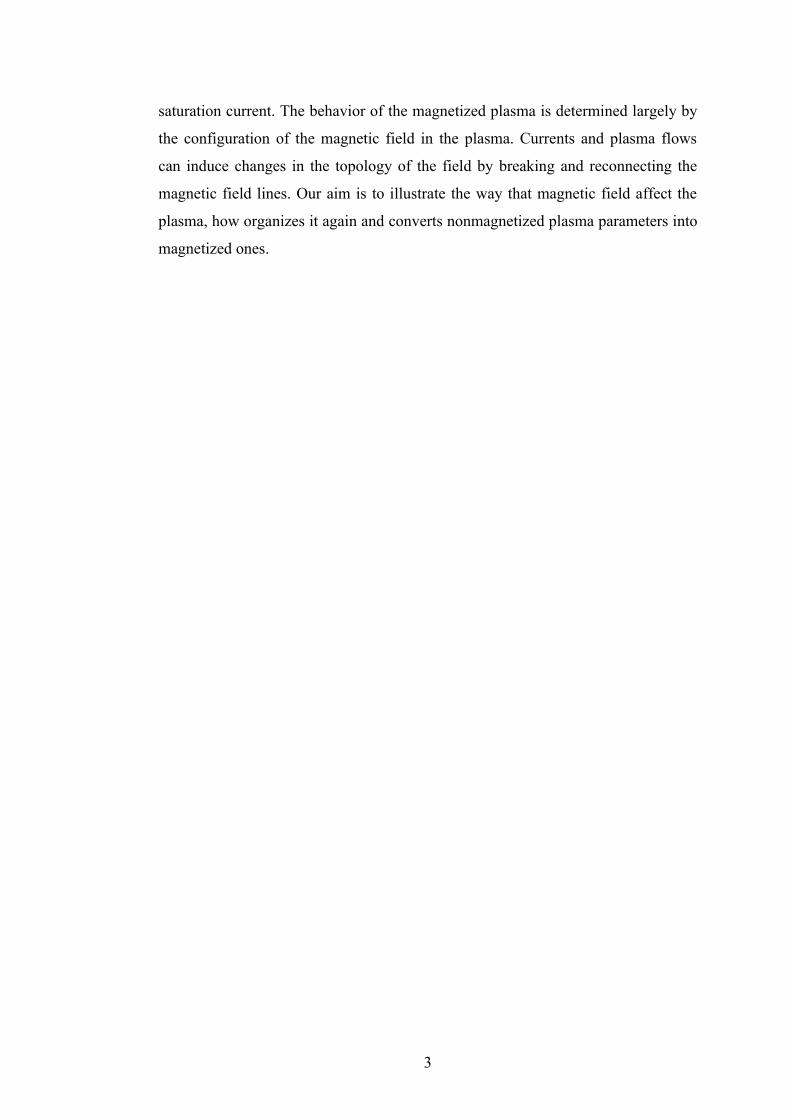
saturation current. The behavior of the magnetized plasma is determined largely by
the configuration of the magnetic field in the plasma. Currents and plasma flows
can induce changes in the topology of the field by breaking and reconnecting the
magnetic field lines. Our aim is to illustrate the way that magnetic field affect the
plasma, how organizes it again and converts nonmagnetized plasma parameters into
magnetized ones.
3
CHAPTER 2
DC GLOW DISCHARGE
2.1 Basics
The regions of an active discharge in gases at low pressure were extensively
studied and characterized at an early stage in the development of physics. A simple
experiment can demonstrate several essential types of discharge. The tube can be
evacuated and filled with several gases at different pressures. The voltage between
the electrodes and the current in the circuit will be measured. If a voltage of a few
tens of volts is applied to the electrodes, no visible effects are produced. However,
an extremely sensitive device would record a very low current on the order of 10-15
A due to charges generated in the gas by cosmic rays and natural radioactivity. The
field pulls them to the opposite-sign electrodes, producing a current. If the gas is
deliberately irradiated by a radioactive or an X-ray source, a current on the order of
10-6 A can be produced. The resultant ionization of the gas is still too small for
emitting light.
We can describe a discharge as non-self-sustaining when an electric current
survive under the conditions of an external ionizing agent or the emission of
electrons or ions from electrons is maintained (e.g. by heating the cathode). An
additional increase of voltage increases the current sharply until a certain value of V
and light emission is remarked. These are indications of breakdown, one of the
important discharge processes. At a pressure p ≈ 1 Torr and inter-electrode
separation L ≈ 1 cm, the breakdown voltage is several hundred volts. A small
number of artificial electrons or electrons injected intentionally to stimulate the
process starts breakdown: The discharge immediately becomes self-sustaining.
During their motion the energy of the electron increases and after reaching the
atomic ionization potential, the electron spends this energy by colliding with
another electron. Two slow electrons are thus produced, which go on to repeat the
4

cycle described above. The result is an electron avalanche. The gas is appreciably
ionized in 10-7 to 10-3 s, which is sufficient for the current to grow by several orders
of magnitude. At low pressure and high resistance of the external circuit (it prevents
the current to reach a large value), a glow discharge develops.
We can classify the discharges regarding the uniformity of electric field in two
classes:
1- At low current densities (i.e. charge carrier densities) the electric field
due to the space charge can be neglected and it is uniform. The electric
field can be found by V/d, where d is the distance between the
electrodes.
2- At high current densities the electric field due to space charges will
become important and as a result the total electric field will be non-
uniform. The electric field distribution has to be calculated by means of
Poisson’s equation:
( )
=−
=∇
00.
ερ
ε ei nneE
(2.1)
where
e = charge of the electron
0ε = permittivity of the free space
ne,i= number density, for electron and ions
ρ = space charge density = e (ni - ne)
The so – called electrical characteristic of the discharge is described by the
I-V curve as shown in Figure (2.1). It is determined by the external parameters p, d,
the electrode material, the gas type and the external current density. The desired
operating point is fixed by the choice of the external resistance R.
The electrical characteristic can be subdivided into three regions:
1-The low current region, I < 10-6 A; the range of the Townsend discharge;
because little or no light is emitted it is also called “dark discharge”. The electric
field is uniform.
5

2-With I ≥ 10-6 A; the electric field configuration changes due to the onset of
space charge distortion. The potential drop VC is confined to a short region in front
of the cathode (cathode fall). For a certain range of the current the voltage drop VC
is independent of the current, this is the so called normal glow discharge region.
With increasing current VC rises; we enter the region of abnormal glow.
3-Further increase of the current leads to the so-called glow-to-arc transition.
The cathode fall undergoes a transformation from cold cathode discharge to a hot
cathode discharge with thermionic emission.
In this work, we are interested in region 2 of the plasma characteristic. The
plasma parameter ranges are:
108 cm-3 ≤ ne ≤ 1012 cm-3 , 10-4 torr ≤ p ≤ 10 torr, 0.1 eV≤ Te ≤ 10 eV, and
5 x 1012 cm-3≤ n g ≤ 3 x 10 17 cm-3; i.e. ne/n0 ≈ 10-6 – 10-3 and λD ≈ 10-2 –10-1
cm. Where ng denotes the density of the neutral atoms, Te the electron temperature,
and λD is the Debye length (λD(cm)=743 (Te/ne)1/2) with Te in electron-volts and ne in
cm-3[12,10].
The glow discharge gets its name from a luminous zone which develops
near the cathode and is separated from it by a dark space. The ionized gas in the
column is electrically neutral practically everywhere except for the regions close to
electrodes. Therefore, it is called as plasma. From the aspects of two main
criterions, which are first the state of the ionized gas and second the frequency
6
Figure 2.1: Schematic I-V curve of a glow discharge [16].
Region 1 Region 2 Region 3

range of the field, glow discharge can be classified as non-equilibrium plasma with
constant electric field.
The essential supply of electrons is obtained mainly from secondary
emission caused by the bombardment of the cathode by positive ions, that is, by
action of the current itself. It is conveniently described as a discharge in which the
cathode emits electrons under the bombardment of particles and light quanta from
the gas.
A characteristic property of glow discharge is a layer of large positive space
charge at the cathode, with a strong field at the surface and considerable potential
drop of 100-400 V (or more). This drop is called as cathode fall and the thickness of
the cathode fall layer is inversely proportional to the density of the gas. In this case
the inter-electrode separation is sufficiently large; an electrically neutral plasma
region with weak field is established between the cathode and anode layers. This
relatively homogeneous part is called positive column. The anode layer exists
between positive column and the anode.
The positive column constitutes weakly ionized non-equilibrium plasma-that
is, an ionized gas having no net space charge. It serves only to maintain the
conduction of current by electrons which are established in the cathode region.
It is known that there are a variety of glow discharges and their appearance
varies with the nature of the gas, pressure, type and size, separation, material of the
electrodes and the radius of discharge tubes (e.g. narrow, capillary, rectangular and
cylindrical). The comparisons between these kinds of vessels have been
investigated separately by numerous authors [5, 6, 7, 8].
In many uniform dc glow discharge systems [9, 10, 11, 12], the electron
density is small near the cathode and increases towards the anode because of
ionization of electrons. In other words, the electron temperature increases sharply
near the cathode and remains constant near the anode. Also, the axial component of
the electric field is constant in the uniform positive column.
7

2.2 General Characterization of DC Glow Discharges
The appearance of a gas changes when the electric discharge passes through
it at a low pressure differences and various points in its path become very clearly
marked.
Basically, a source of electrons or cathode, let it be a cold metal plate, must
exists and it should emit secondary electrons because of ion bombardment, impart
of meta-stable gas atoms, or sufficiently energetic ultraviolet radiation, or a hot
thermionicaly emitting surface can serve for this. The conditions near the cathode
are determined by the immediate electrical potential drop in front of the cathode and
also by the ion bombardment which ion bombardment a sufficient yield of electrons
appears.
At the cathode strong fields excite the electrons and they are accelerated until
they reach to energies greater than the optimum value for ionization. Therefore,
regions in which the initial electrons are scattered and lose energy until the motion
is randomized and an optimum situation is achieved.
Under these conditions, it is possible to build a balance between the gain of
the energy input from the longitudinal field and the loss of energy due to inelastic
collisions with the gas atoms, between the particle-generation process of ionization
of the gas atoms by electron impact and the loss process due to particle interaction
with the walls. The loss process arises because there are radial electric fields caused
by the charged particles which lead to their motion in a radial direction and may be
treated as free flight at very low pressures or diffusive at moderate pressures,
particles of opposite sign then recombining on the wall. At high pressures when the
reduced fields are low, recombination in the volume is an important process [13].
In a long cylindrical tube which includes a rare gas at a pressure between 0.1
and 1 mm Hg, a discharge occurs and visible light is emitted from the tube. At the
very beginning of the tube close to the cathode there exists sometimes a very
narrow dark space (Aston`s ) and it is followed by a thin relatively feeble sheath
luminous layer-the cathode glow- which in turn is followed by the cathode dark
space. Aston`s dark space and the cathode glow can not always observed clearly.
The negative glow is separated with a sharp boundary from the cathode dark
space and the negative glow becomes progressively dimmer towards the `Faraday
8

dark space`. The positive column is at the positive end of it and is either a region of
uniform luminosity or regularly striated. Increasing pressure leads the positive
column contracting radially.
Sometimes a visible anode dark space exists at the positive end of the positive
column and it depends on the gas and the value of the discharge current. The
relative light intensities are shown in Figure (2.2a). The distribution of the applied
voltage along the discharge is shown in Figure (2.2b). Three parts in the discharge
may be distinguished, a cathode fall, an anode fall and a part where the electric field
(E) is constant “positive column”. Most of the applied potential is required for the
cathode dark space when the field is high as indicated in Figure (2.2c). The
discharge current is mainly electronic rather than ionic because of the greater
mobility of the electrons. The current density and net space charge density
distribution along the discharge are shown in Fig. (2.2 d and f) respectively [14].
9
Figure 2.2: Classification of the glow discharge [16]

2.3 The Cathode Region
Positive-ion bombardment is the main factor for maintenance of the
discharge at the cathode. A positive ion with a greater total energy than twice of
work function required for removing of an electron, then one electron may be
ejected while a second neutralizes the ion.
An ion or atom with energy equal to twice the ionization energy has the
ability of ionizing an atom it strikes. Ion velocity and the kind of gas, electrode
material can increase the probability of this event, measured as γ i , the yield of
electrons per incident ion. The escape of electrons can be prevented by maximum
depth of penetration when ion reaches high energies like 105 eV.
The electrons near the cathode surface form a negative space charge, before
they gain appreciable velocity, but since they are then accelerated by the electric
field and since in any case the current is mostly due to positive ions in this region,
the space charge becomes positive a short distance from the cathode and remains
positive ions in this region and remains positive through the cathode dark space.
Between the cathode and Aston dark spaces the cathode glow exists and has
a reddish color and is due to the recombination of incoming positive ions with slow
electrons, for which the recombination coefficient is high. A larger voltage gradient
can occur because of the large net positive space charge formed in the cathode dark
space, so most of the tube voltage is taken up here and the electrons are accelerated
sufficiently to produce intense ionization and therefore multiplication. By the end of
the cathode dark space, the current is nearly all carried by the electrons, whose
numbers are then so great, despite their high average velocity, they considerably
reduce the net positive space charge [15].
The axial length of the negative zones i.e. those near the cathode, are
independent of the distance between anode and cathode of a glow discharge but the
length of the positive column changes.
2.4 The Negative Glow and Faraday Dark Space
The density of electrons at the anode side of the cathode dark space is
increased at the points at which there are sufficient electrons to carry the entire
10

current and to make the net space charge negative. When the sign of the space
charge reverses just before the voltage gradient becomes slightly negative, reaching
a negative maximum, the acceleration of fast electrons emerging from the cathode
dark space ends and their energy is absorbed mainly by intense excitation and
ionization – the reason of the brightness of the negative glow. As the electrons are
slowed down the negative space charge reaches a maximum, the energy available
for excitation and ionization is exhausted and the Faraday dark space begins, there
is no sharp boundary. The electron density decreases by recombination and
diffusion in the dark space until the net space charge becomes zero again and E
attains a constant small value, at which point the positive column begins. [15]
2.5 The Positive Column
Bounded at one end by the Faraday dark space and at the other by the anode
glow is the positive column. It is so called because it connects the negative zones to
the anode; usually it is produced in cylindrical tubes, though a “positive column”
can no doubt be obtained between two parallel walls.
The positive column is not really necessary for maintaining a glow
discharge, although it can be the largest part of the discharge. In long tubes, as for
example neon signs, the positive column may be straight or bent and have any
length provided the applied voltage is sufficiently high. The column is usually
uniform, as can be seen from the constancy of the axial potential gradient or the
constant average energy of electrons at any point (unless the geometry varies). Also
the radiation emitted per unit axial length is everywhere the same and any chemical
changes occur along its length.
The axial gradient dV/dx can be found by observing the potential difference
between two probes placed at a known distance apart or by reading the voltage
across the discharge for constant current and varying electrode distance. Because
dV/dx = constant, thus from Poisson’s equation the number of positive and negative
charges per unit volume or per unit length of column is equal. The main principle is
that the positive column serves to maintain the conduction of current by electrons
which are established in the cathode region.
11
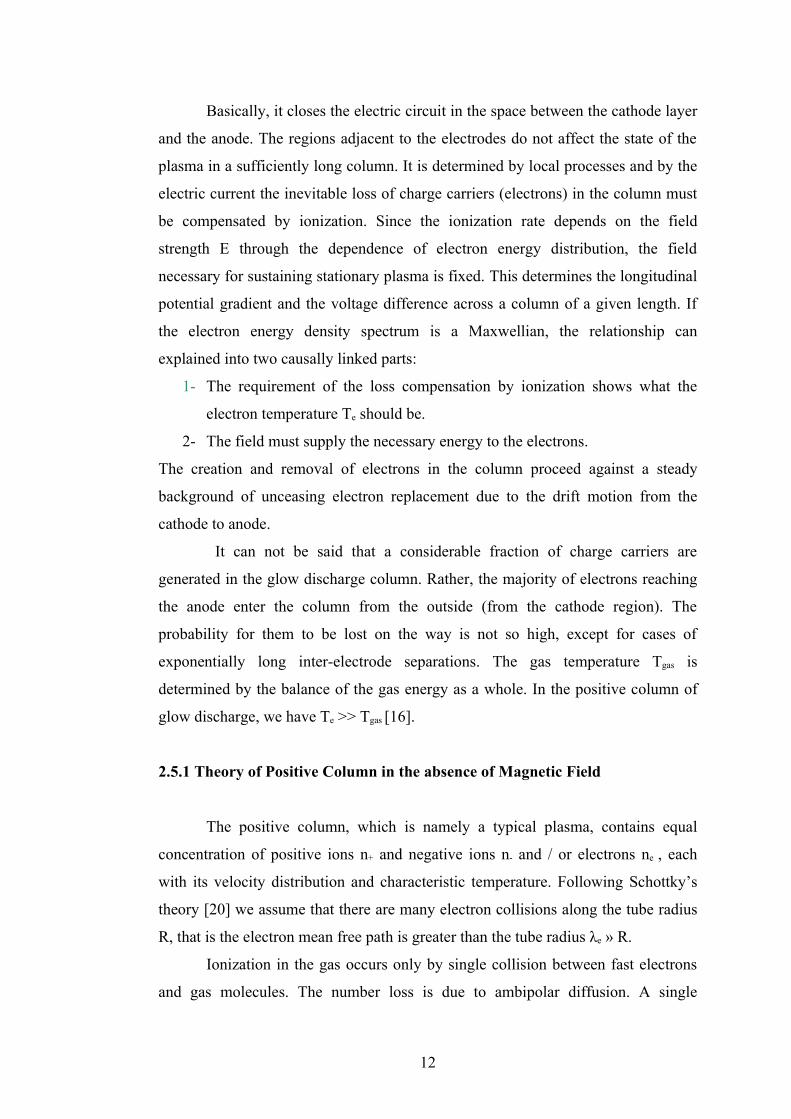
Basically, it closes the electric circuit in the space between the cathode layer
and the anode. The regions adjacent to the electrodes do not affect the state of the
plasma in a sufficiently long column. It is determined by local processes and by the
electric current the inevitable loss of charge carriers (electrons) in the column must
be compensated by ionization. Since the ionization rate depends on the field
strength E through the dependence of electron energy distribution, the field
necessary for sustaining stationary plasma is fixed. This determines the longitudinal
potential gradient and the voltage difference across a column of a given length. If
the electron energy density spectrum is a Maxwellian, the relationship can
explained into two causally linked parts:
1- The requirement of the loss compensation by ionization shows what the
electron temperature Te should be.
2- The field must supply the necessary energy to the electrons.
The creation and removal of electrons in the column proceed against a steady
background of unceasing electron replacement due to the drift motion from the
cathode to anode.
It can not be said that a considerable fraction of charge carriers are
generated in the glow discharge column. Rather, the majority of electrons reaching
the anode enter the column from the outside (from the cathode region). The
probability for them to be lost on the way is not so high, except for cases of
exponentially long inter-electrode separations. The gas temperature Tgas is
determined by the balance of the gas energy as a whole. In the positive column of
glow discharge, we have Te >> Tgas [16].
2.5.1 Theory of Positive Column in the absence of Magnetic Field
The positive column, which is namely a typical plasma, contains equal
concentration of positive ions n+ and negative ions n- and / or electrons ne , each
with its velocity distribution and characteristic temperature. Following Schottky’s
theory [20] we assume that there are many electron collisions along the tube radius
R, that is the electron mean free path is greater than the tube radius λe » R.
Ionization in the gas occurs only by single collision between fast electrons
and gas molecules. The number loss is due to ambipolar diffusion. A single
12

collision between the fast electrons and gas molecules is resulted with ionization of
the gas. The number of loss is due to ambipolar diffusion, thus both electrons and
ions move with the same speed radially outwards. The electrons and positive ions
neutralize their charge on the wall because they do not recombine in the gas.
Therefore, their concentration is large at the axis and is practically zero on the
insulated wall. We have therefore in any volume element of the column the same
number of positive and negative charges, but this number is different in volume
elements which are not at the same distance from the axis.
Schottky diffusion theory can explain the radial distribution of the electron
and ion densities. It is well known that the positive column spreads laterally to the
wall at pressures less than a few Torr for the large discharge currents.
The Schottky theory well describes the spread positive column where the
direct ionization balances with the diffusion in the whole plasma. He developed an
ambipolar diffusion theory in which he assumed quasi-neutrality of the plasma and
neglected the effect of charged particle inertia on the radial structure of the positive
column.
Many researches show that the radial electron distribution is usually close
to the J0-Bessel function. In this theory, electrons are in equilibrium with the axial
electric field, implying that the energy imported to the electrons by a steady uniform
electric field is exactly balanced by energy lost in elastic and inelastic collisions
with heavy particles in each volume element of the discharge [21, 42].
The special features of the electron motion in the potential field of the
positive column are related to their acceleration in the longitudinal field, and their
deceleration in the radial field. The axial electric field drives the discharge current Id
and yields the power input to the plasma, which is mainly absorbed by the electron
components.
However, the radial electric field is caused by the establishment of space-
charges and can reach more than 100 V/cm near the dielectric walls. It accelerates
the ions and retards electron movement toward the wall, in such a way that
ambipolar radial flux of electrons and ions is established [22, 43]. At low pressure,
when the total energy is conserved electron motion in the radial direction occurs. In
case the radial electric field is larger than the axial field as in electrons with large
13
radii, they are accelerated by the axial electric field to kinetic energy below the
ionization potential.
The electrons move radially inward at nearly constant energy, and by
ambipolar electrical field they are accelerated above the ionization threshold. The
lower-energy electrons move radially outward after undergoing the elastic
ionization collision.
Since electrons have smaller mobility and drift velocity compared to the
ions, the current in the positive column is mainly carried by electrons. An
accumulation of positive charge will increase with time, because an equal number
of charges of both signs are produced in the column, but there is a constant influx of
electrons from the Faraday dark space which constitutes the current. The anode
removes the electrons to the positive end of the column. Ionization in the anode
region by the field of the anode also creates a constant flow of positive ions down
the column. As a result of ionization in the anode region, electrons are driven into
the positive column by the field of the anode. A well defined quantitative
description of the relations between the axial and radial electric field, the pressure,
the tube radius, and the nature of the gas can be given with the elementary theory of
the positive column. The following assumptions were used when the particle
density equations have been derived:
(i) The Debye length and the electron mean free path are sufficiently smaller than
the discharge tube radius.
(ii) The radial density distributions of the particles are homogeneous.
This means that the plasma density at the tube wall can be regarded as zero
and the ion sheath thickness at the wall can be neglected. Assumption (ii) is valid to
the first approximation for both electrons and ions and was often used in the
theoretical studies of positive column, when the process of ambipolar diffusion is
dominant [23, 24, and 25]. Experimental results show that assumption (ii) is also
almost valid for the metastable atoms except for the case of (Ne) gas at high
pressures [26,42].
Using the assumption that ionization rate and diffusion loss are equal:
( λe « R , n+ = ne = n, and (drdn+ ) = (
drdne ) = (
drdn
)), where R is the radius of the
discharge tube , and r is any radial position from the axis of the tube, in a along
14

cylindrical positive column a differential equation for number density can be found
directly from Laplace’s equation by using cylindrical coordinate with symmetric
condition around θ, in the form of:
2
2
drnd +
drdn
r1
+ nDz
a = 0 (2.2)
where z is the number of ionizing collisions per second, and Da is the ambipolar
diffusion coefficient. Without the term zn and with boundary condition n=0 at r =R,
the solution of Equation (2.2) is a Bessel function of zero order:
0nnr
=J0 (2.405 Rr
) (2.3)
where n0 and nr are concentration of the charge at the axis and at a radial distance r
from the axis ( the concentration of charges in a column varies with r in a nearly
parabolic manner), respectively. In addition, in the condition of equality of
ionization frequency and the effective frequency of diffusion loss [20, 42]:
νi(E) = 2ΛaD ≡ νda, Λ = R / 2.4 (2.4)
where νin =
−
drdn
rDa
1
The case zn « νda is realized at low pressure and small transverse dimension
(νda α 1/p Λ 2), at not too high currents, so that n is moderate; it is facilitated in
monatomic gases where the bulk recombination proceeds slower than in molecular
gases.
If zn » νda, the recombination of charges in the bulk dominates over their
diffusion to the walls. If the diffusion term in Eq. (2.2) is dropped, we find νi (E) =
zn , that is , the density is constant over the cross section. In fact a large gradient of
n appears at the absorbing walls, and the diffusion there cannot be neglected.
Electron or ion density changes only slightly near the center of the discharge tube
but drops sharply near the walls [16].
The voltage gradient E in the positive column is given by balancing the
energy that the electrons gain energy from the electric field per second and the
energy they lose by collisions per second, when collision is elastic it is represented
by lelastic and inelastic it is represented by linelastic. Therefore:
15

eEνd = lelastic +linelastic (2.5)
where
( ) eeee
elasticelastic dfe
mGPl νννν2
2
0∫=
∞
(2.6)
and
( )inelasticelastic
inelasticqq
q+
=η (2.7)
( ) eee
ci dvfe
eVPL ννη∫=∞
0 (2.8)
where ( )ef ν is the velocity distribution function, eλ mean free path of the electron,
η ionization and excitation function, Vc critical potential, eν drift velocity, Gelastic
the energy lost in elastic collision, e and m are electron charge and mass,
respectively; P is the pressure, and Te the electron temperature. Assuming the
electron mean free path to be independent of energy, we have (Te α E / P), if
collision frequency is assumed to be constant, we have (Te α (E / P)2 ).It was shown
that except at very low pressures, the electron drift velocity is much lower than the
random one, under the conditions exactly corresponding to the glow discharge
positive column. Roughly speaking, the electron spectrum is said to be Maxwellian
if the frequency of the electron -electron collisions are appreciably higher than the
energy loss frequency [12,16,42]. From the equation of ambipolar flow,
Edrdn
nD
Edrdn
nD
ee
a µµν −−=+−= ++ (2.9)
the radial field:
e
kTdrdn
nDD
drdn
nE e
e
er
11 ≈+−
=+
+
µµ (2.10)
16

and then the potential can be found as:
r
er n
ne
kTV 0ln=− (2.11)
or
−=
e
rr
kTeV
nn exp
0 (2.12)
Showing that the concentrations of charges follow Boltzmann distribution [12,42].
2.5.2 Theory of Positive Column in Magnetic Field
The theory of probes in zero magnetic field rest on two assumptions,
(i) The dimensions of the probe are small compared with the mean free path of
ions and electrons. This means that the probe can be assumed to collect only
a relatively small number of charged particles in the plasma around the
sheath, so outside this sheath the plasma is, to a close approximation,
undisturbed by the presence of the probe.
(ii) The thickness of the space charge sheath surrounding the probe is small
compared with the mean free path of ions and electrons. Thus the sheath can
be treated as a region in which ions and electrons move as in vacuum,
undisturbed by collisions.
With a probe collecting across the magnetic field the validity of assumption (ii)
depends on the sheath thickness d and thus on the plasma density n, the type of gas
and on B. If (ii) holds, the motion of the charged particles is complicated by the
presence of the magnetic field. When (ii) is not valid, electrons make collisions in
the sheath. The net flow across the sheath can be neglected and the spatial
distribution of the electrons follows Boltzmann’s law for particles diffusing in a
potential field, assuming that the velocity distribution of the electrons is
Maxwellian. The presence of the magnetic field does not invalidate this law. Thus
Equation 2.12 is valid.
17

The effect of an axial magnetic field is typically markedly different for
electrons and ions, and depends on the ratio of the appropriate cyclotron frequency
to collision frequency [17].
The electron momentum equation is
( )e
eeBeee n
nmTk
Eme
mB
efZ∇
−−×
−=+
vv (2.13)
where fe corresponds to electron frequency, Z to atomic number, and ne to electron
density.
If we assume B
in z- direction and E
in x-direction and also the variation of ne and
E only in the x – direction then the equation becomes
exeeye
e
eB fZmeB
meE
dxdn
mnTk
v)(v +−−−= (2.14)
and
( ) eyeex fZmeB vv0 +−= (2.15)
and the x motion can be found by substituting (2.14) in (2.13) to be given by
( )( ) dx
dnmn
TkmeE
ZffZ e
e
eB
e
ceexe −−=
+++ 2
21v
ω (2.16)
The effective electron diffusion coefficient in isothermal plasma is thus
( )( )
+++=
2
21
ZffZmTkD
e
ceeeBem
ω (2.17)
and is thus reduced by a factor
+
++
ee
cefZ
Zf1
)(1 2
2ω (2.18)
18

in comparison with the magnetic field and ionization – free case, Customarily this is
written in the form where the ionization is ignored for weakly ionized plasma Z→ 0
[17, 44], i.e.
( )( )ece
eem
f
DD
220
/1 ω+= (2.19)
when ω=0 magnetic field is zero, Dem= D e0.
19

CHAPTER 3
ELECTRICAL LANGMUIR PROBE
3.1 Overview of Langmuir Probes
Irving Langmuir invented electrostatic plasma probes in the year 1924. The
devices which he were developed relatively simple and the first plasma diagnostic
instruments also still bear his name, as electrostatic probes are most commonly
referred to as "Langmuir probes". Electron density, ion density, electron
temperature, plasma potential and floating potential can be measured by probes.
The exactness in measuring these plasma properties rely on the particular condition
in which they are utilized. Their function is limited to cool plasmas which will not
melt or rapidly erode their surfaces because they are material probes that must be
inserted into the plasma. From the aspect of construction and operation they
presents simple methods, but the interpretation of their data can be quite complex
[27].
The Langmuir probe can be interpreted from an experimental point of view
as a simple current collector surface immersed into the plasma environment. Many
different types of probes were developed and used with success in the case of
practical applications. Emissive probes, double probes, capacitive probes,
oscillation probes, probes in flowing or high pressure plasmas, and probes in a
magnetic field are some examples. Our measurements were carried out using
cylindrically shape double probes with 0.175 mm base diameter and 0.5 mm height,
made of tungsten wire. The wire must be well insulated for preventing take-current
collection. Since the Langmuir probe gives local plasma information it must be
mobile and could be locate to any desired point of plasma (radially) chamber's
volume.
The probe technique has a main privilege from almost all other techniques
such as spectroscopy or microwave propagation, which gives information averaged
20

over a large volume of plasma. Probe technique gives possibility to acquire local
information through measurements [28].
3.2 Probe Theory
Usually Langmuir probes consist of one or more metallic, conducting
electrodes immersed into plasma. Simply “The Langmuir probe” is a single
electrode where one conductor is inserted into the plasma. A characteristic property
of the probe is that it is a conducting wire made out of a high temperature metal
such as tungsten or nickel, and is enclosed by an insulating sleeve, usually made out
of a ceramic such as alumina. The conductor expands out of the insulator some
distance to form the probe area. The flow of charge carriers to an electrical probe
can be an extremely complicated one. The requirements to apply the electrical
probe method to such a wide scope of plasma introduce much analysis. This type of
gas discharge is applied by a simplified introduction to the electrical probe method,
as given here. The following assumptions are made:
1- The number densities of electrons and ions are equal.
2- Electron and ion mean free paths are much larger than the probe radius.
3- Probe radius is much larger than the Debye length.
4- There is a Maxwellian distribution of electron and positive ion velocities.
5- Electron temperature (Te) is much larger than the positive ion temperature
(Ti) or (Tgas).
We can define low pressure plasma as one in which a probe of sufficiently
small diameter produces a negligible disturbance to the carrier concentration and in
which the great majority of the applied probe to plasma potential is developed
across a region that is much thinner than the carrier mean free path [29].
In the low density region, it is an ordinary practice in the industry to use the
Orbital Motion Limited (OML) theory of ion collection. Although this theory can
be applied successfully well outside its intended range, its error will be greatly
increased at higher density. In case probe radii (r) is much smaller than the Debye
length λD (thick sheath), and if the potential around the probe decreases more slowly
than r -2, we are in the Orbital Motion Limit (OML) region [30].
21
In this region, ion energy distinguishes itself with an ion impact parameter
that makes the ion hit the probe with a grazing, or tangential incidence. A simple
function depending on the ion initial energy and the probe potential with respect the
plasma defines the maximum impact parameter for hitting the probe. When (rp=D)
increases the OML may break down, where rp is the probe radius and λD is Debye
length (λD (cm) = 743(Te/ne)1/2) Te in volts and ne in cm-3. Since the diameter of our
probes is (0.175 mm) less than 0.2 mm the OML can be used [31, 32].
3.3 Electrical Probe at Low Pressure Discharge
3.3.1 Single Probe
Different shapes of probes exist such as planar, spherical, and cylindrical.
Since a definitive theory describing the attitude of the sheath around the probe and
the ion current expansion exists, in practice often cylindrical probes are used.
Therefore the measurement of positive ions at highly negative voltages and
the calculation of the fast electron current to the probe are allowable. Secondly, in
this way it is possible to use small area probes and thus reduce the effects due to
depletion of low-energy electrons.
Single Langmuir probe measurement of electron temperature is generally
straightforward; on the contrary the measurement of plasma density is more
difficult and contains larger experimental errors. A small error in the estimation of
the plasma potential can result in a large error in the density measurement since the
current below the plasma potential has an exponential dependence on voltage. Since
the low energy electrons are reflected the current collected at the plasma potential is
also strongly influenced by probe cleanliness. There exists limitations for analytical
solutions of the functional dependence on the voltage and therefore using the
electron saturation current of the relation probe radius is difficult. The conditions
are rp/λ << 1 [33, 34].
Therefore the fast computerized three couples of double probe system
(TCDP) has been developed and used in our system.
22

3.3.2 Double Probe
In a system composing of two electrodes, referred to as a "double"
Langmuir probe, they are immersed into the plasma near each other so that they
sample the same plasma properties. Initially both electrodes are floating at
potentials below the plasma potential. For applying a potential difference between
the two electrodes, a power supply is connected between them. While the current
between the probes is recorded, the potential difference is varied using the power
supply.
Since a double Langmuir probe instead of a simple Langmuir probe
generates the possibility keeping the plasma disturbances to a minimum via only a
very small net current drawn from the surrounding plasma, double probe system has
advantages. The current collected in one electrode must be taken from the other
electrode and this fact constrains the current to the double Langmuir probe. Thus
one end of the system is always limited in drawing the ion saturation current at
maximum, which tends to be a very small current.
Figure 3.1: Electrical circuit for double probe measurement.[42]
It can be used for determining the electron temperature and the plasma
density (from the ion saturation current). Under various conditions the double
probes has been studied both theoretically and experimentally, by Johnson and
Malter (1950), Cozens and Von Engel (1965), and Bardley and Mathews (1967)
23

[35, 36, 37] and several researchers as a tool for measurement of plasma
characteristics. The double probe method (DP) make use of two probes, each
similar to the single probe (SP). They are interconnected as shown in Fig.(3.1).
As in the (SP), the (DP) is based on the Boltzman relation and the plasma
sheath properties of a gas discharge, and the electron temperature will be
determined by the way in which Id (discharge current) varies with VP (probe
voltage).
In this case, the probe current will be smaller than the discharge current. In
addition, (DP) is based on an application of Kirchhoff's-current law which requires
in this case that at any instant the total net current of positive ions and electrons
flowing to the system from the plasma must be zero.
An idealized plot of the measured current as a function of the potential
difference, as the latter changes from a fairly large value in one direction to a
similar value in the opposite direction, is shown in Fig. (3.2). For simplicity it is
assumed that the two probes are identical for our case, so that the two portions of
the curve have the same shape.
Figure 3.2: Characteristic of symmetric double probe.[16]
24

Figure 3.3: Double probe potential: (a)Floating potential, no current through
the probes; (b) Left-hand probe is strongly negative, and receives ionic saturation
current.(c) Polarity reversal; the right-hand probe is strongly negative[16].
Suppose the voltage applied from the battery is such as to make probe2,
highly negative with respect to probe1. Probe2 will then collect positive ions at the
maximum rate, so that the observed current is equal to Ii2, the random ion current to
probe2. Probe1 will then collect an equivalent number of electrons, but no ions.
However, since the ions are more slowly collected than the electrons, the maximum
ion current can be measured, rather the maximum possible electron current, which
determines the maximum (absolute) value of the current flowing through the plasma
between the probes.
As the potential of probe 2 is made less negative in Fig. (3.2), the current
remains constant along AB, but in the vicinity of B the potentials are such that some
electrons, in addition to positive ions, are collected at probe2. The absolute
magnitude of the net plasma current IP thus decreases B to C. At C, the external
voltage between the probes is zero; both probes then have the same potential with
respect to the plasma and no current flows Fig. (3.3a).
25

As the direction of the applied voltage is changed, the probe1 now becomes
negative with respect to probe2 Fig. (3.3b), the situations is exactly reversed, and
the curve CDE in Fig. (3.2) is obtained for the current IP , which now flows in the
opposite direction Fig.(3.3c), as a function of the voltage VP applied between the
probes. Thus, DE gives Ii1, the random ion current to probe1, and this will be the
same as Ii2 if the probes are identical.
The total current to the system can never be greater than the saturation ion
current, since any electron current to the total system must always be balanced by
an equal ion current. Thus the disturbance on the discharge is minimized. This has
the disadvantage, however, that only the fast electrons in the tail of the distribution
can never be collected; the bulk of the electron distribution is not sampled.
The condition that the system be floating is:
Ii1 + Ii2 - Ie1 - Ie2 = 0 (3.1)
The current IP in the loop is given by
Ii1 + Ii2 - (Ie1 - Ie2) = 2IP (3.2)
If we add and subtract Eq. (3.1), and Eq. (3.2), we obtain:
IP = Ie1 - Ii1 = Ii2 + Ie2 (3.3)
The current Ie are given by
−
=
−=
e
fee
e
feee kT
eVm
kTAn
kTeV
AnI exp2
exp41 2/1
πν (3.4)
where n is the electron density, A is the probe area, eν is the average electron
velocity, Vf is the floating potential, and Te is the electron temperature in K0.
Calculated value for RL (Larmour radius) by Equation (3.5) for ions is 2.973 x 10⁻⁴
m and RL for electrons is 1,297 x 10-2 m.
26

Also, since RL is very small with respect to λD (Debye length), which is
proportional to 2/1
e
enT in our case Eq. (3.4) is applicable.
eB
mvR e
L = (3.5)
.
For the electron current density to a probe in the transition region:
−=
eree kT
eVjAI 1111 exp (3.6)
and
−=
eree kT
eVjAI 2222 exp (3.7)
Here Ire = Ajre is the random electron current, and jre is the random electron current
density. Substituting this into the first of Eq. (3.3) and using
(V = V1-V2 > 0), we have:
−=
+−=
−=+
ee
ere
ereiP kT
eVIAA
kTVVejA
kTeVjAII exp)(expexp 2
2
1211
1111 (3.8)
From the second part of Eq. (3.3),
−=
−+
ePi
iP
kTeV
AA
IIII
exp2
1
2 (3.9)
The basic assumption of this theory is that the probes are always negative enough to
be collecting essentially saturation ion current; therefore, Ii can be accurately
estimated at any V by a smoothly extrapolating the saturation portion of the double-
probe characteristic.
Since we have probes with equal area (A1 = A2) then Ii ≈ Ii1 ≈ I i2, the formula:
27
02tanh I
RV
TVII
eViP ++
= (3.11)
has been used [28, 38] to fit the experimental curve accurately for all of (TCDP),
where R accounts for the effects of sheath expansion on probe current (Ii) as well as
leakage current between the electrodes (due to the possible contamination), and I0
account for any displacement current due to a time varying floating potential and
the difference in stray capacitance to ground for each electrode.
However, our small correction to fit this formula to the I - V characteristics, which
are shifted from the original point, is that:
( ) ( )
000
2tanh I
RVV
TVVII
eVP +
−+
−= (3.12)
where V0 is any constant, which can be fixed after getting a good result, then start
the fit method "Levenberg -Marquardt algorithm" from the beginning.
Therefore, the electron temperature can be determined directly from the fit
parameters [39].The electron density ne ≈ ni (assuming quasi-neutrality, and usually
equal to the plasma density n), is obtained from the formula :
2/12/3
=
i
eVP M
TAneI (3.13)
where TeV is the electron temperature in eV , e is the electron charge, A is the probe
tip area, and Mi is the ion mass. The assumptions involved in the application of Eq.
(3.2) are that the electron velocities are isotopic and Maxwellian, and that the sheath
is collisionless. As the ratio (rp/λD) increases, Eq. (3.12) is no longer applicable [31,
40].
A Langmuir probe immersed in plasma will, under equilibrium conditions,
assume a negative potential (the floating potential) with respect to the plasma, so
that the random electron current density at the probe surface is attenuated from its
bulk plasma value to a quantity equal to the random ion current density.
Then the floating potential Vf is defined by Ip = Ie. Then by setting Eq. (3.4,
and 3.12) equal yields:
28

−=
mMT
V ieVf π
2ln
2(3.14)
Since Vf = 5Te , the sheath is well established at this potential, and the
expected
Ii(Vf ) can be calculated without the uncertainties inherent in extrapolation to the
space potential Vs(= 0) due to the weak ion accelerating field there[41].
29

CHAPTER 4
EXPERIMENTAL APPARATUS
4.1 Discharge Tube and Double Probe System
Figure 4.1: Schematic diagram of experimental apparatus.
Fig.( 4.1) is the schematic diagram of the apparatus used as a discharge
reactor system which is made of pyrex glass. Since, discharge tube with variable
diameters in the same system of glow discharge has not studied very well until now.
30
B

The outer glass is (uniform cylindrical) of length (30 cm) with inner diameter
(5.6cm) and the internal one is (nonuniform) fixed to the external glass. It is
constructed in a way that the diameter has been changed from the cathode to the
anode but with symmetry in the middle point. The diameters for regions near
electrodes are (4.2 cm), but in the middle is (2.8 cm). Argon has been used as a
discharge gas, since it has the advantage of a relatively complete set cross section
and a minimum of discharge chemistry.
Because of high melting point as well as low sputtering yield, the cylindrical
type of tungsten wire has been used as a probe, and coated with capillary Pyrex
tube. The tips of cylindrical double probes are equal in length (0.5 mm) with radius
(rp = 0.0875 mm). An external adjustment method (magnetic effect on a cylindrical
iron placed at the probe ports) has been used to change the radial position of the
probes. The iron cylinder is covered with a glass tubing to avoid any chance of
contamination in cell atmosphere. The moveable (TCDP) was inserted into the
plasma through the orifice in the tube wall perpendicularly to the discharge axis,
and they were fixed near the axis of internal discharge tube. The distance between
each couple of probes is 5 cm in the axial direction.
Using one side of the each double probe as a fixed probe at the center and
moving the other probe, the measurements of the radial potential gradient has been
done at constant pressure (0.7 torr). Since, the distance between each couple of
probe will not be very large (1.9 cm for probe 1 and 3, and 1.2 cm for probe 3) such
that the plasma parameters could not different, where the probes are located.
A computer-controlled data acquisition (from National Instrument) has been
employed for this work. The system consists of a compatible PC hosting a DAQ
card (NI 6014, 16 bit and 200KS/s). The input voltage will be controlled by (DAC)
(digital-to-analog converter), by generating the square wave. Therefore, the current
from each probe is recorded for each voltage step at a sampling rate of up to 75 Hz
[37].
The National Instrument (SC-2345) Series which is the enclosure for SCC
signal conditioning modules connect directly to 68-pin ADQ device. The SCC-
AO10 is an isolated voltage output module with an output range of ±10 V. The
output voltage level is controlled by the DAC output of an E Series ADQ device
using LabVIEW programme. This ±10 V will be amplified to a ±75 V output with
31

PA85 (high voltage operational amplifier) to the probe. The currents flowing in the
probe circuit (there are three separate circuits) Fig.(4.2) and Fig. (4.3) can be
detected using the (AD620) from Analog Device. It is a low cost, high accuracy
instrumentation amplifier that requires only one external resistance to set gains
(programmable gain with bandwidth 120 kHz at G =100) of 1 to 1000.
Figure 4.2: Schematic diagram of the double probe diagnostic system.[42]
Hence, the probe circuit has been developed, and can be used for
magnetized plasma or slowly oscillating systems. In addition, the SCC- AI Series
isolated analog input modules (SCC-AI03 with input impedance 100MΩ) can
extract a relatively low-amplitude input signal from a high-common-mode voltage,
so the E Series DAQ device can measure the input signals. It can also amplify and
filter the input signal (with bandwidth 10 kHz), resulting in higher measurement
resolution and accuracy. The inputs are designed in a floating (non-referenced)
single-ended configuration. LabVIEW Express program has been used to control
the whole system, and the three regions have been checked simultaneously in a very
short time, approximately 0.5 ms for each probe.
32

Figure 4.3: The electronic parts of the isolated computer controlled three couples of
double probe (TCDP) system. [42]
4.2 The Pressure Measurement System
The experiments are performed using two-stage vacuum pump (mechanical
and oil diffusion) to evacuate the whole system down to 10-4 torr. The chamber
pressure was controlled with wide range gauge an MKS SensaVac Series 953
Pirani/Cold Cathode Ionization Vacuum Gauge (from 10-9 torr to atmosphere).
An analog-to- digital converter has been used as a digital gauge pressure
with an input voltage (0-4 volt) for Pirani (for range until 10-4 torr) or (0-7 volt) for
the cold cathode (for range 10-2 to 10-9 torr).
33

CHAPTER 5
RESULTS AND DISCUSSION
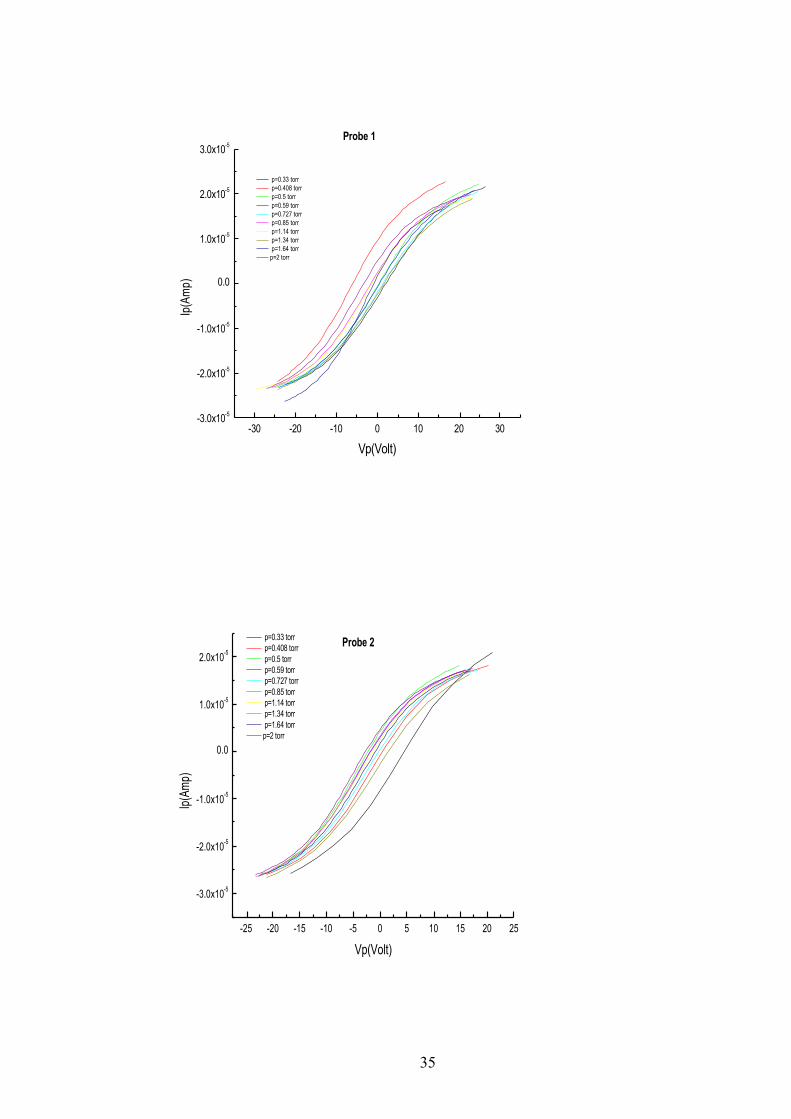
5.1 Current-Voltage Characteristics:
A series of (I- V ) measurements, as shown in Figs.( 5.1, 5.2, 5.3, 5.4, 5.5 ,
5.6), demonstrating the effect of the low and high discharge currents, have been
carried out to investigate the behavior of electric discharge in the tube over a certain
range of argon gas pressures and discharge currents for all three double probes at
the same time. Magnetic field is calculated according to formula (5.1)
nIB 0µ= (5.1)
where n=N(number of winding)/L(length of selenoid). In the experiment three
different values of current is applied and therefore magnetic field has three different
values.
======
=−−−
AIforTBAIforTBAIforTB
B4010 94,5330 10 45,422010 97,21
222
Magnetic field values are classified with respect to their increasing values as
B1, B2 and B3. All the three magnetic field values has two branches with two
different discharge currents. The smallest magnetic field (B1) values with two
different discharge current (Id=5 mA and Id=15 mA) affects in the same way as the
largest valued magnetic field (B3). All measurements have been done at discharge
currents (Id = 5 mA, 15 mA), and pressure ranges (p = 0.3 – 2.1 torr), when the
probes 1,3, and 2 are fixed radially at the distance 1.7 cm, and 1 cm from the wall of
the inner tube, respectively.
34
-30 -20 -10 0 10 20 30-3.0x10⁻⁵
-2.0x10⁻⁵
-1.0x10⁻⁵
0.0
1.0x10⁻⁵
2.0x10⁻⁵
3.0x10⁻⁵
Ip(A
mp)
Vp(Volt)
p=0.33 torr p=0.408 torr p=0.5 torr p=0.59 torr p=0.727 torr p=0.85 torr p=1.14 torr p=1.34 torr p=1.64 torr p=2 torr
Probe 1
-25 -20 -15 -10 -5 0 5 10 15 20 25
-3.0x10⁻⁵
-2.0x10⁻⁵
-1.0x10⁻⁵
0.0
1.0x10⁻⁵
2.0x10⁻⁵
Ip(Am
p)
Vp(Volt)
p=0.33 torr p=0.408 torr p=0.5 torr p=0.59 torr p=0.727 torr p=0.85 torr p=1.14 torr p=1.34 torr p=1.64 torr p=2 torr
Probe 2
35

-30 -20 -10 0 10 20 30
-3.0x10⁻⁵
-2.0x10⁻⁵
-1.0x10⁻⁵
0.0
1.0x10⁻⁵
2.0x10⁻⁵
Ip(Am
p)
Vp(Volt)
p=0.33 torr p=0.408 torr p=0.5 torr p=0.59 torr p=0.727 torr p=0.85 torr p=1.14 torr p=1.34 torr p=1.64 torr p=2 torr
Probe 3
Figure 5.1: Double probe characteristic in argon gas at Id = 5 mA (at fixed radial distance (1.7 cm), and (1 cm) for probes 1, 3 and 2 respectively), and different pressures.(I=20 Amp B1)
36

-30 -20 -10 0 10 20 30-3.0x10⁻⁵
-2.0x10⁻⁵
-1.0x10⁻⁵
0.0
1.0x10⁻⁵
2.0x10⁻⁵
3.0x10⁻⁵
Ip(A
mp)
Vp(Volt)
p=0.408 torr p=0.5 torr p=0.59 torr p=0.727 torr p=0.85 torr p=1.14 torr p=1.34 torr p=1.64 torr p=2 torr
Probe 1
-30 -25 -20 -15 -10 -5 0 5 10 15 20 25
-3.0x10⁻⁵
-2.0x10⁻⁵
-1.0x10⁻⁵
0.0
1.0x10⁻⁵
2.0x10⁻⁵
3.0x10⁻⁵
Ip(A
mp)
Vp(Volt)
p=0.33 torr p=0.408 torr p=0.5 torr p=0.59 torr p=0.727 torr p=0.85 torr p=1.14 torr p=1.34 torr p=1.64 torr p=2 torr
Probe 2
37

-30 -20 -10 0 10 20 30-3.0x10⁻⁵
-2.0x10⁻⁵
-1.0x10⁻⁵
0.0
1.0x10⁻⁵
2.0x10⁻⁵
Ip(Am
p)
Vp(Volt)
p=0.33 torr p=0.408 torr p=0.5 torr p=0.59 torr p=0.727 torr p=0.85 torr p=1.14 torr p=1.34 torr p=1.64 torr p=2 torr
Probe 3
Figure 5.2: Double probe characteristic in argon gas at Id =15 mA (at fixed radial distance (1.7 cm), and (1 cm) for probes 1, 3 and 2 respectively), and different pressures.(B1)
-30 -20 -10 0 10 20 30-3.0x10⁻⁵
-2.0x10⁻⁵
-1.0x10⁻⁵
0.0
1.0x10⁻⁵
2.0x10⁻⁵
3.0x10⁻⁵
Ip(Am
p)
Vp(Volt)
p=0.33 torr p=0.408 torr p=0.5 torr p=0.59 torr p=0.727 torr p=0.85 torr p=1.14 torr p=1.34 torr p=1.64 torr p=2 torr
Probe 1
38
-30 -20 -10 0 10 20
-3.0x10⁻⁵
-2.0x10⁻⁵
-1.0x10⁻⁵
0.0
1.0x10⁻⁵
2.0x10⁻⁵
3.0x10⁻⁵
Ip(Am
p)
Vp(Volt)
p=0.33 torr p=0.408 torr p=0.5 torr p=0.59 torr p=0.727 torr p=0.85 torr p=1.14 torr p=1.34 torr p=1.64 torr p=2 torr
Probe 2
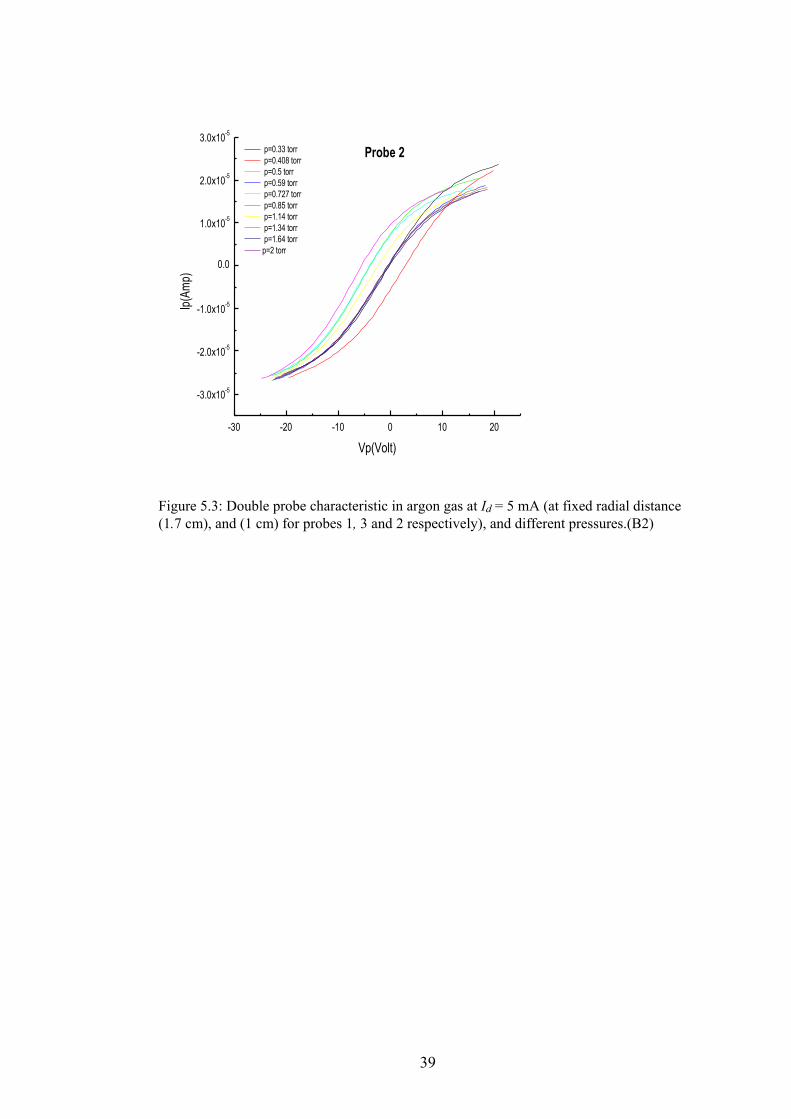
Figure 5.3: Double probe characteristic in argon gas at Id = 5 mA (at fixed radial distance (1.7 cm), and (1 cm) for probes 1, 3 and 2 respectively), and different pressures.(B2)
39

-30 -20 -10 0 10 20 30-3.0x10⁻⁵
-2.0x10⁻⁵
-1.0x10⁻⁵
0.0
1.0x10⁻⁵
2.0x10⁻⁵
3.0x10⁻⁵
Ip(A
mp)
Vp(Volt)
p=0.33 torr p=0.408 torr p=0.5 torr p=0.59 torr p=0.727 torr p=0.85 torr p=1.14 torr p=1.34 torr p=1.64 torr p=2 torr
Probe 1
-30 -20 -10 0 10 20
-3.0x10⁻⁵
-2.0x10⁻⁵
-1.0x10⁻⁵
0.0
1.0x10⁻⁵
2.0x10⁻⁵
Ip(V
olt)
Vp(Volt)
p=0.33 torr p=0.408 torr p=0.5 torr p=0.59 torr p=0.727 torr p=0.85 torr p=1.14 torr p=1.34 torr p=1.64 torr p=2 torr
Probe 2
40
-30 -20 -10 0 10 20 30
-3.0x10⁻⁵
-2.0x10⁻⁵
-1.0x10⁻⁵
0.0
1.0x10⁻⁵
2.0x10⁻⁵
Ip(A
mp)
Vp(Volt)
p=0.33 torr p=0.408 torr p=0.5 torr p=0.59 torr p=0.727 torr p=0.85 torr p=1.14 torr p=1.34 torr p=1.64 torr p=2 torr
Probe 3
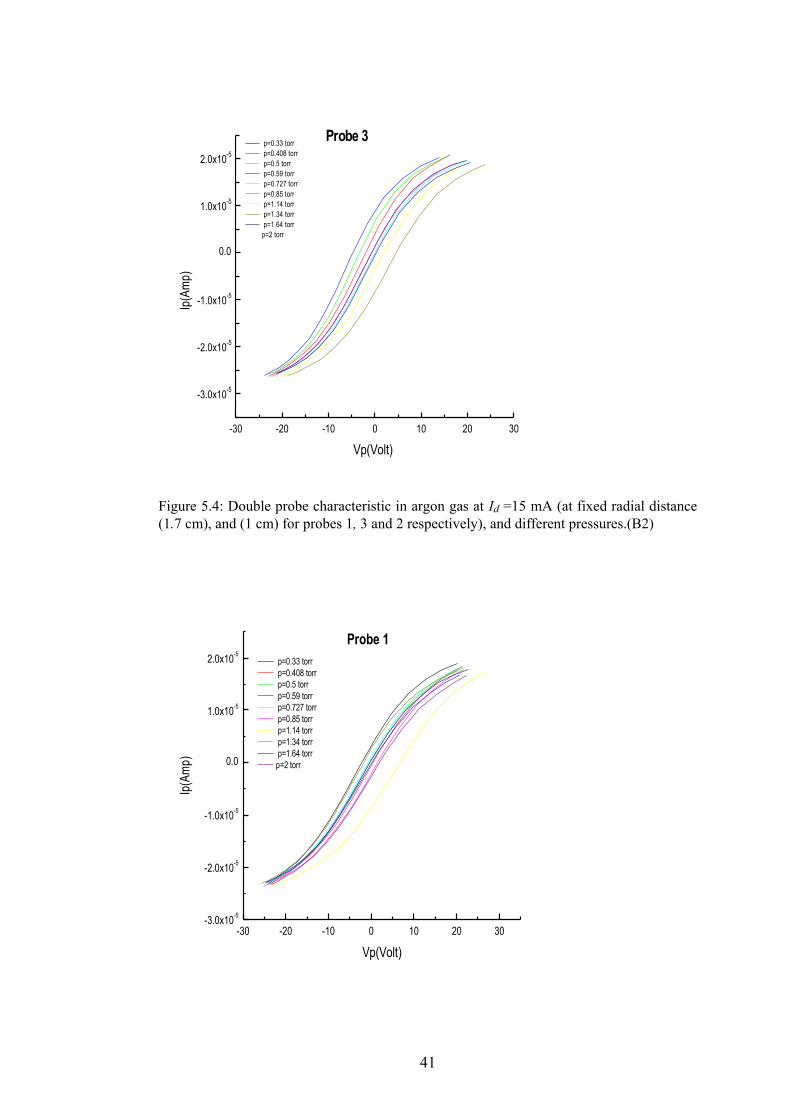
Figure 5.4: Double probe characteristic in argon gas at Id =15 mA (at fixed radial distance (1.7 cm), and (1 cm) for probes 1, 3 and 2 respectively), and different pressures.(B2)
-30 -20 -10 0 10 20 30-3.0x10⁻⁵
-2.0x10⁻⁵
-1.0x10⁻⁵
0.0
1.0x10⁻⁵
2.0x10⁻⁵
Ip(A
mp)
Vp(Volt)
p=0.33 torr p=0.408 torr p=0.5 torr p=0.59 torr p=0.727 torr p=0.85 torr p=1.14 torr p=1.34 torr p=1.64 torr p=2 torr
Probe 1
41

-30 -20 -10 0 10 20 30
-3.0x10⁻⁵
-2.0x10⁻⁵
-1.0x10⁻⁵
0.0
1.0x10⁻⁵
2.0x10⁻⁵
Ip(Am
p)
Vp(Volt)
p=0.33 torr p=0.408 torr p=0.5 torr p=0.59 torr p=0.727 torr p=0.85 torr p=1.14 torr p=1.34 torr p=1.64 torr p=2 torr
Probe 2
-30 -20 -10 0 10 20 30
-3.0x10⁻⁵
-2.0x10⁻⁵
-1.0x10⁻⁵
0.0
1.0x10⁻⁵
2.0x10⁻⁵
Ip(Am
p)
Vp(Volt)
p=0.33 torr p=0.408 torr p=0.5 torr p=0.59 torr p=0.727 torr p=0.85 torr p=1.14 torr p=1.34 torr p=1.64 torr p=2 torr
Probe 3
Figure 5.5: Double probe characteristic in argon gas at Id =5 mA (at fixed radial distance (1.7 cm), and (1 cm) for probes 1, 3 and 2 respectively), and different pressures.(B3)
42

-30 -20 -10 0 10 20 30-3.0x10⁻⁵
-2.0x10⁻⁵
-1.0x10⁻⁵
0.0
1.0x10⁻⁵
2.0x10⁻⁵
3.0x10⁻⁵
Ip(A
mp)
Vp(Volt)
p=0.33 torr p=0.408 torr p=0.5 torr p=0.59 torr p=0.727 torr p=0.85 torr p=1.14 torr p=1.34 torr p=1.64 torr p=2 torr
Probe 1
-25 -20 -15 -10 -5 0 5 10 15 20 25
-3.0x10⁻⁵
-2.0x10⁻⁵
-1.0x10⁻⁵
0.0
1.0x10⁻⁵
2.0x10⁻⁵
3.0x10⁻⁵
Ip(A
mp)
Vp(Volt)
p=0.33 torr p=0.408 torr p=0.5 torr p=0.59 torr p=0.727 torr p=0.85 torr p=1.14 torr p=1.34 torr p=1.64 torr p=2 torr
Probe 2
43

-30 -20 -10 0 10 20-3.0x10⁻⁵
-2.0x10⁻⁵
-1.0x10⁻⁵
0.0
1.0x10⁻⁵
2.0x10⁻⁵
3.0x10⁻⁵
Ip(A
mp)
Vp(Volt)
p=0.33 torr p=0.408 torr p=0.5 torr p=0.59 torr p=0.727 torr p=0.85 torr p=1.14 torr p=1.34 torr p=1.64 torr p=2 torr
Probe 3
Figure 5.6: Double probe characteristic in argon gas at Id = 15 mA (at fixed radial distance (1.7 cm), and (1 cm) for probes 1, 3 and 2 respectively), and different pressures.(B3)
44
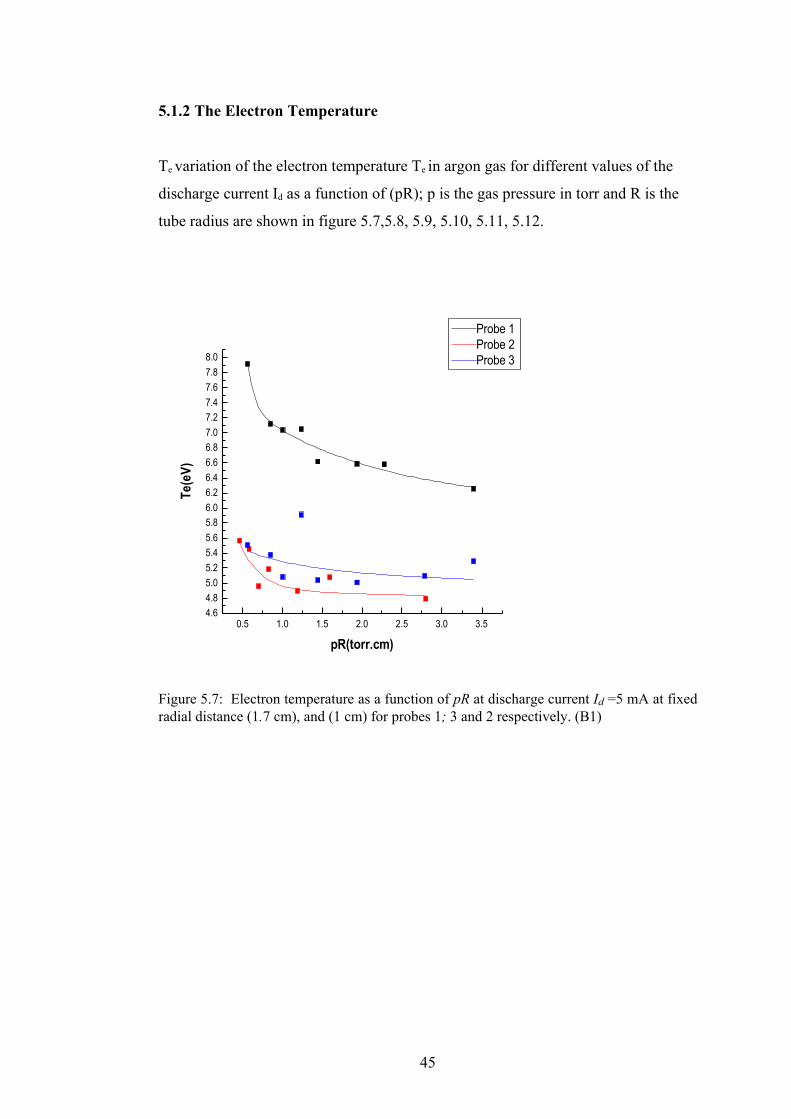
5.1.2 The Electron Temperature
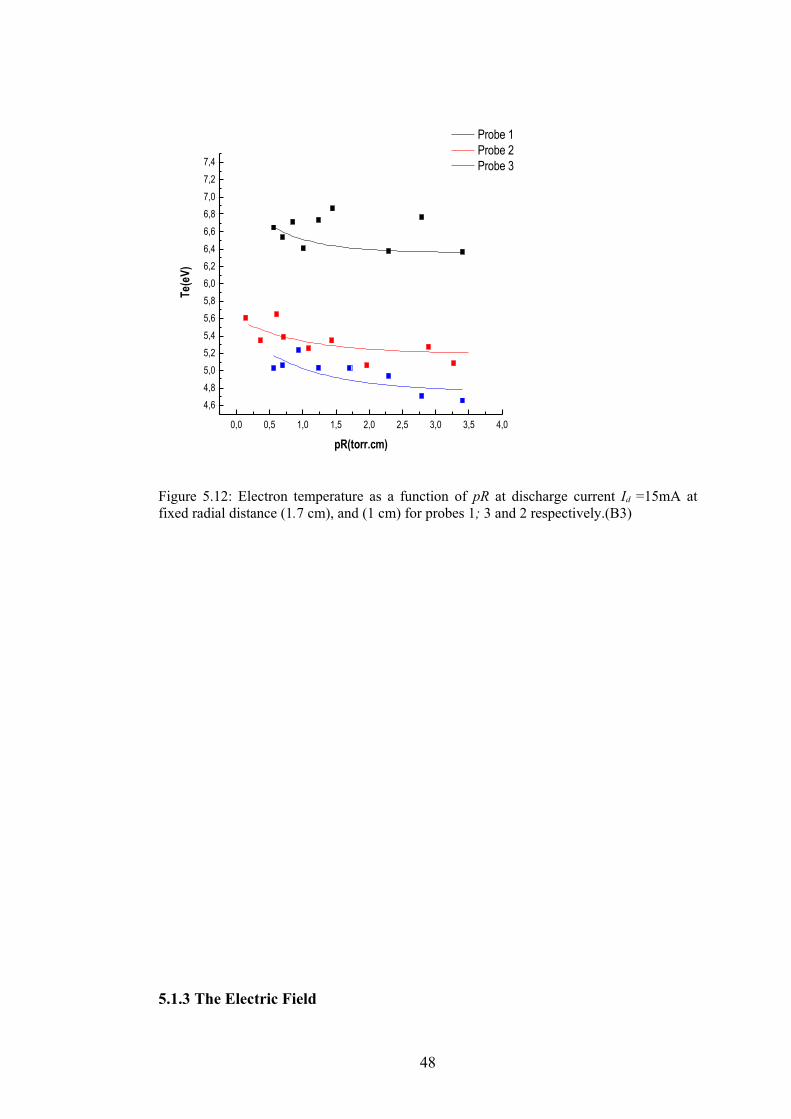
Te variation of the electron temperature Te in argon gas for different values of the
discharge current Id as a function of (pR); p is the gas pressure in torr and R is the
tube radius are shown in figure 5.7,5.8, 5.9, 5.10, 5.11, 5.12.
0.5 1.0 1.5 2.0 2.5 3.0 3.54.64.85.05.25.45.65.86.06.26.46.66.87.07.27.47.67.88.0
Te(e
V)
pR(torr.cm)
Probe 1Probe 2 Probe 3
Figure 5.7: Electron temperature as a function of pR at discharge current Id =5 mA at fixed radial distance (1.7 cm), and (1 cm) for probes 1; 3 and 2 respectively. (B1)
45

0.5 1.0 1.5 2.0 2.5 3.0 3.5
5.0
5.5
6.0
6.5
7.0
7.5
Te(e
V)
pR(torr.cm)
Probe 1Probe 2 Probe 3
Figure 5.8: Electron temperature as a function of pR at discharge current Id =15 mA at fixed radial distance (1.7 cm), and (1 cm) for probes 1; 3 and 2 respectively.(B1)
0.0 0.5 1.0 1.5 2.0 2.5 3.0 3.5
5.0
5.2
5.4
5.6
5.8
6.0
6.2
6.4
6.6
6.8
7.0
7.2
7.4
7.6
Te(e
V)
pR(torr.cm)
Probe 1 Probe 2 Probe 3
Figure 5.9: Electron temperature as a function of pR at discharge current Id =5 mA at fixed radial distance (1.7 cm), and (1 cm) for probes 1; 3 and 2 respectively.(B2)
46
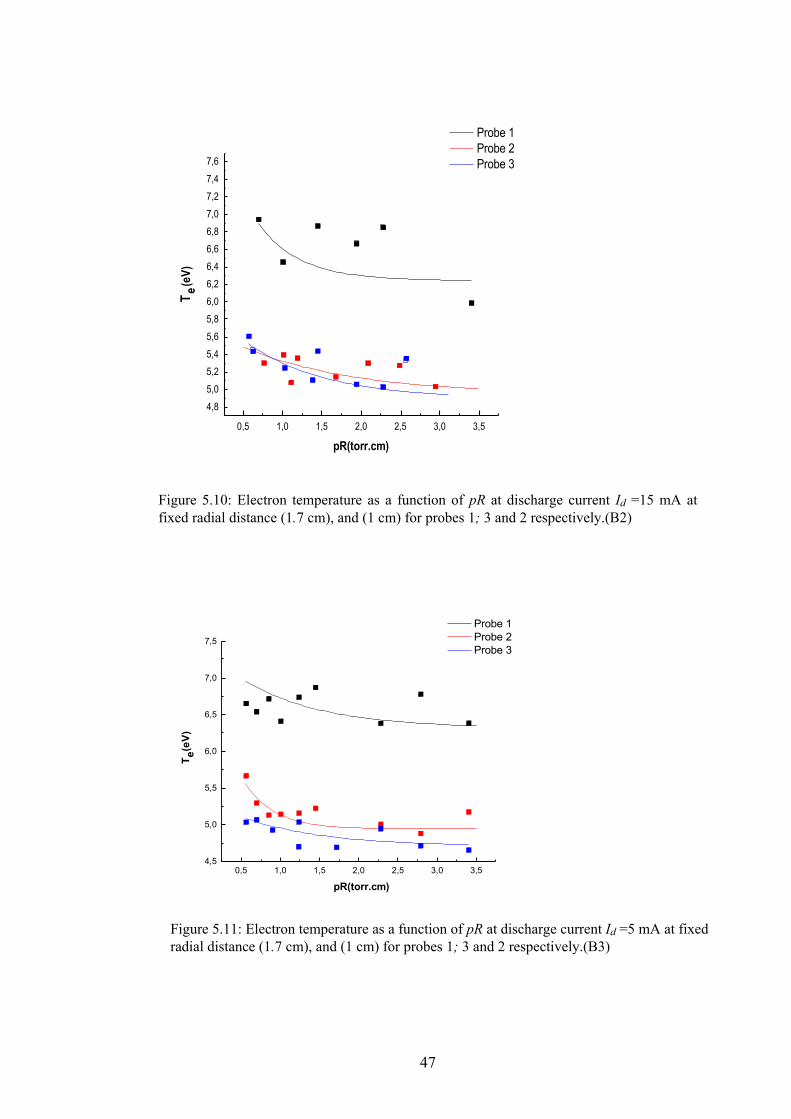
0,5 1,0 1,5 2,0 2,5 3,0 3,5
4,8
5,0
5,2
5,4
5,6
5,8
6,0
6,2
6,4
6,6
6,8
7,0
7,2
7,4
7,6
T e(eV)
pR(torr.cm)
Probe 1 Probe 2 Probe 3
Figure 5.10: Electron temperature as a function of pR at discharge current Id =15 mA at fixed radial distance (1.7 cm), and (1 cm) for probes 1; 3 and 2 respectively.(B2)
0,5 1,0 1,5 2,0 2,5 3,0 3,54,5
5,0
5,5
6,0
6,5
7,0
7,5
T e(e
V)
pR(torr.cm)
Probe 1 Probe 2 Probe 3
47
Figure 5.11: Electron temperature as a function of pR at discharge current Id =5 mA at fixed radial distance (1.7 cm), and (1 cm) for probes 1; 3 and 2 respectively.(B3)
0,0 0,5 1,0 1,5 2,0 2,5 3,0 3,5 4,0
4,6
4,8
5,0
5,2
5,4
5,6
5,8
6,0
6,2
6,4
6,6
6,8
7,0
7,2
7,4
Te(e
V)
pR(torr.cm)
Probe 1 Probe 2 Probe 3
Figure 5.12: Electron temperature as a function of pR at discharge current Id =15mA at fixed radial distance (1.7 cm), and (1 cm) for probes 1; 3 and 2 respectively.(B3)
5.1.3 The Electric Field
48

Another important parameters, for the description of the positive column behavior is
the axial electric field E. As can be seen from Fig.( 5.13, 5.14, 5.15, 5.16 , 5.17,
5.18). The electric field, in general, decreases with increasing pR values. Since, as
the electron temperature decreases with increasing the pressure according to the
ambipolar diffusion theory by Schottky [17], E tends to decrease as pR decrease.
0,0 0,5 1,0 1,5 2,0 2,5 3,0 3,517
18
19
20
21
22
23
24
25
26
27
28
29
30
31
E(Vo
lt/cm
)
pR(torr.cm)
Probe 1 Probe 2 Probe 3
49
Figure 5.13: Axial electric field as a function of pR at discharge current (a) Id = 5 mA, (1 cm) for probes 1; 3 and 2 respectively.(B1)

0,5 1,0 1,5 2,0 2,5 3,0 3,518
19
20
21
22
23
24
25
26
27
28
E(Vo
lt/cm
)
pR(torr.cm)
Probe 1 Probe 2 Probe 3
Figure 5.14: Axial electric field as a function of pR at discharge current Id = 15mA, (at fixed radial distance (1.7 cm), and (1 cm) for probes 1, 3 and 2 respectively), and different pressures.(B1)
50
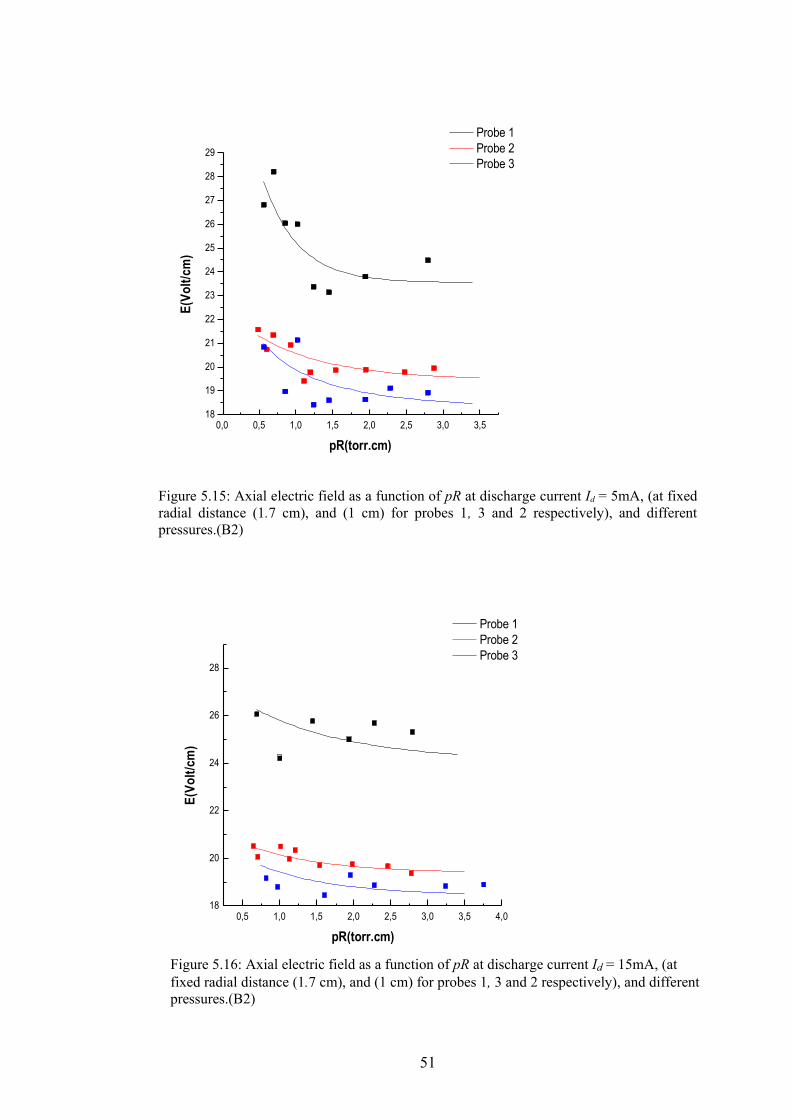
0,0 0,5 1,0 1,5 2,0 2,5 3,0 3,518
19
20
21
22
23
24
25
26
27
28
29
E(Vo
lt/cm
)
pR(torr.cm)
Probe 1 Probe 2 Probe 3
Figure 5.15: Axial electric field as a function of pR at discharge current Id = 5mA, (at fixed radial distance (1.7 cm), and (1 cm) for probes 1, 3 and 2 respectively), and different pressures.(B2)
0,5 1,0 1,5 2,0 2,5 3,0 3,5 4,018
20
22
24
26
28
E(Vo
lt/cm
)
pR(torr.cm)
Probe 1 Probe 2 Probe 3
51
Figure 5.16: Axial electric field as a function of pR at discharge current Id = 15mA, (at fixed radial distance (1.7 cm), and (1 cm) for probes 1, 3 and 2 respectively), and different pressures.(B2)

0.5 1.0 1.5 2.0 2.5 3.0 3.5
18
20
22
24
26
28E(
Volt/
cm)
pR(torr.cm)
Probe 1Probe 2 Probe 3
Figure 5.17: Axial electric field as a function of pR at discharge current Id = 5mA, (at fixed radial distance (1.7 cm), and (1 cm) for probes 1, 3 and 2 respectively), and different pressures. (B3)
52

0,5 1,0 1,5 2,0 2,5 3,0 3,5
17,518,018,519,019,520,020,521,021,522,022,523,023,524,024,525,025,526,026,527,0
E(Vo
lt/cm
)
pR(torr.cm)
Probe 1 Probe 2 Probe 3
Figure 5.18: Axial electric field as a function of pR at discharge current Id = 15mA, (at fixed radial distance (1.7 cm), and (1 cm) for probes 1, 3 and 2 respectively), and different pressures. (B3)
53
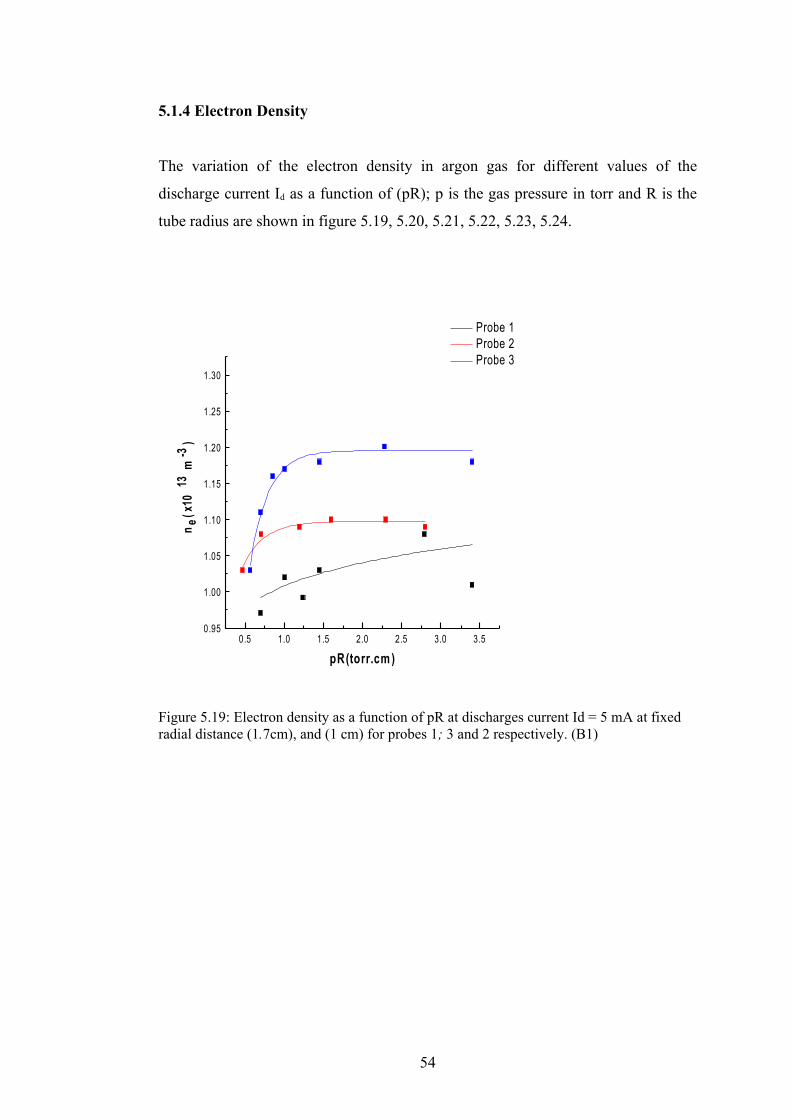
5.1.4 Electron Density
The variation of the electron density in argon gas for different values of the
discharge current Id as a function of (pR); p is the gas pressure in torr and R is the
tube radius are shown in figure 5.19, 5.20, 5.21, 5.22, 5.23, 5.24.
0.5 1.0 1.5 2.0 2.5 3.0 3.50.95
1.00
1.05
1.10
1.15
1.20
1.25
1.30
n e( x
1013
m-3
)
pR(torr.cm )
Probe 1 Probe 2 Probe 3
54
Figure 5.19: Electron density as a function of pR at discharges current Id = 5 mA at fixed radial distance (1.7cm), and (1 cm) for probes 1; 3 and 2 respectively. (B1)
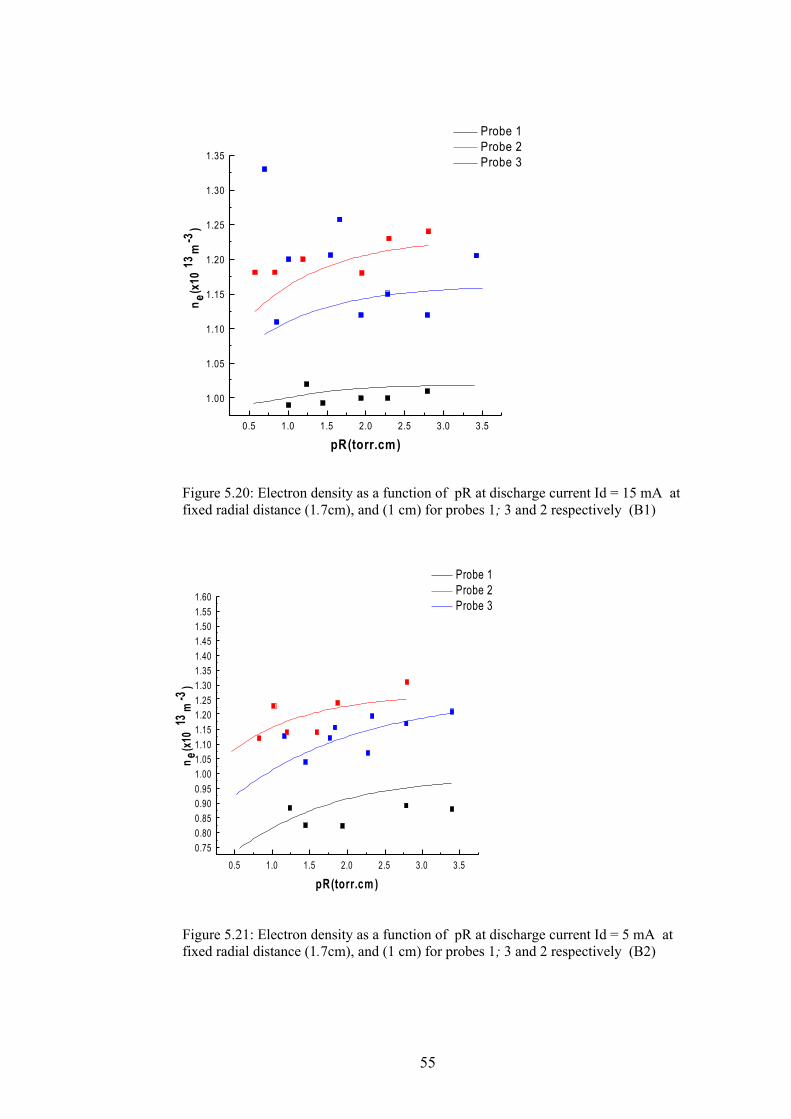
0.5 1.0 1.5 2.0 2.5 3.0 3.5
1.00
1.05
1.10
1.15
1.20
1.25
1.30
1.35
n e(x10
13m
-3)
pR(torr.cm)
Probe 1 Probe 2 Probe 3
0.5 1.0 1.5 2.0 2.5 3.0 3.5
0.750.800.850.900.951.001.051.101.151.201.251.301.351.401.451.501.551.60
n e(x10
13m
-3)
pR(torr.cm )
Probe 1 Probe 2 Probe 3
55
Figure 5.20: Electron density as a function of pR at discharge current Id = 15 mA at fixed radial distance (1.7cm), and (1 cm) for probes 1; 3 and 2 respectively (B1)
Figure 5.21: Electron density as a function of pR at discharge current Id = 5 mA at fixed radial distance (1.7cm), and (1 cm) for probes 1; 3 and 2 respectively (B2)

0.5 1.0 1.5 2.0 2.5 3.0 3.50.80
0.85
0.90
0.95
1.00
1.05
1.10
1.15
1.20
1.25n e(x1
013
m-3
)
pR(torr.cm )
Probe 1 Probe 2 Probe 3
0.0 0.5 1.0 1.5 2.0 2.5 3.0 3.5
0.8
0.9
1.0
1.1
1.2
1.3
n e(x
1013
m-3
)
pR(torr.cm )
Probe 1 Probe 2 Probe 3
56
Figure 5.22: Electron density as a function of pR at discharge current Id = 15 mA at fixed radial distance (1.7cm), and (1 cm) for probes 1; 3 and 2 respectively (B2)
Figure 5.23: Electron density as a function of pR at discharge current Id = 5 mA at fixed radial distance (1.7cm), and (1 cm) for probes 1; 3 and 2 respectively (B3)

0.5 1.0 1.5 2.0 2.5 3.0 3.5
0.85
0.90
0.95
1.00
1.05
1.10
1.15
1.20n e(x1
013
m-3
)
pR(torr.cm)
Probe 1 Probe 2 Probe 3
57
Figure 5.24: Electron density as a function of pR at discharge current Id = 15 mA at fixed radial distance (1.7cm), and (1 cm) for probes 1; 3 and 2 respectively (B3)

CHAPTER 6
CONCLUSION AND DISCUSSION
6.1 Conclusion
The non-uniform positive column argon DC glow discharge plasma has
been investigated experimentally. To measure all plasma parameters, the
computerized three dual Langmuir probe array set-up has been used with optically
isolated circuit. This is to prevent stray capacitance to ground which can be a major
source of error at the turn-on and turn-on transients. With 10 kHz low-pass filters a
very good resolution and accuracy have been measured, and give a possibility to use
it in a magnetized plasma and low frequency oscillating plasma systems.
The effect of the magnetic field is discused, and it is seen that Schottky
theory well describes the spread positive column. It can be seen from the Figures
5.20, 5.22, 5.24 that at high discharge currents and low prossure values the positive
column spreads laterally to the wall. It can be observed from the Figures 5.8, 5.10,
and 5.12 that the magnetic field reduces the electron temperature from the value
given by the Langmuir curve to that given by the Schottky theory. [42, 43]
The results of I-V measurements, which can be seen from Fig. (5.1, 5.2, 5.3,
5.4, 5.5, and 5.6) demonstrate that as the pressure increases the characteristic curve
will shift toward the negative direction. The current-voltage characteristic has been
shifted toward the negative direction with increasing the pressure, and the probe
current in the double probe technique decreases with the increasing pR.
The result of Te as a function of pR measurements, which can be seen from
Fig. (5.7, 5.8, 5.9, 5.10, 5.11, and 5.12) demonstrates that the electron temperature
for all regions tends to decrease as the product pR increases. The electron
temperature decreases with increasing pR and increasing magnetic field decreases
generally their values.
58

Generally for the different magnetic field values, there exists a tendency for
Probe 1 that this probe has greater values compared to the Probe 2 and Probe 3 but
in the case of without magnetic field this difference between the probes can not be
observed [42]. The order of electron temperature values from highest to lowest is
P1>P3>P2 for discharge current value 5 mA and magnetic field value B1 but for
all the other cases the order is like P1>P2>P3. We observed that the electron
temperature values decreased with increasing discharge currents for all the three
probes.
Another important parameters, for the description of the positive column
behavior is the axial electric field E. As can be seen from Fig.( 5.13, 5.14, 5.15,
5.16 , 5.17 and 5.18), the electric field, in general, decreases with increasing pR
values. Since, as the electron temperature decreases with increasing the pressure
according to the ambipolar diffusion theory by Schottky [17], E tends to decrease as
pR decrease.
Generally, the electric field values, for the different magnetic fields (B1, B2
and B3) have a tendency that the electric field at Probe 1 has greater values
compared to the Probe 2 and Probe 3 but in the case of without magnetic field this
difference for electric field values between the probes can not be observed [42]. The
order of electric field values from highest to lowest is P1>P2>P3 for all cases. We
observed that the electric field values decreased with increasing discharge current.
The variation of the electron density in argon gas for different values of the
discharge current Id as a function of (pR); p is the gas pressure in torr and R is the
tube radius are shown in Fig. ( 5.19, 5.20, 5.21, 5.22, 5.23 and 5.24). The common
trends of the curves are that the electron density for all regions tends to increase as
the product pR increases. The electron density for all regions tends to increase as
the product of pR increases.
Generally, the electron density values for the different magnetic fields (B1,
B2 and B3) have a tendency for Probe 1 that, this probe has smaller values
compared to the Probe 2 and Probe 3 but in the case of without magnetic field this
difference for electron density values between the probes can not be observed [42].
The order of electon density values from highest to lowest is P2>P3>P1 except for
discharge current value 5 mA and magnetic field value B1 (For this case
59

P3>P2>P1). Also we observed that the electron density values increased with
increasing discharge currents for all the three probes.
Work on this thesis can be continued in the future with:
1- Developing the measurement technique to be more fast and more electronically
controlled.
For example, using programmable switches to control the gains.
2- Using different gases and its mixtures.
3- Using RF power instead DC power to get RF plasma.
4- Using conducting metallic wall instead of glass wall to study the plasma wall
interaction.
60

REFERENCES
[1] Perspectives on Plasmas, www.plasmas.org/applications.html, (last accessed
date 11.05.2006)
[2] Plasma Science: From Fundamental Research to Technological Applications,
Contributor: National Research Council, Panel on Opportunities, National
Academies Press, (1995)
[3] Electron Kinetics and Applications of Glow Discharges: Proceedings of a Nato
ARW held in St. Petersburg, Russia, May 19-23, (1997)
[4] National Research Council Staff. Plasma Processing of Materials: Scientific
Opportunities and Technological Challenges.Washinton, DC, USA: National
Academic Press, p8. (1991),
[5] J. Smith, IEEE Trans. Electron Devices ED-20, 1103, (1973).
[6] Y. Okamoto, Japan. J. Appl. Phys. 15, 719, (1976).
[7] T. Kaneda, J. Phys. D: Appl. Phys. 23, 500, (1989).
[8] C. Wilke, B. P. Koch, and B. Bruhn, Physics of Plasmas 12, 3350, (2005).
[9] W. Tao, and H. K. Yasuda, Plasma Chem. and Plasma Processing 22, 297,
(2002).
[10] E. Hintz, 3rd Workshop on Plasma and Laser Technology, Ismailia, (1993).
[11] C. M. Anderson, W. G. Graham, and M. B. Hopkins, Appl. Phys. Lett. 52, 783,
(1988).
[12] A. Von Engel, Ionized Gas, Oxford: Oxford University Press, (1965).
[13] J.J. Thomson and G.P. Thomson, Conduction of Electricity through gases
Volume II., Dover Publications, (1969)
[14] J. D. Cobine, Gaseous Conductors, Theory and Engineering Application,
Dover Publications Inc., New York, 2nd edition, (1958).
[15] A.M. Howatson, An Introduction to gas discharges, Pergamon Press, (1965)
[16] Yuri P. Raizer, Gas Discharge Physics, Spring Verlag, (1987).
[17] R. N. Franklin, Plasma Phenomena in Gas Discharges, Clarendon Press.
Oxford,(1976).
[18] D. Akbar, and S. Bilikmen, Development of Computer Controlled Double
Probe and Discharge System with Varying Diameters, 14th International
61

Conference on Surface Modification of Materials by Ion Beams (SMMIB),
Kusadasi, Turkey, 04 Sept. 2005.
[19] D. Akbar, and S. Bilikmen, Fast Double Probe Technique and Effect of Non-
Uniform Glow Discharge System on Plasma Parameters, 23th International
Physics Congeress (TPS), Mugla, Turkey, 13-16 Sept. 2005.
[20] W. Schottky, Z. Phys. 25, 635, (1924).
[21] Ingold J H 1997 Phys. Rev. E. 56 5932.
[22] Loffhagen D., and Gorchakov S 2005 "Self-consistent Modeling of the Column
Plasma of Low-pressure Glow Discharges", XXV IIth ICPIG, Eindhoven, the
Netherland, July 18-22.
[23] A. V. Pheleps, and S.C. Brown, Phys. Rev. 13, 1202, (1952).
[24] H. J. Oskan, Philips Res. Rep. 13, 335, (1958).
[25] J. P. Graur, and L. M. Chainin, Phys. Rev. 182, 167, (1969).
[26] Y. Ichikawa, and S. Teii, J. Phys. D:Appl. Phys. 13, 2031, (1980).
[27] P. M. Chung, L. Talbot, and K. J. Touryan, Elecrostatic Probes in Sationary
and Flowing Plasmas, Springer-Verlag, New York, (1975).
[28] F. F. Chen, Plasma Diagnostic Techniques, Academic Press INC., New York,
(1965).
[29] J. D. Swift, and M. J. R. Schwar, Electrical Probes for Plasma Diagnostics,
American Elsevier, New York, (1969).
[30] H. M. Mott-Smith, and I. Langmuir, Phys. Rev. 28, 727, (1929).
[31] F. F. Chen, Phys. Plasma 8, 3029, (2001).
[32] J. E. Allen, Phys. Scr. 45, 497, (1992).
[33] J. H. Rogers, J. S. De Groot, and D. Q. Hwang, Rev. Sci. Instrum. 63, 31,
(1992).
[34] F. F. Chen, Langmuir Probe Diagnostics, Mini-Course on Plasma Diadnos-
tics, IEEE-ICOPS meeting, Jeju, KOrea, (2003).
[35] E.O. Johnson, and L. Malter, Phys. Rev. 80, 58, (1950).
[36] J.R. Cozens, and A. Von Engle, Int. J. Electron 19, 61, (1965).
[37] D. Bardley, and K. J. Mathews, Phys. Fluids 10, 1336, (1967).
[38] B. A. Smith, and L. J. Oreizet, Plasma Source. Sci. Technol. 8, 82, (1999).
[39] D. Akbar, and S. Bilikmen, J. Appl. Phys. D: Appl. Phys. (2006)(submitted).
[40] D. S. Isaac , and W. R. Claude , J. Appl. Phys. 76, 4488, (1994).
62

[41] Francis F. Chen, John D. Evans, and Arnush, D., Phys. Plasmas 9,
1449,(2002).
[42]D.Akbar,The Non-Uniform Argon DC Glow discharge system parameters
measured with fast three couples of double probes, PhD Thesis,(2006)
[43] R.J.Bickerton, A.Von Engel, The Positive Column in a Longitudinal Magnetic
Field , Phys.Soc.,468, (1955)
[44] M.A. Lieberman, A. J. Lichtenberg “Principles of Plasma Discharges and
Materials Processing” John Wiley, (1994)
63