Embed Size (px)
Citation preview

Approaching with cautionLondon Office Crane Survey Winter 2017


The report 02
Key findings 03
Central London submarket snapshots 04
Emerging submarket snapshots 12
Central London Crane Survey results 15
Emerging submarkets Crane Survey results 20
Outlook 22
Construction cost and workload sentiment survey 25
Contacts 28
Contents
For the full list of developments featured in this research and access to a range of ways to view the data, please visit: www.deloitte.co.uk/cranesurvey
01
London Office Crane Survey Winter 2017

The report
Southbank
VNEB
West End
MidtownThe City
Docklands
Stratford
Paddington
White City
King’s Cross
Central London submarket Emerging submarket
Vauxhall-NineElms-Battersea
What?A report which measures the volume of office development taking place across central London and emerging London submarkets.
Where?London, covering the central office markets: City, West End, Docklands, King’s Cross, Midtown, Paddington and Southbank, and emerging submarkets: Vauxhall‑Nine Elms‑Battersea, Stratford and White City.
Who?Developers building new offices or undertaking significant office refurbishment of 10,000 sq ft +.
When?The survey covers the period from 1 April to 30 September 2017.
How?Our team of researchers have walked every street in central London and emerging London submarkets to monitor office construction. Our field research is then verified with direct industry links and in‑house property experts.
02
London Office Crane Survey Winter 2017
Key findings
Central London Crane Survey results
Outlook
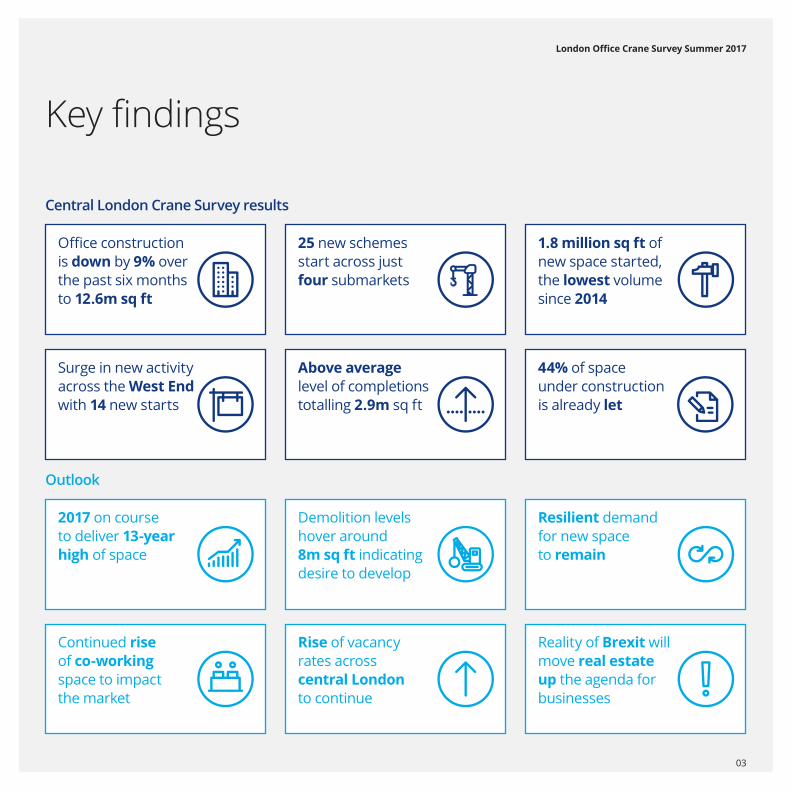
Office construction is down by 9% over the past six months to 12.6m sq ft
25 new schemes start across just four submarkets
1.8 million sq ft of new space started, the lowest volume since 2014
Reality of Brexit will move real estate up the agenda for businesses
Rise of vacancy rates across central London to continue
Continued rise of co‑working space to impact the market
2017 on course to deliver 13-year high of space
Demolition levels hover around8m sq ft indicatingdesire to develop
Resilient demand for new space to remain
Surge in new activity across the West End with 14 new starts
Above average level of completions totalling 2.9m sq ft
44% of space under construction is already let
03
London Office Crane Survey Summer 2017

Central London submarket snapshotsCentral London overview
Number of new construction starts
New build vs Refurbishment
New build Refurbishment
Central London office development pipeline
Total amount of space under construction which has been let or remains available
Total amount under construction
Million sq ft
Highest (2016)
Today
10 year average
Lowest (2010)
44%Let
56%Available
0% 100%
Which sector is currently taking the most space?
Average size of scheme
Average size of floor
Numberof cycle spaces being built
Today 12.6 million sq ft
Lowest5.9 million sq ft (2010)
Highest19.5 million sq ft (2002)
Financial
142,100 sq ft
14,069
12,500 sq ft
51
25
23
29%
71%
4
0
2
4
6
8
10
2020201920182017201620152014201320122011201020092008200720062005200420032002
Completed U/C available U/C let
Source: Deloitte Real Estate
04
London Office Crane Survey Winter 2017

Number of new construction starts
New build vs Refurbishment
New build Refurbishment
City office development pipeline
Total amount of space under construction which has been let or remains available
Total amount under construction
Million sq ft
Highest (2016)
Today
10 year average
Lowest (2010)
0% 100%
Which sector is currently taking the most space?
Average size of scheme
Average size of floor
Numberof cycle spaces being built
Today 7.3 million sq ft
Lowest1.3 million sq ft (2010)
Highest8.8 million sq ft (2016)
Financial
192,800 sq ft
8,920
15,300 sq ft
26
8
8
27%
72%
0
0
1
2
3
4
5
2020201920182017201620152014201320122011201020092008200720062005200420032002
Completed U/C available U/C let
38%Let
62%Available
Central London submarket snapshotsThe City
Source: Deloitte Real Estate
05
London Office Crane Survey Winter 2017
Number of new construction starts
New build vs Refurbishment
New build Refurbishment
West End office development pipeline
Total amount of space under construction which has been let or remains available
Total amount under construction
Million sq ft
10 year average
Lowest (2009)
0% 100%
Which sector is currently taking the most space?
Average size of scheme
Average size of floor
Number of cycle spaces being built
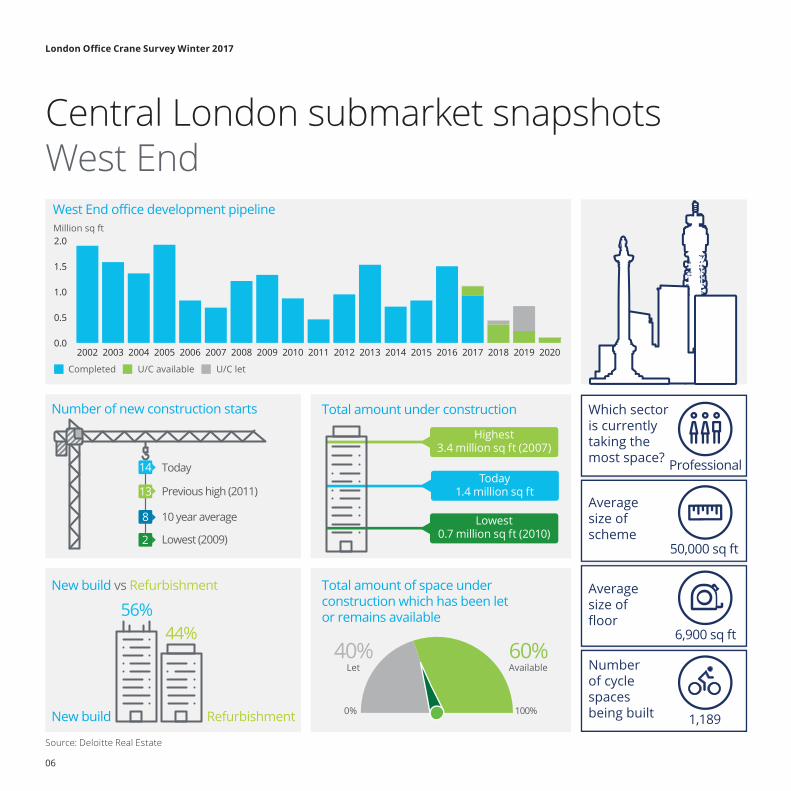
Today 1.4 million sq ft
Lowest0.7 million sq ft (2010)
Highest3.4 million sq ft (2007)
Professional
50,000 sq ft
1,189
6,900 sq ft
Previous high (2011)13
Today14
8
44%56%
2
0.0
0.5
1.0
1.5
2.0
2020201920182017201620152014201320122011201020092008200720062005200420032002
Completed U/C available U/C let
40%Let
60%Available
Central London submarket snapshotsWest End
Source: Deloitte Real Estate
06
London Office Crane Survey Winter 2017

Number of new construction starts
New build vs Refurbishment
New build Refurbishment
Docklands office development pipeline
Total amount of space under construction which has been let or remains available
Total amount under construction
Million sq ft
Highest (2012)
10 year average
Today
Lowest (2015)
0% 100%
Which sector is currently taking the most space?
Average size of scheme
Average size of floor
Number of cycle spaces being built
Today 1.0 million sq ft
Lowest0 million sq ft (2014)
Highest7.4 million sq ft (2002)
Financial
476,500 sq ft
884
26,419 sq ft
1
1
0
28%
72%
0
0.0
0.5
1.0
1.5
2.0
2.5
3.0
2020201920182017201620152014201320122011201020092008200720062005200420032002
Completed U/C available U/C let
28%Let
72%Available
Central London submarket snapshotsDocklands
Source: Deloitte Real Estate
07
London Office Crane Survey Winter 2017
Number of new construction starts
New build vs Refurbishment
New build 0% Refurbishment
King’s Cross office development pipeline
Total amount of space under construction which has been let or remains available
Total amount under construction
Million sq ft
Highest (2012)
10 year average
Today
Lowest (2014)
0% 100%
Which sector is currently taking the most space?
Average size of scheme
Average size of floor
Number of cycle spaces being built
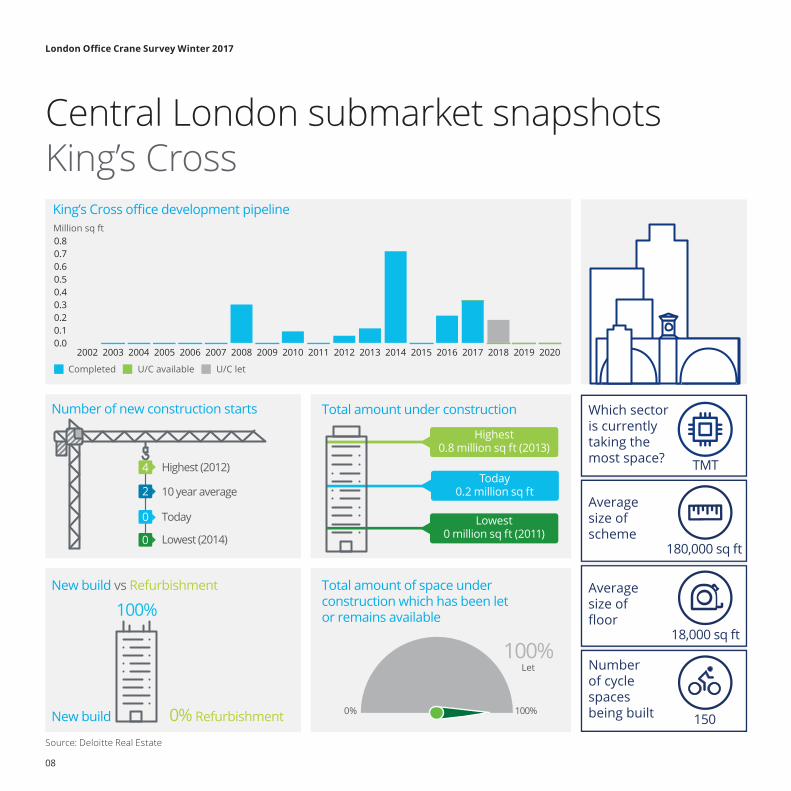
Today 0.2 million sq ft
Lowest0 million sq ft (2011)
Highest0.8 million sq ft (2013)
TMT
180,000 sq ft
150
18,000 sq ft
4
2
0
100%
0
0.00.10.20.30.40.50.60.70.8
2020201920182017201620152014201320122011201020092008200720062005200420032002
Completed U/C available U/C let
100%Let
Central London submarket snapshotsKing’s Cross
Source: Deloitte Real Estate
08
London Office Crane Survey Winter 2017

Number of new construction starts
New build vs Refurbishment
New build Refurbishment
Midtown office development pipeline
Total amount of space under construction which has been let or remains available
Total amount under construction
Million sq ft
Highest (2017)
Lowest (2010)
0% 100%
Which sector is currently taking the most space?
Average size of scheme
Average size of floor
Number of cycle spaces being built
Today 1.6 million sq ft
Lowest0.2 million sq ft (2010)
Highest2.1 million sq ft (2016)
Financial
124,300 sq ft
1,412
12,860 sq ft
8
Today2
10 year average4
21%
79%
0
0.00.20.40.60.81.01.21.41.61.8
2020201920182017201620152014201320122011201020092008200720062005200420032002
Completed U/C available U/C let
61%Let
39%Available
Central London submarket snapshotsMidtown
Source: Deloitte Real Estate
09
London Office Crane Survey Winter 2017
Number of new construction starts
New build vs Refurbishment
New build
Paddington office development pipeline
Total amount of space under construction which has been let or remains available
Total amount under construction
Million sq ft
Highest (2006)
10 year average
Today
Lowest (2015)
0% 100%
Which sector is currently taking the most space?
Average size of scheme
Average size of floor
Number of cycle spaces being built
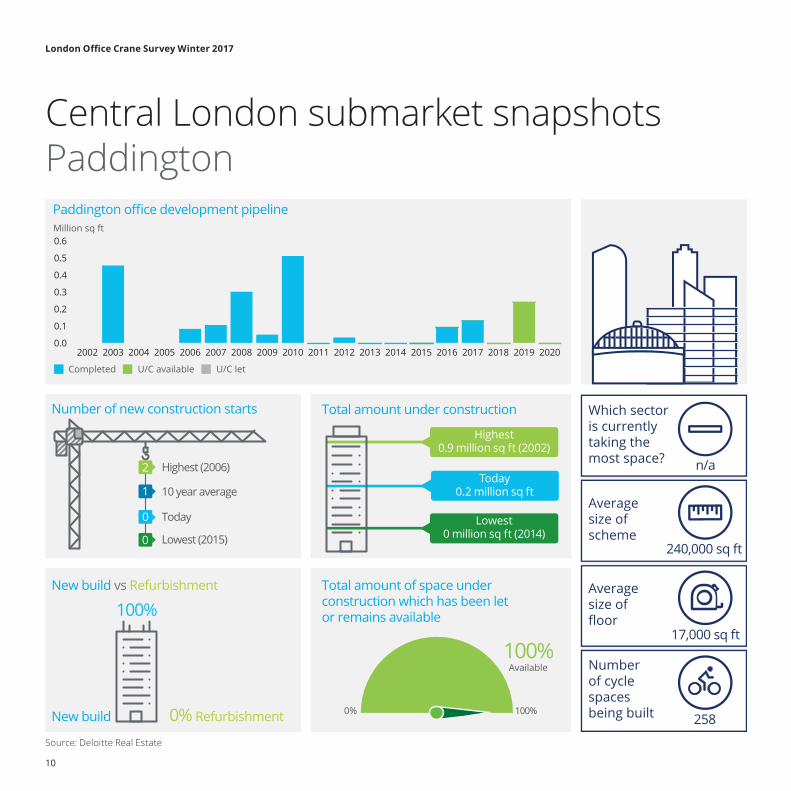
Today 0.2 million sq ft
Lowest0 million sq ft (2014)
Highest0.9 million sq ft (2002)
n/a
240,000 sq ft
258
17,000 sq ft
2
1
0
100%
0
0.0
0.1
0.2
0.3
0.4
0.5
0.6
2020201920182017201620152014201320122011201020092008200720062005200420032002
Completed U/C available U/C let
100%Available
0% Refurbishment
Central London submarket snapshotsPaddington
Source: Deloitte Real Estate
10
London Office Crane Survey Winter 2017
Number of new construction starts
New build vs Refurbishment
New build Refurbishment
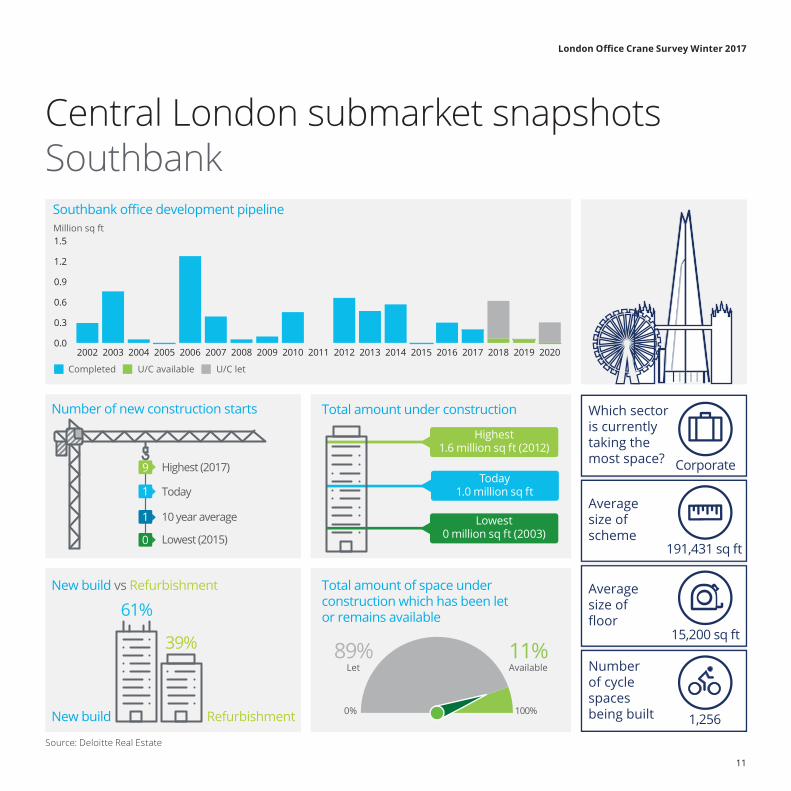
Southbank office development pipeline
Total amount of space under construction which has been let or remains available
Total amount under construction
Million sq ft
Highest (2017)
Today
10 year average
Lowest (2015)
Which sector is currently taking the most space?
Average size of scheme
Average size of floor
Number of cycle spaces being built
Today 1.0 million sq ft
Lowest0 million sq ft (2003)
Highest1.6 million sq ft (2012)
Corporate
191,431 sq ft
1,256
15,200 sq ft
9
1
1
39%
61%
0
0.0
0.3
0.6
0.9
1.2
1.5
2020201920182017201620152014201320122011201020092008200720062005200420032002
0% 100%
Completed U/C available U/C let
89%Let
11%Available
Central London submarket snapshotsSouthbank
Source: Deloitte Real Estate
11
London Office Crane Survey Winter 2017

0.00.10.20.30.40.50.60.70.8
2020201920182017201620152014201320122011201020092008200720062005
Vauxhall – Nine Elms – Battersea office development pipeline
Total amount under construction
Million sq ft
Which sector is currently taking the most space?
Average size of scheme
Total amount of space under construction which has been let
0% 100%
256,945 sq ft
GovernmentToday
1.3 million sq ft
Completed U/C available U/C let
90%Let
10%Available
Emerging submarket snapshotsVauxhall – Nine Elms – Battersea
Source: Deloitte Real Estate
12
London Office Crane Survey Winter 2017

0.0
0.1
0.2
0.3
0.4
0.5
0.6
2020201920182017201620152014201320122011201020092008200720062005
Stratford office development pipelineMillion sq ft
Financial
Total amount under construction Which sector is currently taking the most space?
Average size of scheme
Total amount of space under construction which has been let
387,650 sq ft
Today 0.8 million sq ft
Completed U/C available U/C let
0% 100%
91%Let
9%Available
Emerging submarket snapshotsStratford
Source: Deloitte Real Estate
13
London Office Crane Survey Winter 2017

0.0
0.1
0.2
0.3
0.4
0.5
0.6
2020201920182017201620152014201320122011201020092008200720062005
White City office development pipelineMillion sq ft
Total amount under construction Which sector is currently taking the most space?
Average size of scheme
Total amount of space under construction which has been let
260,000 sq ft
CorporateToday
0.3 million sq ft
Completed U/C available U/C let
0% 100%
12%Let
88%Available
Emerging submarket snapshotsWhite City
Source: Deloitte Real Estate
14
London Office Crane Survey Winter 2017

Declining construction activityThe current level of office construction activity across central London totals 12.6 million sq ft. This represents a 9% drop over the past six months and the second consecutive fall. Nevertheless the volume remains high compared with the long‑term average, staying above 10 million sq ft since 2015.
The latest Crane Survey has recorded 25 new office development starts, down on our previous survey and half of the number recorded at the beginning of 2016. Yet it is the volume of new space starting that could indicate a wider slowdown. At 1.8 million sq ft, this is the lowest amount since our 2014 Summer Crane Survey and 21% below the survey average.
While not necessarily a leading indicator of further activity slowdown, the current volume of new starts certainly indicates caution on behalf of developers earlier this year. Moreover, the continued fall in activity may be good news for those looking to spot the next window of opportunity in the cycle.
Central London Crane Survey results
Central London: Total volume under construction per survey
Million sq ft
Source: Deloitte Real Estate
0
5
10
15
20
2017
Q3
2016
Q3
2015
Q3
2014
Q3
2013
Q3
2012
Q3
2011
Q3
2010
Q3
2009
Q3
2008
Q3
2007
Q3
2006
Q3
2005
Q3
2004
Q3
2003
Q3
2002
Q3
2017
Q1
2016
Q1
2015
Q1
2014
Q1
2013
Q1
2012
Q1
2011
Q1
2010
Q1
2009
Q1
2008
Q1
2007
Q1
2006
Q1
2005
Q1
2004
Q1
2003
Q1
2002
Q1
Million sq ft
Source: Deloitte Real Estate
0
1
2
3
4
5
Average volumeof new starts
2017
Q3
2017
Q1
2016
Q3
2016
Q1
2015
Q3
2015
Q1
2014
Q3
2014
Q1
2013
Q3
2013
Q1
2012
Q3
201
2 Q
1 20
11 Q
320
11 Q
120
10 Q
320
10 Q
120
09 Q
320
09 Q
120
08 Q
320
08 Q
120
07 Q
320
07 Q
120
06 Q
320
06 Q
120
05 Q
320
05 Q
120
04 Q
320
04 Q
1 20
03 Q
320
03 Q
120
02 Q
3
Central London: Volume of new starts per survey
The current level of office construction activity across central London totals 12.6 million sq ft.
15
London Office Crane Survey Winter 2017

Refurbishments dominate new startsSix months ago we highlighted the prevalence of new‑build schemes as a driver of new starts. The latest results have seen the opposite, back to the ratio seen a year ago. Approximately 80% of the volume of new starts is attributed to 16 refurbishment schemes. As refurbishments are generally of a smaller scale than new‑builds, the average size of schemes starting in this survey has fallen to 73,000 sq ft, below the 97,000 sq ft long‑term average.
Lows in the City, highs in the West EndOverall development activity across the City has once again recorded a decrease. A fall of 11% now takes the total office space under construction to 7.3 million sq ft. While the amount of space that completed over the past six months is not insignificant, it is the low number and volume of new starts which has led to this drop. Eight new schemes totalling 804,000 sq ft started in this survey, the lowest level since Q1 2014 and below the 1.1 million sq ft average.
Yet it is the West End, not the City that has reached a turning point in development. Here, after two years of declining construction volumes, our research has identified 14 new starts totalling 657,500 sq ft. This is not only the highest volume of new schemes since Q1 2015, but also the greatest number of new starts seen in the West End, surpassing recent highs in 2016 (12) and 2011 (13). Alongside existing development activity there is now 1.4 million sq ft under construction across the West End, representing a 20% increase on the total six months ago.
Central London: New build vs Refurbishment
% of new start volume
New build Refurbishment
70%
30%
70%
30%19%
81%
Q3 2016 Q1 2017 Q3 2017
The average size of schemes starting in this survey has fallen to 73,000 sq ft.
Source: Deloitte Real Estate
16
London Office Crane Survey Winter 2017

Just three further new starts were recorded, two in Midtown and one on the Southbank. For Midtown the current level of new activity is the lowest in three years and indicates the slowest pace of development seen since 2014.
In our remaining central London submarkets of Paddington, Docklands and King’s Cross there have been no new starts this survey, marking two consecutive surveys with no new activity.
Wave of completions continue to rippleIn our last Crane Survey six months ago we described how a wave of completions was the chief contributor to the drop in volume of space under construction. That wave has continued to roll through – in this survey we have recorded another above‑average level of completed space at 2.9 million sq ft. This now brings the total completed in 2017 to 5.5 million sq ft. With approximately 1.6 million sq ft scheduled to complete in Q4 2017, the year’s total is still expected to surpass that of 2014 and on course to be the highest in 13 years.
In the City, the volume of space completed in 2017 totals 3.4 million sq ft: more than in both 2015 and 2016, and already the highest since 2000. Should all the schemes that are scheduled in for a Q4 2017 delivery complete, then 2017 will achieve the highest annual volume in 26 years.
Central London: Total volume under construction by submarketMillion sq ft
1.0Docklands
1.0Southbank
0.2King’s Cross
1.4West End
0.2Paddington
1.6Midtown
7.3City
12.6 Total
Central London: Total volume of space completed per survey
Million sq ft
Source: Deloitte Real Estate
0
1
2
3
4
5
6
2017
Q3
2017
Q1
2016
Q3
2016
Q1
2015
Q3
2015
Q1
2014
Q3
2014
Q1
2013
Q3
2013
Q1
2012
Q3
2012
Q1
2011
Q3
2011
Q1
2010
Q3
2010
Q1
2009
Q3
2009
Q1
2008
Q3
2008
Q1
2007
Q3
2007
Q1
2006
Q3
2006
Q1
2005
Q3
2005
Q1
2004
Q3
2004
Q1
2003
Q3
2003
Q1
2002
Q3
2002
Q1
17
London Office Crane Survey Winter 2017

It is 2018 that will set a new high with just over 1.5 million sq ft expected to complete, although 54% is from one scheme (70 Farringdon Street). Elsewhere a further 627,535 sq ft completed across 10 schemes in the Southbank, King’s Cross and Paddington.
The sheer volume of completed space hitting the market over the past two surveys has been cushioned by the high level of leasing activity on those schemes ahead of completion. Of the 2.9 million sq ft completed in this survey, 71% was already let, up on the 47% six months ago and highlighting the continued resilience of demand for new space in central London.
Demand remains highLeasing activity on space under construction remains high with 44% of the total let. Although this figure is up on our previous survey (in percentage terms), the volume of space leased is marginally down (‑6%) at 5.6 million sq ft, but so too is the amount of available space.
Leasing activity increased in three submarkets since our last survey, the Southbank, the West End and Midtown, by 217%, 45% and 3% respectively. Although falls or no change in leasing activity is noted in the other submarkets, it is the high level of completed and let schemes that has led to the overall decrease.
Central London: Total office space under construction
Total sq ft u/c Let sq ft Available sq ft
City 7,250,500 ‑11% 2,747,500 ‑24% 4,503,000 ‑2%
West End 1,448,900 20% 579,800 45% 869,100 8%
Docklands 953,000 0% 264,000 0% 689,000 0%
King's Cross 180,000 ‑64% 180,000 ‑64% – –
Midtown 1,616,000 ‑12% 988,000 3% 628,000 ‑28%
Paddington 240,000 ‑35% – – 240,000 ‑35%
Southbank 957,154 16% 851,354 217% 105,800 ‑81%
Total 12,645,554 ‑9% 5,610,654 ‑6% 7,034,900 ‑11%
Change since last survey
Across the West End 408,650 sq ft completed in this survey bringing the annual total of completions for 2017 to approximately 925,000 sq ft. Further completions in the final months of the year should easily take the annual figure above the long‑term average of 1.0 million sq ft.
In contrast, the Midtown submarket will not be putting down any historic markers in 2017. Our research indicates 520,000 sq ft has completed so far and is expected to reach 647,000 sq ft by the end of the year. This level will be down on 2016, albeit above the long‑term average.
Source: Deloitte Real Estate
18
London Office Crane Survey Winter 2017
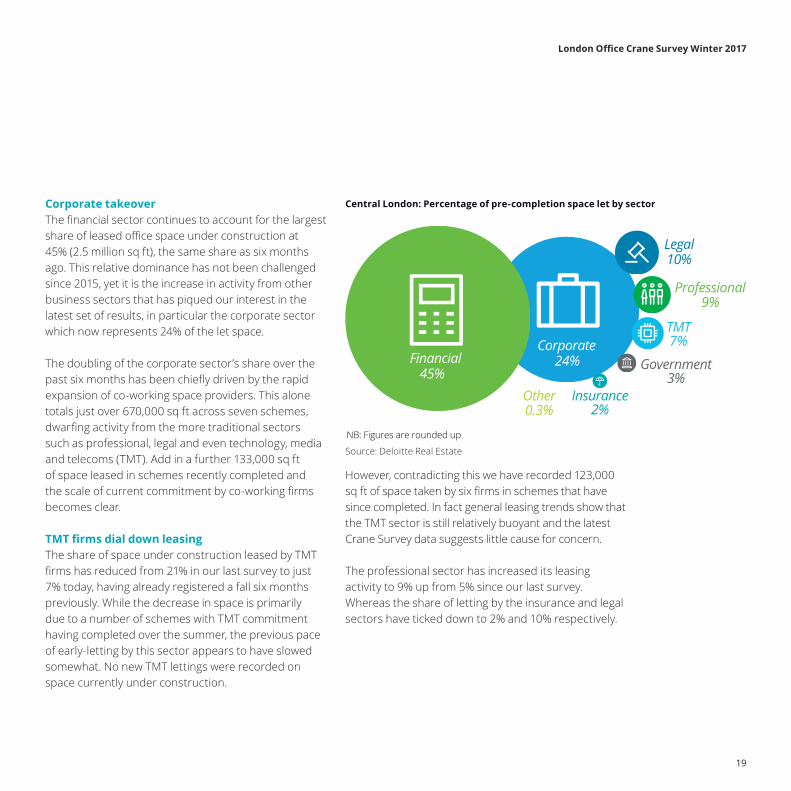
Central London: Percentage of pre-completion space let by sector
NB: Figures are rounded up
Corporate24%
Insurance2%
Other0.3%
Financial45%
Professional9%
Government3%
TMT7%
Legal10%
Corporate takeoverThe financial sector continues to account for the largest share of leased office space under construction at 45% (2.5 million sq ft), the same share as six months ago. This relative dominance has not been challenged since 2015, yet it is the increase in activity from other business sectors that has piqued our interest in the latest set of results, in particular the corporate sector which now represents 24% of the let space.
The doubling of the corporate sector’s share over the past six months has been chiefly driven by the rapid expansion of co‑working space providers. This alone totals just over 670,000 sq ft across seven schemes, dwarfing activity from the more traditional sectors such as professional, legal and even technology, media and telecoms (TMT). Add in a further 133,000 sq ft of space leased in schemes recently completed and the scale of current commitment by co‑working firms becomes clear.
TMT firms dial down leasingThe share of space under construction leased by TMT firms has reduced from 21% in our last survey to just 7% today, having already registered a fall six months previously. While the decrease in space is primarily due to a number of schemes with TMT commitment having completed over the summer, the previous pace of early‑letting by this sector appears to have slowed somewhat. No new TMT lettings were recorded on space currently under construction.
However, contradicting this we have recorded 123,000 sq ft of space taken by six firms in schemes that have since completed. In fact general leasing trends show that the TMT sector is still relatively buoyant and the latest Crane Survey data suggests little cause for concern.
The professional sector has increased its leasing activity to 9% up from 5% since our last survey. Whereas the share of letting by the insurance and legal sectors have ticked down to 2% and 10% respectively.
Source: Deloitte Real Estate
19
London Office Crane Survey Winter 2017
Emerging submarkets Crane Survey results
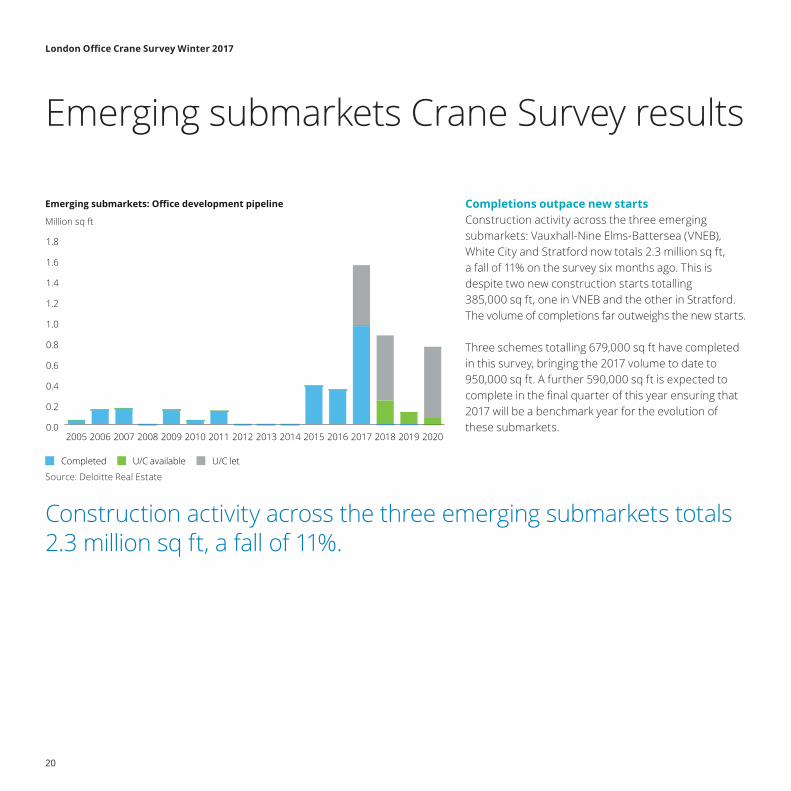
Emerging submarkets: Office development pipeline
Million sq ft
Completed U/C available U/C let
0.0
0.2
0.4
0.6
0.8
1.0
1.2
1.4
1.6
1.8
2020201920182017201620152014201320122011201020092008200720062005
Completions outpace new startsConstruction activity across the three emerging submarkets: Vauxhall‑Nine Elms‑Battersea (VNEB), White City and Stratford now totals 2.3 million sq ft, a fall of 11% on the survey six months ago. This is despite two new construction starts totalling 385,000 sq ft, one in VNEB and the other in Stratford. The volume of completions far outweighs the new starts.
Three schemes totalling 679,000 sq ft have completed in this survey, bringing the 2017 volume to date to 950,000 sq ft. A further 590,000 sq ft is expected to complete in the final quarter of this year ensuring that 2017 will be a benchmark year for the evolution of these submarkets.
Construction activity across the three emerging submarkets totals 2.3 million sq ft, a fall of 11%.
Source: Deloitte Real Estate
20
London Office Crane Survey Winter 2017

Emerging submarkets: Total office space under construction
Total sq ft u/c Let sq ft Available sq ft
VNEB 1,284,725 1% 1,156,000 10% 128,725 ‑43%
Stratford 775,300 ‑1% 707,300 ‑10% 68,000 –
White City 260,000 ‑53% 30,000 – 230,000 ‑59%
Total 2,320,025 ‑11% 1,893,300 3% 426,725 ‑45%
Change since last survey
Letting success and diversityDue to the pre‑let nature of the wider developments within the three submarkets, leasing activity is higher than the central London submarkets (44%). Current data shows that 82% is let which represents an increase on the 70% in our last survey. This has largely been as a result of the significantly let new schemes starting construction.
What is apparent from the list of businesses that have committed to space in these emerging locations is the diverse range of activities, typifying the London office occupier profile. From public bodies through to research charities, global technology giants to TV companies, all creating that rich London blend.
Significant pre‑lets have predominantly kick‑started development. As in the central submarkets, demand is robust and as speculative development is still relatively low on the agenda in these submarkets, it is the continued demand that will be the short‑to‑medium term driver of new construction.
Leasing activity is higher than the central London submarkets.
Source: Deloitte Real Estate
21
London Office Crane Survey Winter 2017
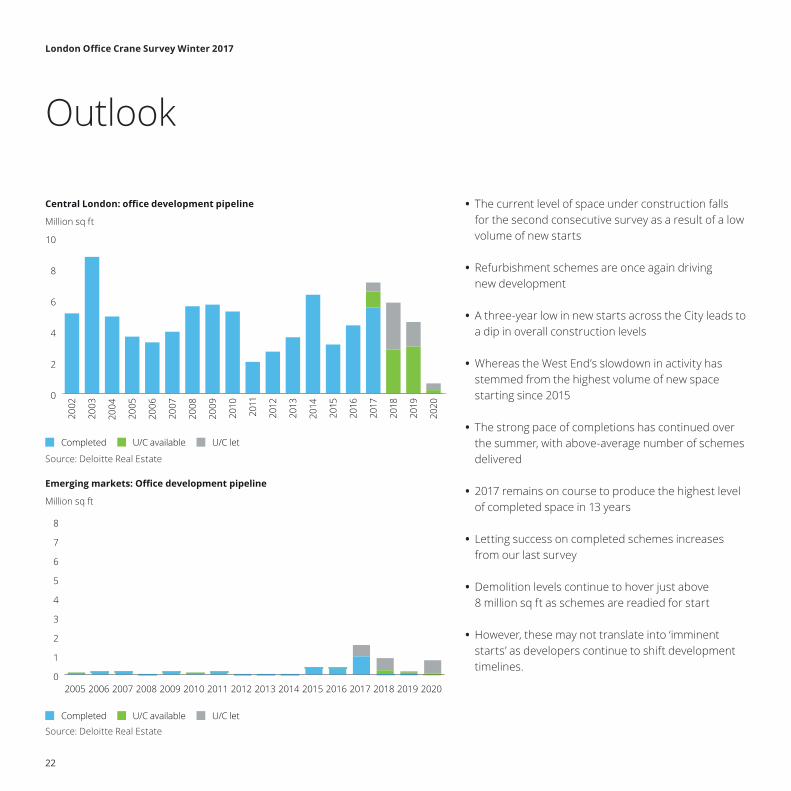
• The current level of space under construction falls for the second consecutive survey as a result of a low volume of new starts
• Refurbishment schemes are once again driving new development
• A three‑year low in new starts across the City leads to a dip in overall construction levels
• Whereas the West End’s slowdown in activity has stemmed from the highest volume of new space starting since 2015
• The strong pace of completions has continued over the summer, with above‑average number of schemes delivered
• 2017 remains on course to produce the highest level of completed space in 13 years
• Letting success on completed schemes increases from our last survey
• Demolition levels continue to hover just above 8 million sq ft as schemes are readied for start
• However, these may not translate into ‘imminent starts’ as developers continue to shift development timelines.
Outlook
Central London: office development pipeline
Million sq ft
0
2
4
6
8
10
Completed U/C available U/C let20
20
2019
2018
2017
2016
2015
2014
2013
2012
2011
2010
2009
2008
2007
2006
2005
2004
2003
2002
Emerging markets: Office development pipeline
Million sq ft
0
1
2
3
4
5
6
7
8
2020201920182017201620152014201320122011201020092008200720062005
Completed U/C available U/C let
Source: Deloitte Real Estate
Source: Deloitte Real Estate
22
London Office Crane Survey Winter 2017
-80%-70%-60%-50%-40%-30%-20%-10%0%
10%20%30%40%50%
2017201620152014201320122011201020092008
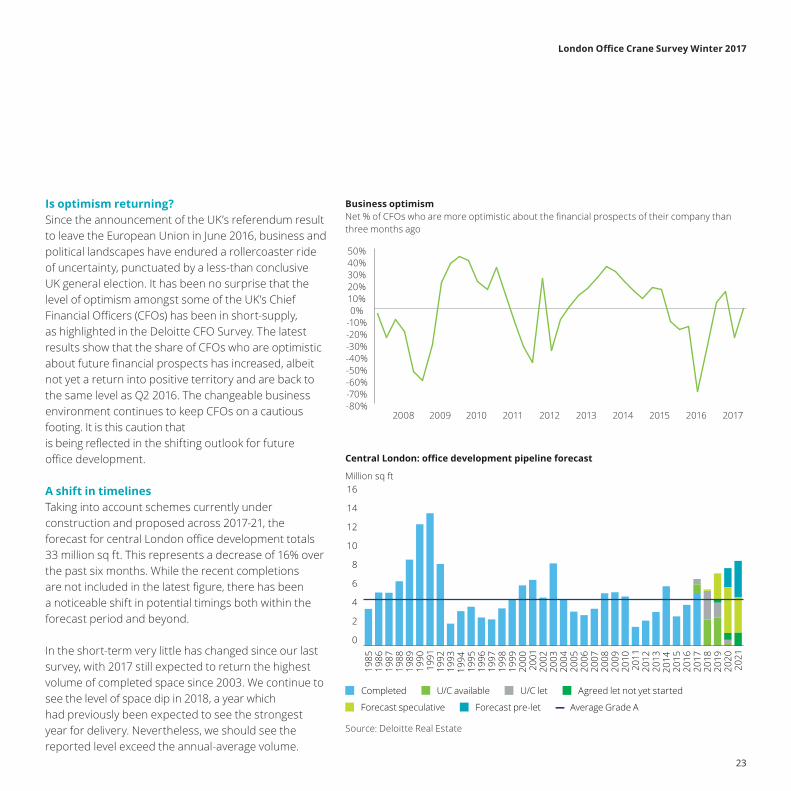
Business optimismNet % of CFOs who are more optimistic about the financial prospects of their company than three months ago
Is optimism returning?Since the announcement of the UK’s referendum result to leave the European Union in June 2016, business and political landscapes have endured a rollercoaster ride of uncertainty, punctuated by a less‑than conclusive UK general election. It has been no surprise that the level of optimism amongst some of the UK’s Chief Financial Officers (CFOs) has been in short‑supply, as highlighted in the Deloitte CFO Survey. The latest results show that the share of CFOs who are optimistic about future financial prospects has increased, albeit not yet a return into positive territory and are back to the same level as Q2 2016. The changeable business environment continues to keep CFOs on a cautious footing. It is this caution that is being reflected in the shifting outlook for future office development.
A shift in timelinesTaking into account schemes currently under construction and proposed across 2017‑21, the forecast for central London office development totals 33 million sq ft. This represents a decrease of 16% over the past six months. While the recent completions are not included in the latest figure, there has been a noticeable shift in potential timings both within the forecast period and beyond.
In the short‑term very little has changed since our last survey, with 2017 still expected to return the highest volume of completed space since 2003. We continue to see the level of space dip in 2018, a year which had previously been expected to see the strongest year for delivery. Nevertheless, we should see the reported level exceed the annual‑average volume.
Central London: office development pipeline forecast
Million sq ft
0
2
4
6
8
10
12
14
16
Average Grade A
Completed U/C available U/C let
Forecast speculative Forecast pre-let
Agreed let not yet started
2021
2020
2019
2018
2017
2016
2015
2014
2013
2012
2011
2010
2009
2008
2007
2006
2005
2004
2003
2002
2001
2000
1999
1998
1997
1996
1995
1994
1993
1992
1991
1990
1989
1988
1987
1986
1985
Source: Deloitte Real Estate
23
London Office Crane Survey Winter 2017

It is the development volumes in the outer years of the forecast in 2019‑21 that have softened since our last survey. Overall annual volumes have come down and we are no longer expecting to see double‑digit millions in 2020. Although above‑average levels of new space are forecast for each year to 2021 they look more manageable. Especially as we have seen a change in market dynamics over the past 12‑18 months, which will have certainly influenced developers’ current thinking.
There are certainly reasons for optimism among the wider uncertainty: developers can be heartened by the fact that leasing demand has held up across the year, in particular demand for Grade A space has remained resilient, reaching 3.3 million sq ft at the end of Q3 2017 up 38% on the same period in 2016.
Leasing activity by serviced office/co-working operators
Million sq ft
NB: Figures are rounded upSource: Deloitte Real Estate
20130.4m
sq ft
20140.7msq ft
20151.0msq ft
Q1-Q3 20170.7msq ft
20160.5m
sq ft
Servicing secondhand spaceHowever, availability levels remain stubbornly high at 15.4 million sq ft at the end of September, up by 31% in a year, with the majority of the rise coming from secondhand space. It is this glut of space that sees no sign of budging and is only expected to increase further as those businesses that have committed to new space release older stock back to the market.
Another reason why we may see the level of secondhand space hang around a lot longer is the rise in the popularity and provision of co‑working and flexible office space. Businesses that once leased cheaper and relatively flexible secondhand space now have the option of a greater choice of newer space on potentially more flexible terms. It is not just the small start‑ups; established businesses now look towards the co‑working model for expansion space.
Our Crane Survey research highlights the increased demand from such operators for new space, thus offering an increase in choice for prospective tenants. But on the flip‑side, this could lead to obsolescence of some older buildings. Should we start to expect a greater number of refurbishments coming through the pipeline?
24
London Office Crane Survey Winter 2017

The pace of development whether it be current or future can be determined by two important factors – the cost of construction and the availability of contractors to undertake the work. In the current environment both of these elements pose a potential threat to future activity.
To complement the London Office Crane survey research we carry out a bi‑annual construction market survey capturing market sentiment on price and workload. Our latest data marks the third survey in which main, trade and sub‑contractors have responded back with their outlook.
Anticipation for a rise in workload levels but at a slower paceA year ago, when we carried out our first survey (post the EU referendum), we thought we had identified the start of a general slowdown with demolition and substructure trades registering a distinct reduction in workload expectations. In reality this reflected only a brief hesitation in the market, as six months later (Q1 2017), all trades registered strong growth in workload expectations.
However the latest survey results show that there has been a drop in sentiment over the past six months. The early trades such as demolition and substructure contractors are showing on average no growth and a small drop in workload expectation respectively. Across the other trades, anticipation for a rise in workload continues, albeit on average lower than at the start of the year.
Construction cost and workload sentiment survey
Q3 2016 Q1 2017 Q3 2017
Fall in workload
Dem
oliti
on
Subs
truc
ture
Supe
rstr
uctu
re
Enve
lope
Inte
rnal
fini
shes
Serv
ices
Exte
rnal
wor
ks
Mai
n co
ntra
ctor
pre
limin
arie
s
Workload change sentiment for the next 12 months
Rise in workload
Contrary to the majority of the trades, there is an upward sentiment suggested in the recent results by the finishing and servicing contractors. Anecdotally, we understand that these trades are reporting strong order books, reflecting the previous buoyant sentiment of the earlier construction trades from six months ago and hence we anticipate falls are likely in future surveys.
The general workload sentiment for the coming year is one of increase, although reduced somewhat on our previous results. It is the early trades less positive outlook that could point towards a drop in future construction activity that then plays out in the Crane Survey results.
Source: Deloitte Real Estate
25
London Office Crane Survey Winter 2017

Tender prices to rise more slowlyAcross all the trades the sentiment towards further tender price inflation over the next year has been subdued, according to our latest survey. The movement over the past six months shows a downward trend. As with workload, prices continue to increase but at a much lower rate. The average price increase in the current survey is down 2% on six months ago. We believe that greater stability of Sterling against the Euro in the last six to 12 months has helped. We currently anticipate that price increases for Greater London in 2018 will be around 1‑2%.
There are some exceptions to the general consensus of subdued price inflation, brickwork and roofing contractors anticipate average increases of 10% and 7% respectively, showing that it is unwise to assume that price changes apply across all trades consistently. Brickwork represents a very small component in our office model, but is likely to be more significant to residential developments than office schemes.
Q3 2016 Q1 2017 Q3 2017
Risi
ng c
osts
Previous average
Current average
Dem
oliti
on
Subs
truc
ture
Supe
rstr
uctu
re
Enve
lope
Inte
rnal
fini
shes
Serv
ices
Exte
rnal
wor
ks
Mai
n co
ntra
ctor
pre
limin
arie
s
Price change sentiment for the next 12 months
Across all the trades the sentiment towards further tender price inflation over the next year has been subdued, according to our latest survey.
Source: Deloitte Real Estate
26
London Office Crane Survey Winter 2017
Brexit and labour costsDespite the general softening of the outlook for price inflation there remains a number of factors that could force upward pressure. One of which could be labour costs through a reduction in the current workforce as a result of Brexit.
Our latest survey asked contractors the percentage of overseas workers they have onsite. The levels vary by trade but the average response was 26%. On face value this seems relatively minimal. A post‑Brexit concern is that contractors in London could struggle to attract enough talent, impacting labour costs and overall construction prices.
Moving into a slow gearSix months ago we suggested that the dip in construction activity was more to do with the balance of new starts and completions than a wholesale slowdown. The latest data suggests that developers may have taken their foot off the accelerator. The continued shift in timings for proposed schemes and an almost static level of space under demolition reinforces this trend.
While office demand has been relatively buoyant it would be imprudent to dismiss the possibility that various factors could impact the office market and subsequent development. The top of the list is Brexit, and during the negotiation period it will continue to play its part in creating uncertainty for businesses, now and potentially after the exit. This is being played out at the same time that the workforce and the workplace is entering a new stage of evolution, not least because of rapid advances in technology. Developers of the next generation of offices will need to ensure their products have the ability to adapt to both current and potential changes.
27
London Office Crane Survey Winter 2017

Contacts
Neill MorrisonPartner020 7007 [email protected]
Mike CuthbertPartner020 7303 [email protected]
Michael CracknellDirector020 7007 [email protected]
Nigel ShiltonManaging Partner, Deloitte Real Estate020 7007 [email protected]
Russell McMillanPartner020 7303 [email protected]
Capital Projects Advisory Occupier Consulting
Leadership and report authors
Shaun DawsonHead of Real Estate Research020 7303 [email protected]
Philip ParnellPartner020 7303 [email protected]
For the full list of developments featured in this research and access to a range of ways to view the data, please visit: www.deloitte.co.uk/cranesurvey
Valuation, Assurance and Professional Advisory
Leonie WebsterPartner020 7303 [email protected]
Real Estate Tax
Location Strategy
Jon MilwardPartner, Development020 7303 [email protected]
John AdamsPartner, Planning020 7303 [email protected]
Planning and Development
Alistair DaviesDirector02920 [email protected]
28
London Office Crane Survey Winter 2017


This publication has been written in general terms and we recommend that you obtain professional advice before acting or refraining from action on any of the contents of this publication. Deloitte LLP accepts no liability for any loss occasioned to any person acting or refraining from action as a result of any material in this publication.
Deloitte LLP is a limited liability partnership registered in England and Wales with registered number OC303675 and its registered office at 2 New Street Square, London EC4A 3BZ, United Kingdom.
Deloitte LLP is the United Kingdom affiliate of Deloitte NWE LLP, a member firm of Deloitte Touche Tohmatsu Limited, a UK private company limited by guarantee (“DTTL”). DTTL and each of its member firms are legally separate and independent entities. DTTL and Deloitte NWE LLP do not provide services to clients. Please see www.deloitte.com/about to learn more about our global network of member firms.
© 2017 Deloitte LLP. All rights reserved.
Designed and produced by The Creative Studio at Deloitte, London. J14036