Embed Size (px)
Citation preview
1
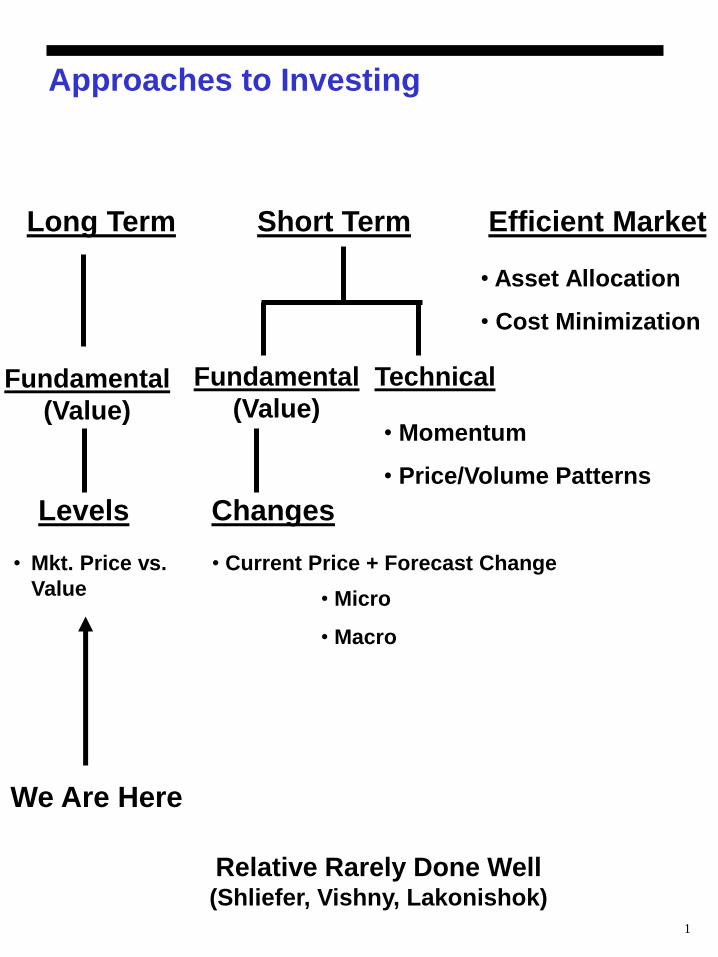
Approaches to Investing
Long Term Short Term Efficient Market
Fundamental
(Value)
Levels
• Mkt. Price vs.
Value
We Are Here
Fundamental
(Value)
Technical
• Momentum
• Price/Volume Patterns
Changes
• Current Price + Forecast Change
• Micro
• Macro
• Asset Allocation
• Cost Minimization
Relative Rarely Done Well (Shliefer, Vishny, Lakonishok)
2
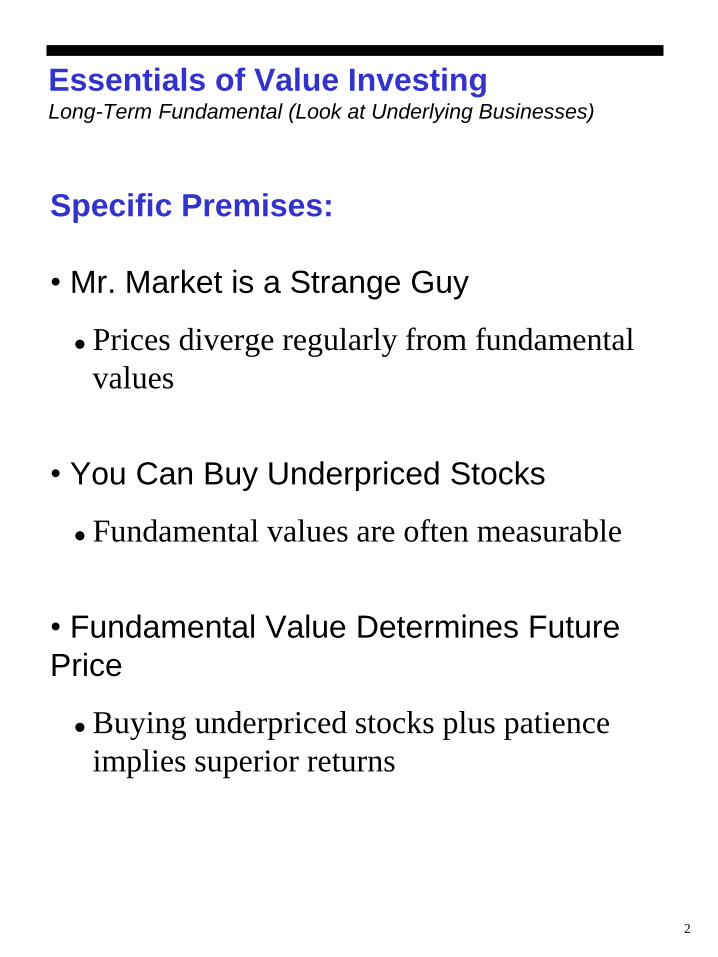
Essentials of Value Investing Long-Term Fundamental (Look at Underlying Businesses)
Specific Premises:
• Mr. Market is a Strange Guy
Prices diverge regularly from fundamental
values
• You Can Buy Underpriced Stocks
Fundamental values are often measurable
• Fundamental Value Determines Future
Price
Buying underpriced stocks plus patience
implies superior returns
3
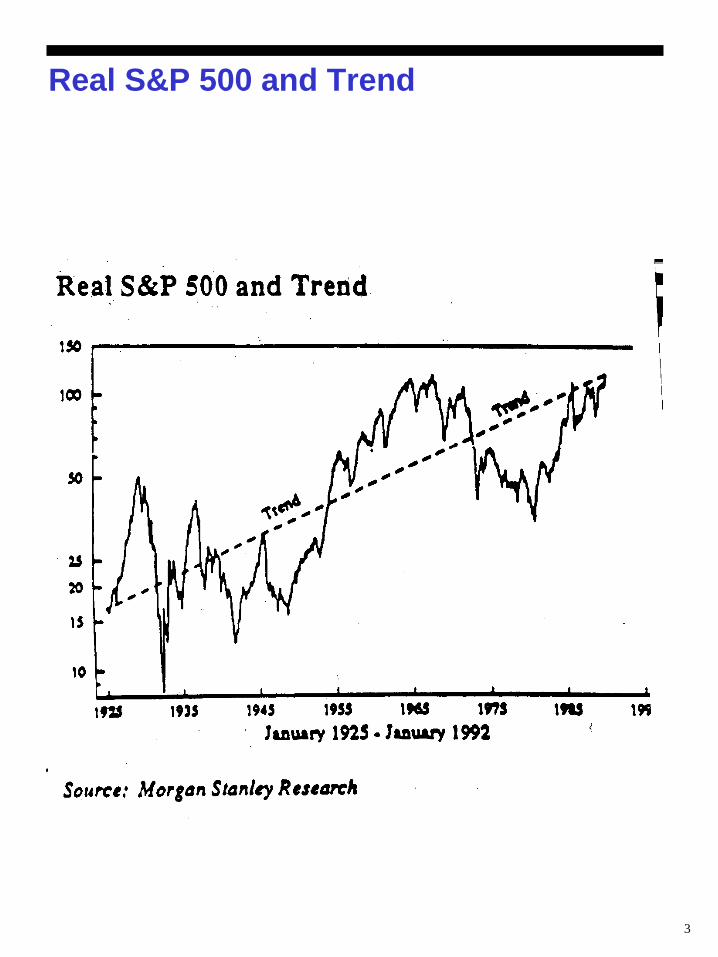
Real S&P 500 and Trend

4
5
6
7
8
9
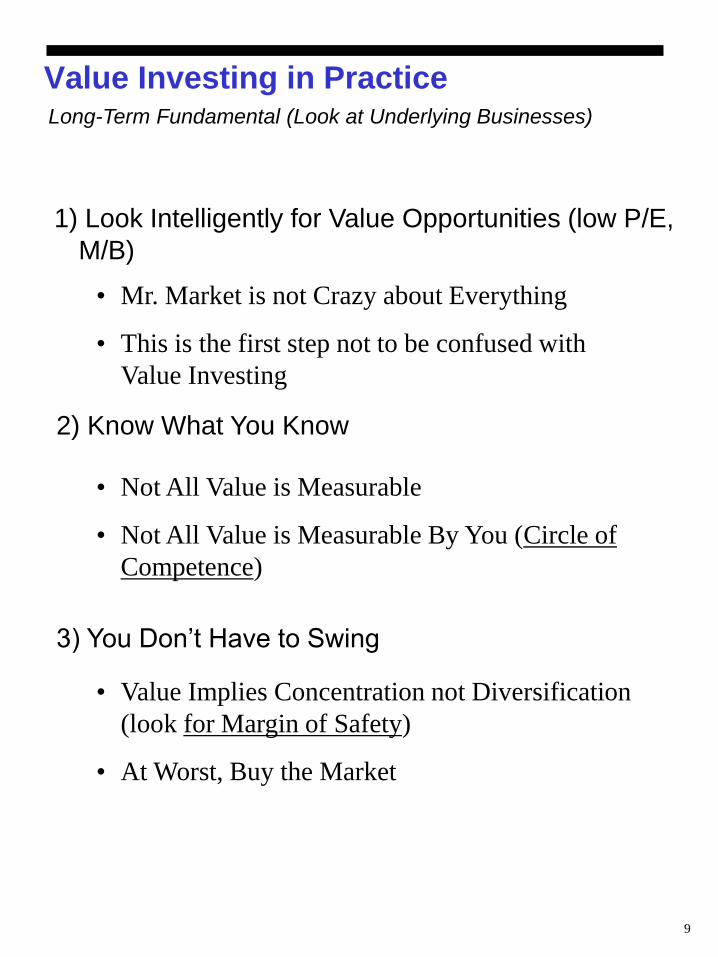
Value Investing in Practice
1) Look Intelligently for Value Opportunities (low P/E,
M/B)
2) Know What You Know
3) You Don’t Have to Swing
• Value Implies Concentration not Diversification
(look for Margin of Safety)
• At Worst, Buy the Market
• Not All Value is Measurable
• Not All Value is Measurable By You (Circle of
Competence)
• Mr. Market is not Crazy about Everything
• This is the first step not to be confused with
Value Investing
Long-Term Fundamental (Look at Underlying Businesses)
10
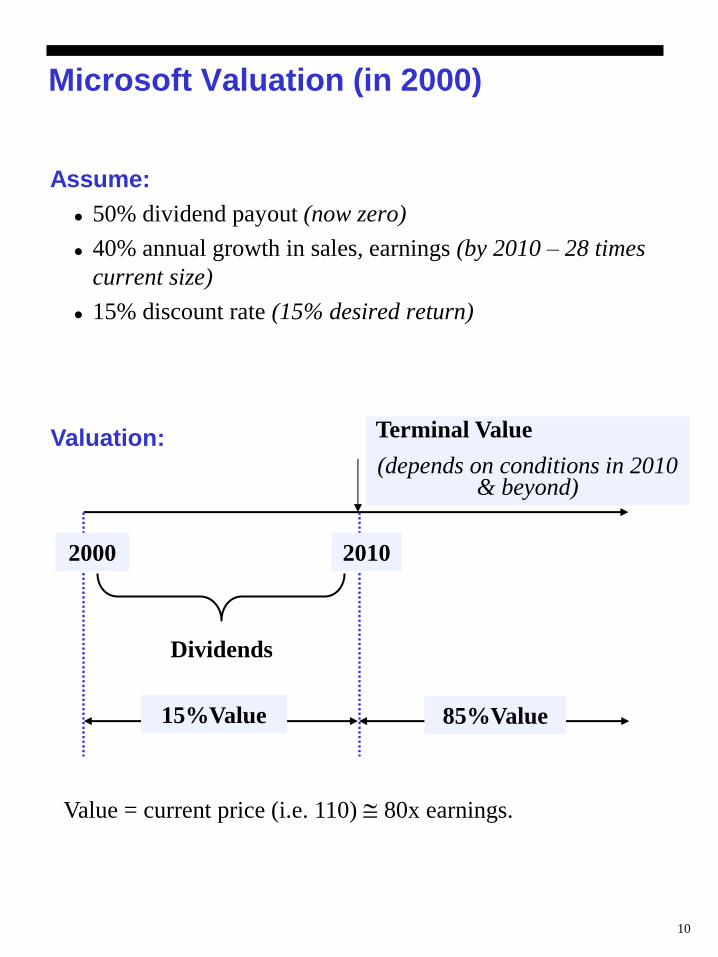
Microsoft Valuation (in 2000)
Assume:
50% dividend payout (now zero)
40% annual growth in sales, earnings (by 2010 – 28 times
current size)
15% discount rate (15% desired return)
15%Value
Terminal Value
(depends on conditions in 2010 & beyond)
Valuation:
2000 2010
Dividends
85%Value
Value = current price (i.e. 110) 80x earnings.
11
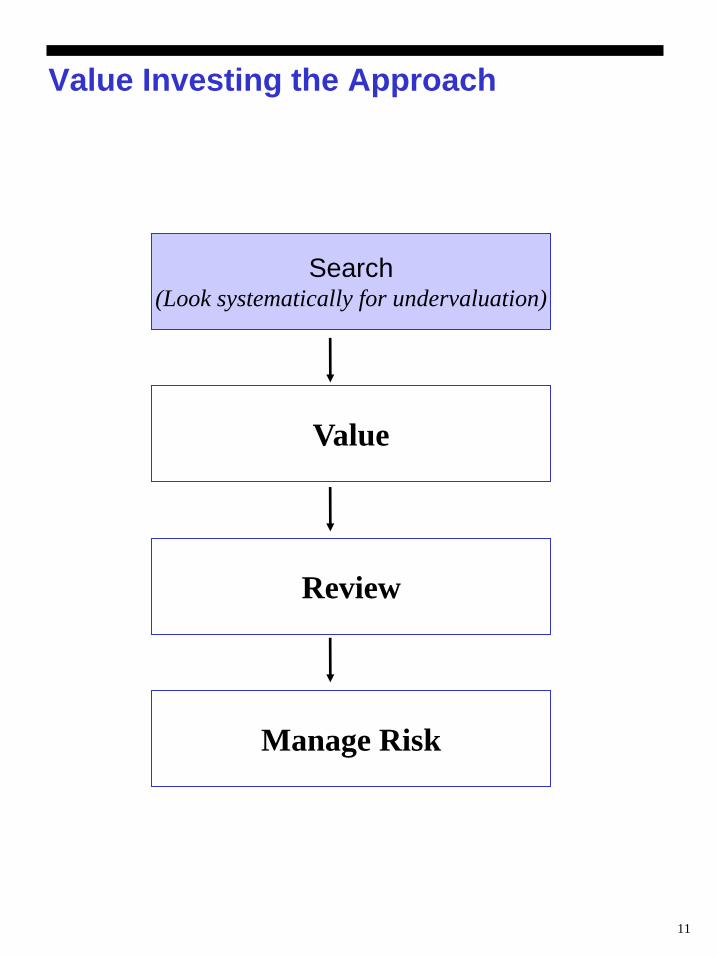
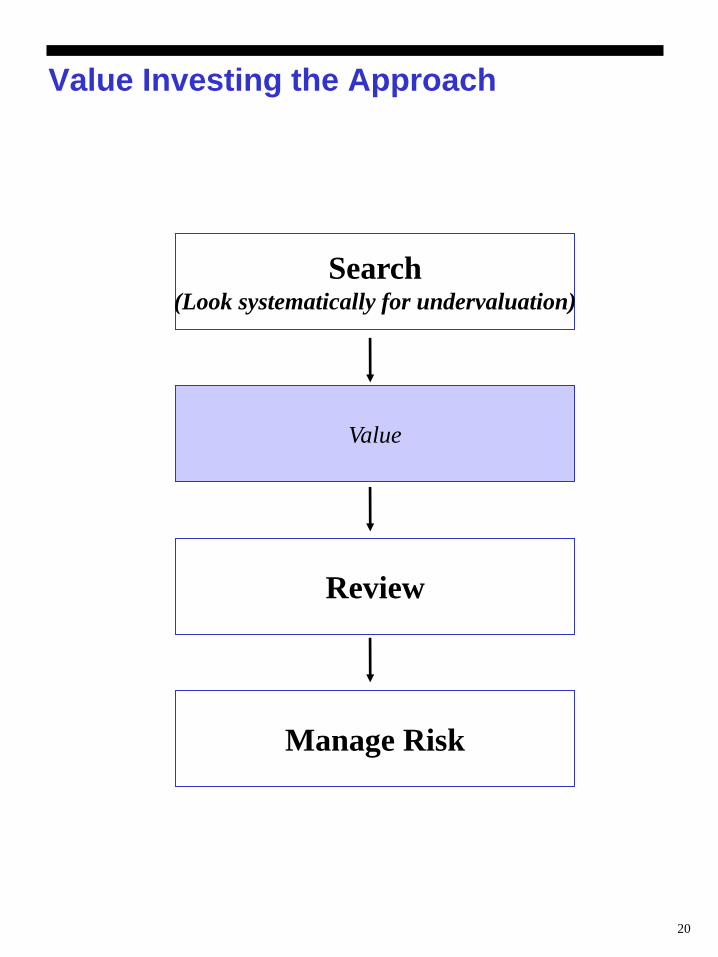
Value Investing the Approach
Value
Review
Manage Risk
Search (Look systematically for undervaluation)
12
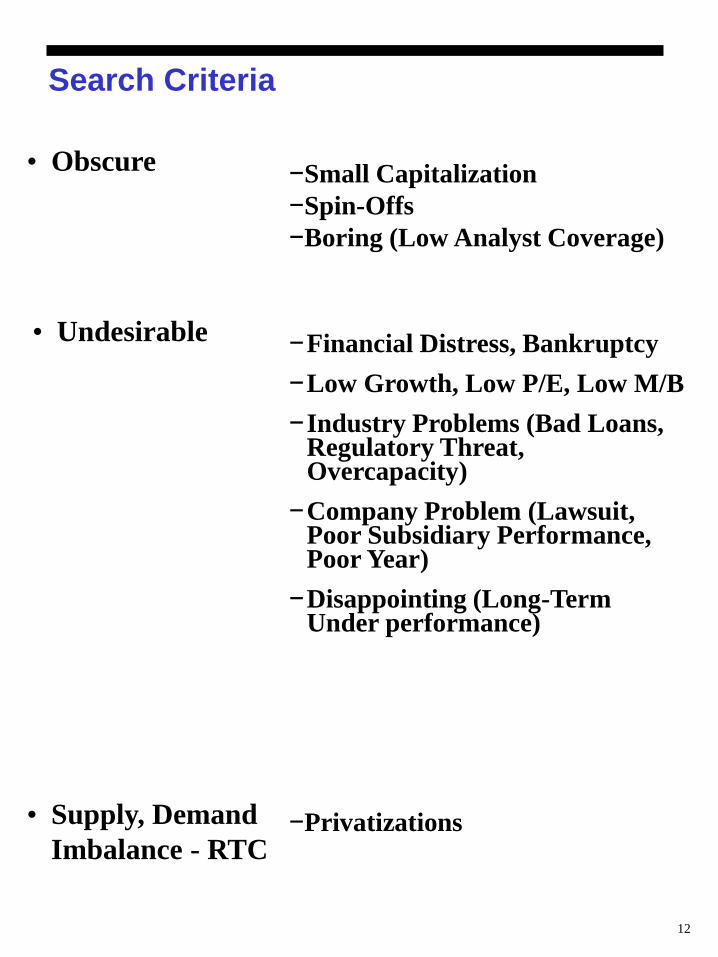
Search Criteria
• Obscure −Small Capitalization
−Spin-Offs
−Boring (Low Analyst Coverage)
• Undesirable
• Supply, Demand
Imbalance - RTC
−Financial Distress, Bankruptcy
−Low Growth, Low P/E, Low M/B
−Industry Problems (Bad Loans, Regulatory Threat, Overcapacity)
−Company Problem (Lawsuit, Poor Subsidiary Performance, Poor Year)
−Disappointing (Long-Term Under performance)
−Privatizations
13
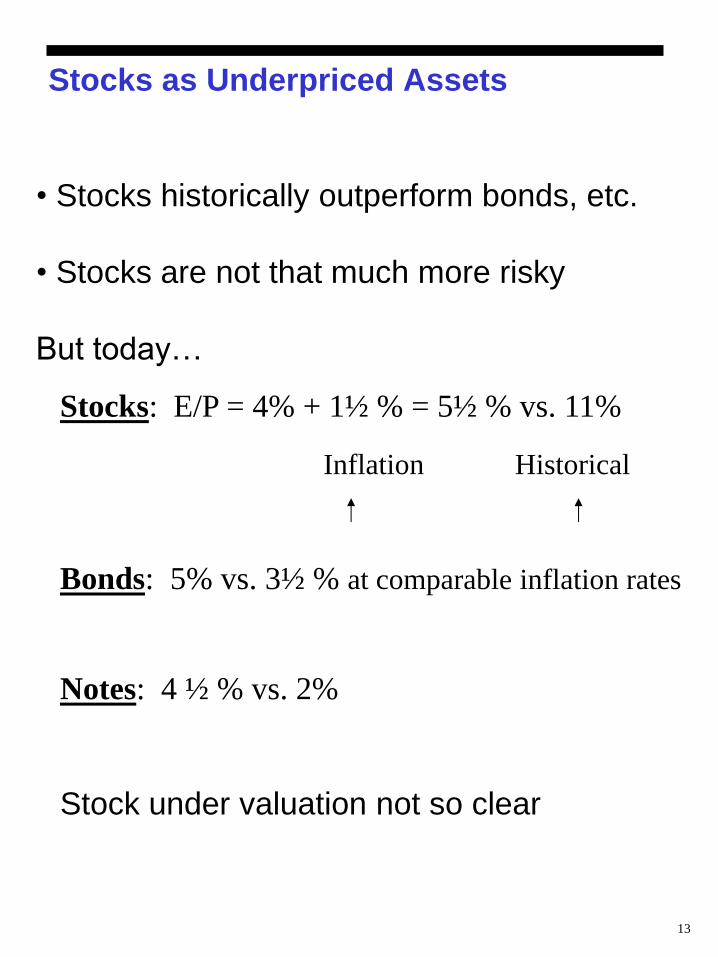
Stocks as Underpriced Assets
• Stocks historically outperform bonds, etc.
• Stocks are not that much more risky
But today…
Stocks: E/P = 4% + 1½ % = 5½ % vs. 11%
Inflation Historical
Bonds: 5% vs. 3½ % at comparable inflation rates
Notes: 4 ½ % vs. 2%
Stock under valuation not so clear
14
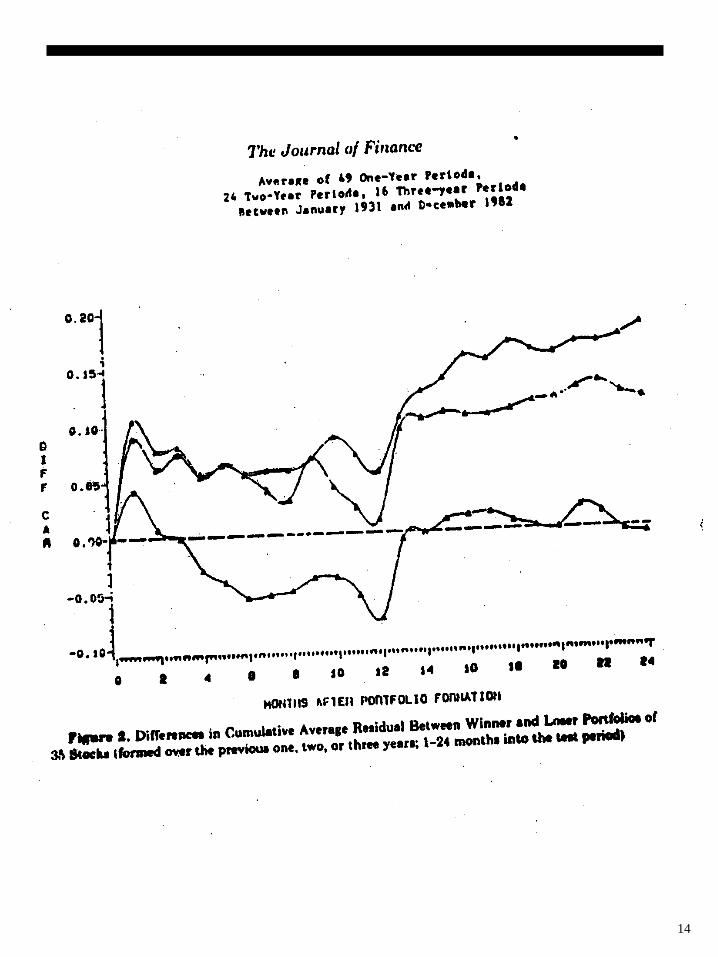
15

16
17
Systematic Biases
1. Institutional
Herding – Minimize Deviations
Window Dressing (January Effect)
Blockbusters
2. Individual
Loss Aversion
Hindsight Bias
Lotteries
18
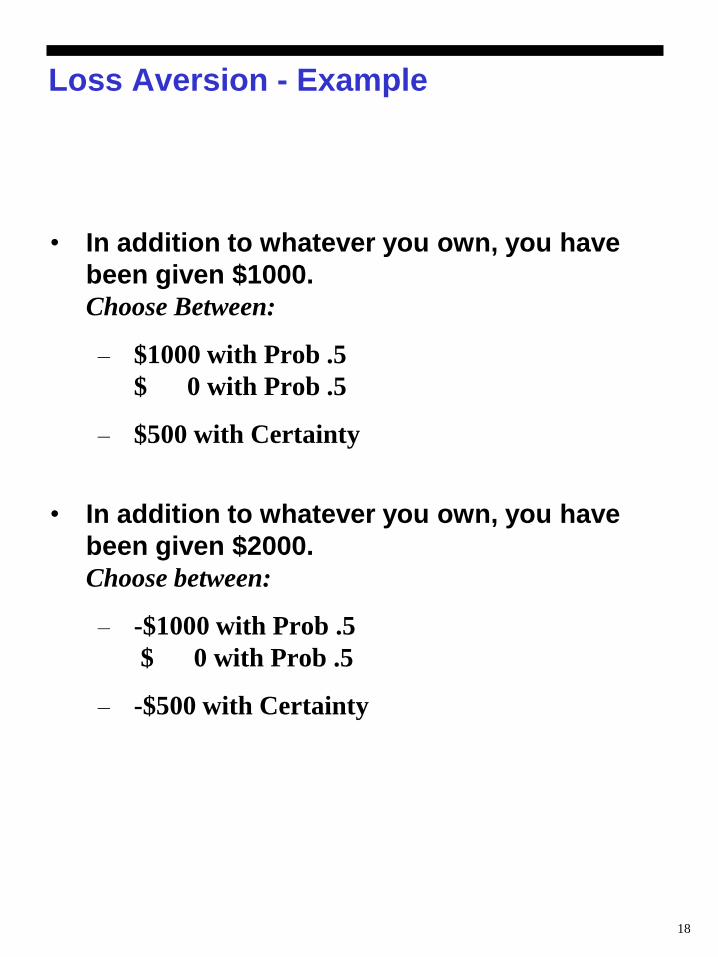
Loss Aversion - Example
• In addition to whatever you own, you have
been given $1000.
Choose Between:
– $1000 with Prob .5
$ 0 with Prob .5
– $500 with Certainty
• In addition to whatever you own, you have
been given $2000.
Choose between:
– -$1000 with Prob .5
$ 0 with Prob .5
– -$500 with Certainty
19
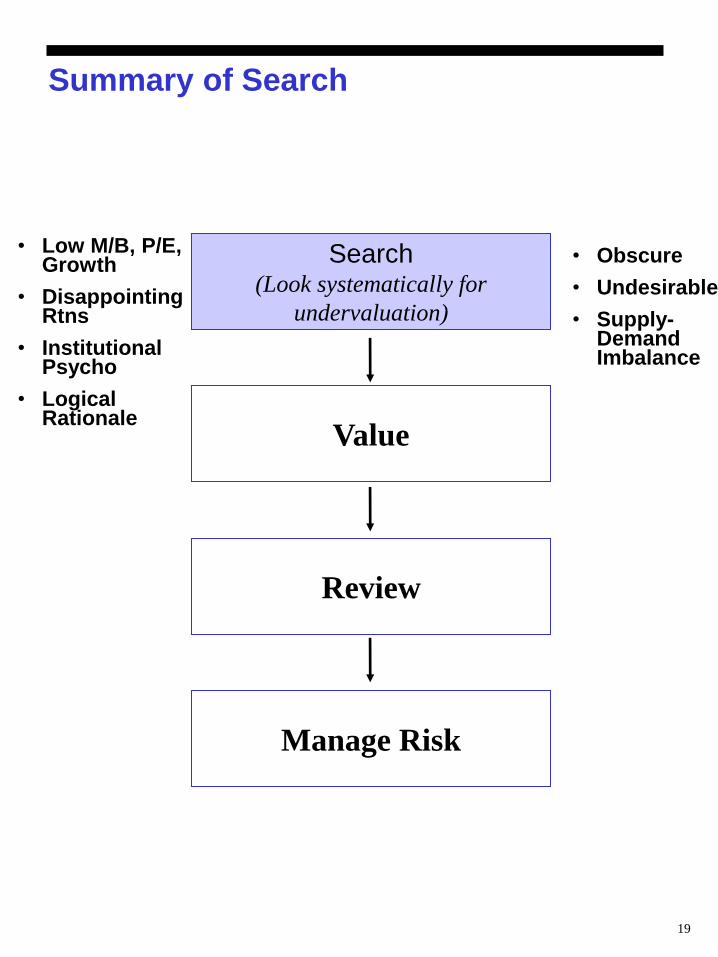
Summary of Search
Value
Review
Manage Risk
Search (Look systematically for
undervaluation)
• Low M/B, P/E, Growth
• Disappointing Rtns
• Institutional Psycho
• Logical Rationale
• Obscure
• Undesirable
• Supply-Demand Imbalance
20
Value Investing the Approach
Value
Review
Manage Risk
Search (Look systematically for undervaluation)
21
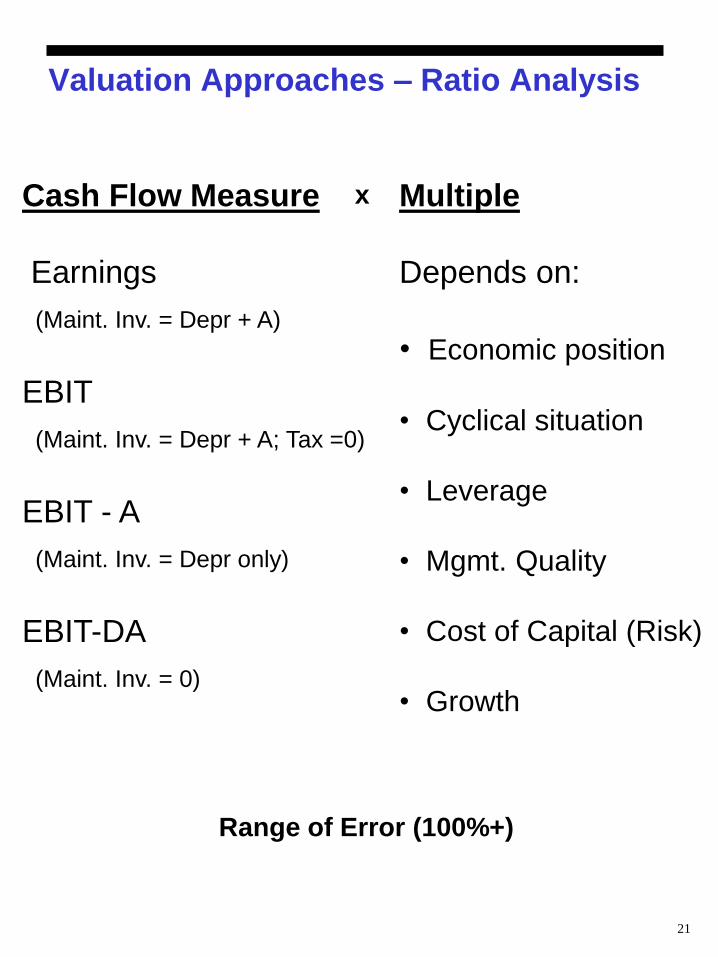
Valuation Approaches – Ratio Analysis
Cash Flow Measure
Earnings
(Maint. Inv. = Depr + A)
EBIT
(Maint. Inv. = Depr + A; Tax =0)
EBIT - A
(Maint. Inv. = Depr only)
EBIT-DA
(Maint. Inv. = 0)
Multiple
Depends on:
• Economic position
• Cyclical situation
• Leverage
• Mgmt. Quality
• Cost of Capital (Risk)
• Growth
x
Range of Error (100%+)
22
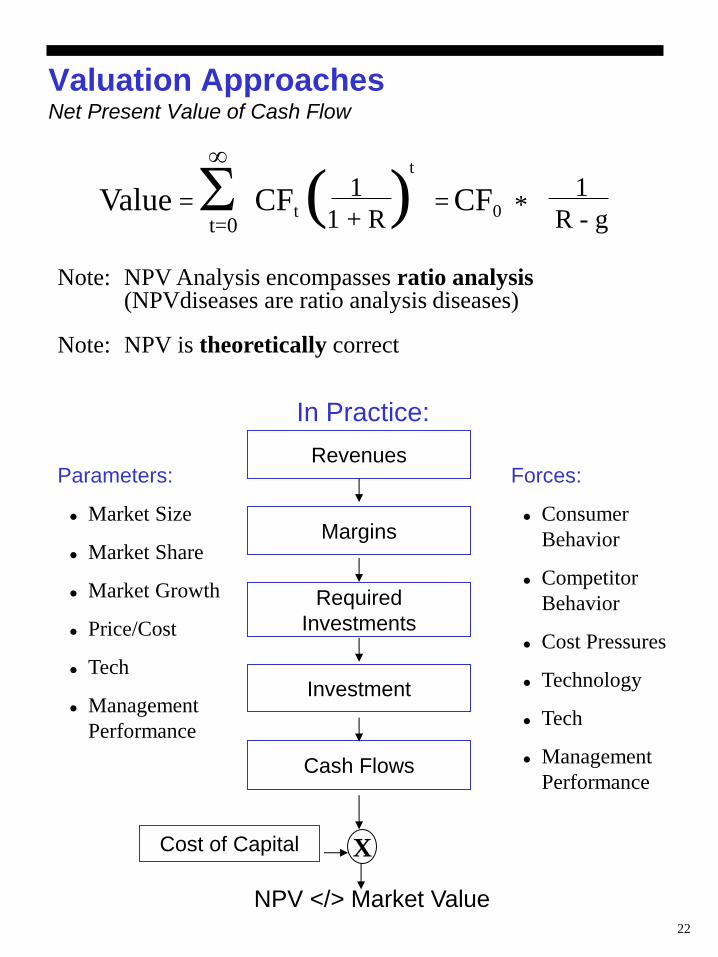
Valuation Approaches Net Present Value of Cash Flow
Value = CFt = CF0 1
1 + R ( )
t
1
R - g *
t=0
Note: NPV Analysis encompasses ratio analysis (NPVdiseases are ratio analysis diseases)
Note: NPV is theoretically correct
Revenues
Margins
Required
Investments
Investment
Cash Flows
Cost of Capital
NPV </> Market Value
Parameters:
Market Size
Market Share
Market Growth
Price/Cost
Tech
Management
Performance
Forces:
Consumer
Behavior
Competitor
Behavior
Cost Pressures
Technology
Tech
Management
Performance
In Practice:
X
23
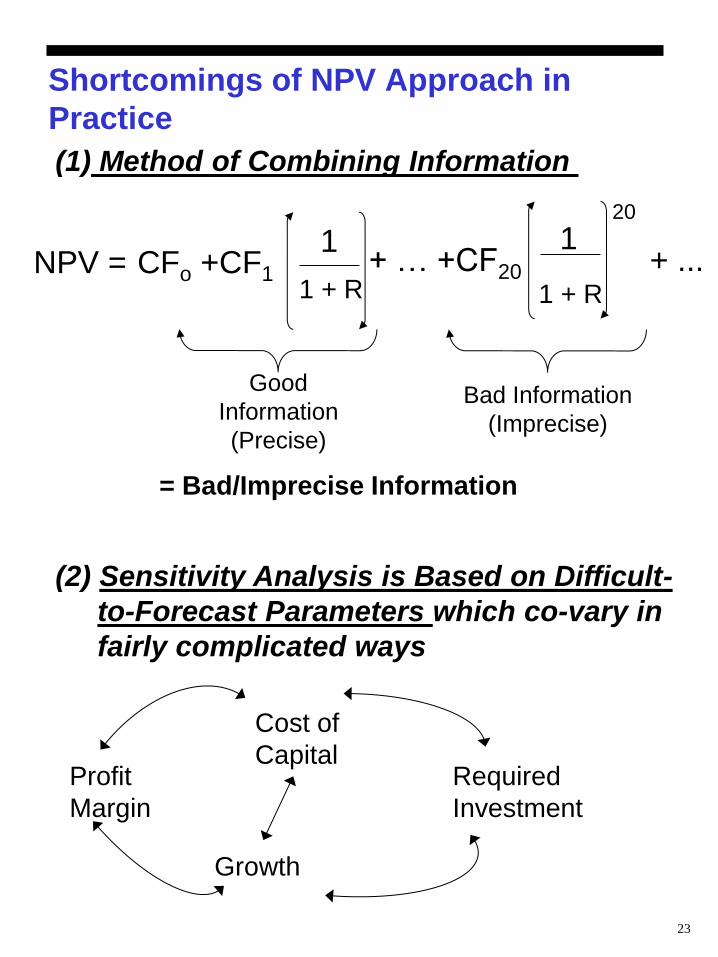
Shortcomings of NPV Approach in
Practice
(1) Method of Combining Information
(2) Sensitivity Analysis is Based on Difficult-
to-Forecast Parameters which co-vary in
fairly complicated ways
NPV = CFo +CF1 1
1 + R 1 + R
+ … +CF20
20 1
+ ...
Good
Information
(Precise)
Bad Information
(Imprecise)
= Bad/Imprecise Information
Profit
Margin
Cost of
Capital
Growth
Required
Investment
24
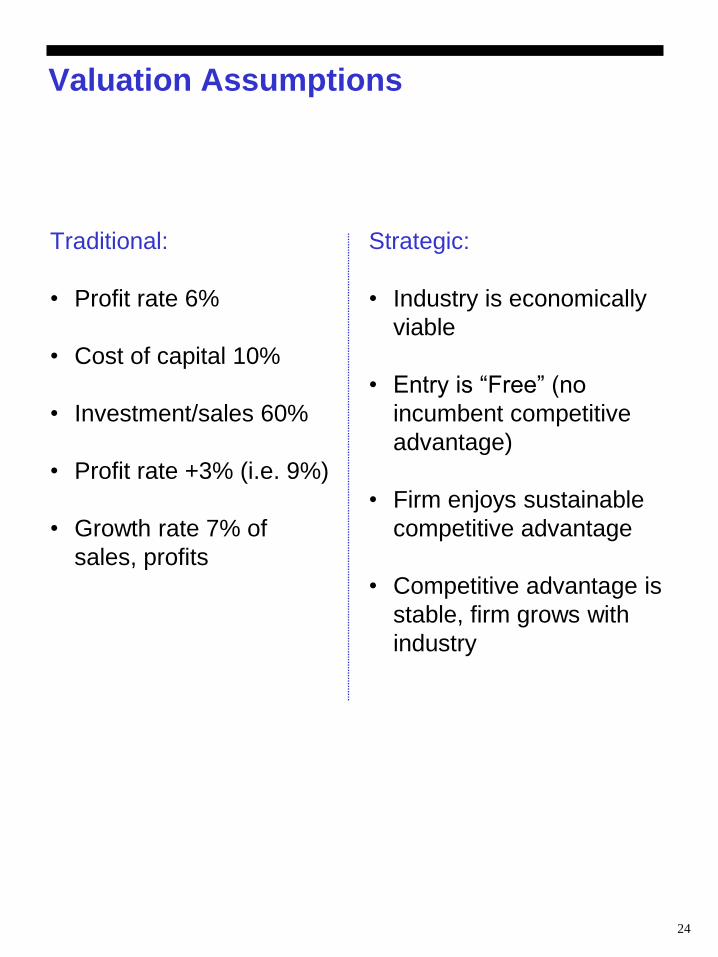
Valuation Assumptions
Traditional:
• Profit rate 6%
• Cost of capital 10%
• Investment/sales 60%
• Profit rate +3% (i.e. 9%)
• Growth rate 7% of
sales, profits
Strategic:
• Industry is economically
viable
• Entry is “Free” (no
incumbent competitive
advantage)
• Firm enjoys sustainable
competitive advantage
• Competitive advantage is
stable, firm grows with
industry
25
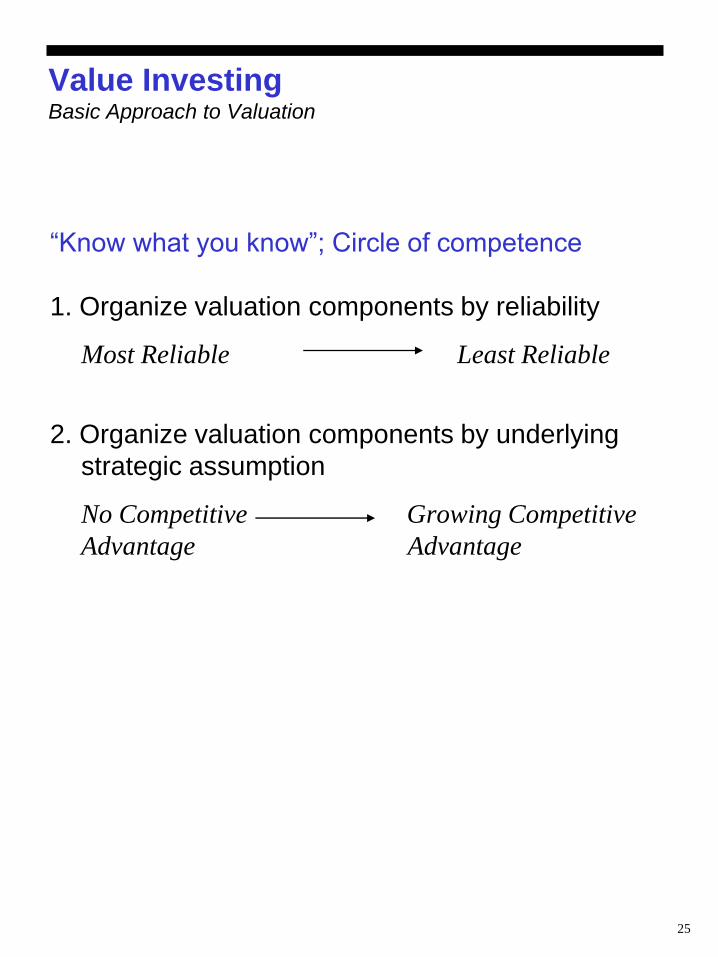
Value Investing Basic Approach to Valuation
“Know what you know”; Circle of competence
1. Organize valuation components by reliability
Most Reliable Least Reliable
2. Organize valuation components by underlying
strategic assumption
No Competitive Growing Competitive
Advantage Advantage
26
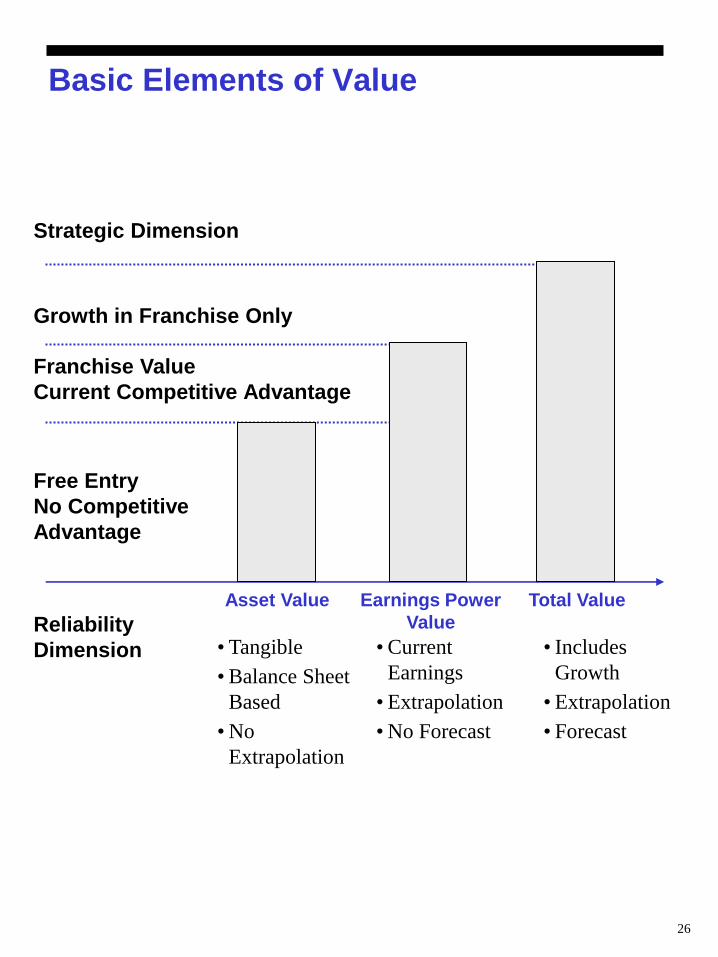
Basic Elements of Value
Strategic Dimension
Growth in Franchise Only
Franchise Value
Current Competitive Advantage
Free Entry
No Competitive
Advantage
Asset Value Earnings Power
Value
Total Value
• Tangible
• Balance Sheet
Based
• No
Extrapolation
• Current
Earnings
• Extrapolation
• No Forecast
• Includes
Growth
• Extrapolation
• Forecast
Reliability
Dimension
27
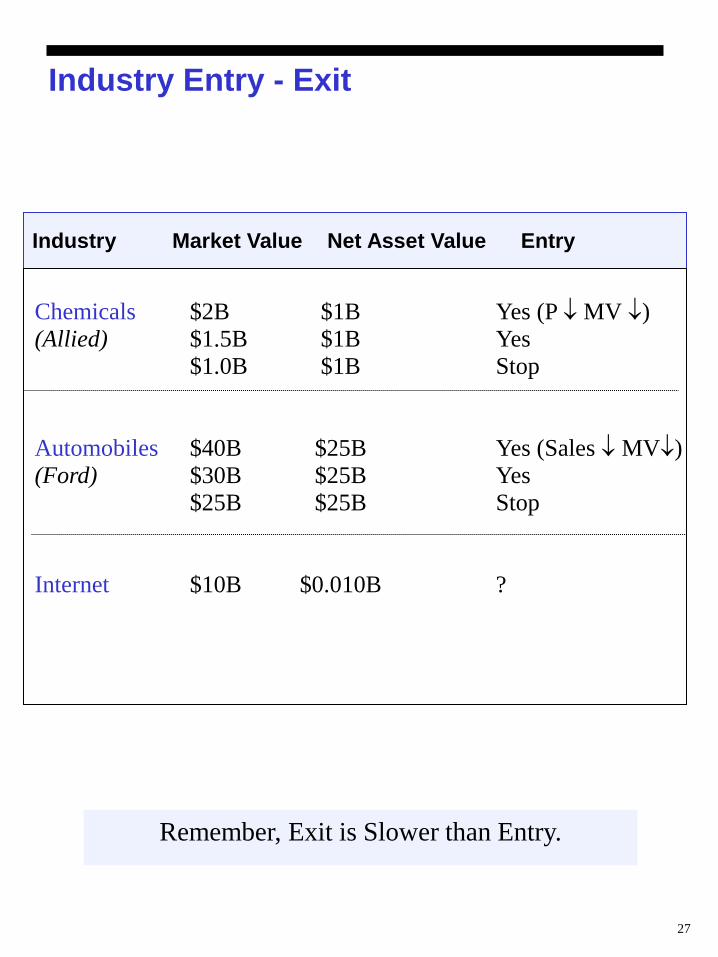
Industry Entry - Exit
Remember, Exit is Slower than Entry.
Industry Market Value Net Asset Value Entry
Chemicals $2B $1B Yes (P MV )
(Allied) $1.5B $1B Yes
$1.0B $1B Stop
Automobiles $40B $25B Yes (Sales MV)
(Ford) $30B $25B Yes
$25B $25B Stop
Internet $10B $0.010B ?
28
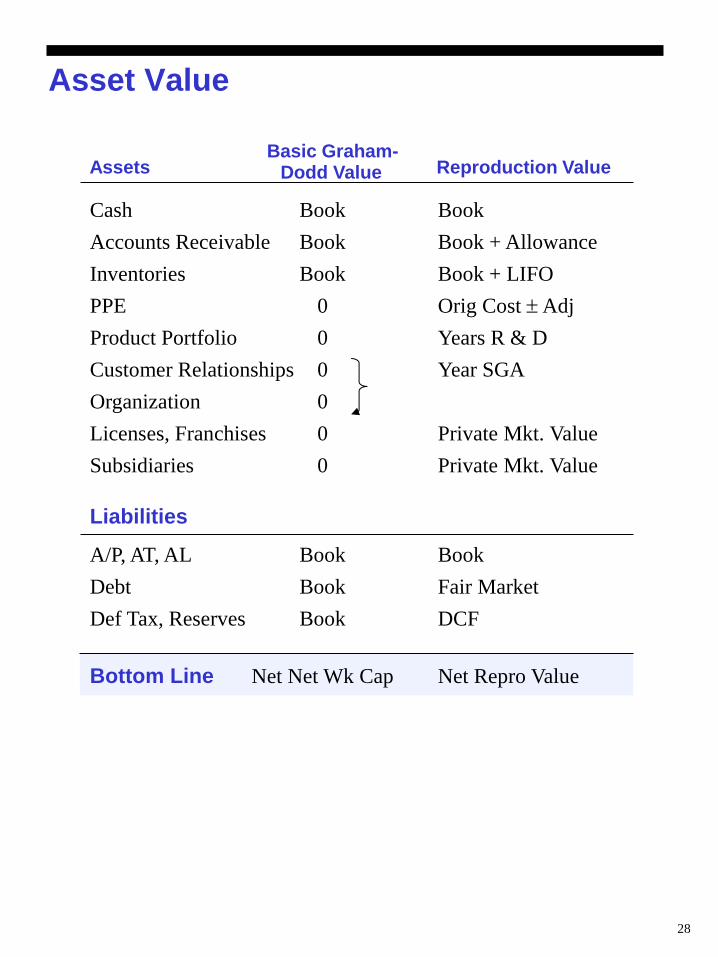
Asset Value
Assets
Cash Book Book
Accounts Receivable Book Book + Allowance
Inventories Book Book + LIFO
PPE 0 Orig Cost Adj
Product Portfolio 0 Years R & D
Customer Relationships 0 Year SGA
Organization 0
Licenses, Franchises 0 Private Mkt. Value
Subsidiaries 0 Private Mkt. Value
Liabilities
A/P, AT, AL Book Book
Debt Book Fair Market
Def Tax, Reserves Book DCF
Bottom Line Net Net Wk Cap Net Repro Value
Reproduction Value Basic Graham-
Dodd Value
29
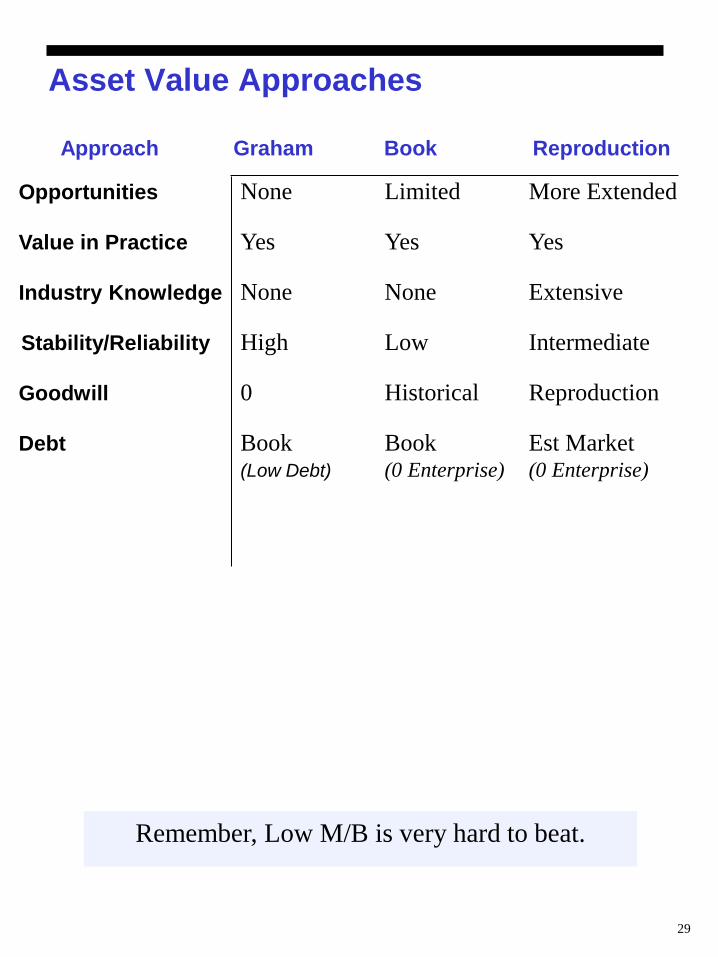
Asset Value Approaches
Remember, Low M/B is very hard to beat.
Opportunities None Limited More Extended
Value in Practice Yes Yes Yes
Industry Knowledge None None Extensive
Stability/Reliability High Low Intermediate
Goodwill 0 Historical Reproduction
Debt Book Book Est Market (Low Debt) (0 Enterprise) (0 Enterprise)
Approach Graham Book Reproduction
30
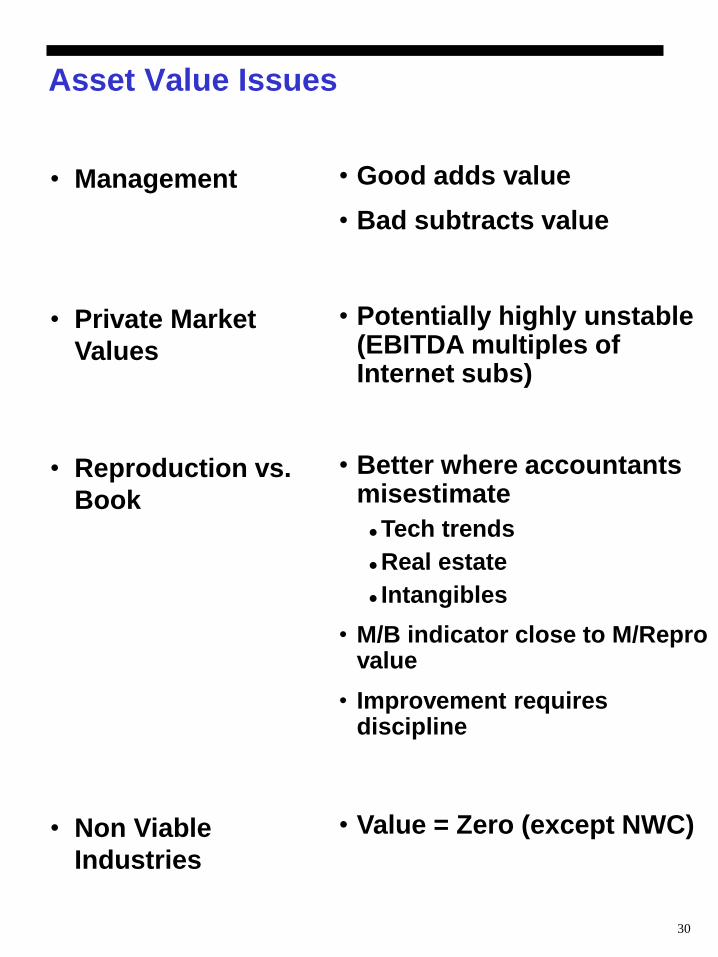
Asset Value Issues
• Management
• Private Market
Values
• Reproduction vs.
Book
• Non Viable
Industries
• Good adds value
• Bad subtracts value
• Potentially highly unstable (EBITDA multiples of Internet subs)
• Better where accountants misestimate
Tech trends
Real estate
Intangibles
• M/B indicator close to M/Repro value
• Improvement requires discipline
• Value = Zero (except NWC)
31
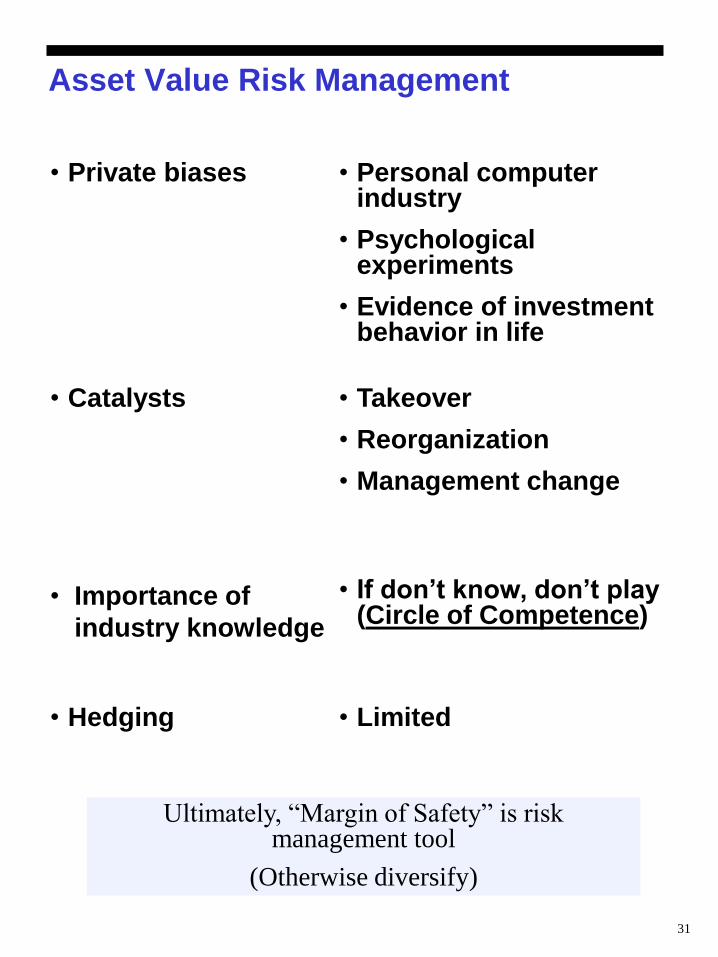
Asset Value Risk Management
• Private biases
• Catalysts
• Importance of
industry knowledge
• Hedging
• Personal computer industry
• Psychological experiments
• Evidence of investment behavior in life
• Takeover
• Reorganization
• Management change
• If don’t know, don’t play (Circle of Competence)
• Limited
Ultimately, “Margin of Safety” is risk management tool
(Otherwise diversify)
32
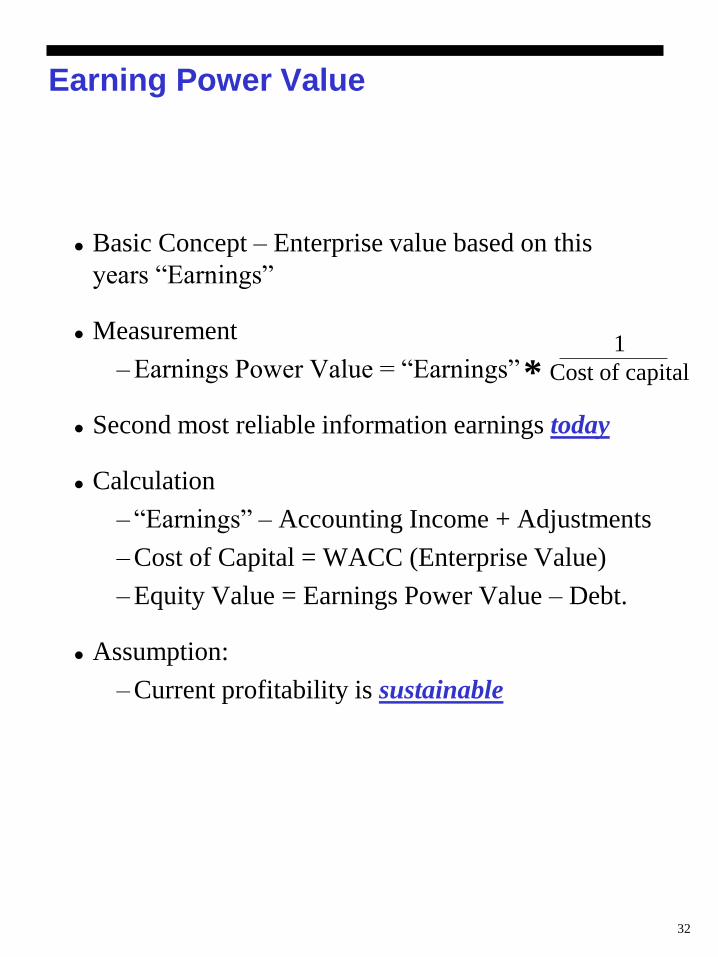
Earning Power Value
Basic Concept – Enterprise value based on this
years “Earnings”
Measurement
– Earnings Power Value = “Earnings”
Second most reliable information earnings today
Calculation
– “Earnings” – Accounting Income + Adjustments
– Cost of Capital = WACC (Enterprise Value)
– Equity Value = Earnings Power Value – Debt.
Assumption:
– Current profitability is sustainable
1
Cost of capital *
33
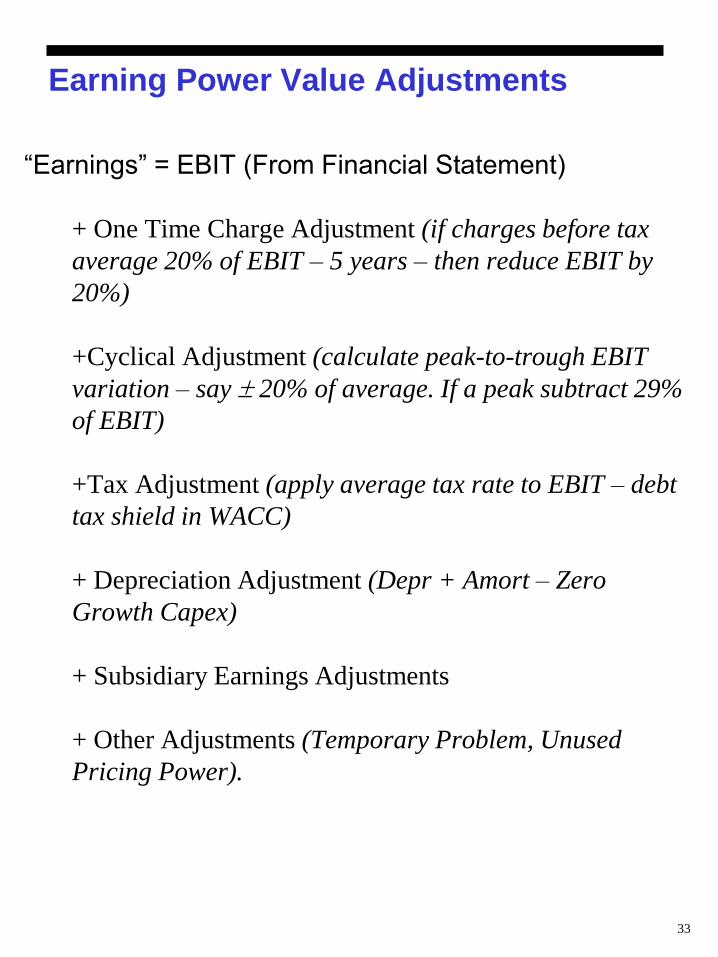
Earning Power Value Adjustments
“Earnings” = EBIT (From Financial Statement)
+ One Time Charge Adjustment (if charges before tax
average 20% of EBIT – 5 years – then reduce EBIT by
20%)
+Cyclical Adjustment (calculate peak-to-trough EBIT
variation – say 20% of average. If a peak subtract 29%
of EBIT)
+Tax Adjustment (apply average tax rate to EBIT – debt
tax shield in WACC)
+ Depreciation Adjustment (Depr + Amort – Zero
Growth Capex)
+ Subsidiary Earnings Adjustments
+ Other Adjustments (Temporary Problem, Unused
Pricing Power).
34
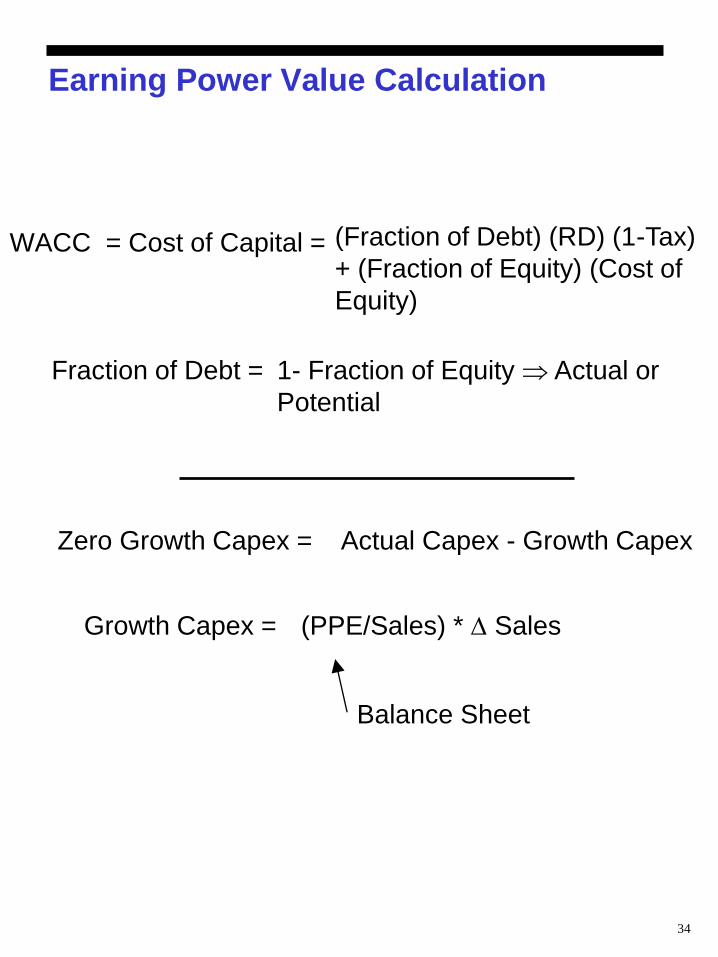
Earning Power Value Calculation
WACC = Cost of Capital =
(Fraction of Debt) (RD) (1-Tax)
+ (Fraction of Equity) (Cost of
Equity)
Fraction of Debt = 1- Fraction of Equity Actual or
Potential
Zero Growth Capex =
Actual Capex - Growth Capex
Growth Capex =
(PPE/Sales) * Sales
Balance Sheet
35
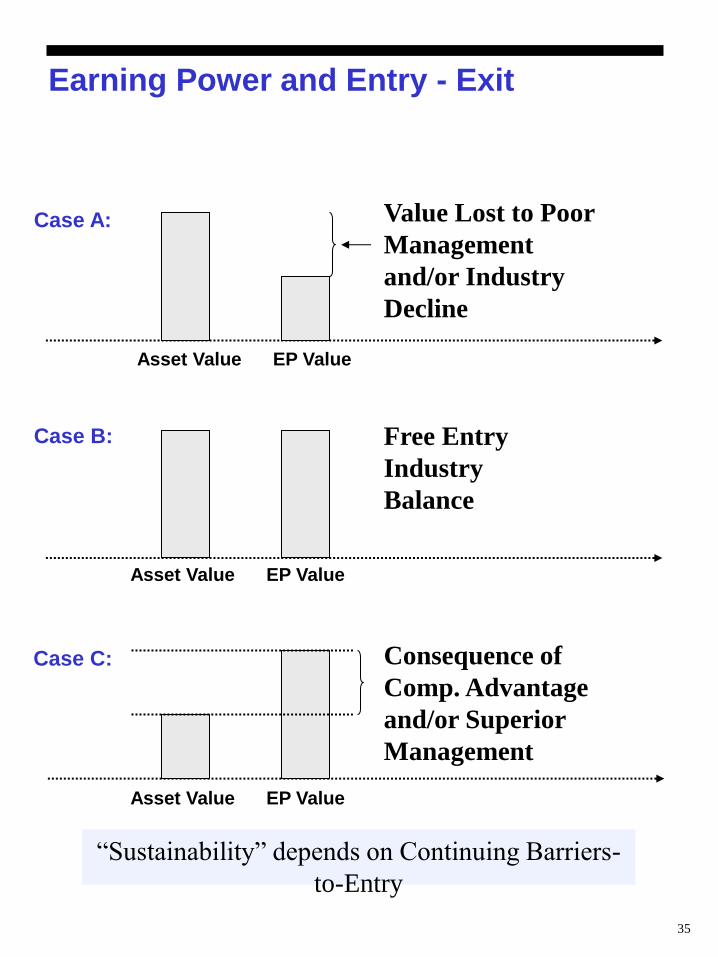
Earning Power and Entry - Exit
Asset Value EP Value
Case B: Free Entry
Industry
Balance
Case A:
Asset Value EP Value
Value Lost to Poor
Management
and/or Industry
Decline
Asset Value EP Value
Case C: Consequence of
Comp. Advantage
and/or Superior
Management
“Sustainability” depends on Continuing Barriers-
to-Entry
36
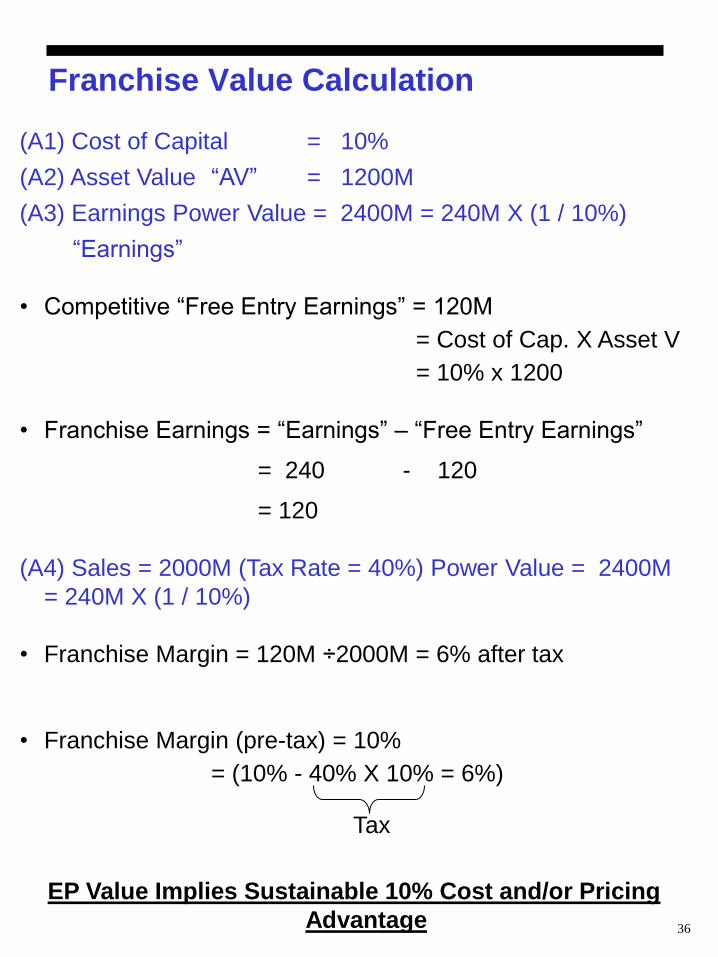
Franchise Value Calculation
(A1) Cost of Capital = 10%
(A2) Asset Value “AV” = 1200M
(A3) Earnings Power Value = 2400M = 240M X (1 / 10%)
“Earnings”
• Competitive “Free Entry Earnings” = 120M
= Cost of Cap. X Asset V
= 10% x 1200
• Franchise Earnings = “Earnings” – “Free Entry Earnings”
= 240 - 120
= 120
(A4) Sales = 2000M (Tax Rate = 40%) Power Value = 2400M
= 240M X (1 / 10%)
• Franchise Margin = 120M ÷2000M = 6% after tax
• Franchise Margin (pre-tax) = 10%
= (10% - 40% X 10% = 6%)
Tax
EP Value Implies Sustainable 10% Cost and/or Pricing
Advantage
37
Earnings Power Value Issues
Nature and sustainability of barriers-to-
entry (competitive advantage)
Sustainability of management quality
Quality of reinvestment opportunities
Value of cash
–Subtract interest earned from
–EBIT add
–Cash to EP value
Inflation adjustment
38
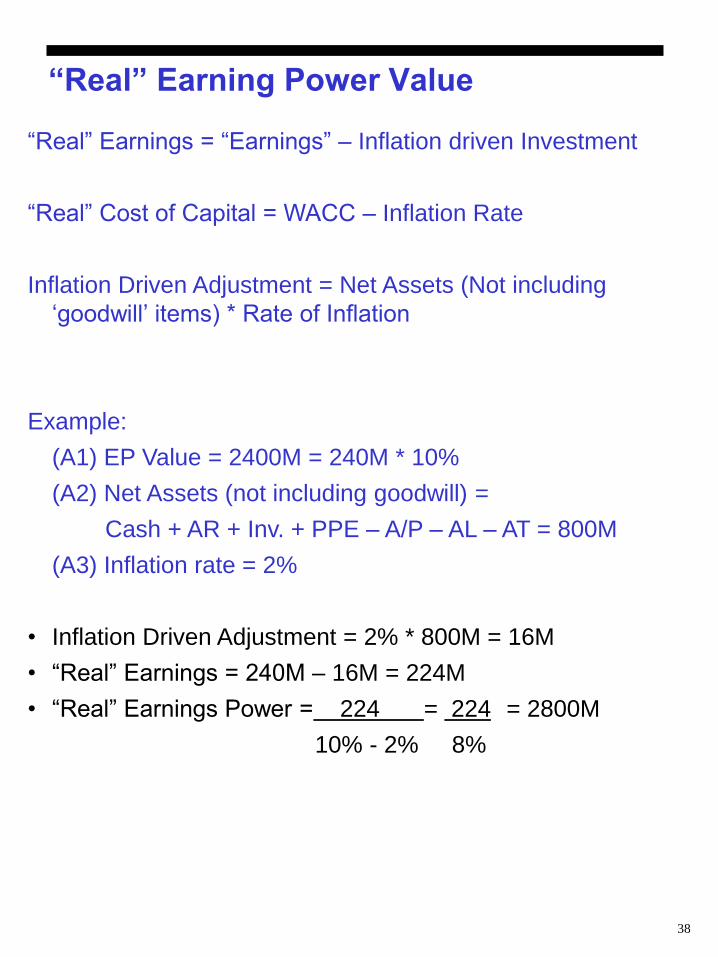
“Real” Earning Power Value
“Real” Earnings = “Earnings” – Inflation driven Investment
“Real” Cost of Capital = WACC – Inflation Rate
Inflation Driven Adjustment = Net Assets (Not including
‘goodwill’ items) * Rate of Inflation
Example:
(A1) EP Value = 2400M = 240M * 10%
(A2) Net Assets (not including goodwill) =
Cash + AR + Inv. + PPE – A/P – AL – AT = 800M
(A3) Inflation rate = 2%
• Inflation Driven Adjustment = 2% * 800M = 16M
• “Real” Earnings = 240M – 16M = 224M
• “Real” Earnings Power = 224 = 224 = 2800M
10% - 2% 8%
39
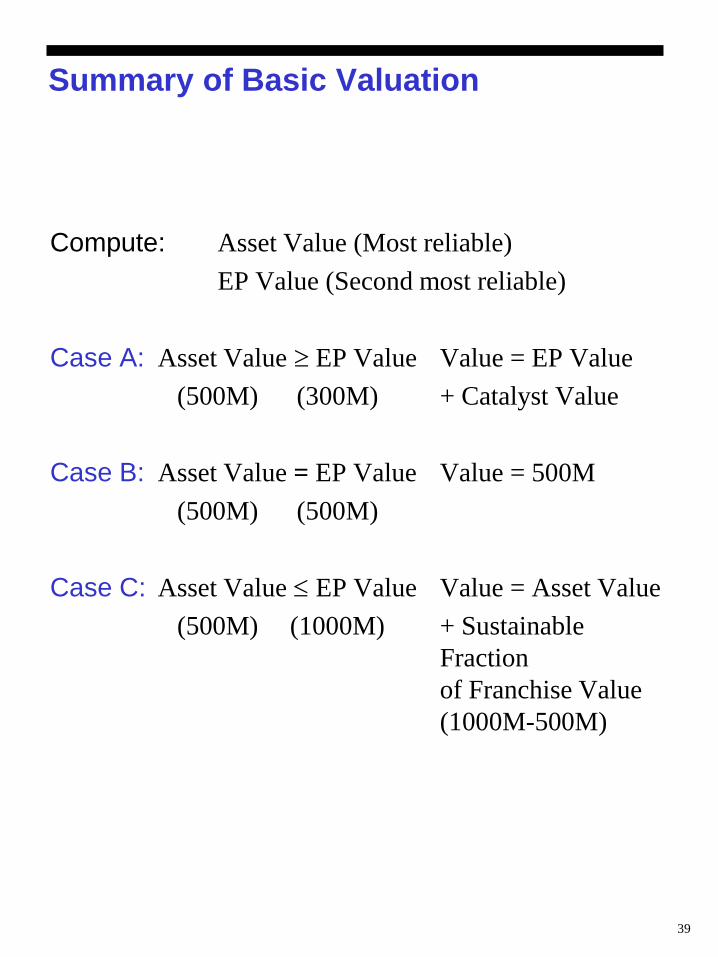
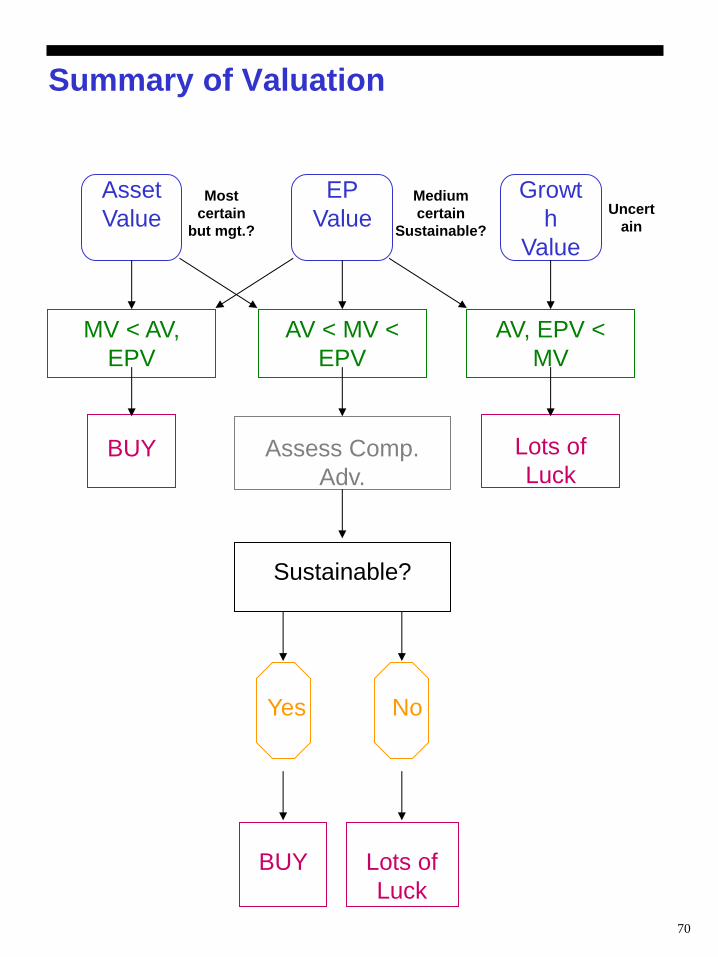
Summary of Basic Valuation
Compute: Asset Value (Most reliable)
EP Value (Second most reliable)
Case A: Asset Value EP Value Value = EP Value
(500M) (300M) + Catalyst Value
Case B: Asset Value = EP Value Value = 500M
(500M) (500M)
Case C: Asset Value EP Value Value = Asset Value
(500M) (1000M) + Sustainable
Fraction
of Franchise Value
(1000M-500M)
40
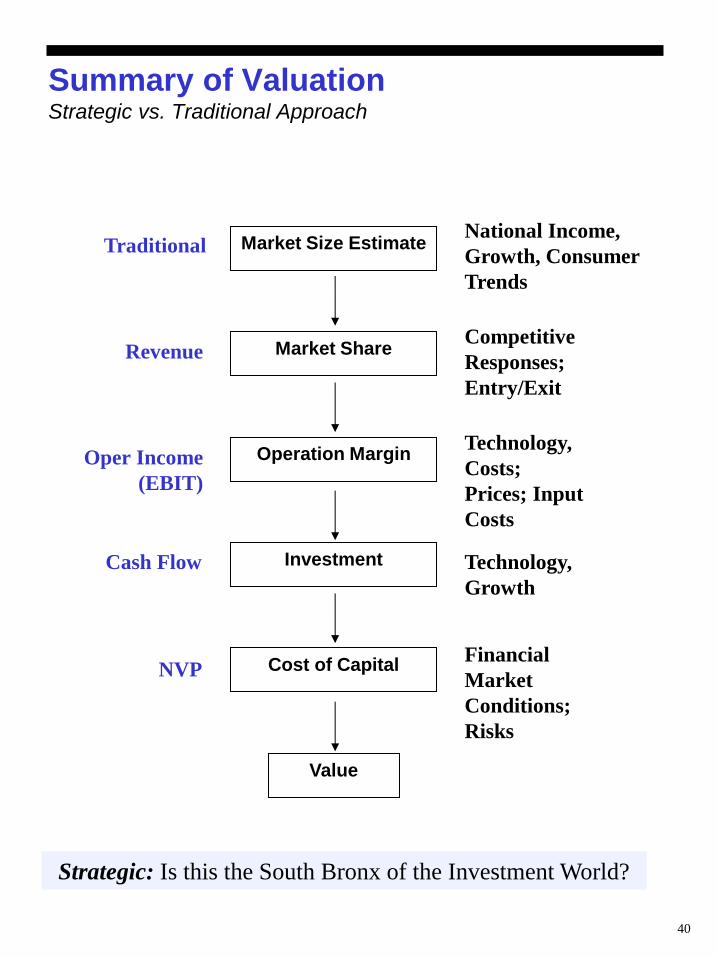
Summary of Valuation Strategic vs. Traditional Approach
Market Size Estimate
Market Share
Operation Margin
Investment
Cost of Capital
Value
Traditional
Revenue
Oper Income
(EBIT)
Cash Flow
NVP
National Income,
Growth, Consumer
Trends
Competitive
Responses;
Entry/Exit
Technology,
Costs;
Prices; Input
Costs
Technology,
Growth
Financial
Market
Conditions;
Risks
Strategic: Is this the South Bronx of the Investment World?
41
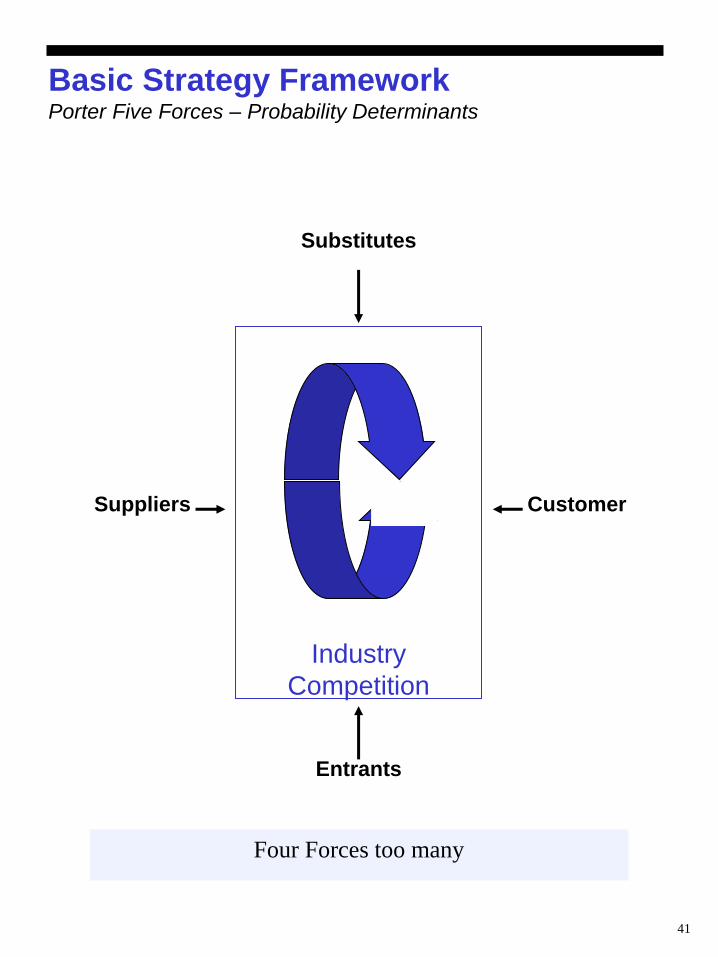
Basic Strategy Framework Porter Five Forces – Probability Determinants
Four Forces too many
Substitutes
Customer Suppliers
Entrants
Industry
Competition
42
Strategic Investment Forces
• Entry-Expansion – Barriers-to-Entry
“Incumbent Competitive Advantage”
Does this company enjoy competitive advantage that is
significant?
Yes – Being industry creates value
No – Efficient Operation may create value
Others enjoy advantage – stay out. (Being in industry
destroys value)
What about entrant advantages?
No good – after entry you become incumbent.
• Existing Competitor Dynamics Degree of
Competition (Phillip Morris)
• Share the Wealth (Workers, Customers) Value
Chain Dynamics
43
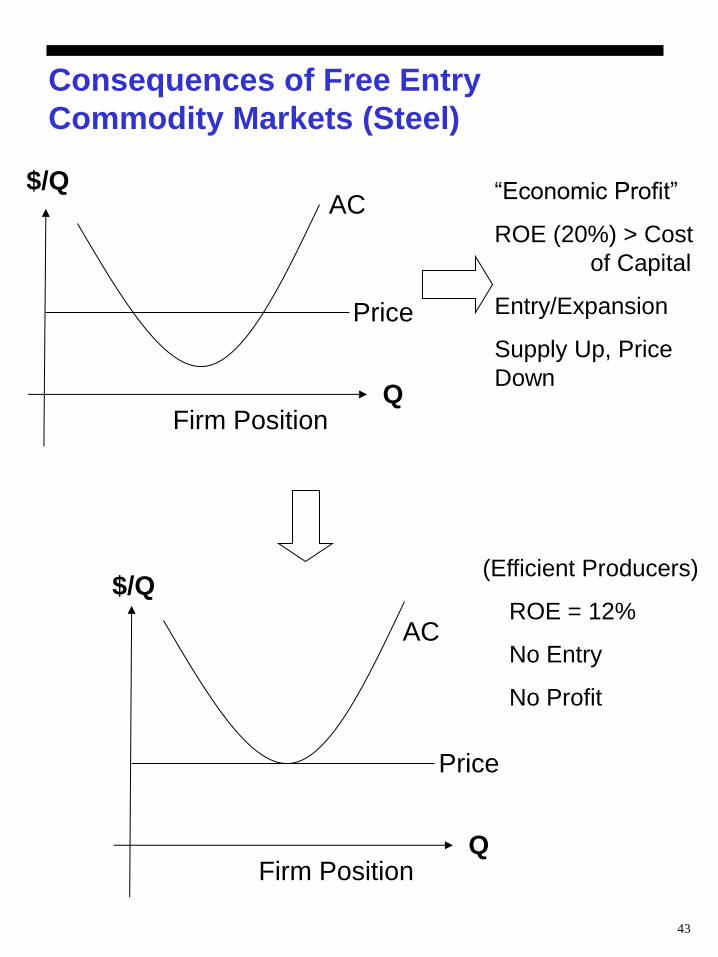
Consequences of Free Entry
Commodity Markets (Steel)
$/Q
Q Firm Position
Price
AC “Economic Profit”
ROE (20%) > Cost
of Capital
Entry/Expansion
Supply Up, Price
Down
$/Q
Q Firm Position
Price
AC
(Efficient Producers)
ROE = 12%
No Entry
No Profit
44
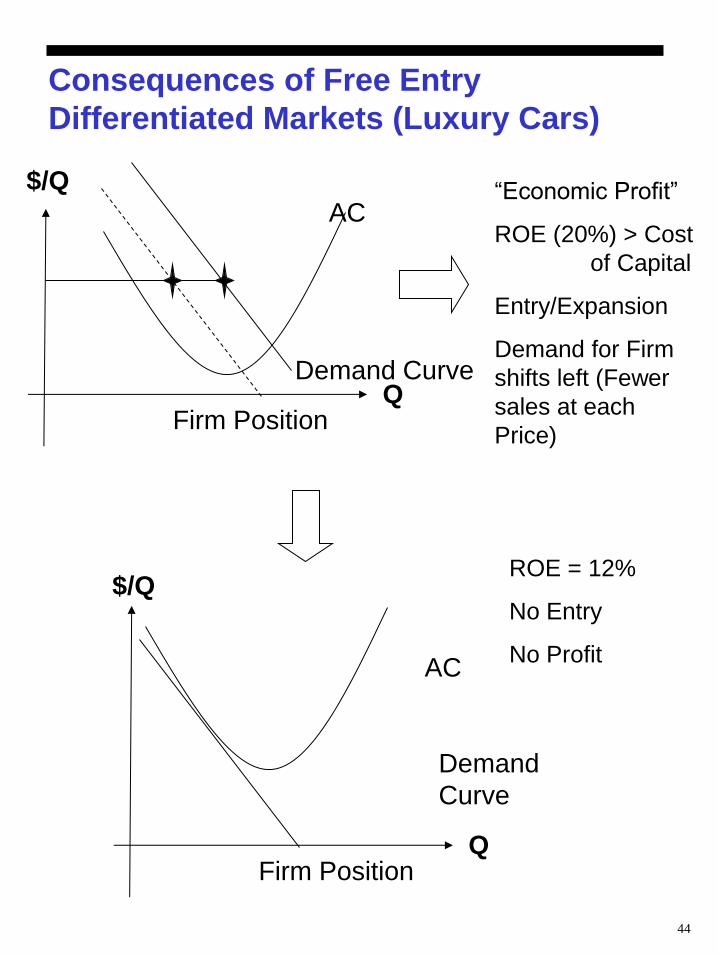
Consequences of Free Entry
Differentiated Markets (Luxury Cars)
$/Q
Q Firm Position
Demand Curve
AC “Economic Profit”
ROE (20%) > Cost
of Capital
Entry/Expansion
Demand for Firm
shifts left (Fewer
sales at each
Price)
$/Q
Q Firm Position
Demand
Curve
AC
ROE = 12%
No Entry
No Profit
45
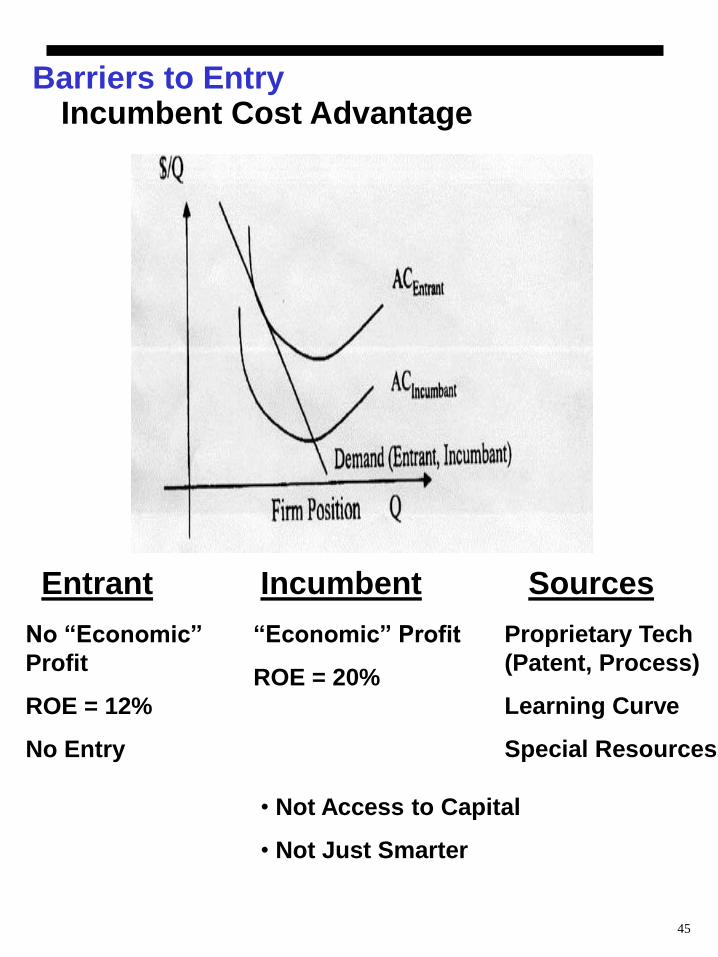
Barriers to Entry Incumbent Cost Advantage
Entrant Incumbent Sources
No “Economic”
Profit
ROE = 12%
No Entry
“Economic” Profit
ROE = 20%
Proprietary Tech
(Patent, Process)
Learning Curve
Special Resources
• Not Access to Capital
• Not Just Smarter
46
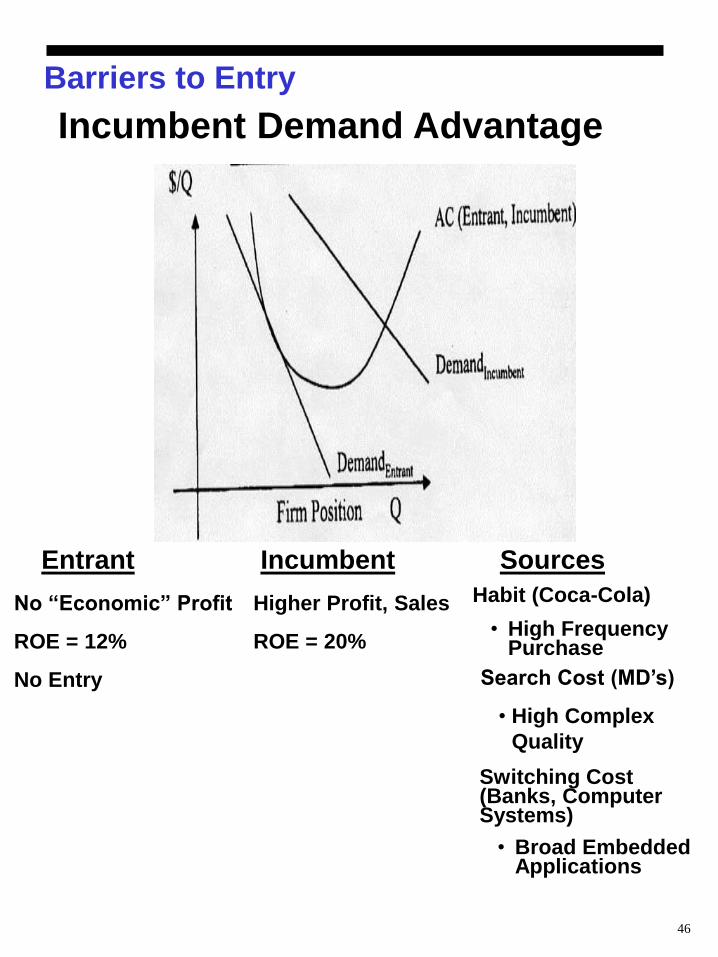
Barriers to Entry
Incumbent Demand Advantage
Entrant Incumbent Sources
No “Economic” Profit
ROE = 12%
No Entry
Higher Profit, Sales
ROE = 20%
Habit (Coca-Cola)
• High Frequency Purchase
Search Cost (MD’s)
• High Complex
Quality
Switching Cost (Banks, Computer Systems)
• Broad Embedded Applications
47
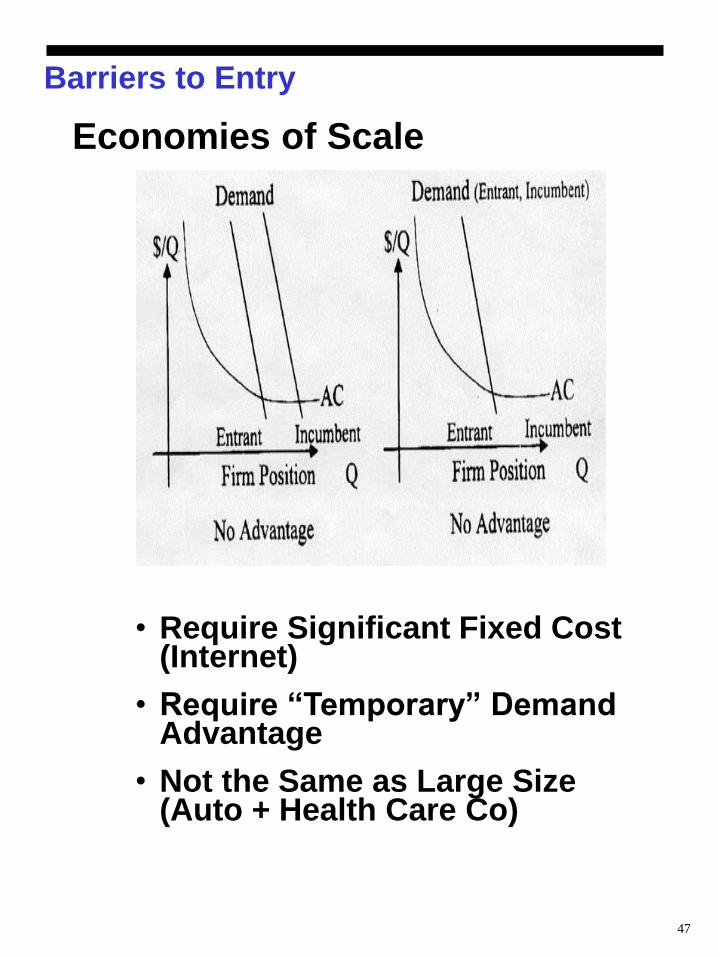
Barriers to Entry
Economies of Scale
• Require Significant Fixed Cost (Internet)
• Require “Temporary” Demand Advantage
• Not the Same as Large Size (Auto + Health Care Co)
48
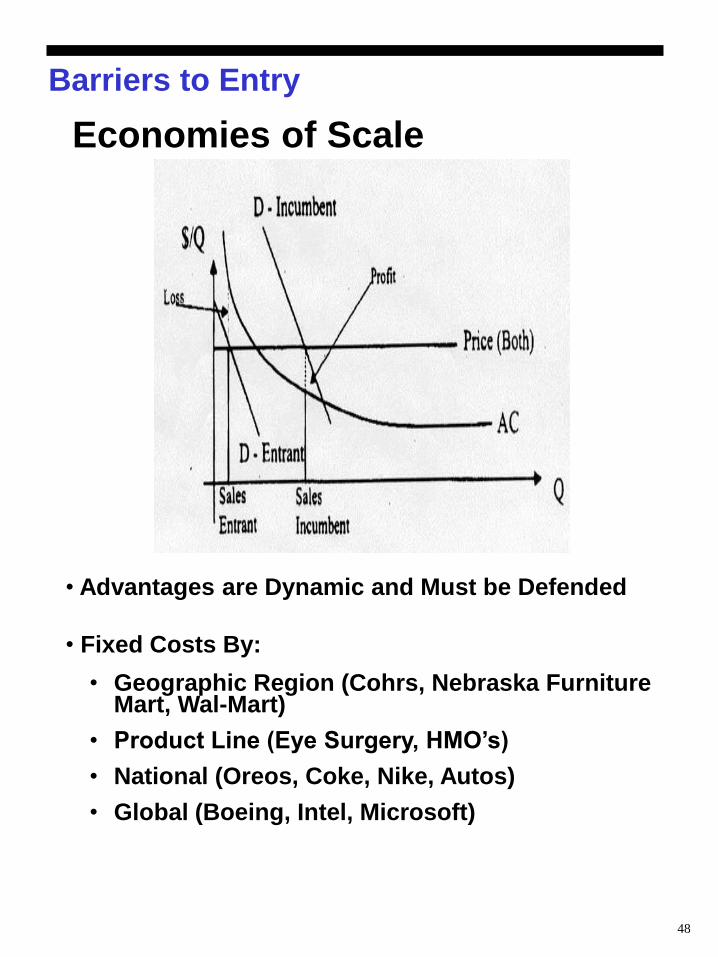
Barriers to Entry
Economies of Scale
• Advantages are Dynamic and Must be Defended
• Fixed Costs By:
• Geographic Region (Cohrs, Nebraska Furniture Mart, Wal-Mart)
• Product Line (Eye Surgery, HMO’s)
• National (Oreos, Coke, Nike, Autos)
• Global (Boeing, Intel, Microsoft)
49
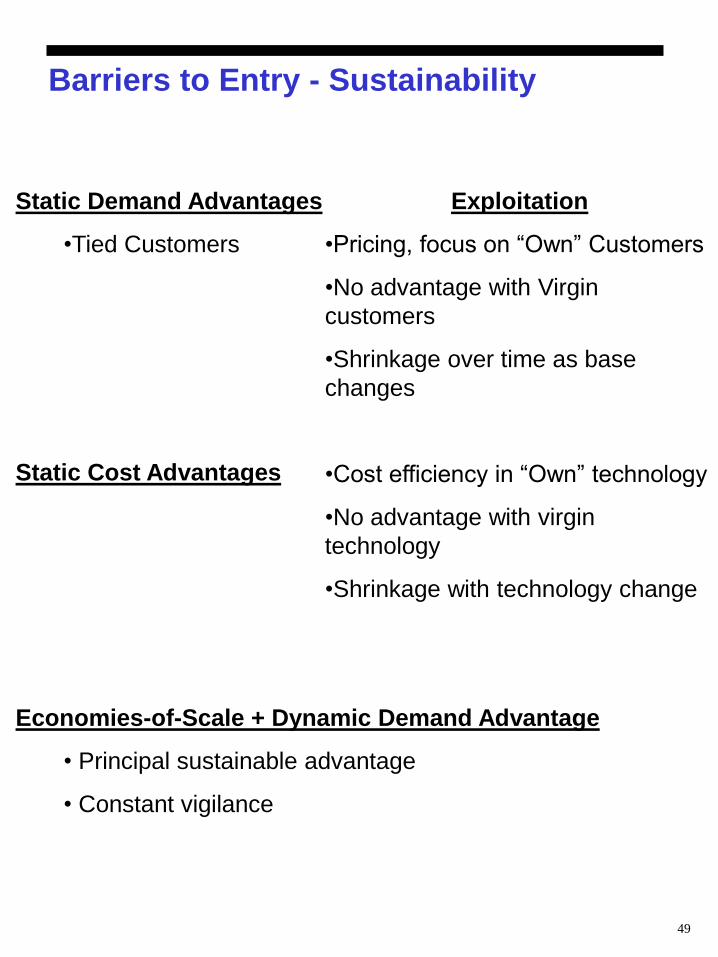
Barriers to Entry - Sustainability
Static Demand Advantages
•Tied Customers
Exploitation
•Pricing, focus on “Own” Customers
•No advantage with Virgin
customers
•Shrinkage over time as base
changes
•Cost efficiency in “Own” technology
•No advantage with virgin
technology
•Shrinkage with technology change
Static Cost Advantages
Economies-of-Scale + Dynamic Demand Advantage
• Principal sustainable advantage
• Constant vigilance
50
Other Barriers-to-Entry
• Government, Regulatory, Public
(Lead based Gas Additives; Cigarettes)
• Informational (Who Knows What)
(Banks, Financial Services, HMO’s)
51
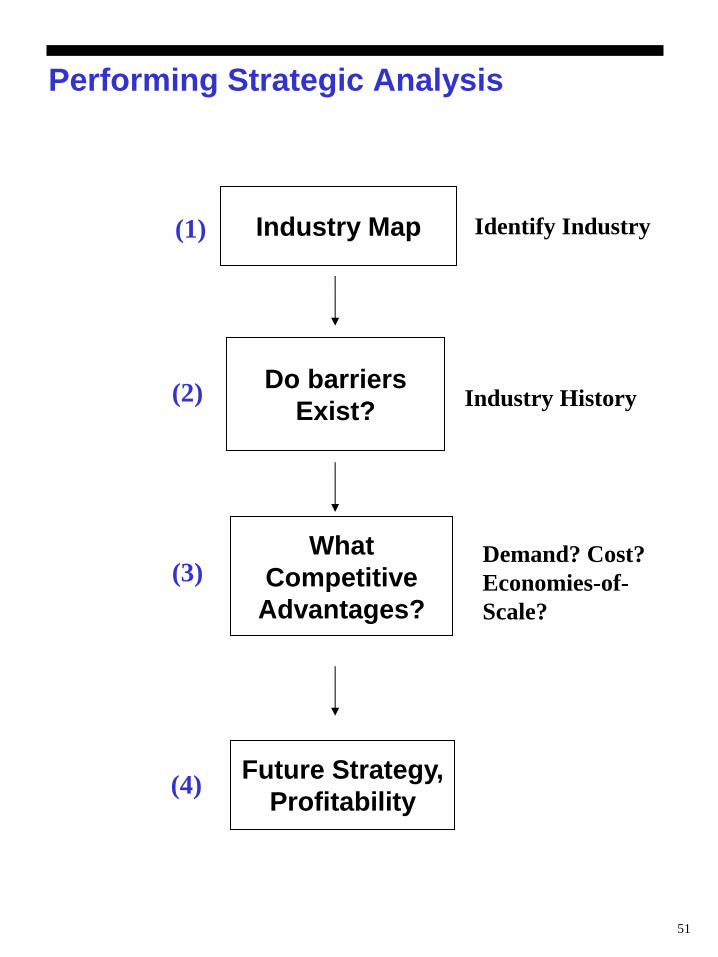
Performing Strategic Analysis
Industry Map
Do barriers
Exist?
What
Competitive
Advantages?
Future Strategy,
Profitability
(1)
(2)
(3)
(4)
Identify Industry
Industry History
Demand? Cost?
Economies-of-
Scale?
52
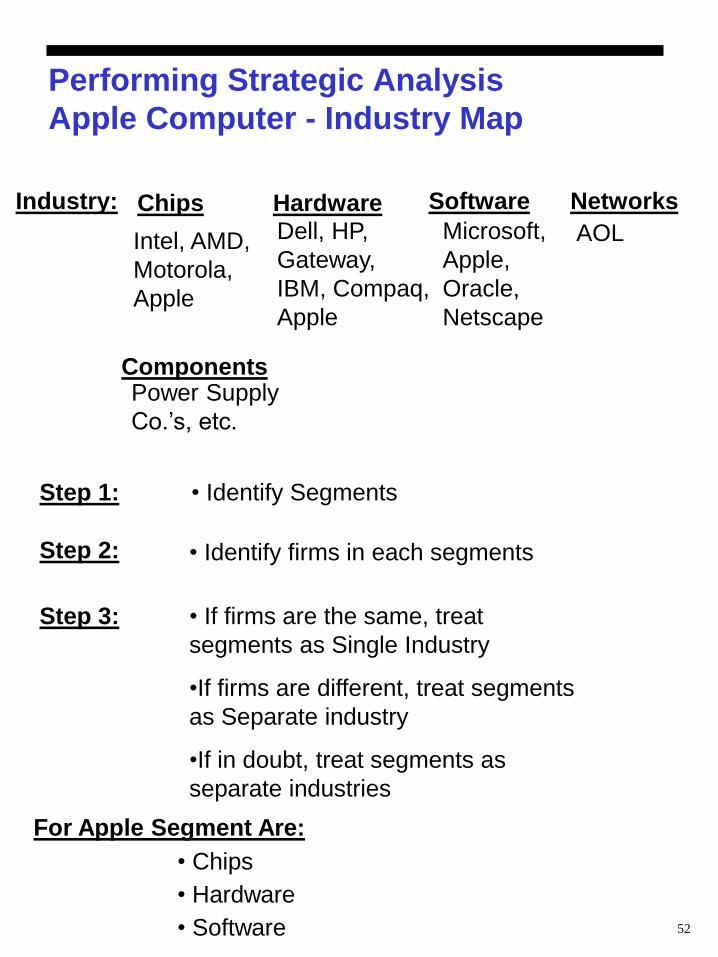
Performing Strategic Analysis
Apple Computer - Industry Map
Industry:
• Identify Segments Step 1:
For Apple Segment Are:
• Chips
• Hardware
• Software
Step 2:
Step 3:
Chips
Components
Hardware Software Networks
Intel, AMD,
Motorola,
Apple
Dell, HP,
Gateway,
IBM, Compaq,
Apple
Microsoft,
Apple,
Oracle,
Netscape
AOL
Power Supply
Co.’s, etc.
• Identify firms in each segments
• If firms are the same, treat
segments as Single Industry
•If firms are different, treat segments
as Separate industry
•If in doubt, treat segments as
separate industries

53
Performing Strategic Analysis
Do Barriers/Competitive Advantage Exist

54
Performing Strategic Analysis
Nature of Barriers-to-Entry Competitive Advantage
55
Other Strategic Considerations
Cooperation within Barriers
–Coke – Pepsi
–Cigarette Makers
Division of Spoils in Value Chain
–Strategic alliances
–You can not take home, if you don’t bring
(NuKote)
–Employee Power (unions, Prof. Services
firms)
56
Summary of Strategic Investment
Without Competitive Advantage –
no Value in Franchise
Competitive Advantage must be
identifiable and sustainable
In particular, Are existing
Competitive Advantages
Sustainable or are they likely to
erode?
If in doubt, do not pay for
franchise
Ideally look for ‘hidden’ franchise
–Unused pricing power (Coke, Cereals)
–Poorly performing divisions
57
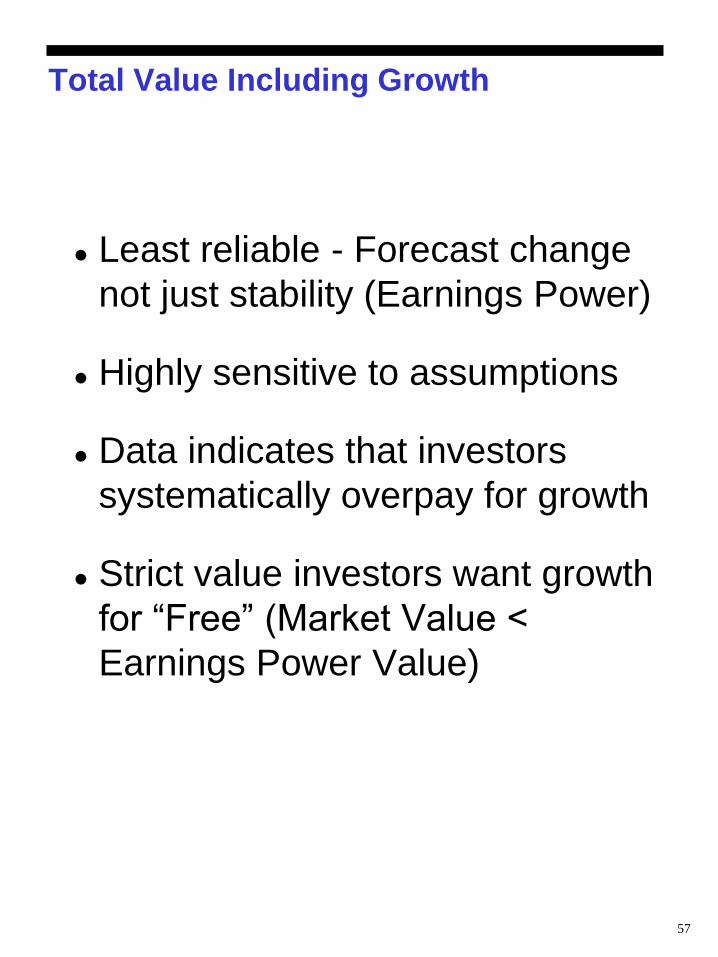
Total Value Including Growth
Least reliable - Forecast change
not just stability (Earnings Power)
Highly sensitive to assumptions
Data indicates that investors
systematically overpay for growth
Strict value investors want growth
for “Free” (Market Value <
Earnings Power Value)
58
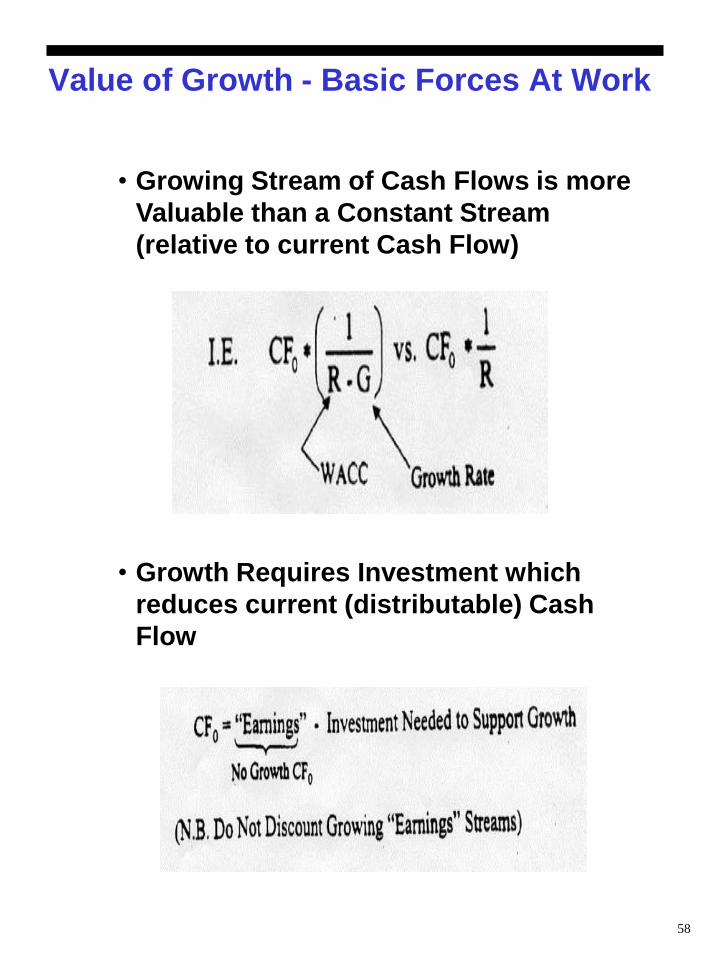
Value of Growth - Basic Forces At Work
• Growing Stream of Cash Flows is more
Valuable than a Constant Stream
(relative to current Cash Flow)
• Growth Requires Investment which
reduces current (distributable) Cash
Flow

59
Value of Growth - Basic Algebra
60
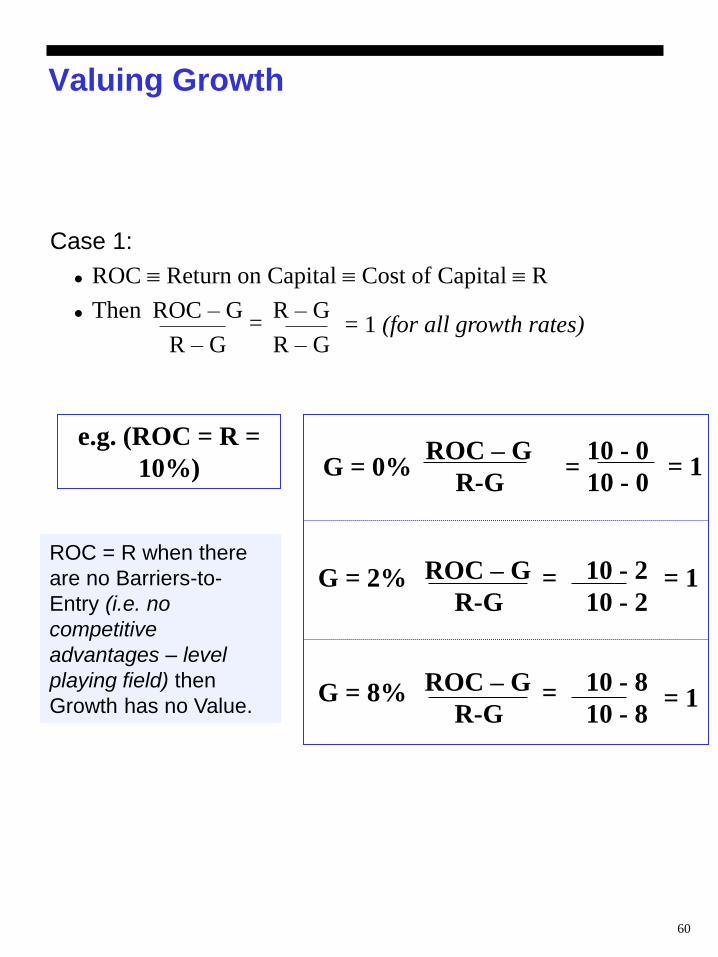
Valuing Growth
Case 1:
ROC Return on Capital Cost of Capital R
Then ROC – G R – G
R – G R – G = 1 (for all growth rates)
ROC = R when there
are no Barriers-to-
Entry (i.e. no
competitive
advantages – level
playing field) then
Growth has no Value.
ROC – G 10 - 0
R-G 10 - 0 = = 1 G = 0%
ROC – G 10 - 2
R-G 10 - 2 = = 1 G = 2%
ROC – G 10 - 8
R-G 10 - 8 = = 1 G = 8%
e.g. (ROC = R =
10%)
=
61
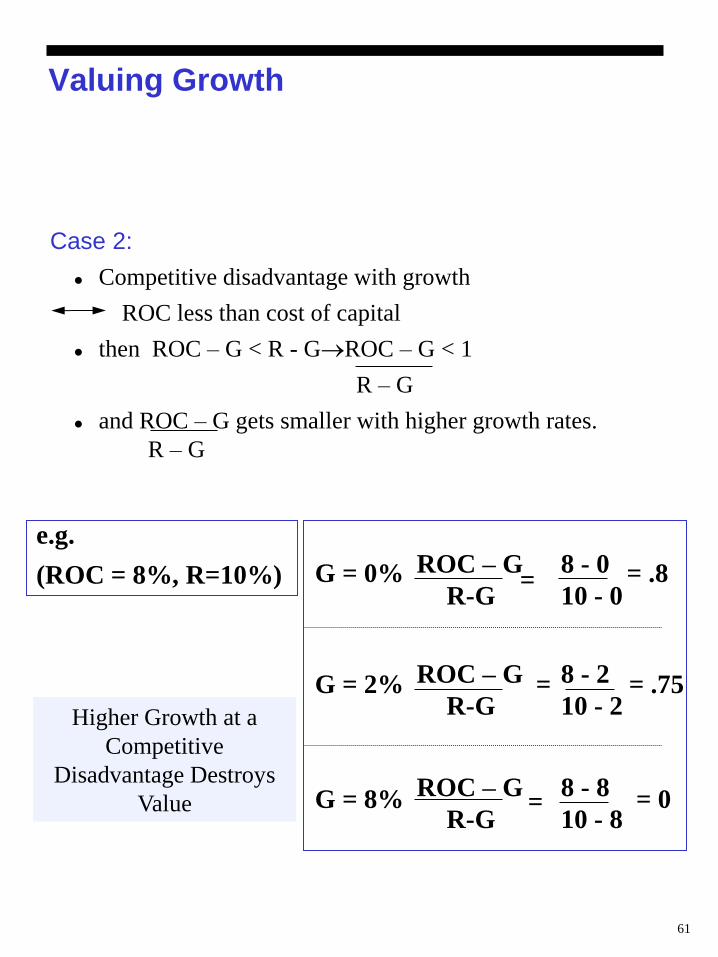
Valuing Growth
Case 2:
Competitive disadvantage with growth
ROC less than cost of capital
then ROC – G < R - GROC – G < 1
R – G
and ROC – G gets smaller with higher growth rates.
R – G
Higher Growth at a
Competitive
Disadvantage Destroys
Value
ROC – G 8 - 0
R-G 10 - 0 = = .8 G = 0%
ROC – G 8 - 2
R-G 10 - 2 = = .75 G = 2%
ROC – G 8 - 8
R-G 10 - 8 = = 0 G = 8%
e.g.
(ROC = 8%, R=10%)
62
Valuing Growth
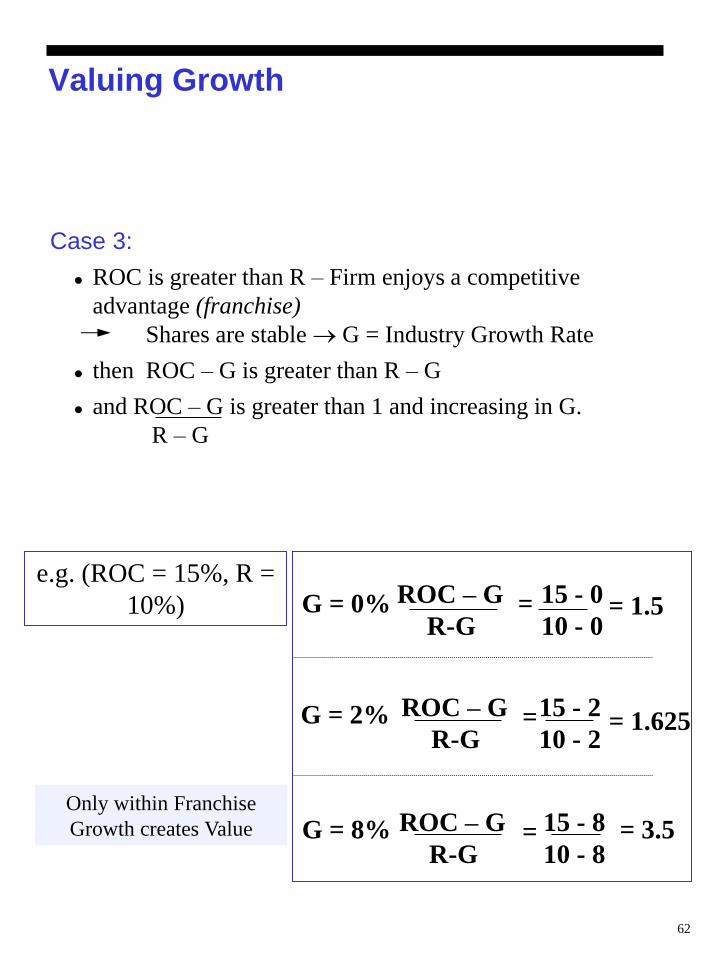
Case 3:
ROC is greater than R – Firm enjoys a competitive
advantage (franchise)
Shares are stable G = Industry Growth Rate
then ROC – G is greater than R – G
and ROC – G is greater than 1 and increasing in G.
R – G
Only within Franchise
Growth creates Value
ROC – G 15 - 0
R-G 10 - 0 = = 1.5 G = 0%
ROC – G 15 - 2
R-G 10 - 2 = = 1.625 G = 2%
ROC – G 15 - 8
R-G 10 - 8 = = 3.5 G = 8%
e.g. (ROC = 15%, R =
10%)
63
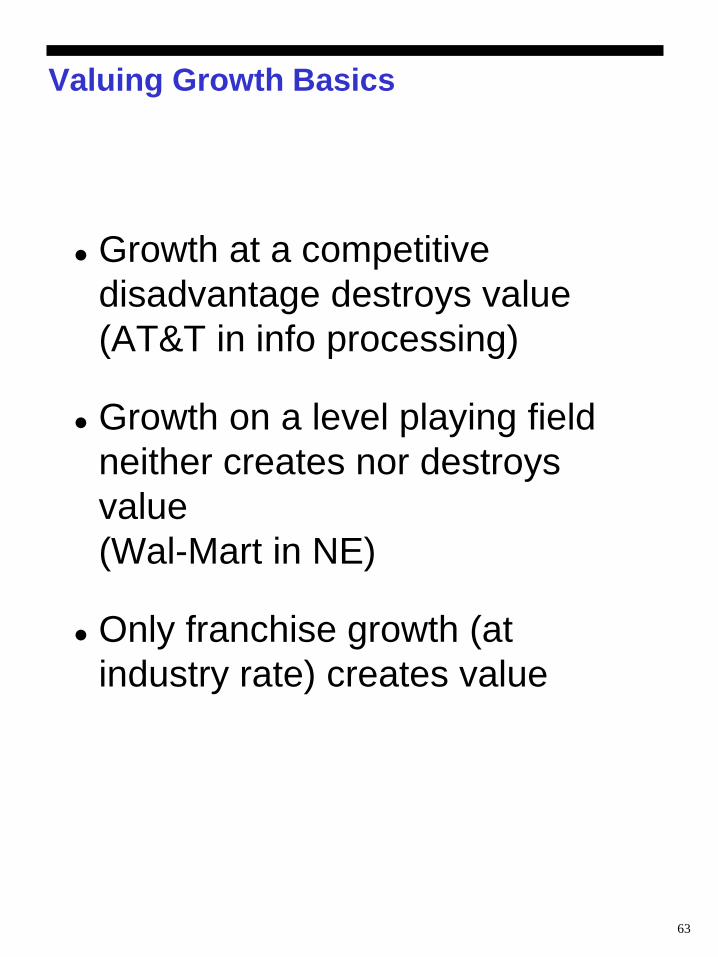
Valuing Growth Basics
Growth at a competitive
disadvantage destroys value
(AT&T in info processing)
Growth on a level playing field
neither creates nor destroys
value
(Wal-Mart in NE)
Only franchise growth (at
industry rate) creates value

64
Valuing Growth - How much Does it
Add?

65
Valuing Growth
High (Unstable) Growth

66
Valuing Growth
Breakeven Growth Rate
67
Valuing Growth Keep-In-Mind
Very hard to do
Very hard to determine margin of
safety
Evidence is that Investors
systematically overpay
Best growth is hidden (zero cost
growth)
Unused pricing power
Temporary problem
Underperforming divisions
68
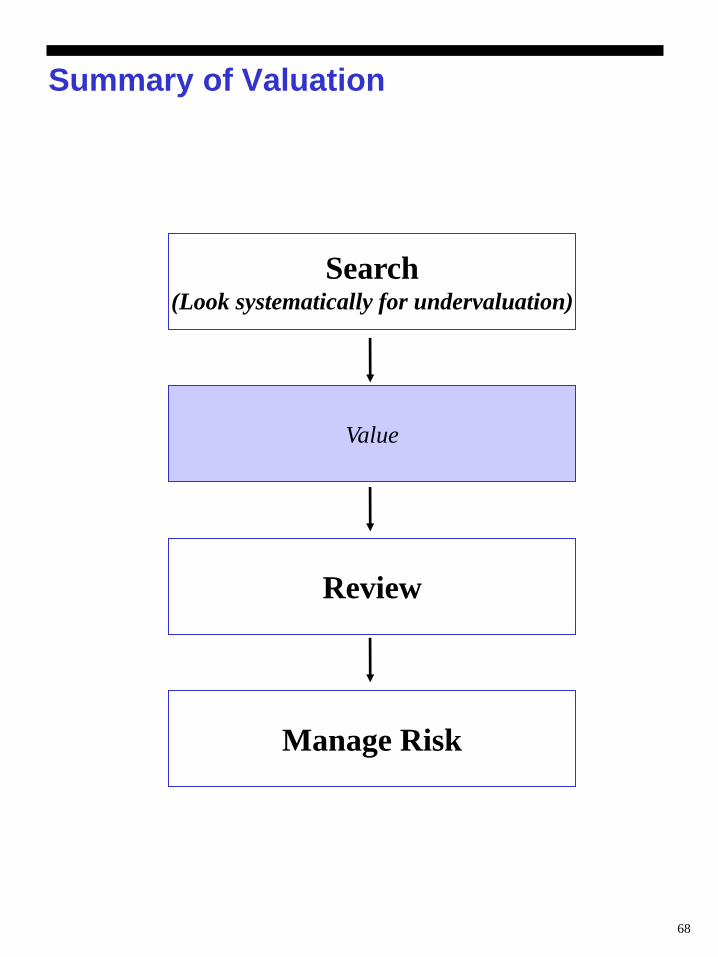
Summary of Valuation
Value
Review
Manage Risk
Search (Look systematically for undervaluation)
69
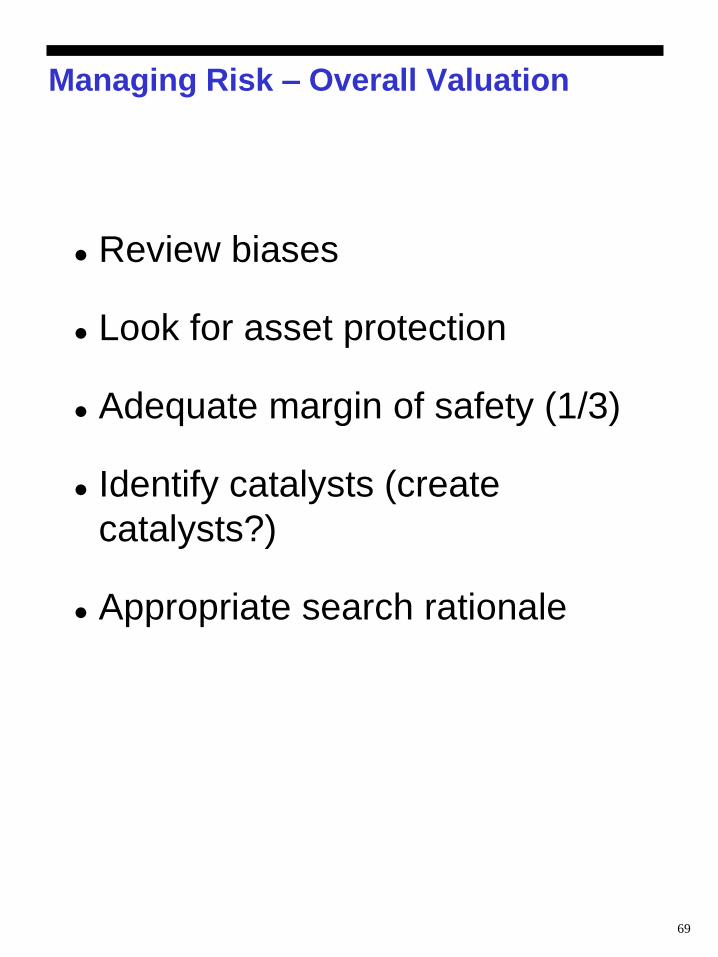
Managing Risk – Overall Valuation
Review biases
Look for asset protection
Adequate margin of safety (1/3)
Identify catalysts (create
catalysts?)
Appropriate search rationale
70
Summary of Valuation
Asset
Value
EP
Value
Growt
h
Value
MV < AV,
EPV
AV < MV <
EPV
AV, EPV <
MV
BUY Assess Comp.
Adv.
Lots of
Luck
Lots of
Luck
BUY
Sustainable?
No Yes
Most
certain
but mgt.?
Medium
certain
Sustainable?
Uncert
ain
71
Summary of Valuation
Strategic Dimension
Growth in Franchise Only
Franchise Value
Current Competitive
Advantage
Free Entry
No Competitive
Advantage
Asset Value Earnings Power
Value
Total Value
• Tangible
• Balance Sheet
Based
• No
Extrapolation
• Current
Earnings
• Extrapolation
• No Forecast
• Includes
Growth
• Extrapolation
• Forecast
Reliability Dimension