Embed Size (px)
Citation preview
Approaches to School Finance Reform for New York State A Background Paper for a Citizen-Led Discussion
Is Robin Hood the Good Guy? Moving Toward a More Equitable School Aid System for New York September 28, 2006
Prepared in conjunction with the campaign of the Center for Governmental Research
2
FOREWORD Founded in 1932, the Citizens Budget Commission (CBC) is a nonprofit, nonpartisan civic organization devoted to influencing constructive change in the finances and services of New York State and New York City governments. This report was prepared based on the work of CBC’s Education Finance Committee, which was co-chaired by Paul E. Francis and Eugene J. Keilin. The Committee was created in the wake of the 2003 New York State Court of Appeals decision in the Campaign for Fiscal Equity case to help public officials identify the most economically effective sources of revenue to fund the Court’s decision. However, as the Committee explored the issues, and as the Governor and State Legislature have failed to reach an agreement on the amount required or a way to finance it, the scope of work has expanded to include continued advocacy for a more research-informed resolution to the case. Throughout its work to promote education finance reform CBC has focused on achieving two outcomes: 1) to provide the responsible public officials – judges, legislators and others – with sound advice on how to craft a remedy that will be effective and efficient; and 2) an informed citizenry who support the eventual resolution of the case. To this end, the CBC convened a conference for key stakeholders in December 2004, hosted two business briefing round table forums in January and April 2006 on accountability reform and revenue options, and is participating in partnership with the New York Matters campaign of the Center for Governmental Research and Baruch College’s School of Public Affairs in a citizen-led discussion of alternatives for more equitable school finance for New York. This background paper for the forum was made possible with the support of the Center for Governmental Research. All of the research materials prepared for these events can be found at the Commission’s website at www.cbcny.org. This summary paper was prepared by Deputy Research Director Elizabeth Lynam and Senior Research Associate Selma Mustovic, with research support from Research Consultant Jessica L. Tirado, under the supervision of Research Director and Executive Vice President Charles Brecher. It draws heavily on the work completed by many CBC researchers and consultants for a series of white papers prepared for the Committee, completed and released in 2004. For a full list of research credits please see the foreword of Can New York Get an A in School Finance Reform? published in January 2005.
3
TABLE OF CONTENTS
BACKGROUND AND OVERVIEW 4 A Lengthy Legal Battle 4 Large Sums of Money Are At Stake 5
WHAT’S WRONG WITH CURRENT SYSTEM? 7 Problem #1- Wealthy Communities Can Spend More at Lower Tax Rates 7
Communities Differ in Their Wealth and Local Effort 7 State Aid Formulas Do Not Make Up for Wealth Differences 10 The Results of An Inequitable System 12
Problem #2- State Aid Formulas Contain Loopholes that Exacerbate Inequitable Per Pupil Spending 14 Problem #3- The STAR Program Works Against Equity 15
WHERE SHOULD THE MONEY COME FROM? 18 Fully Fund Education at the State Level 18 Adopt School Aid Formulas that More Effectively “Equalize” Variations in Local Wealth 18 Finance the Increment Required to Meet the Court Mandate at the State Level 21 Free Up Existing Resources to Fund Schools by Cutting Spending on Other Services 21 Raise Taxes to Increase Per Pupil Spending in Districts Failing to Meet the Target 22 Raise As Much of the Needed Revenue as Possible from Non-Tax Sources 25 Restructure Existing Taxes To Increase Revenue and Improve Tax Policy 27 Impose a Luxury Tax on Wealthy Districts 28
DISCUSSION FRAMEWORK 31
4
BACKGROUND AND OVERVIEW The new Governor of New York faces a significant challenge stemming from a major ruling by the Court of Appeals, the State’s highest court. The Court found that the more than one million children in New York City’s public schools were not provided with the sound basic education guaranteed to them by the State Constitution. It has been more than three years since the ruling and yet the plaintiffs and the State’s political leaders have not agreed on a suitable remedy for students in New York City, and by extension for hundreds of thousands of additional students in other school districts around the state who also have been denied their constitutional right. Facing their failure to appropriately shape a responsive policy that will affect so many lives and drive many billions of dollars, it is the duty of the Governor and the Legislature to finally enact and implement much-needed reforms. A Lengthy Legal Battle In June 2003 the New York State Court of Appeals, the State’s highest court, found that New York City’s public schools did not provide a sound basic education as required by the State’s Constitution. The Court of Appeals authorized a lower court judge to work with State officials and the plaintiffs in the case representing the children, a group called the Campaign for Fiscal Equity (CFE), to determine how to remedy the troubling situation. Due to the inadequate initial response by the State’s political leaders, the Supreme Court judge then appointed a panel of three Special Masters and asked them to recommend a suitable remedy. The panel received amicus curiae briefs from 21 organizations containing advice on how to devise a corrective plan and heard testimony from expert witnesses. The panel made a recommendation to the judge at the end of November 2004. The Judge ruled on the Special Masters recommendation in February 2005, ordering additional funding for New York City public schools and mandating compliance by the State. �
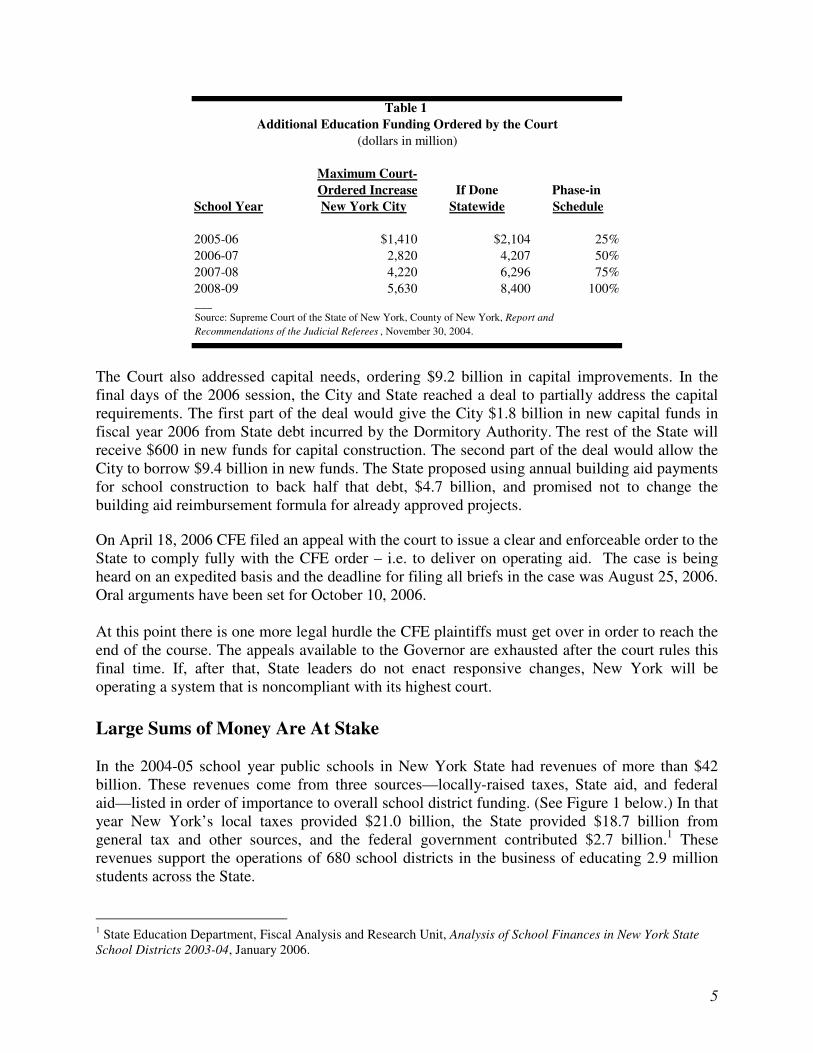
On August 5, 2005, Governor Pataki filed a brief, appealing that compliance order, with the Appellate Division of the State Supreme Court. After hearing oral arguments in October, the court confirmed its November 2004 decision on March 23, 2006, and ordered New York State to provide between $4.7 billion and $5.6 billion in operating aid for New York City public schools over the next four to five years. (See Table 1 below.)
5
Maximum Court-Ordered Increase If Done Phase-in
School Year New York City Statewide Schedule
2005-06 $1,410 $2,104 25%2006-07 2,820 4,207 50%2007-08 4,220 6,296 75%2008-09 5,630 8,400 100%
Additional Education Funding Ordered by the Court(dollars in million)
Table 1
���
Source: Supreme Court of the State of New York, County of New York, Report and Recommendations of the Judicial Referees , November 30, 2004.
The Court also addressed capital needs, ordering $9.2 billion in capital improvements. In the final days of the 2006 session, the City and State reached a deal to partially address the capital requirements. The first part of the deal would give the City $1.8 billion in new capital funds in fiscal year 2006 from State debt incurred by the Dormitory Authority. The rest of the State will receive $600 in new funds for capital construction. The second part of the deal would allow the City to borrow $9.4 billion in new funds. The State proposed using annual building aid payments for school construction to back half that debt, $4.7 billion, and promised not to change the building aid reimbursement formula for already approved projects. �
On April 18, 2006 CFE filed an appeal with the court to issue a clear and enforceable order to the State to comply fully with the CFE order – i.e. to deliver on operating aid. The case is being heard on an expedited basis and the deadline for filing all briefs in the case was August 25, 2006. Oral arguments have been set for October 10, 2006. At this point there is one more legal hurdle the CFE plaintiffs must get over in order to reach the end of the course. The appeals available to the Governor are exhausted after the court rules this final time. If, after that, State leaders do not enact responsive changes, New York will be operating a system that is noncompliant with its highest court. Large Sums of Money Are At Stake
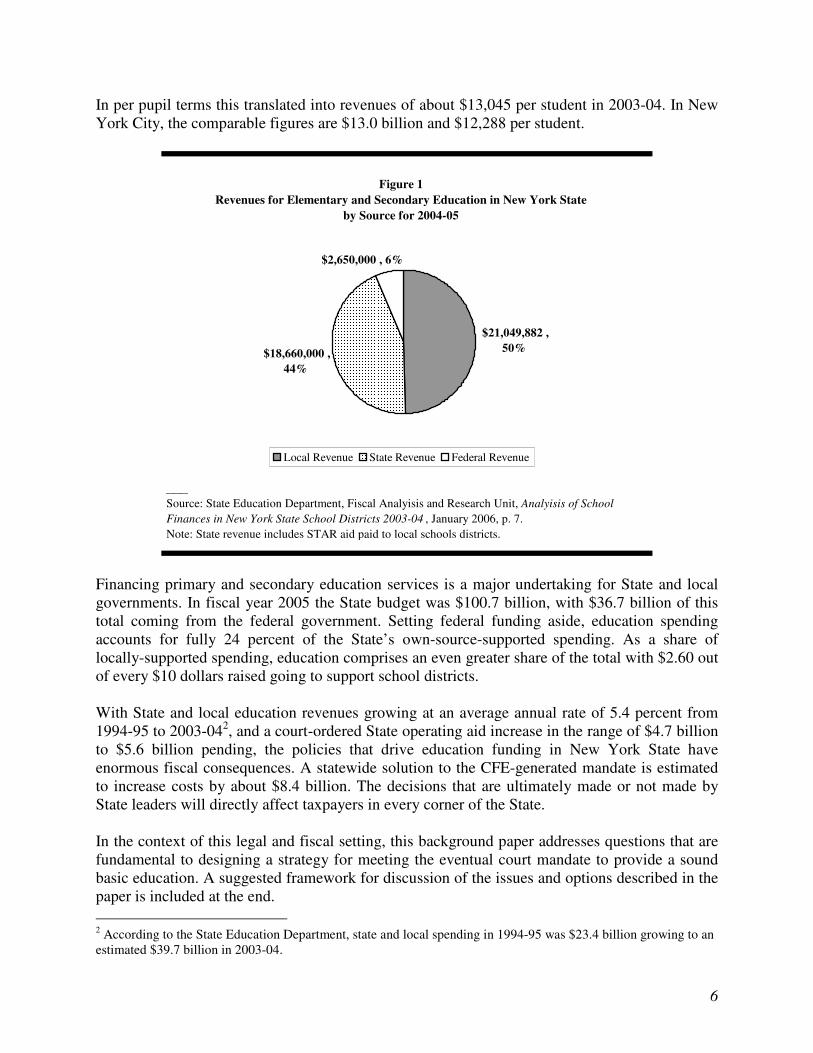
In the 2004-05 school year public schools in New York State had revenues of more than $42 billion. These revenues come from three sources—locally-raised taxes, State aid, and federal aid—listed in order of importance to overall school district funding. (See Figure 1 below.) In that year New York’s local taxes provided $21.0 billion, the State provided $18.7 billion from general tax and other sources, and the federal government contributed $2.7 billion.1 These revenues support the operations of 680 school districts in the business of educating 2.9 million students across the State. 1 State Education Department, Fiscal Analysis and Research Unit, Analysis of School Finances in New York State School Districts 2003-04, January 2006.
6
In per pupil terms this translated into revenues of about $13,045 per student in 2003-04. In New York City, the comparable figures are $13.0 billion and $12,288 per student.
Figure 1Revenues for Elementary and Secondary Education in New York State
by Source for 2004-05
$21,049,882 , 50% $18,660,000 ,
44%
$2,650,000 , 6%
Local Revenue State Revenue Federal Revenue
___Source: State Education Department, Fiscal Analyisis and Research Unit, Analyisis of School Finances in New York State School Districts 2003-04 , January 2006, p. 7.Note: State revenue includes STAR aid paid to local schools districts.
Financing primary and secondary education services is a major undertaking for State and local governments. In fiscal year 2005 the State budget was $100.7 billion, with $36.7 billion of this total coming from the federal government. Setting federal funding aside, education spending accounts for fully 24 percent of the State’s own-source-supported spending. As a share of locally-supported spending, education comprises an even greater share of the total with $2.60 out of every $10 dollars raised going to support school districts. With State and local education revenues growing at an average annual rate of 5.4 percent from 1994-95 to 2003-042, and a court-ordered State operating aid increase in the range of $4.7 billion to $5.6 billion pending, the policies that drive education funding in New York State have enormous fiscal consequences. A statewide solution to the CFE-generated mandate is estimated to increase costs by about $8.4 billion. The decisions that are ultimately made or not made by State leaders will directly affect taxpayers in every corner of the State. In the context of this legal and fiscal setting, this background paper addresses questions that are fundamental to designing a strategy for meeting the eventual court mandate to provide a sound basic education. A suggested framework for discussion of the issues and options described in the paper is included at the end. 2 According to the State Education Department, state and local spending in 1994-95 was $23.4 billion growing to an estimated $39.7 billion in 2003-04.
7
WHAT’S WRONG WITH CURRENT SYSTEM? Any answer to the question of where the money to address the lawsuit should come from should address the fundamental problems in the current financing structure. New York is a state that relies heavily on local financing for its school districts. Since local resources are raised primarily on the basis of property wealth, and local property wealth varies, the tax burden required to levy similar amounts varies. Although New York’s school aid formulas work to counteract some of the variability in local wealth by supplying greater per pupil aid to poorer districts than wealthier ones, they are not sufficient. They suffer from three fundamental problems described in the bullets below:
1. New York has some extremely wealthy communities that choose to spend great sums on their schools. These high-wealth high-spending districts make it hard for the State to ever afford to fully compensate for the differential in per pupil spending.
2. New York has added loopholes and exceptions in the formulas that drive state aid allocations that exacerbate inequities in per pupil spending.
3. Fully $3.2 billion, or about 16 percent of total State funding for schools, has been committed to financing education in the form of the School Tax Relief, or STAR program, which operates exactly the way a school aid program should not. It sends more aid to the wealthy districts than to poor ones!
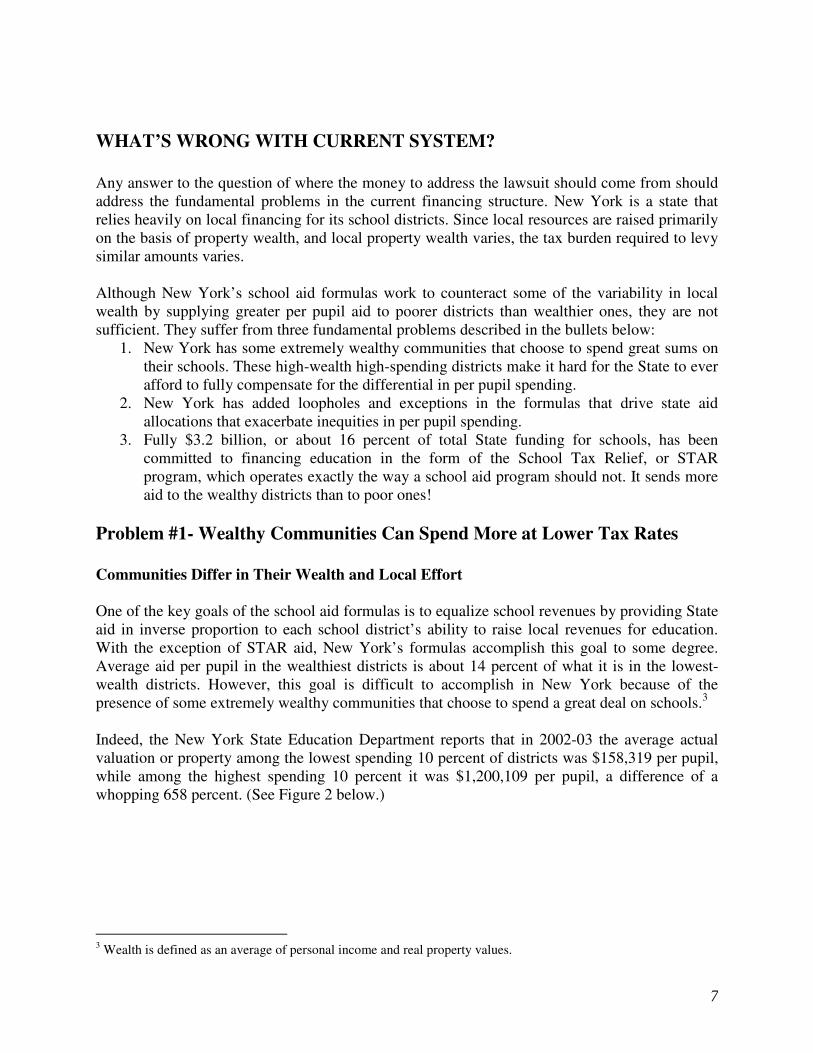
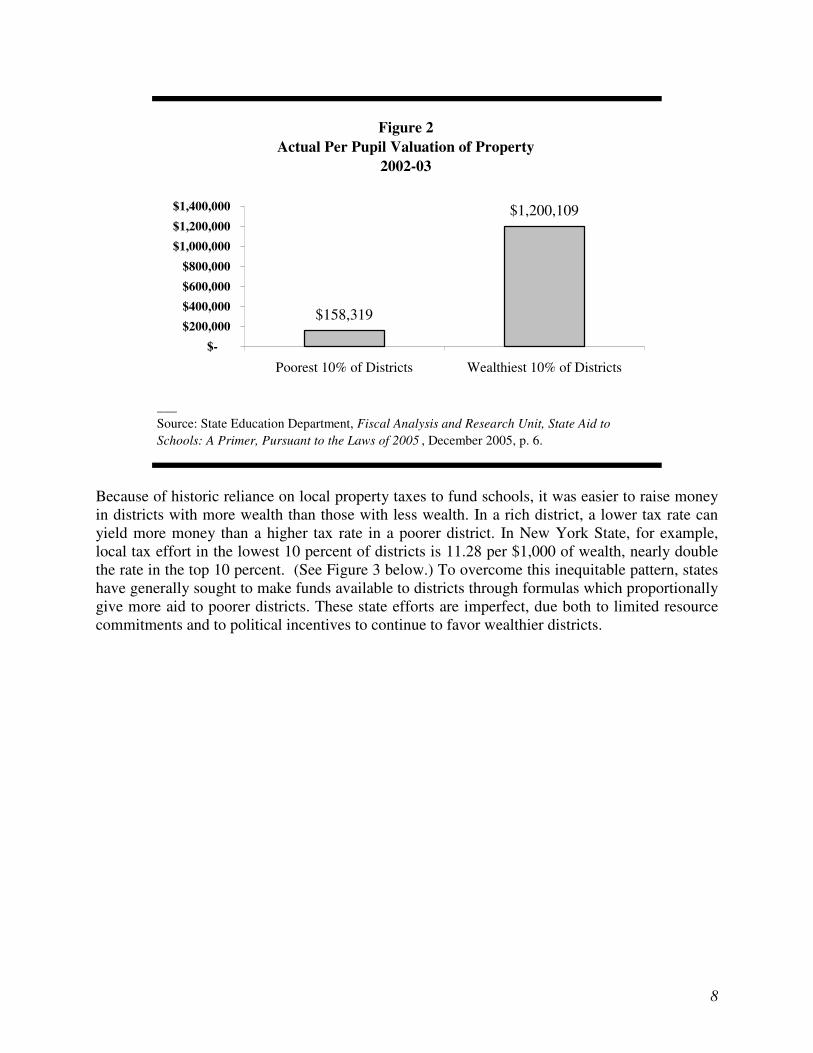
Problem #1- Wealthy Communities Can Spend More at Lower Tax Rates Communities Differ in Their Wealth and Local Effort One of the key goals of the school aid formulas is to equalize school revenues by providing State aid in inverse proportion to each school district’s ability to raise local revenues for education. With the exception of STAR aid, New York’s formulas accomplish this goal to some degree. Average aid per pupil in the wealthiest districts is about 14 percent of what it is in the lowest- wealth districts. However, this goal is difficult to accomplish in New York because of the presence of some extremely wealthy communities that choose to spend a great deal on schools.3 Indeed, the New York State Education Department reports that in 2002-03 the average actual valuation or property among the lowest spending 10 percent of districts was $158,319 per pupil, while among the highest spending 10 percent it was $1,200,109 per pupil, a difference of a whopping 658 percent. (See Figure 2 below.)
3 Wealth is defined as an average of personal income and real property values.
8
Figure 2 Actual Per Pupil Valuation of Property
2002-03
$158,319
$1,200,109
$-$200,000$400,000$600,000$800,000
$1,000,000$1,200,000$1,400,000
Poorest 10% of Districts Wealthiest 10% of Districts
___Source: State Education Department, Fiscal Analysis and Research Unit, State Aid to Schools: A Primer, Pursuant to the Laws of 2005 , December 2005, p. 6.
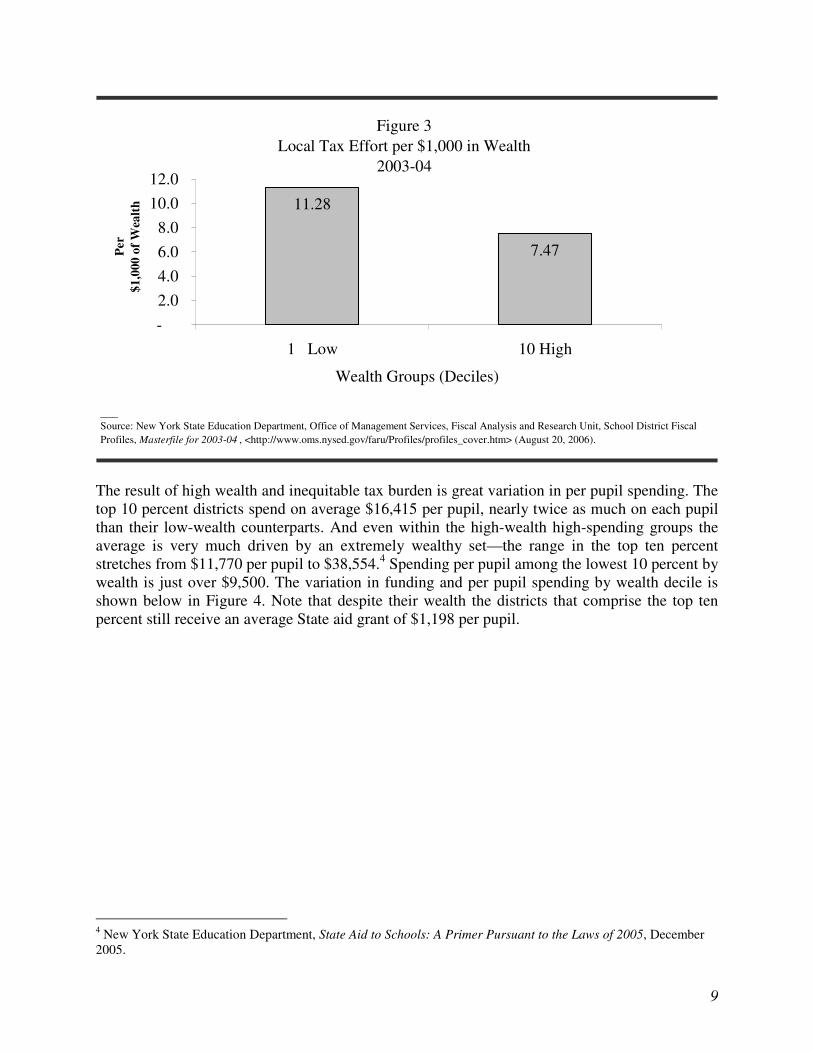
Because of historic reliance on local property taxes to fund schools, it was easier to raise money in districts with more wealth than those with less wealth. In a rich district, a lower tax rate can yield more money than a higher tax rate in a poorer district. In New York State, for example, local tax effort in the lowest 10 percent of districts is 11.28 per $1,000 of wealth, nearly double the rate in the top 10 percent. (See Figure 3 below.) To overcome this inequitable pattern, states have generally sought to make funds available to districts through formulas which proportionally give more aid to poorer districts. These state efforts are imperfect, due both to limited resource commitments and to political incentives to continue to favor wealthier districts.
9
11360736212
77,395.0
Figure 3Local Tax Effort per $1,000 in Wealth
2003-04
11.28
7.47
-2.04.06.08.0
10.012.0
1 Low 10 High
Wealth Groups (Deciles)
Per
$1,0
00 o
f Wea
lth
___Source: New York State Education Department, Office of Management Services, Fiscal Analysis and Research Unit, School District Fiscal Profiles, Masterfile for 2003-04 , <http://www.oms.nysed.gov/faru/Profiles/profiles_cover.htm> (August 20, 2006).
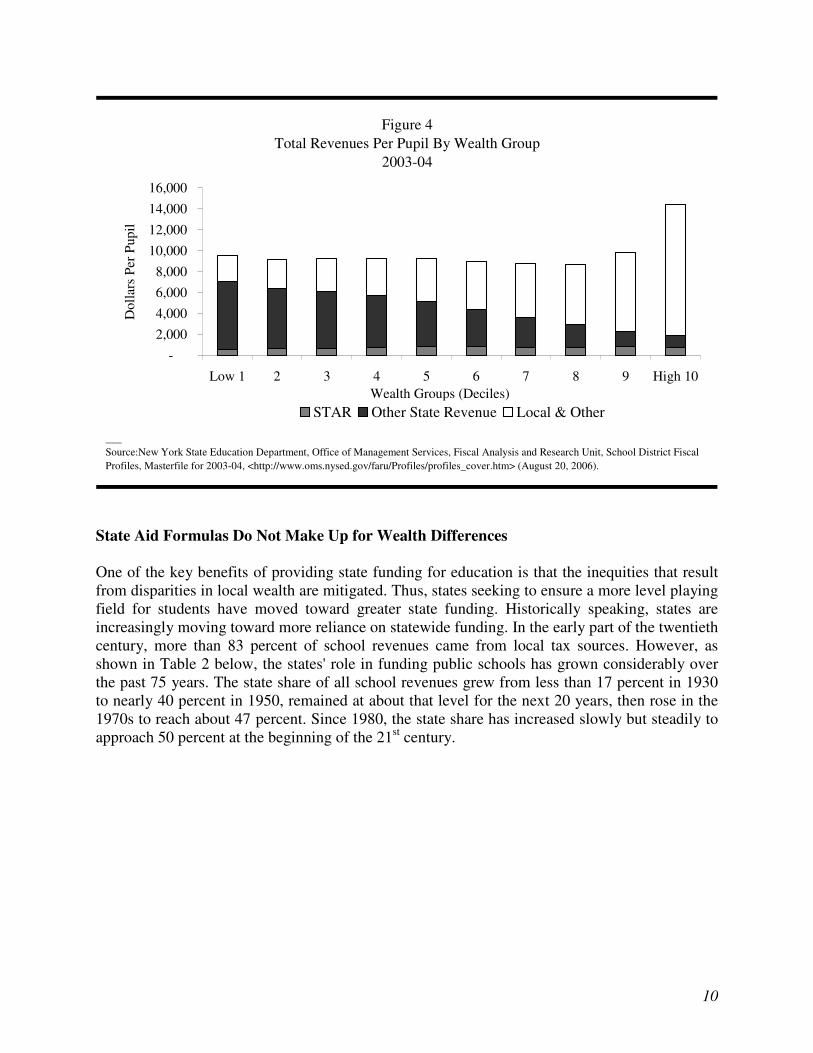
The result of high wealth and inequitable tax burden is great variation in per pupil spending. The top 10 percent districts spend on average $16,415 per pupil, nearly twice as much on each pupil than their low-wealth counterparts. And even within the high-wealth high-spending groups the average is very much driven by an extremely wealthy set—the range in the top ten percent stretches from $11,770 per pupil to $38,554.4 Spending per pupil among the lowest 10 percent by wealth is just over $9,500. The variation in funding and per pupil spending by wealth decile is shown below in Figure 4. Note that despite their wealth the districts that comprise the top ten percent still receive an average State aid grant of $1,198 per pupil.
4 New York State Education Department, State Aid to Schools: A Primer Pursuant to the Laws of 2005, December 2005.
10
Figure 4Total Revenues Per Pupil By Wealth Group
2003-04
-2,0004,0006,0008,000
10,00012,000
14,00016,000
Low 1 2 3 4 5 6 7 8 9 High 10Wealth Groups (Deciles)
Dol
lars
Per
Pup
il
STAR Other State Revenue Local & Other
___Source:New York State Education Department, Office of Management Services, Fiscal Analysis and Research Unit, School District Fiscal Profiles, Masterfile for 2003-04, <http://www.oms.nysed.gov/faru/Profiles/profiles_cover.htm> (August 20, 2006).
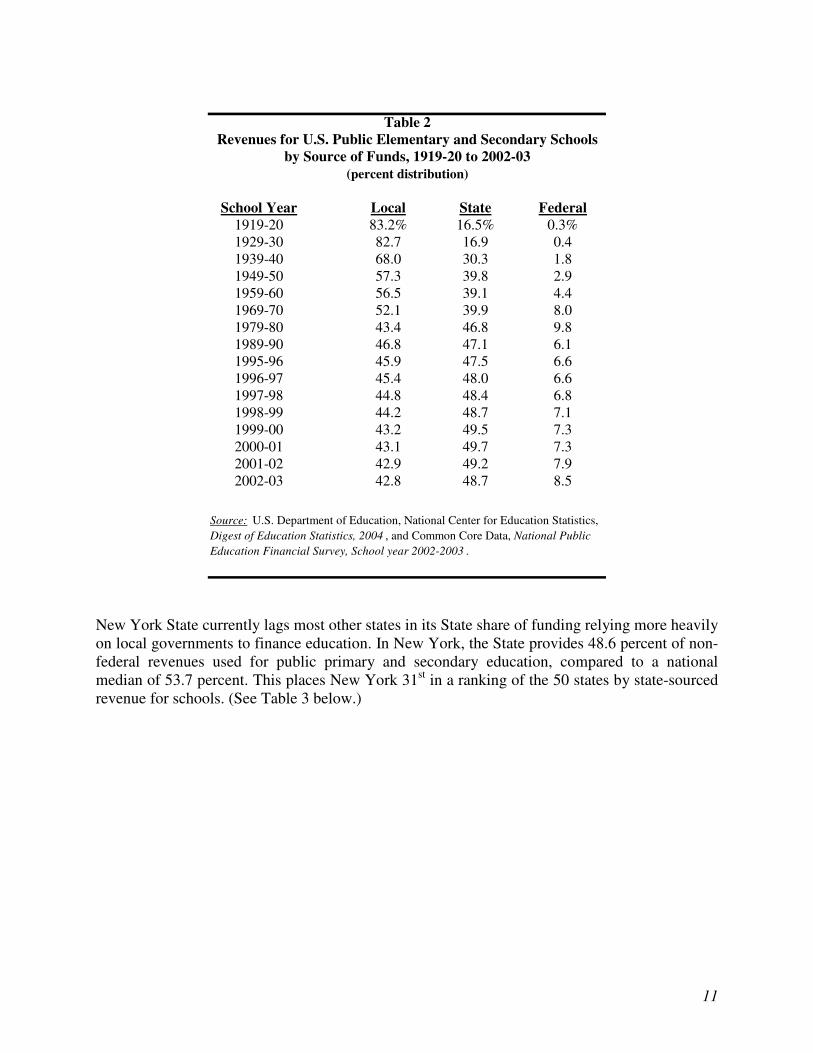
State Aid Formulas Do Not Make Up for Wealth Differences One of the key benefits of providing state funding for education is that the inequities that result from disparities in local wealth are mitigated. Thus, states seeking to ensure a more level playing field for students have moved toward greater state funding. Historically speaking, states are increasingly moving toward more reliance on statewide funding. In the early part of the twentieth century, more than 83 percent of school revenues came from local tax sources. However, as shown in Table 2 below, the states' role in funding public schools has grown considerably over the past 75 years. The state share of all school revenues grew from less than 17 percent in 1930 to nearly 40 percent in 1950, remained at about that level for the next 20 years, then rose in the 1970s to reach about 47 percent. Since 1980, the state share has increased slowly but steadily to approach 50 percent at the beginning of the 21st century.
11
School Year Local State Federal1919-20 83.2% 16.5% 0.3%1929-30 82.7 16.9 0.41939-40 68.0 30.3 1.81949-50 57.3 39.8 2.91959-60 56.5 39.1 4.41969-70 52.1 39.9 8.01979-80 43.4 46.8 9.81989-90 46.8 47.1 6.11995-96 45.9 47.5 6.61996-97 45.4 48.0 6.61997-98 44.8 48.4 6.81998-99 44.2 48.7 7.11999-00 43.2 49.5 7.32000-01 43.1 49.7 7.32001-02 42.9 49.2 7.92002-03 42.8 48.7 8.5
Table 2
Source: U.S. Department of Education, National Center for Education Statistics, Digest of Education Statistics, 2004 , and Common Core Data, National Public Education Financial Survey, School year 2002-2003 .
Revenues for U.S. Public Elementary and Secondary Schoolsby Source of Funds, 1919-20 to 2002-03
(percent distribution)
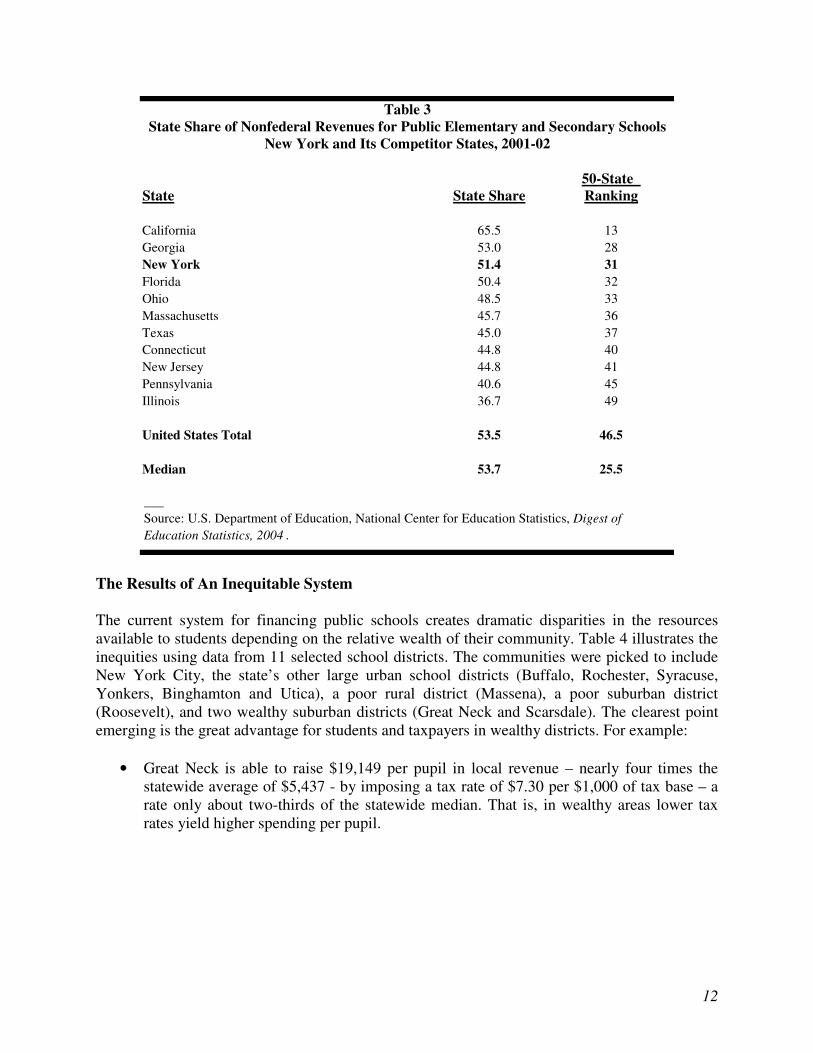
New York State currently lags most other states in its State share of funding relying more heavily on local governments to finance education. In New York, the State provides 48.6 percent of non-federal revenues used for public primary and secondary education, compared to a national median of 53.7 percent. This places New York 31st in a ranking of the 50 states by state-sourced revenue for schools. (See Table 3 below.)
12
50-State State State Share Ranking
California 65.5 13Georgia 53.0 28New York 51.4 31Florida 50.4 32Ohio 48.5 33Massachusetts 45.7 36Texas 45.0 37Connecticut 44.8 40New Jersey 44.8 41Pennsylvania 40.6 45Illinois 36.7 49
United States Total 53.5 46.5
Median 53.7 25.5
State Share of Nonfederal Revenues for Public Elementary and Secondary SchoolsNew York and Its Competitor States, 2001-02
Source: U.S. Department of Education, National Center for Education Statistics, Digest of Education Statistics, 2004
Table 3
___Source: U.S. Department of Education, National Center for Education Statistics, Digest of Education Statistics, 2004 .
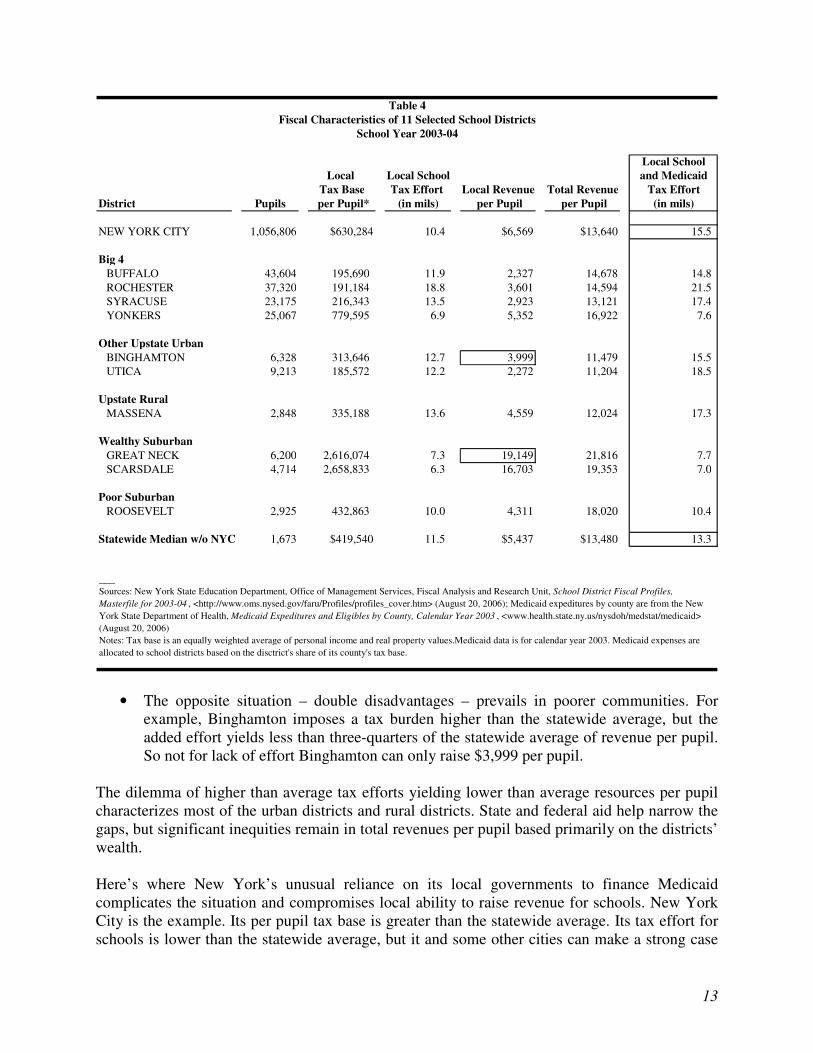
The Results of An Inequitable System The current system for financing public schools creates dramatic disparities in the resources available to students depending on the relative wealth of their community. Table 4 illustrates the inequities using data from 11 selected school districts. The communities were picked to include New York City, the state’s other large urban school districts (Buffalo, Rochester, Syracuse, Yonkers, Binghamton and Utica), a poor rural district (Massena), a poor suburban district (Roosevelt), and two wealthy suburban districts (Great Neck and Scarsdale). The clearest point emerging is the great advantage for students and taxpayers in wealthy districts. For example:
• Great Neck is able to raise $19,149 per pupil in local revenue – nearly four times the statewide average of $5,437 - by imposing a tax rate of $7.30 per $1,000 of tax base – a rate only about two-thirds of the statewide median. That is, in wealthy areas lower tax rates yield higher spending per pupil.
13
Local SchoolLocal Local School and Medicaid
Tax Base Tax Effort Local Revenue Total Revenue Tax EffortDistrict Pupils per Pupil* (in mils) per Pupil per Pupil (in mils)
NEW YORK CITY 1,056,806 $630,284 10.4 $6,569 $13,640 15.5
Big 4BUFFALO 43,604 195,690 11.9 2,327 14,678 14.8 ROCHESTER 37,320 191,184 18.8 3,601 14,594 21.5 SYRACUSE 23,175 216,343 13.5 2,923 13,121 17.4 YONKERS 25,067 779,595 6.9 5,352 16,922 7.6
Other Upstate UrbanBINGHAMTON 6,328 313,646 12.7 3,999 11,479 15.5 UTICA 9,213 185,572 12.2 2,272 11,204 18.5
Upstate RuralMASSENA 2,848 335,188 13.6 4,559 12,024 17.3
Wealthy SuburbanGREAT NECK 6,200 2,616,074 7.3 19,149 21,816 7.7 SCARSDALE 4,714 2,658,833 6.3 16,703 19,353 7.0
Poor SuburbanROOSEVELT 2,925 432,863 10.0 4,311 18,020 10.4
Statewide Median w/o NYC 1,673 $419,540 11.5 $5,437 $13,480 13.3
2.866945152 $21,746.97
Fiscal Characteristics of 11 Selected School DistrictsSchool Year 2003-04
Table 4
___Sources: New York State Education Department, Office of Management Services, Fiscal Analysis and Research Unit, School District Fiscal Profiles, Masterfile for 2003-04 , <http://www.oms.nysed.gov/faru/Profiles/profiles_cover.htm> (August 20, 2006); Medicaid expeditures by county are from the New York State Department of Health, Medicaid Expeditures and Eligibles by County, Calendar Year 2003 , <www.health.state.ny.us/nysdoh/medstat/medicaid> (August 20, 2006)Notes: Tax base is an equally weighted average of personal income and real property values.Medicaid data is for calendar year 2003. Medicaid expenses are allocated to school districts based on the disctrict's share of its county's tax base.
• The opposite situation – double disadvantages – prevails in poorer communities. For example, Binghamton imposes a tax burden higher than the statewide average, but the added effort yields less than three-quarters of the statewide average of revenue per pupil. So not for lack of effort Binghamton can only raise $3,999 per pupil.
The dilemma of higher than average tax efforts yielding lower than average resources per pupil characterizes most of the urban districts and rural districts. State and federal aid help narrow the gaps, but significant inequities remain in total revenues per pupil based primarily on the districts’ wealth. Here’s where New York’s unusual reliance on its local governments to finance Medicaid complicates the situation and compromises local ability to raise revenue for schools. New York City is the example. Its per pupil tax base is greater than the statewide average. Its tax effort for schools is lower than the statewide average, but it and some other cities can make a strong case
14
that the lower effort is justified by the unusually heavy fiscal burden they bear for other services to the indigent, particularly the Medicaid program. When the local tax effort required to finance the localities’ share of Medicaid expenditures is taken into account, New York City’s combined school and Medicaid tax effort significantly exceeds the statewide averages – $15.50 per $1,000 versus $13.30 per $1,000. In other words, the local capacity for tax for schools is being more than used up by the Medicaid financing requirement New York State imposes. Problem #2- State Aid Formulas Contain Loopholes that Exacerbate Inequitable Per Pupil Spending Current State aid programs have loopholes that allow wealthy districts to receive funding despite adequate and increasing local wealth. These loopholes are called “hold harmless” or “save harmless” adjustments. These provisions are included in the school aid formulas to prevent political opposition from relatively wealthy districts whose aid would be cut, despite the lack of objective need. When the CFE submitted its proposal to the Court, it noted that “about 28 percent of all school districts (189 out of 680) would be eligible for hold harmless aid.”5 The State Education Department (SED) did an earlier analysis in 1999 that showed that the “hold harmless” provision, which SED reports was originally intended to be used to prevent aid loss from radical and rapid declines in enrollment, had been expanded to include about 40 percent of school districts. These 296 districts would have had their aid reduced due to increased local wealth were they not exempted from the application of the formulas. 6 Estimating the excess amount currently flowing to these “hold harmless districts” is difficult. However, the CFE suggested in its proposal an order of magnitude for a hold harmless provision that would “prevent any district from receiving less in state operating aid and STAR payments than it now receives.” The CFE calculated that the total cost of providing hold harmless aid to the 189 districts was about $750 million for 2004-2005. Another estimate is available from CBC analysis of the State Education Departments master file school finance data for school year 2003-04. The analysis shows that fully 91 districts would have been able to raise statewide median per pupil spending from their own wealth. Despite that fact these districts received $559 million in state aid. CBC analysis also shows that the number of districts in this category and the amount of aid allocated to them has increased. Two years ago in school year 2001-02 about $300 million in aid was flowing to 75 districts able to raise the median per pupil spending that year on their own wealth. In other respects the school aid formulas have been subject to tinkering. School aid laws are written to apply to all districts except New York City by exempting districts with enrollment greater than 1 million or to apply only to districts with enrollment above 1 million. Historically the formulas have been subject to “share” negotiations where the acceptable shares for Upstate,
5 Campaign for Fiscal Equity, Final Report of the Sound Basic Education Task Force, May 2004. 6New York State Education Department, Research Note: Wealth and Revenue Changes 1994-95 to 1998-99, December 2001, accessed 9/4/06 http://www.oms.nysed.gov/faru/Researchnotes/CSRGFormattedRN_4.html.
15
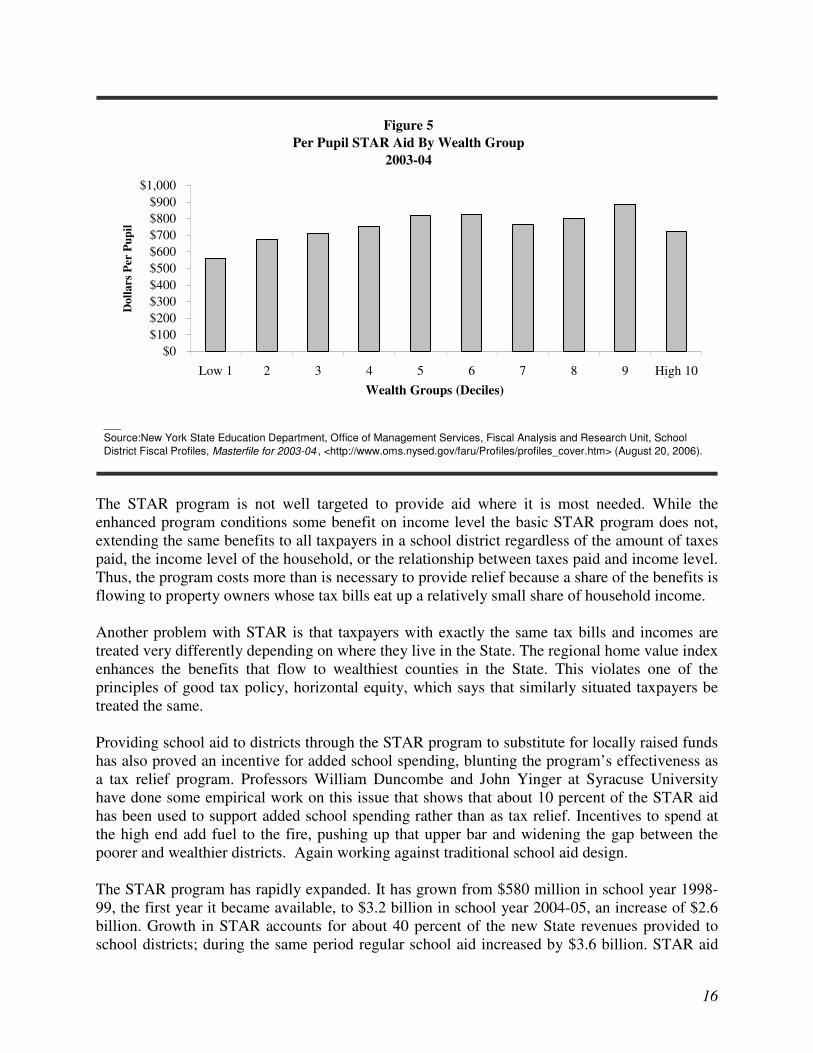
Downstate and Long Island schools are decided by the Legislature’s top leaders and the governor, and the formula language gets written to retrofit the state aid allocation to the desired amount. New York City, which is a high-needs district relative to student needs, typically receives a share of aid that hovers around its flat share of enrollment at about 39 percent. In addition, the formulas are unduly complicated and arcane. Without a transparent and rational funding formula it is hard to assess the State’s progress toward more equitable funding for local districts. Problem #3- The STAR Program Works Against Equity A major part of the growth in school aid is attributable to the School Tax Relief (STAR) program. STAR was enacted in 1997 as an incentive for local school districts to reduce property tax rates by replacing some local tax revenues with STAR aid. It has been expanded several times since then and has two components, “Basic” and “Enhanced.” Basic STAR exempts a portion of full market home value from school taxes, providing average savings of $620 per household. The program only applies to owner-occupied residential dwellings. Although the minimum exemption is $30,000, in many counties the exemption is actually much greater. The value of the exemption varies by county according to an index of home value in the county as compared to the median statewide home value. This means that in Westchester, for example, the county with the highest median home value in the State, the value of the exemption is 2.8833 times the basic. Westchester home owners were thus accorded a STAR exemption of close to $90,000 this past year. Enhanced STAR is just for seniors over age 65 with household income under $67,850, computed as adjusted gross income (AGI) less eligible contributions to individual retirement accounts (IRAs). Since 2003, this component of the program increases by an annual cost of living adjustment. Enhanced STAR provides an average benefit of $930 to senior households. This group is allowed to exempt $50,000 in market value of their property from school taxes. In this program the value of the exemption is also prorated according to the county home value to statewide median index. For New York City there is an added personal income tax component designed to partially make up for the low rate of homeownership. The STAR program suffers from many problems. STAR aid flows disproportionately to the wealthiest school districts working against the redistributive goals of the school aid formulas. And although NYC gets a personal income tax supplement to the STAR benefits, other places with a high share of renters, such as the other “Big 5” cities, do not. Thus, they fare even worse under the program than New York City. Even with the enhancements New York City’s share of STAR aid is about 25 percent, far less than its share of statewide enrollment or of regular school aid. Figure 5 below demonstrates the inequitable flow of STAR aid. On average districts in the wealthiest ten percent received 28 percent more in STAR aid per pupil than did the lowest 10 percent.
16
Figure 5Per Pupil STAR Aid By Wealth Group
2003-04
$0$100$200$300$400$500$600$700$800$900
$1,000
Low 1 2 3 4 5 6 7 8 9 High 10Wealth Groups (Deciles)
Dol
lars
Per
Pup
il
___Source:New York State Education Department, Office of Management Services, Fiscal Analysis and Research Unit, School District Fiscal Profiles, Masterfile for 2003-04 , <http://www.oms.nysed.gov/faru/Profiles/profiles_cover.htm> (August 20, 2006).
The STAR program is not well targeted to provide aid where it is most needed. While the enhanced program conditions some benefit on income level the basic STAR program does not, extending the same benefits to all taxpayers in a school district regardless of the amount of taxes paid, the income level of the household, or the relationship between taxes paid and income level. Thus, the program costs more than is necessary to provide relief because a share of the benefits is flowing to property owners whose tax bills eat up a relatively small share of household income. Another problem with STAR is that taxpayers with exactly the same tax bills and incomes are treated very differently depending on where they live in the State. The regional home value index enhances the benefits that flow to wealthiest counties in the State. This violates one of the principles of good tax policy, horizontal equity, which says that similarly situated taxpayers be treated the same. Providing school aid to districts through the STAR program to substitute for locally raised funds has also proved an incentive for added school spending, blunting the program’s effectiveness as a tax relief program. Professors William Duncombe and John Yinger at Syracuse University have done some empirical work on this issue that shows that about 10 percent of the STAR aid has been used to support added school spending rather than as tax relief. Incentives to spend at the high end add fuel to the fire, pushing up that upper bar and widening the gap between the poorer and wealthier districts. Again working against traditional school aid design. The STAR program has rapidly expanded. It has grown from $580 million in school year 1998-99, the first year it became available, to $3.2 billion in school year 2004-05, an increase of $2.6 billion. Growth in STAR accounts for about 40 percent of the new State revenues provided to school districts; during the same period regular school aid increased by $3.6 billion. STAR aid
17
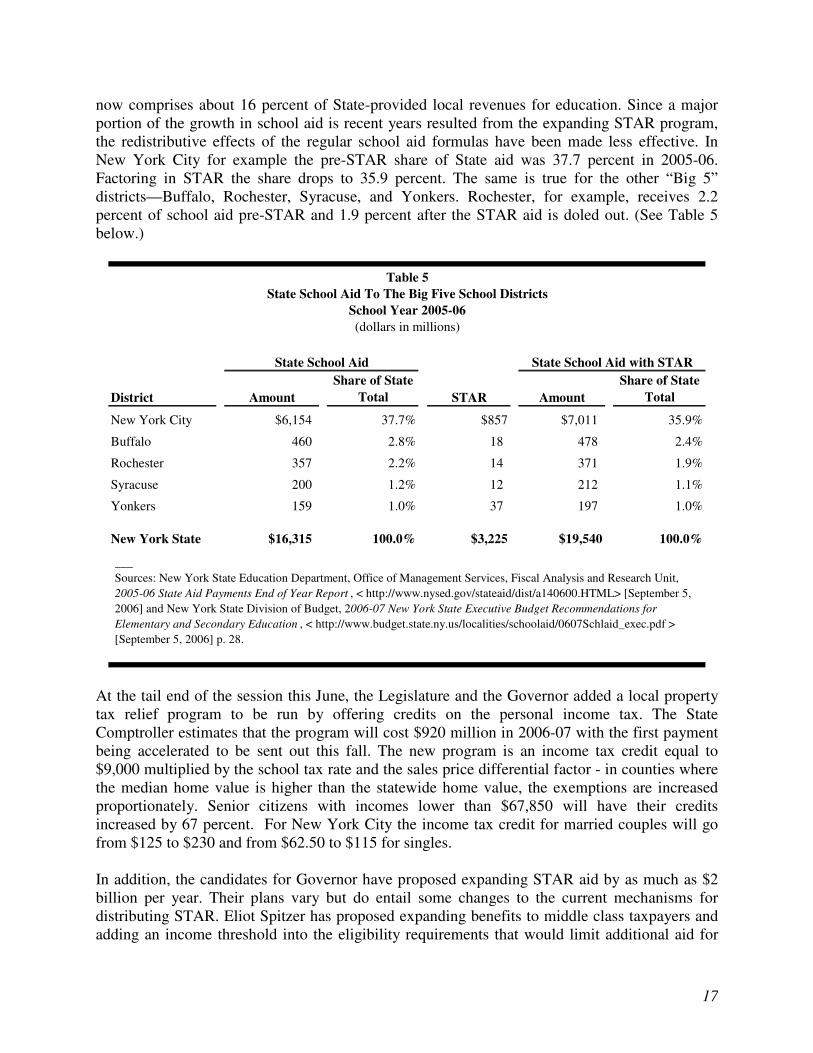
now comprises about 16 percent of State-provided local revenues for education. Since a major portion of the growth in school aid is recent years resulted from the expanding STAR program, the redistributive effects of the regular school aid formulas have been made less effective. In New York City for example the pre-STAR share of State aid was 37.7 percent in 2005-06. Factoring in STAR the share drops to 35.9 percent. The same is true for the other “Big 5” districts—Buffalo, Rochester, Syracuse, and Yonkers. Rochester, for example, receives 2.2 percent of school aid pre-STAR and 1.9 percent after the STAR aid is doled out. (See Table 5 below.)
District AmountShare of State
Total STAR AmountShare of State
Total
New York City $6,154 37.7% $857 $7,011 35.9%
Buffalo 460 2.8% 18 478 2.4%
Rochester 357 2.2% 14 371 1.9%
Syracuse 200 1.2% 12 212 1.1%
Yonkers 159 1.0% 37 197 1.0%
New York State $16,315 100.0% $3,225 $19,540 100.0%
Table 5
State School Aid State School Aid with STAR
State School Aid To The Big Five School DistrictsSchool Year 2005-06(dollars in millions)
___Sources: New York State Education Department, Office of Management Services, Fiscal Analysis and Research Unit, 2005-06 State Aid Payments End of Year Report , < http://www.nysed.gov/stateaid/dist/a140600.HTML> [September 5, 2006] and New York State Division of Budget, 2006-07 New York State Executive Budget Recommendations for Elementary and Secondary Education , < http://www.budget.state.ny.us/localities/schoolaid/0607Schlaid_exec.pdf > [September 5, 2006] p. 28.
At the tail end of the session this June, the Legislature and the Governor added a local property tax relief program to be run by offering credits on the personal income tax. The State Comptroller estimates that the program will cost $920 million in 2006-07 with the first payment being accelerated to be sent out this fall. The new program is an income tax credit equal to $9,000 multiplied by the school tax rate and the sales price differential factor - in counties where the median home value is higher than the statewide home value, the exemptions are increased proportionately. Senior citizens with incomes lower than $67,850 will have their credits increased by 67 percent. For New York City the income tax credit for married couples will go from $125 to $230 and from $62.50 to $115 for singles. In addition, the candidates for Governor have proposed expanding STAR aid by as much as $2 billion per year. Their plans vary but do entail some changes to the current mechanisms for distributing STAR. Eliot Spitzer has proposed expanding benefits to middle class taxpayers and adding an income threshold into the eligibility requirements that would limit additional aid for
18
the wealthiest homeowners. John Faso has proposed capping increases in local school district spending, a proposal that goes against local voting and approval of school district budgets, but one that would douse increased spending at the upper end of the wealth distribution.
WHERE SHOULD THE MONEY COME FROM? Fully Fund Education at the State Level A reasonable argument can be made that New York should fund its public schools entirely from State sources (excluding any federal aid). The State could set a per pupil spending level (with appropriate weights for different types of students with different resource needs) and give each school district a sum equal to its targeted spending. This spreads the burden for raising revenues across a wide population group and eliminates disparities among districts in tax burdens and spending levels. Such a version of “full State funding” may be an appropriate long-term goal. But two cautionary notes are worth sounding. Because this is such a dramatic shift from current practices, there will be predictable secondary consequences with adverse effects on some groups and there may be unanticipated consequences. A predictable secondary consequence is changes in property values as the reductions in local property taxes are capitalized in the value of residential property. Wealthy communities that now require only relatively low tax rates to support excellent schools may find their property values diminished, while other communities may see property values rise as their schools get more aid while their property taxes fall. An abrupt change in the major component of many middle class families’ wealth (that is, the value of their home) is not a fair outcome, so such a dramatic shift in school financing should be implemented only gradually and with concern for the equity implications. Harder to anticipate consequences include the implications for collective bargaining between school boards and teachers’ unions as the local boards are no longer responsible for raising any revenue, and the incentives for efficient management change. For these reasons, full State funding might be best considered as a long-term goal. Adopt School Aid Formulas that More Effectively “Equalize” Variations in Local Wealth One option for a school aid formula that would function more effectively to mitigate variations in local wealth would apply a uniform local tax rate across districts and then provide aid only to those that could not meet per pupil adequacy targets by taxing their own wealth at that rate. Formulas of this type have the dual advantage of correcting for inequitable tax burden, and promoting more equitable spending per pupil by not subsidizing higher spending by the wealthiest. The method is described below:
19
1. The State sets a target per pupil expenditure sufficient to provide an average student a sound basic education. As already noted, the size of this figure is currently being debated. In this case it is the statewide median per pupil spending.
2. The State sets a mandatory local tax rate. In the illustrative calculations presented
below, the tax base is measured the way the State does now by giving equal weight to residents’ incomes and property values in the district.7 The tax rate applied is the statewide median.
3. The State calculates the mandated expenditure requirement for each district using the
average per pupil figure and adjusting for the characteristics of students. A local cost of living adjustment could also be added. A particular district’s minimum necessary expenditures are not simply the product of the average targeted per pupil spending and the number of students. The necessary spending should reflect two other factors – students’ actual needs and regional cost of living. Student needs are typically taken into account by assigning weights to students with characteristics that require them to have more or less educational resources than average. In New York such weights have been developed by the State Education Department, and these weights are used in the calculations below.
An adjustment for cost of living may also appropriate, although not used in the analysis presented in this paper. Defining an appropriate regional cost of living index within a state is a controversial issue, and the New York State Department of education has not used such adjustments in its aid calculations and analyses. The CFE and other groups have developed indices and recommended their use.
4. The state makes an aid payment to each district equal to the difference between its
mandated expenditure requirement and its mandated minimum tax effort.8 If higher spending is desired, the district can raise the tax rate above the state mandated minimum effort and spend the additional funds on its schools.
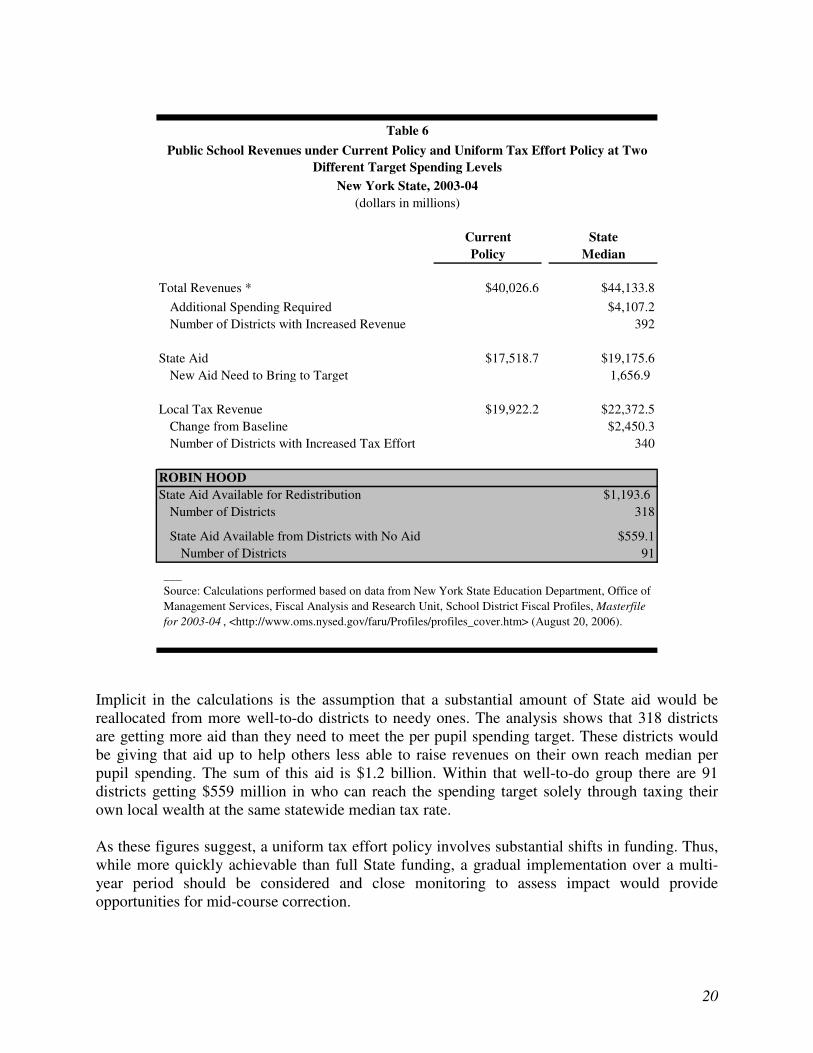
What would be the consequences if New York State followed this policy? Table 6 summarizes the results of a simulation using 2003-04 data for a uniform tax effort policy with the targeted average per pupil spending set at that year’s median for all districts. Under the new policy total spending for public schools would increase from the current $40.0 billion by about $4.1 billion as 392 districts increased their spending per pupil to the new minimum. The State’s share would increase by $1.7 billion from $17.5 billion to $19.2 billion. Under this scenario local revenues would increase by $2.5 billion. Federal Aid is not taken into account in the calculation of new State aid and local tax revenues.
7 This follows the approach used to calculate the Combined Wealth Ratio used by the New York State Department of Education. See New York State Education Department, Office of Management Services, Fiscal Analysis and Research Unit, A Guide to the Headings of the Fiscal Profile, <http://www.oms.nysed.gov/faru/Profiles/13th/Profiles%20Appendix.html> (October 25, 2004). 8 In some instances, the mandated tax effort may exceed the mandated expenditures. In these cases, the district would have the option of setting a lower tax rate or spending above the mandated minimum.
20
Current StatePolicy Median
Total Revenues * $40,026.6 $44,133.8Additional Spending Required $4,107.2Number of Districts with Increased Revenue 392
State Aid $17,518.7 $19,175.6New Aid Need to Bring to Target 1,656.9
Local Tax Revenue $19,922.2 $22,372.5Change from Baseline $2,450.3Number of Districts with Increased Tax Effort 340
ROBIN HOOD State Aid Available for Redistribution $1,193.6
Number of Districts 318
State Aid Available from Districts with No Aid $559.1Number of Districts 91
Table 6Public School Revenues under Current Policy and Uniform Tax Effort Policy at Two
Different Target Spending Levels New York State, 2003-04
(dollars in millions)
___Source: Calculations performed based on data from New York State Education Department, Office of Management Services, Fiscal Analysis and Research Unit, School District Fiscal Profiles, Masterfile for 2003-04 , <http://www.oms.nysed.gov/faru/Profiles/profiles_cover.htm> (August 20, 2006).
Implicit in the calculations is the assumption that a substantial amount of State aid would be reallocated from more well-to-do districts to needy ones. The analysis shows that 318 districts are getting more aid than they need to meet the per pupil spending target. These districts would be giving that aid up to help others less able to raise revenues on their own reach median per pupil spending. The sum of this aid is $1.2 billion. Within that well-to-do group there are 91 districts getting $559 million in who can reach the spending target solely through taxing their own local wealth at the same statewide median tax rate. As these figures suggest, a uniform tax effort policy involves substantial shifts in funding. Thus, while more quickly achievable than full State funding, a gradual implementation over a multi-year period should be considered and close monitoring to assess impact would provide opportunities for mid-course correction.
21
Finance the Increment Required to Meet the Court Mandate at the State Level Providing students with the money for a sound basic education need not wait so long. The purely incremental cost of paying for the target spending levels could be met much more quickly. To accomplish this in a way consistent with the longer term goal of a more rational statewide funding policy, the incremental cost of a sound basic education could be paid for fully by statewide revenues. That is, the State, rather than local school districts, could bear full responsibility for raising the additional funds needed for a sound basic education. Part of the rationale for increasing the State share of education funding rests on the fact that larger state shares of funding contribute to less inequity in spending among districts in a state. The “disparity index” reflects the variation in per pupil spending among districts in a state. It is the ratio of the standard deviation in per pupil spending to the mean level of per pupil spending; higher ratios indicate wider disparities in spending among districts.9 New York ranked 31st among the states in the degree of disparity in 2003, meaning that the state had greater variation than 30 other states. By comparison, New York’s neighbor states—Connecticut and New Jersey—ranked 17th and 36th, respectively. There is a statistically significant negative correlation between the degree of disparity and the share of spending provided by the state, suggesting some benefit in terms of equity from the increased share of spending. However, the correlation is far from perfect, indicating that state equalization programs are not always well designed and other factors play a role in determining the disparities among districts. Free Up Existing Resources to Fund Schools by Cutting Spending on Other Services The State of New York’s annual budget is currently in excess of $113 billion, with more than $77 billion allocated to services other than education.10 There is no doubt substantial sums can be saved by cutting these other programs. In previous studies the CBC identified as much as $5.838 billion annually that could be saved in the Medicaid program without harming the medical care for the indigent, and as much as $96 million annually that could be saved from the State’s prison system without endangering public safety.11 It is reasonable to believe that a major portion of the
9 The per pupil amounts are based on counts of pupils that are “weighted” to take into account the greater resources required by pupils who are poor and/or in need of special education. The weights used in these figures are established by Education Week and differ from those used by the New York State Department of Education. 10 State of New York, Division of the Budget, First Quarterly Update to the 2006-7 Financial Plan, July 31, 2006. 11 For savings in Medicaid see Citizens Budget Commission, Confronting the Tradeoffs in Medicaid Cost Containment, February 25, 2004, <http://www.cbcny.org/medicaid04.pdf >; for savings in the prison system see Citizens Budget Commission, Making More Effective Use of New York State's Prisons, May 25, 2000, <http://www.cbcny.org/DOCS52000.htm>.
22
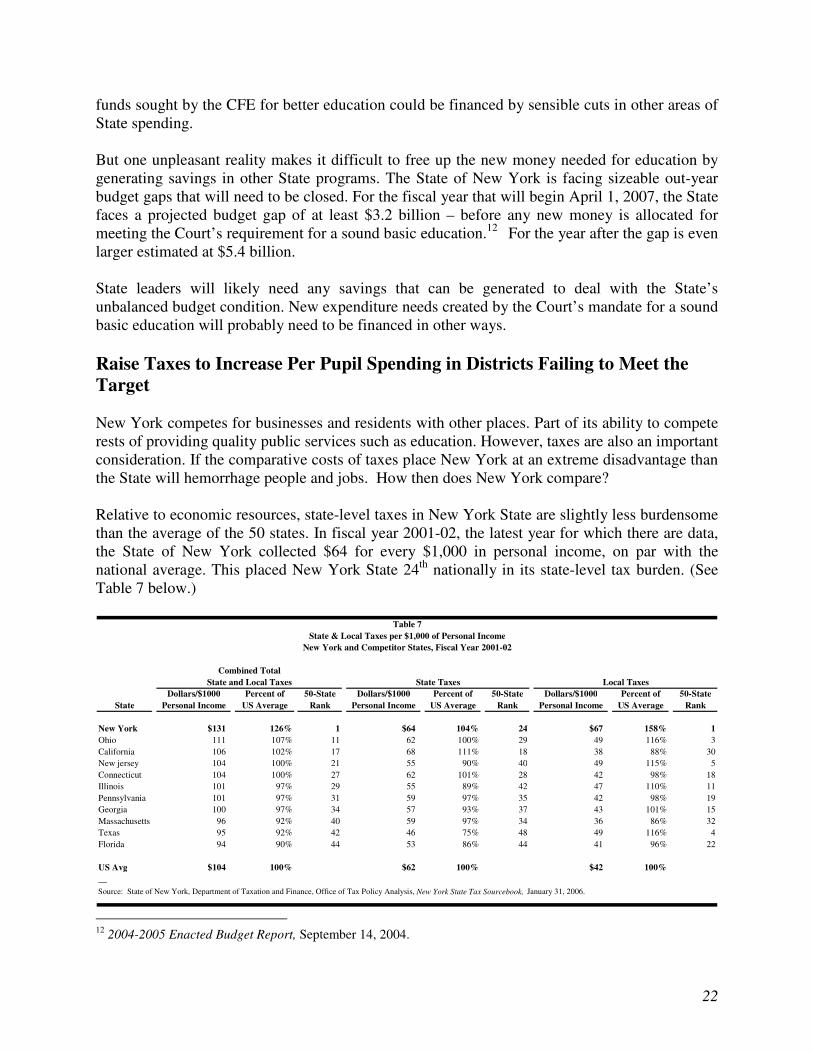
funds sought by the CFE for better education could be financed by sensible cuts in other areas of State spending. But one unpleasant reality makes it difficult to free up the new money needed for education by generating savings in other State programs. The State of New York is facing sizeable out-year budget gaps that will need to be closed. For the fiscal year that will begin April 1, 2007, the State faces a projected budget gap of at least $3.2 billion – before any new money is allocated for meeting the Court’s requirement for a sound basic education.1213For the year after the gap is even larger estimated at $5.4 billion. State leaders will likely need any savings that can be generated to deal with the State’s unbalanced budget condition. New expenditure needs created by the Court’s mandate for a sound basic education will probably need to be financed in other ways. Raise Taxes to Increase Per Pupil Spending in Districts Failing to Meet the Target New York competes for businesses and residents with other places. Part of its ability to compete rests of providing quality public services such as education. However, taxes are also an important consideration. If the comparative costs of taxes place New York at an extreme disadvantage than the State will hemorrhage people and jobs. How then does New York compare? Relative to economic resources, state-level taxes in New York State are slightly less burdensome than the average of the 50 states. In fiscal year 2001-02, the latest year for which there are data, the State of New York collected $64 for every $1,000 in personal income, on par with the national average. This placed New York State 24th nationally in its state-level tax burden. (See Table 7 below.)
Table 7State & Local Taxes per $1,000 of Personal Income
New York and Competitor States, Fiscal Year 2001-02
State Taxes Local Taxes
Dollars/$1000 Percent of 50-State Dollars/$1000 Percent of 50-State Dollars/$1000 Percent of 50-StateState Personal Income US Average Rank Personal Income US Average Rank Personal Income US Average Rank
New York $131 126% 1 $64 104% 24 $67 158% 1Ohio 111 107% 11 62 100% 29 49 116% 3California 106 102% 17 68 111% 18 38 88% 30New jersey 104 100% 21 55 90% 40 49 115% 5Connecticut 104 100% 27 62 101% 28 42 98% 18Illinois 101 97% 29 55 89% 42 47 110% 11Pennsylvania 101 97% 31 59 97% 35 42 98% 19Georgia 100 97% 34 57 93% 37 43 101% 15Massachusetts 96 92% 40 59 97% 34 36 86% 32Texas 95 92% 42 46 75% 48 49 116% 4Florida 94 90% 44 53 86% 44 41 96% 22
US Avg $104 100% $62 100% $42 100%__
State and Local TaxesCombined Total
Source: State of New York, Department of Taxation and Finance, Office of Tax Policy Analysis, New York State Tax Sourcebook, January 31, 2006.
12 2004-2005 Enacted Budget Report, September 14, 2004.
23
However, local government taxes in New York State are far more burdensome than elsewhere in the country. New York State residents and businesses pay their local governments, including school districts, $67 for every $1,000 of personal income, fully 158 percent of the national average. The high local tax burden pushes the combined state and local tax burden in New York to the highest in the nation, more than a quarter higher than the national average. The problem is not just for New York City. Local taxes Upstate are also much higher than average. New York's local taxes are so high primarily because of policies set by the State. Unlike other states, New York requires its localities to pay a significant share of Medicaid and public assistance costs. This requirement accounts for about one-quarter of the difference between New York's local tax burden and the national average. The below-average share of education spending provided by the State accounts for another quarter of the difference. Most of the remaining difference is accounted for by fringe benefits (often driven by State mandates) and above-average wages provided to public employees in New York, public safety spending, and debt service. It is in this context that one must consider tax increases. The billons needed could be raised by higher rates for the existing broad-based State taxes – the personal income tax and the sales tax. Alternatively, the State could establish a new State property tax to supplement the property tax levied by local governments. The current State sales tax rate is 4.0 percent; the State personal income tax has a progressive rate structure with the rate at the top bracket (over $40,000 annually) at 6.85 percent and the average effective rate at 4.9 percent.13 For both taxes, some local governments add a local sales tax and, in a few cases, a local income tax. While the State rates place New York State near the middle of the 50 states for these particular tax burdens, the combined state and local rates in some parts of New York State, and especially in New York City, are among the highest in the nation. New York, like most states, does not have a state level property tax. However, its local governments rely heavily on this tax. As a share of personal income, local property taxes in New York State ranked ninth among the 50 states; on a per capita basis New York ranked fourth.
13 This description of the personal income tax does not include the temporary tax surcharge imposed in 2003 and scheduled to expire in 2006. That surcharge added two additional brackets, one for taxpayers with incomes of $150,000 - $500, 000, and another for those with incomes in excess of $500,000.
24
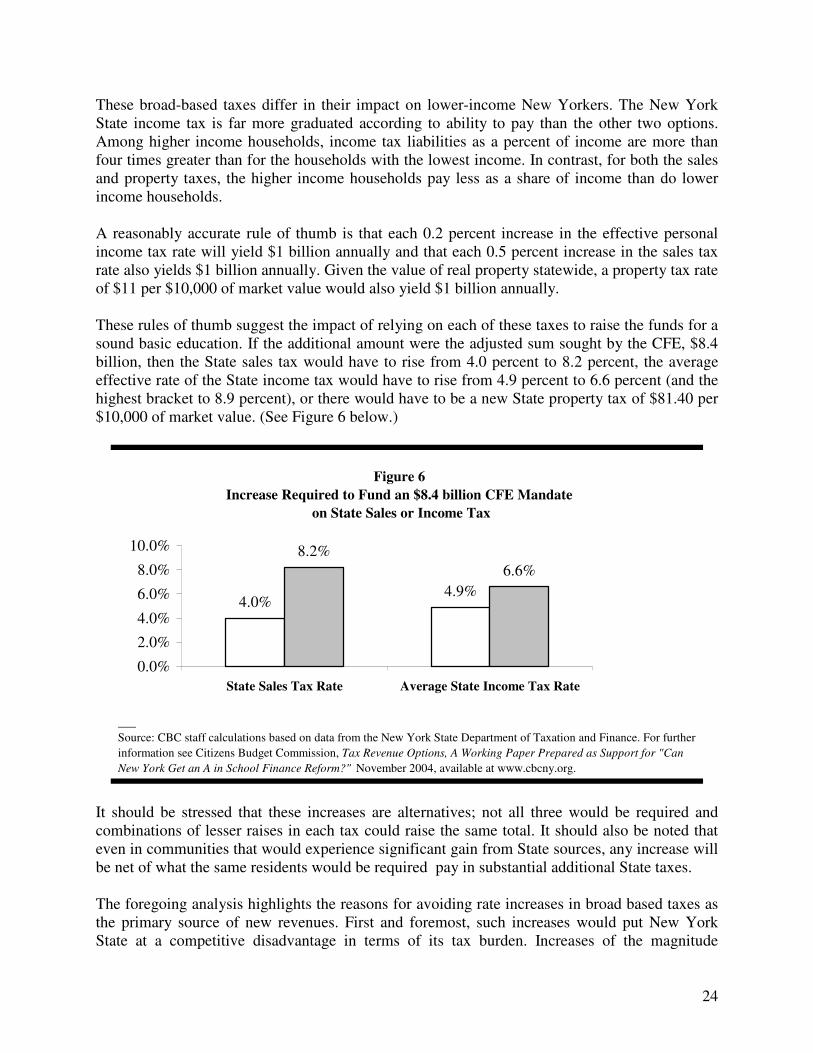
These broad-based taxes differ in their impact on lower-income New Yorkers. The New York State income tax is far more graduated according to ability to pay than the other two options. Among higher income households, income tax liabilities as a percent of income are more than four times greater than for the households with the lowest income. In contrast, for both the sales and property taxes, the higher income households pay less as a share of income than do lower income households. A reasonably accurate rule of thumb is that each 0.2 percent increase in the effective personal income tax rate will yield $1 billion annually and that each 0.5 percent increase in the sales tax rate also yields $1 billion annually. Given the value of real property statewide, a property tax rate of $11 per $10,000 of market value would also yield $1 billion annually. These rules of thumb suggest the impact of relying on each of these taxes to raise the funds for a sound basic education. If the additional amount were the adjusted sum sought by the CFE, $8.4 billion, then the State sales tax would have to rise from 4.0 percent to 8.2 percent, the average effective rate of the State income tax would have to rise from 4.9 percent to 6.6 percent (and the highest bracket to 8.9 percent), or there would have to be a new State property tax of $81.40 per $10,000 of market value. (See Figure 6 below.)
Figure 6Increase Required to Fund an $8.4 billion CFE Mandate
on State Sales or Income Tax
4.0%4.9%
8.2%6.6%
0.0%
2.0%
4.0%
6.0%
8.0%
10.0%
State Sales Tax Rate Average State Income Tax Rate
___Source: CBC staff calculations based on data from the New York State Department of Taxation and Finance. For further information see Citizens Budget Commission, Tax Revenue Options, A Working Paper Prepared as Support for "Can New York Get an A in School Finance Reform?" November 2004, available at www.cbcny.org.
It should be stressed that these increases are alternatives; not all three would be required and combinations of lesser raises in each tax could raise the same total. It should also be noted that even in communities that would experience significant gain from State sources, any increase will be net of what the same residents would be required pay in substantial additional State taxes. The foregoing analysis highlights the reasons for avoiding rate increases in broad based taxes as the primary source of new revenues. First and foremost, such increases would put New York State at a competitive disadvantage in terms of its tax burden. Increases of the magnitude
25
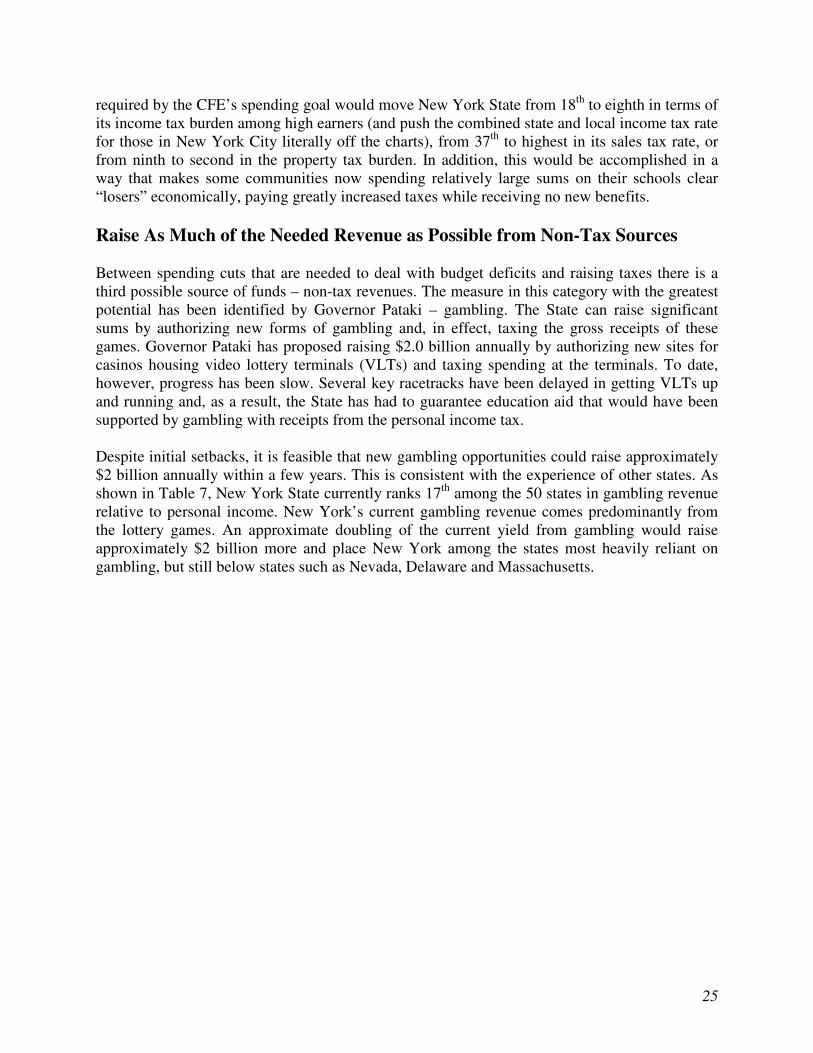
required by the CFE’s spending goal would move New York State from 18th to eighth in terms of its income tax burden among high earners (and push the combined state and local income tax rate for those in New York City literally off the charts), from 37th to highest in its sales tax rate, or from ninth to second in the property tax burden. In addition, this would be accomplished in a way that makes some communities now spending relatively large sums on their schools clear “losers” economically, paying greatly increased taxes while receiving no new benefits. Raise As Much of the Needed Revenue as Possible from Non-Tax Sources Between spending cuts that are needed to deal with budget deficits and raising taxes there is a third possible source of funds – non-tax revenues. The measure in this category with the greatest potential has been identified by Governor Pataki – gambling. The State can raise significant sums by authorizing new forms of gambling and, in effect, taxing the gross receipts of these games. Governor Pataki has proposed raising $2.0 billion annually by authorizing new sites for casinos housing video lottery terminals (VLTs) and taxing spending at the terminals. To date, however, progress has been slow. Several key racetracks have been delayed in getting VLTs up and running and, as a result, the State has had to guarantee education aid that would have been supported by gambling with receipts from the personal income tax. Despite initial setbacks, it is feasible that new gambling opportunities could raise approximately $2 billion annually within a few years. This is consistent with the experience of other states. As shown in Table 7, New York State currently ranks 17th among the 50 states in gambling revenue relative to personal income. New York’s current gambling revenue comes predominantly from the lottery games. An approximate doubling of the current yield from gambling would raise approximately $2 billion more and place New York among the states most heavily reliant on gambling, but still below states such as Nevada, Delaware and Massachusetts.
26
Revenue per Revenue
State Ranking $1,000 Personal Income per capitaRhode Island 1 $24.40 $712.88Massachusetts 2 14.59 550.92Oregon 3 13.95 392.05Delaware 4 13.55 418.36Nevada 5 11.53 350.82Georgia 6 8.94 250.30Connecticut 7 8.27 343.23Ohio 8 6.78 191.14Louisiana 9 6.60 152.38West Virginia 10 6.59 144.41Maryland 11 6.51 223.10New Jersey 12 6.43 246.56South Dakota 13 6.33 162.77Kentucky 14 6.03 147.21Indiana 15 5.95 161.37Michigan 16 5.72 169.05New York 17 5.06 176.45
United States $4.63 $138.19
Table 8Gambling Revenue by State, 2000
Per Capita and Per $1,000 in Personal Income
___Sources: U.S. Census Bureau, Statistical Abstract of the United States 2003 , <http://www.census.gov/prod/2004pubs/03statab/stlocgov.pdf> (April 29, 2004); Personal Income and population data are from the U.S. Department of Commerce, Bureau of Economic Analysis.
The problems with gambling revenues are that they tend to be regressive (placing a disproportionately large burden on lower income households), and that they put the State in the morally uncomfortable position of promoting the games and the sometimes-addictive behavior they generate. The Governor’s proposal to limit the number of sites for new casinos limits these negatives, and proponents correctly point out that those who pay the “tax” do so voluntarily and without regarding it as a tax. Nonetheless, gambling is a regressive source of State income with serious social costs. Despite these drawbacks, new gambling opportunities could provide a significant source of additional revenues. These options have advantages because they do less harm to the state’s economic competitiveness, are not regarded as a tax by those paying, and recapture some spending by state residents now benefiting other states that provide greater gambling opportunities. The State could pursue these revenues through forms of gambling that are limited to “destination” type casinos which will attract tourists and some higher income households along with lower income New Yorkers (as opposed to multiple neighborhood locations that draw almost exclusively lower-income bettors). In addition, the State’s activities to advertise and promote the games could be closely regulated and monitored so that they are conducted
27
responsibly. Assuming that these reasonable conditions can be met in future proposals to expand gambling, then about $2 billion could be raised in this way. Restructure Existing Taxes To Increase Revenue and Improve Tax Policy Higher rates are not the only way to increase taxes. Applying an existing tax to a broader base also yields more money. This usually is preferable to higher rates, because it is more equitable and is less likely to distort people’s behavior. While fairer and more economically efficient, these changes still have the net effect of increasing society’s tax burden unless there are offsetting cuts in the rates. Each of the tax changes discussed below would be desirable as an improvement in the tax system, if the added collections were offset by reductions in the overall rate. However, because the policy objective with respect to education funding is more revenue, this is not possible. Although the changes will increase the overall tax burden, they are preferable to higher tax rates on the current base because they make the system more efficient and equitable.
1. The least harmful and most sensible tax measure is to collect the existing sales tax on remote and internet sales. Because the State cannot force out-of-state vendors to collect this tax, it often goes unpaid. The yield from better enforcement is difficult to estimate precisely and depends on assumptions about the volume of current evasion, but is in a range of $40 million to $590 million annually. However, implementation of this change depends on cooperation with other states and development of interstate enforcement capacity. Significant new revenues are unlikely for a few years, but could help pay for a phased-in court mandate.
2. The base of the current sales tax should be broadened to include items now exempt.
Many of these exemptions for items ranging from home improvements to veterinarian services have no economic logic and are rooted in the lobbying efforts of special interests. Eliminating a reasonable set of such exemptions (including capital improvements, eyeglasses, newspapers and magazines, and laundry) would yield an estimated $950 million annually.
3. The base of the existing corporate income tax should be redefined to include certain
forms of income now excluded, and the rules for calculating taxable corporate income should altered to include certain sales and profits now excluded. In addition, a higher alternative minimum tax should be set. Reasonable estimates of the amounts of corporate income shielded by the current definitions and rules suggest that these changes would yield between $320 million and $435 million annually.
4. The base of the existing sales tax should be extended to include retail or consumer
(but not business-to-business) sales of selected professional services such as law and accounting. Precise estimates are not available for the share of these professional services sold directly to consumers, but reasonable estimates of the volume suggest that this tax measure would yield between $175 million and $595 million per year.
28
Impose a Luxury Tax on Wealthy Districts A luxury tax imposes a surcharge levy on articles that are not essential to a normal standard of living. History tells us that such taxes may be imposed strictly for revenue purposes or they may be intended to discourage consumption of certain articles, e.g., the tax on French lawns and laces in the 18th century. And lest the example from the French revolution seem un-American, one can point to the national pastime- baseball- for another contemporary luxury tax option. In baseball, the luxury tax requires that teams with payrolls above a specific threshold pay a fraction of the spending above that amount to a special pool that is given to poorer teams to help them recruit better talent. Baseball players and team owners have recognized that the American public does not want competition among teams when the odds are so stacked in favor of the rich. This is a concept that also resonates in the realm of public education. Education experts in New York State and elsewhere face the same basic problem: how to achieve competitive levels of performance in the face of unequal financial resources. Not only would the option provide resources to level the playing field it might also curb spending by the wealthiest districts in the State that drives up spending for everyone in the State. By creating a “steeper price” for providing educational services that are not essential to a normal standard of living, some districts would be disinclined to provide them. One proposal for a luxury tax is to add a tax surcharge onto local effort above a spending threshold that would require the district to “share” the revenue with less fortunate districts through a state-administered pool. This would mean that in order for Great Neck, for example, to raise its local revenues for its schools through a tax increase from $19,000 to $20,000, it would have to raise more than $1,000, because a certain percentage of local revenues in excess of $19,000 would have to be placed in the shared fund. Great Neck voters would have to be willing to bear this added burden to approve school tax increases. Another proposal is one structured on the payroll example from baseball. Just as in baseball, school districts with payrolls above some reasonable threshold (given their size) could be required to pay a fraction of the excess sum into a pool. One way to estimate the pool of revenues that might be subject to a luxury tax in New York is to look at the districts that would not have qualified for state aid under our uniform tax effort policy for a few years in a row, and calculate the additional local revenues generated by these districts over this period of time. Using the data from 2001-2002 and 2003-04 we identified 71 districts that would not have been eligible for any state aid under the uniform tax effort policy in both years. These districts increased their local revenues by a total of nearly $300 million. The luxury tax option is not a far-fetched as it may seem. Wisconsin and Texas are examples of states that effectively impose a luxury tax on their wealthiest districts.
29
Wisconsin School aid in Wisconsin is distributed through a three-tiered equalization formula. The state guarantees a certain property tax base amount per pupil and makes up the difference between the guaranteed tax base and the local tax base with state aid. There are three guaranteed valuations used in the equalization formula that are applied to three different expenditure levels. The third guarantee feature of the system acts as a luxury tax. Primary Aid Level. The first tier of support is up to a primary cost ceiling of $1,000 per pupil. The state funds the difference between a district’s local tax base per pupil and a fixed primary guaranteed tax base per pupil, up to the primary cost ceiling. So, if a district’s tax base per pupil is 15 percent of the primary guaranteed tax base, for example, the state will provide 85 percent of the primary cost ceiling, or $850. A district's primary aid cannot be reduced by negative aids that might be generated at the secondary or tertiary aid levels. This is referred to as the “primary aid hold harmless" provision. Secondary Aid Level. The second tier of support is for cost per pupil between $1,000 and a secondary cost ceiling. The 2004-05 school year secondary cost ceiling was $7,679. The state’s share is calculated using a secondary guaranteed tax base per pupil, which is allowed to float to a level that fully distributes the amount of funds available for equalization aid. If a district’s tax base per pupil is 30 percent of the secondary guaranteed tax base, the state will fund 70 percent of the difference between the primary and secondary cost ceiling. Tertiary Aid Level. The third tier of support is for cost above the secondary cost ceiling. The tertiary guaranteed tax base per pupil is set at 100% of the statewide average equalized tax base per pupil. The tertiary guarantee is tied to the average property tax base per pupil to reflect statewide changes in property value and enrollment. It is also set at an amount lower than the secondary guarantee so that the state's share will be lower on costs above the secondary cost ceiling. The tertiary guarantee feature of the equalization formula is, in effect, a luxury tax, because negative tertiary aid is deducted from secondary aid amount. Negative aid is generated when a district’s tax base per pupil exceeds the secondary or tertiary guaranteed tax base. As noted earlier, the hold harmless provision does not allow a district to receive less than its primary aid amount, but does allow for negative aid to affect positive secondary aid. The third tier of the equalization formula serves as a disincentive for higher spending levels by causing districts to be taxed at much higher rates for costs incurred above the tertiary ceiling. In 2004-05, 117 school districts (27.5% of all districts and 29.2% of the total student membership) were affected by the negative tertiary aid feature of the formula, but had positive secondary aid that exceeded the negative tertiary aid. In addition, 18 school districts had negative tertiary aids which completely offset their positive secondary aid, and 19 school districts had a local tax base per pupil exceeding the secondary guarantee, and generated negative secondary aids. In total, 37 school districts (8.7% of all districts and 4.4% of total membership) received only the primary aid amount.
30
Texas The current education finance system was devised by the Texas legislature in 1993-94 as a third response to a 1984 lawsuit charging that the then-current system of school finance was unconstitutional. It includes a wealth recapture mechanism, which limits a school district’s wealth to an established equalized wealth level. State aid in Texas is allocated through a system of formulas known collectively as the foundation school program. The system consists of two tiers and a wealth reduction provision. The first tier provides a base funding level for all students at a local tax rate of $0.86 per $100 of property value. The second tier is a guaranteed yield mechanism in which the state guarantees school districts a yield of $24.7 per student for each penny of tax above $0.86. Districts may levy up to $0.64 of tax rate in Tier 2, but they are not required by law to do so. Districts with wealth above an established threshold level of wealth per pupil are subject to the wealth reduction provision. The equalized threshold wealth per pupil was $295,000 in 2000-2001, and the number of districts subject to the recapture provision was just under 100. Affected districts can choose one of five wealth sharing options. In practice, districts pursue only two options, purchase of attendance credits, or education of nonresident students. One attendance credit is equal to one weighted pupil, and the cost is determined by the education commissioner. The other option enables a district with wealth above the equalized level to enter into an agreement with a qualifying district to pay the cost of educating students in that district. The paying district provides the receiving district with revenue per weighted pupil equal to the amount spent in the paying district. Weighted pupils from the receiving district are added to paying district's student count. Both of these options have the effect of recapturing revenue from high-wealth districts and giving to low-wealth districts, and are often referred to as “Robin Hood.” The Texas Robin Hood program involves the redistribution of about $30 billion annually in school property taxes. Although it succeeded in narrowing the spending gap between the wealthiest and the poorest districts in the state, Texas’ Robin Hood has also been found to be economically counterproductive. According to a 2004 study led by Harvard University economist Caroline M. Hoxby, Robin Hood had destroyed an estimated $81 billion worth of property wealth, or about $27,000 in per-pupil terms.1414 The authors of the study relate this outcome to “inefficient confiscation of wealth,” and concede that an alternative recapture mechanism is conceivable, which would not necessarily lead to loss of property wealth. The authors also predicted that the scheme was on the brink of collapse, but that has not been the case as of yet.
14 Caroline M. Hoxby and Ilyana Kuziemko, "Robin Hood and His Not-So-Merry Plan: Capitalization and the Self-Destruction of Texas' School Finance Equalization Plan," NBER Working Paper No. 10722, July 2004.
31
DISCUSSION FRAMEWORK The following summary of the options and the issues at hand was prepared to aid your deliberation of the topics under consideration. WHERE SHOULD THE MONEY COME FROM? Options discussed in the paper include:
1. Fully Funding Education at the State Level 2. Adopting School Aid Formulas that More Effectively “Equalize” Variations in
Local Wealth 3. Financing the Increment Required to Meet the Court Mandate at the State Level 4. Freeing Up Existing Resources to Fund Schools by Cutting Spending on Other
Services 5. Raising Taxes to Increase Per Pupil Spending in Districts Failing to Meet the Target 6. Raising As Much of the Needed Revenue as Possible from Non-Tax Sources 7. Restructuring Existing Taxes To Increase Revenue and Improve Tax Policy 8. Imposing a Luxury Tax on Wealthy Districts
WHAT WOULD ROBIN HOOD DO? The story has Robin Hood stealing from the rich to give to the poor. What does this mean in the context of school aid? What are the solutions that comport with rich districts giving to poor ones? And are any of these feasible in New York State? Perhaps the political hurdles to adopting this approach are lower than conventional wisdom suggests. The New York Matters poll recently conducted by the Center for Governmental Research showed a surprisingly positive response to the option among those contacted. If the public will consider what most politicians have heretofore considered a non-starter, maybe Robin Hood got a bad rap? Attached is a list of districts that would either get less State aid or none at all. Also attached is a list of districts that would get significantly more State aid than they do now. How would your district fare under this policy? What do you think the consequences would be? WHAT SHOULD THE NEW GOVERNOR DO?