Embed Size (px)
Citation preview

Approaches to control air pollution from ports and ships
Green Ports: New Front for China’s War on Pollution and Climate Change Mitigation
Dan Rutherford, Ph.D.Haifeng Wang, Ph.D.Xiaoli Mao 26 July 2016

§ Why should we care?§ Case study: Shore power and fuel switching
in Shenzhen § Next up: Emission control areas§ Looking forward§ Conclusions
Outline

Slide 3
Approaches to control air pollution from ports
and shipsWhy should we care?

Air pollution from ports and vessels pose a serious public health challenge
Annual premature mortality from ship emissions
Winebrake, J., Corbett, J., Green, E., Lauer, A., & Eyring, V. (2009). Mitigating the Health Impacts of Pollution from Oceangoing Shipping: An Assessment of Low-Sulfur Fuel Mandates. Environmental Science and Technology, 43(13), 4776
§ Three quarter of the world’s major cities and 50% of the global population lives on the coast exposed to pollution from shipping and ports
§ Estimated 60,000 premature cardiopulmonary and lung cancer deaths in 2002 related to particulate emissions from shipping.
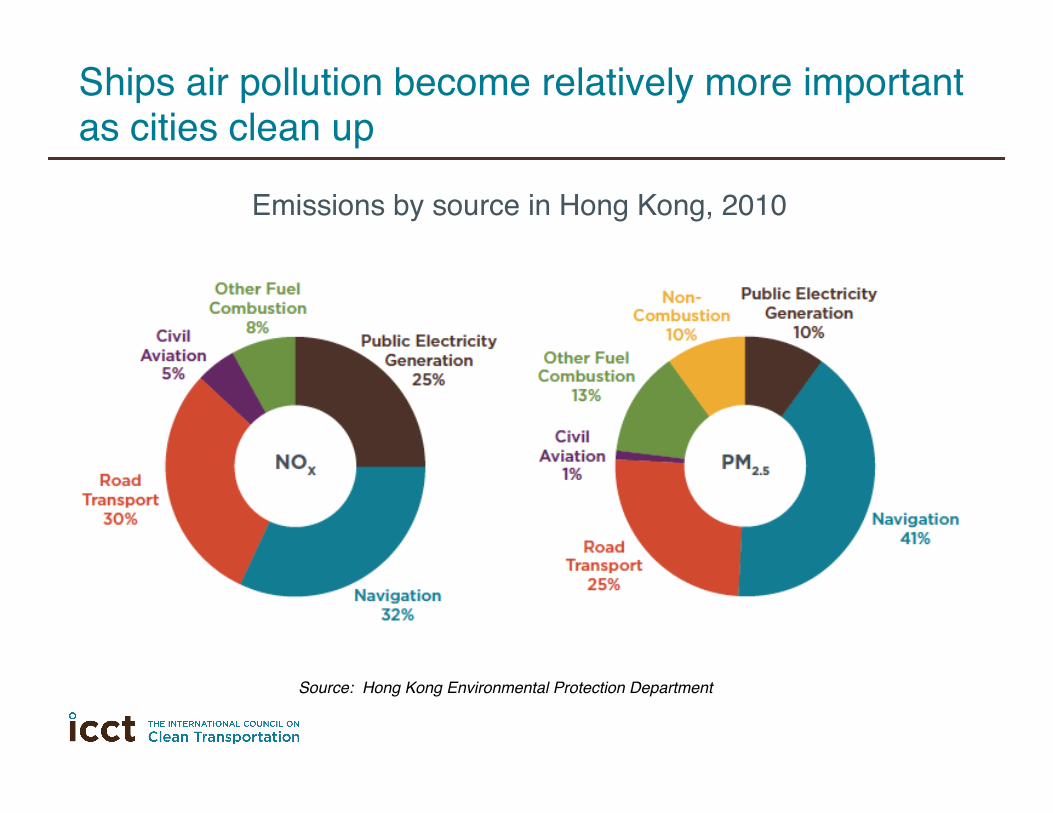
Ships air pollution become relatively more important as cities clean up
Source: Hong Kong Environmental Protection Department
Emissions by source in Hong Kong, 2010

§ Shipping responsible for 8~13% of diesel-related black carbon emissions in 2010, with 80% of those emissions in the Northern Hemisphere.
§ Interest in Arctic shipping via Russia’s Northern Sea Route is high.
§ Increased vessel traffic through the Bering Strait could increase air pollution 150 to 600% in the US High Arctic by 2025 using today’s fuels.
Shipping is also important for black carbon control
66 http://www.theicct.org/air-pollution-marine-vessels-us-high-arctic-2025 Wall Street Journal, 29 October 2015.

Slide 7
Approaches to control air pollution from
ports and ships
Shore power and fuel switching at the Port of Shenzhen

§ SOx and PM emissions are of great concern in China
§ Shenzhen is a key port linking PRD feeder routes to many international container routes
§ August 2015 MoT action plan for port and ship emissions
§ Mature technologies technologies with existing infrastructure/ regulatory support - Fuel switching subsidies- California shore power mandate
Assessment of shore power and fuel switching at the Port of Shenzhen
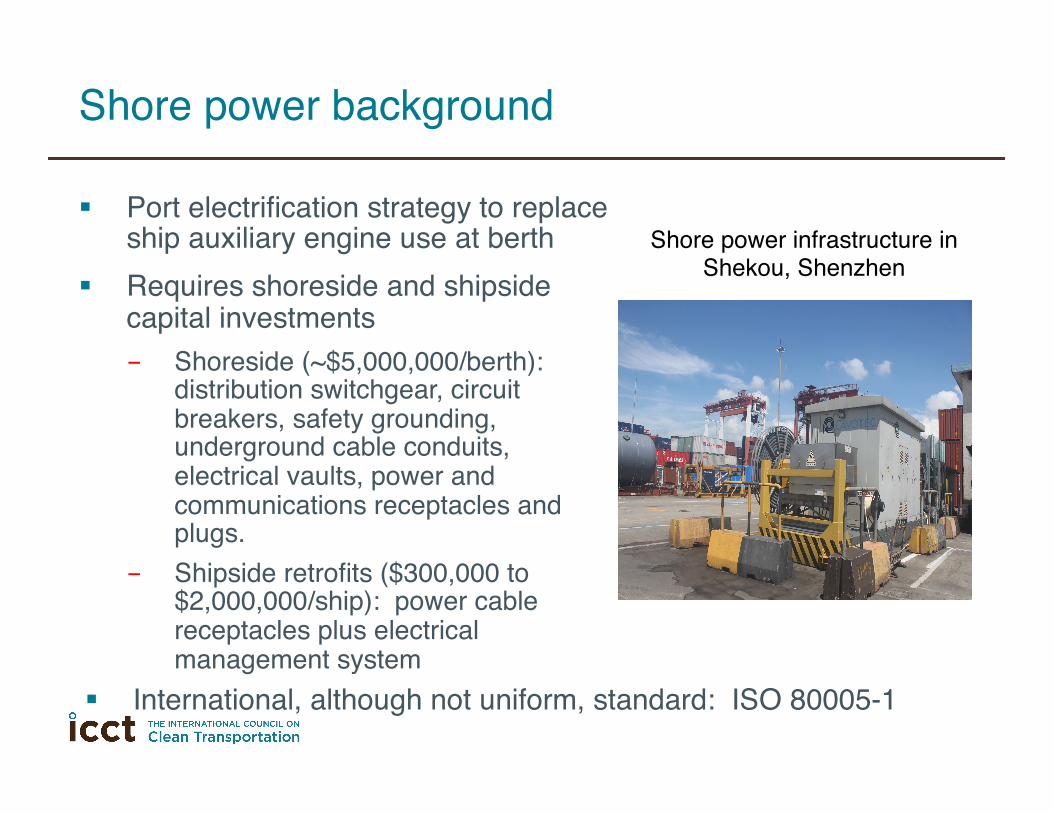
§ Port electrification strategy to replace ship auxiliary engine use at berth
§ Requires shoreside and shipside capital investments- Shoreside (~$5,000,000/berth):
distribution switchgear, circuit breakers, safety grounding, underground cable conduits, electrical vaults, power and communications receptacles and plugs.
- Shipside retrofits ($300,000 to $2,000,000/ship): power cable receptacles plus electrical management system
Shore power background
Shore power infrastructure in Shekou, Shenzhen
§ International, although not uniform, standard: ISO 80005-1

Examples of fuel switching requirements
http://adi-analytics.com/wp-content/uploads/2015/06/World-ECA-Map.png

Emission factors for Shenzhen shore power
Source: Costs and benefits of shore power at the Port of Shenzhen, ICCT and WWC, 2015.
Improving grid

Cost effectiveness of Shenzhen shore power
NOxParticulate matter
Source: Costs and benefits of shore power at the Port of Shenzhen, ICCT and WWC, 2015.
Improved berth utilization
Leverage network effects

§ Shore power is an effective means of reducing air pollution at berth, providing 88%, 94%, 95%, and 37% reductions in SOx, NOx, RSP, and CO2 respectively in 2020.
§ Relatively expensive compared to at berth fuel switching ($13,000/tonne SOx, $310,000/tonne PM)
§ Cost effectiveness improves as utilization rate increases, through network effects and with greater incorporation into new build ships
§ Policy recommendations- Prioritize 0.5% to 0.1% sulfur fuel switching - Consider incentives to attract shore power capable ships- Work with other Pacific Rim ports to take advantage of
network effects
Case study conclusions

Slide 14
Approaches to control air pollution from ports
and shipsEmission Control Areas

Existing Emission Control Areas (ECAs)
http://adi-analytics.com/wp-content/uploads/2015/06/World-ECA-Map.png

Domestic Emission Control Areas (D-ECA)
http://adi-analytics.com/wp-content/uploads/2015/06/World-ECA-Map.png

Comparison of ECA requirements
http://adi-analytics.com/wp-content/uploads/2015/06/World-ECA-Map.png
§ Greater geographic coverage: - <200 nm coverage, vs. 12 nm for D-ECAs- Full coast, rather than current D-ECAs only
§ Greater emission reductions:- Additional, cost effective SOx and PM reductions- Potential for NOx control as well
§ Leverage international experience with compliance and enforcement
§ Accelerated investments in control technology could stimulate international competitiveness
Benefits of going the extra step

Slide 19
Approaches to control air pollution from ports
and shipsLooking forward

The flow of policy and technology

§ Exacting fuel quality standards as a key enabling strategy
§ Near-zero emission standards for engines § Soot free goods movement§ Where possible, alternative and sustainable fuels
(including electrification)§ Managing the impacts of Arctic shipping§ Integrating environmental considerations into supply
chain management§ Compliance and enforcement!
What will we be discussing in 5 to 10 years?

Slide 22
Approaches to control air pollution from ports
and shipsConclusions

§ Shore power is an effective means of reducing air pollution in Shenzhen- Additional (MDO to MGO) fuel switching could be
prioritized- Additional measures to increase shore power utilization
and leverage existing investments are recommended § IMO ECA system provides a potential vehicle for
expanded air quality benefits§ Studying other modes may provide clues as to where
future work will lead us
Conclusions