Embed Size (px)
Citation preview

1
RISK ASSESSMENT AND CONTROL APPROACHES FOR STORMWATER
FLOOD AND POLLUTION MANAGEMENTMANAGEMENT
J Bryan Ellis, Lian Scholes, Michael Revitt
and Christophe Viavattene
Urban Pollution Research Centre,
Middl U i it UKMiddlesex University. UK
SWITCH 3rd Scientific Meeting, Sustainable Urban Drainage
2ndDecember 2008, Belo Horizonte
URBAN FLOOD, POLLUTION AND HABITAT RISKS

2
Grand Union Canal
City Centre
River Rea
Warwick & Birmingham
Canal
BIRMINGHAM EASTSIDE
DEVELOPMENT AREA
W Midlands Regional Assembly
BritishWaterways
Board
Environment Agency(Midlands Region)
THE BIRMINGHAM LEARNING ALLIANCE (LA)
HighwaysAdvantage
(W Midlands
Solihull Metropolitan
Borough Council
Developers
BIRMINGHAMCITY
COUNCIL
Severn TrentWater Consumer
Council for Water
(W Midlands)
England
HighwaysAgency
Developers & Consultingcompanies
Nature
Groundwork
3
5
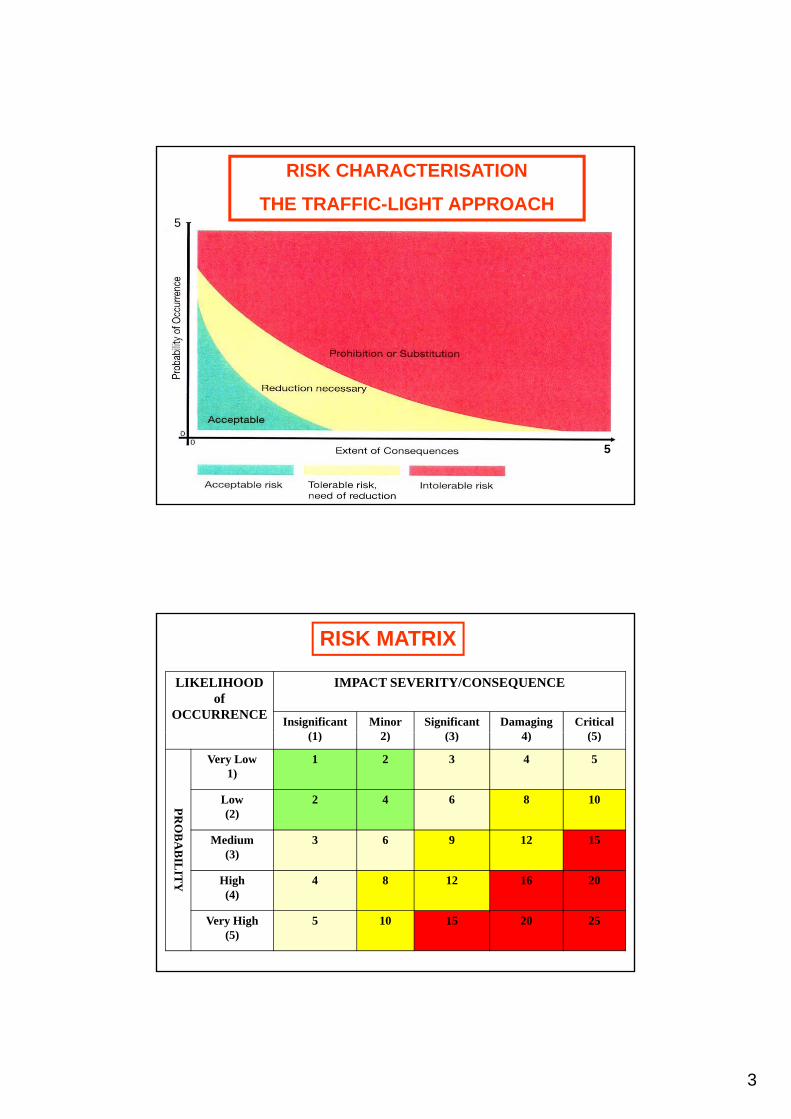
RISK CHARACTERISATION
THE TRAFFIC-LIGHT APPROACH
5
LIKELIHOOD of
OCCURRENCE
IMPACT SEVERITY/CONSEQUENCE
Insignificant (1)
Minor 2)
Significant (3)
Damaging 4)
Critical (5)
RISK MATRIX
(1) 2) (3) 4) (5)
PRO
BA
B
Very Low 1)
1 2 3 4 5
Low (2)
2 4 6 8 10
Medium (3)
3 6 9 12 15BIL
ITY
(3)
High (4)
4 8 12 16 20
Very High(5)
5 10 15 20 25

4
Risk Quadrants
High Likelihood/ProbabilityInsignificant Impact
L – M Risk
High Likelihood/Probability
/Damaging Impact
Low Likelihood/Probability
Low Likelihood/Probability
/Damaging ImpactH Risk
4 - 8 16 - 25
e ood/ obab tyInsignificant Impact
L Risk
Likelihood/ProbabilitySignificant Impact
M – H Risk
1 - 3 9 - 15
LEARNING ALLIANCE RISK ASSESSMENT PARAMETERS
• HYDRAULIC PERFORMANCE: FLOOD RISKS Increased flood frequency and damage
• WATER QUALITY RISKS Increased wet weather pollution; Compliance with receiving water standards and quality objectives
• ECOLOGICAL/HABITAT RISKS Suppression of biodiversity; Impacts pp y; pon channel morphology; Reduced amenity value
• SURFACE WATER MANAGEMENT RISKS Institutional/organisational arrangements and responsibilities; Integrated urban water management; Stakeholder consultation/participation in decision-making on infrastructure; Management of separate/combined sewer systems
• URBAN LAND USE PLANNING RISKS Planning controls on urban development/creep; Compatibility of district, municipal, state and national legislation and planning objectives; Co-consideration of flood, pollution and amenity values/objectives in planning
• BMP/SUDS IMPLEMENTATION RISKS Appropriate design/installation guidance; lack of technical knowledge and working expertise; Uncertainties on safety and health risks; O&M and adoption risks; Incentives (financial/public amenity etc) for controls and rainwater harvesting
5
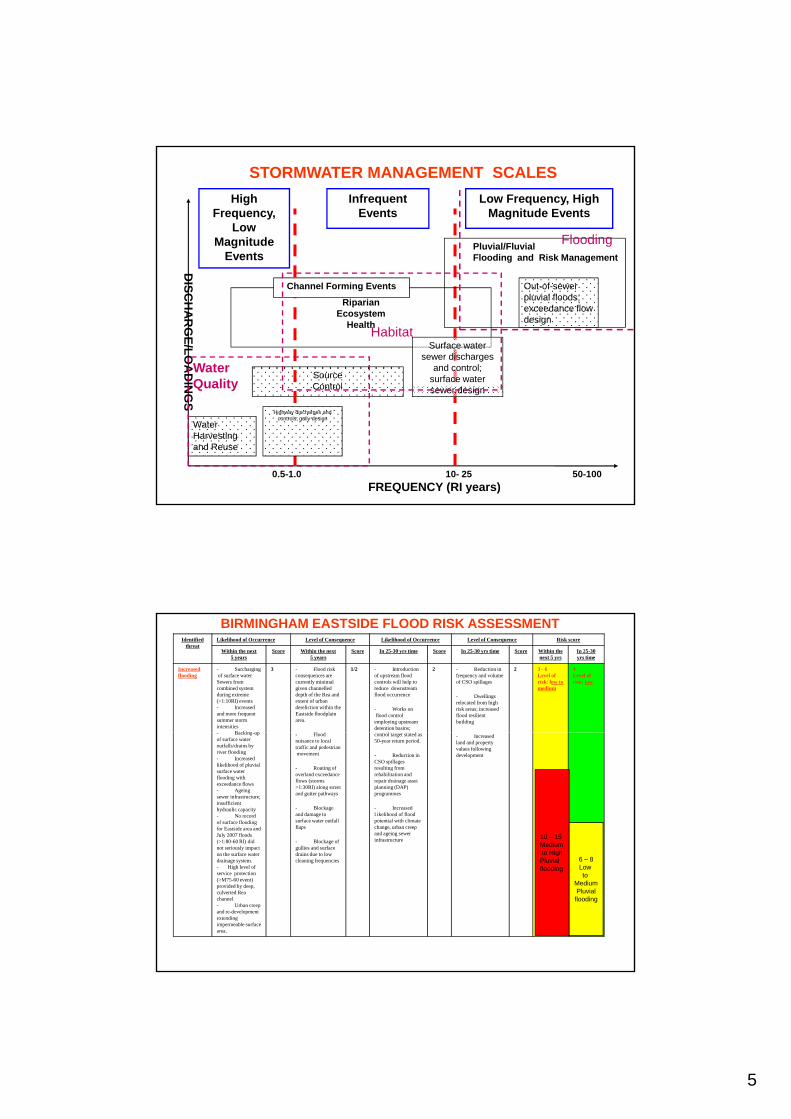
High Frequency,
Low Magnitude
Events
InfrequentEvents
Low Frequency, High Magnitude Events
Pluvial/Fluvial Flooding and Risk Management
STORMWATER MANAGEMENT SCALES
Flooding
SourceControl
DISC
HA
RG
E/LOA
DI
RiparianEcosystem
Health
Channel Forming Events
Surface water sewer discharges
and control; surface water
Out-of-sewer pluvial floods; exceedance flow design
WaterQuality
Habitat
ControlNG
S
0.5-1.0 10- 25 50-100FREQUENCY (RI years)
Water Harvesting and Reuse
Highway discharges and controls; gully design
sewer designQuality
Identifiedthreat
Likelihood of Occurrence Level of Consequence Likelihood of Occurrence Level of Consequence Risk score
Within the next 5 years
Score Within the next 5 years
Score In 25-30 yrs time Score In 25-30 yrs time Score Within the next 5 yrs
In 25-30 yrs time
Increased flooding
- Surchargingof surface water Sewers from combined system during extreme (>1:10RI) events- Increasedand more frequentsummer storm intensities
Backing up
3 - Flood riskconsequences are currently minimal given channelled depth of the Rea and extent of urban dereliction within the Eastside floodplain area.
1/2 - Introductionof upstream flood controls will help to reduce downstream flood occurrence
- Works onflood control employing upstream detention basins;
2 - Reduction in frequency and volume of CSO spillages
- Dwellings relocated from high risk areas; increased flood resilient building
2 3 - 6Level of risk: low to medium
4Level of risk: low
BIRMINGHAM EASTSIDE FLOOD RISK ASSESSMENT
- Backing-up of surface wateroutfalls/drains byriver flooding- Increased likelihood of pluvialsurface water flooding with exceedance flows- Ageingsewer infrastructure; insufficient hydraulic capacity- No recordof surface floodingfor Eastside area and July 2007 floods (>1:80-60 RI) did not seriously impact
- Floodnuisance to localtraffic and pedestrianmovement
- Routing of overland exceedance flows (storms >1:30RI) along street and gutter pathways
- Blockage and damage tosurface water outfall flaps
- Blockage of gullies and surface
control target stated as 50-year return period.
- Reduction in CSO spillages resulting from rehabilitation and repair drainage asset planning (DAP) programmes
- Increasedl ikelihood of flood potential with climate change, urban creep and ageing sewer infrastructure
- Increased land and property values following development
10 – 15Mediumto Highon the surface water
drainage system. - High level ofservice protection (>M75-60 event) provided by deep, culverted Rea channel- Urban creepand re-development extending impermeable surfacearea.
drains due to low cleaning frequencies
to HighPluvialflooding
6 – 8Low to
MediumPluvial
flooding

6
River Rea channel near Custard Factory
River Rea channel near Deritend viaduct
M80-60 extreme pluvial exceedance flood
event in Eastside
M5-60 STORM EVENT SURFACE SEWER SURCHARGING
7
Identified threat
Likelihood of Occurrence Level of Consequence Likelihood of Occurrence Level of Consequence Risk score
Within the next 5 years
Score Within the next 5 years
Score In 25-30 yrs time Score In 25-30 yrs time Score Within the next 5 yrs
In 25-30 yrs time
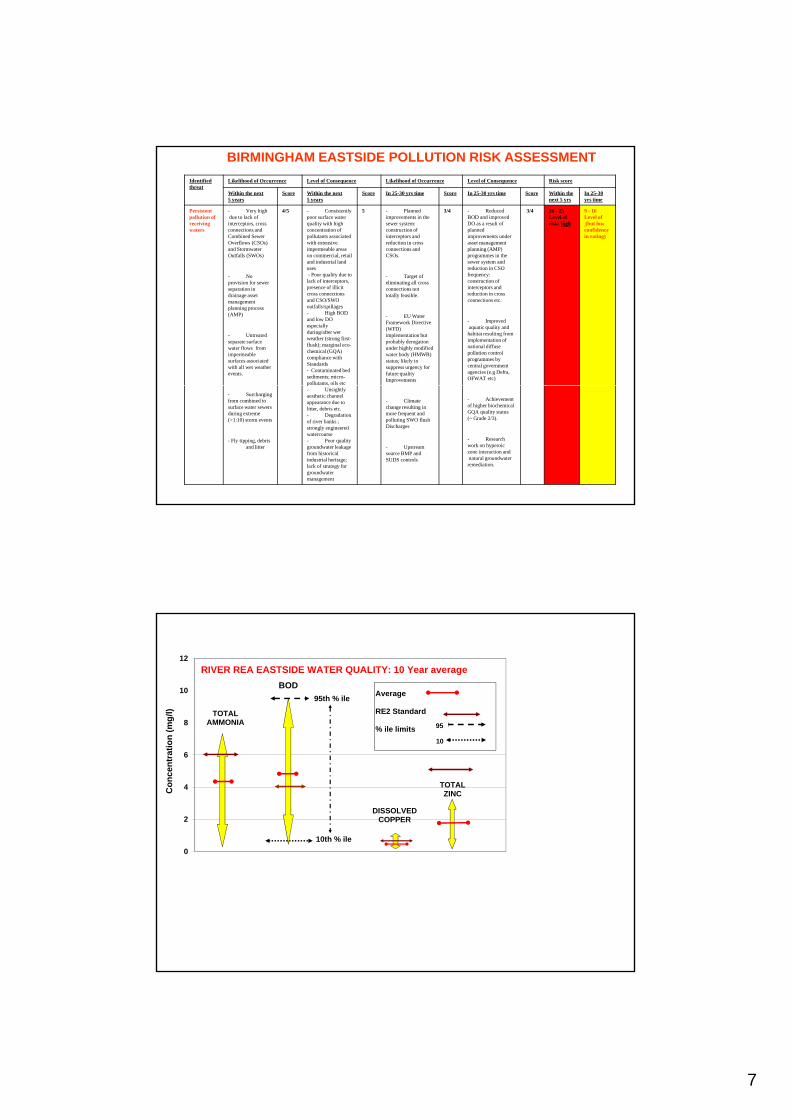
Persistent pollution of receiving waters
- Very highdue to lack of interceptors, cross connections and Combined Sewer Overflows (CSOs) and Stormwater Outfalls (SWOs)
4/5 - Consistently poor surface water quality with high concentration of pollutants associated with extensive impermeable areas on commercial, retail and industrial land
5 - Planned improvements in the sewer system: construction of interceptors and reduction in cross connections and CSOs.
3/4 - Reduced BOD and improved DO as a result of planned improvements under asset management planning (AMP) programmes in the sewer system and
3/4 20 - 25 Level of risk: high
9 - 16Level of (but low confidence in rating)
BIRMINGHAM EASTSIDE POLLUTION RISK ASSESSMENT
- No provision for sewer separation in drainage asset management planning process (AMP)
- Untreated separate surface water flows from impermeable surfaces associated with all wet weather events.
uses - Poor quality due to lack of interceptors, presence of illicit cross connections and CSO/SWO outfalls/spillages- High BOD and low DO especially during/after wet weather (strong first-flush); marginal eco-chemical (GQA) compliance with Standards- Contaminated bed sediments; micro-pollutants, oils etc
- Target of eliminating all cross connections not totally feasible.
- EU Water Framework Directive (WFD) implementation but probably derogation under highly modified water body (HMWB) status; likely to suppress urgency for future quality Improvements
reduction in CSO frequency: construction of interceptors and reduction in cross connections etc.
- Improvedaquatic quality and habitat resulting fromimplementation of national diffuse pollution control programmes by central government agencies (e.g Defra, OFWAT etc)
- Surcharging from combined to surface water sewers during extreme (>1:10) storm events
- Fly tipping, debris and litter
p ,- Unsightly aesthetic channel appearance due to litter, debris etc.- Degradationof river banks ; strongly engineered watercourse- Poor quality groundwater leakage from historical industrial heritage; lack of strategy for groundwater management
- Climate change resulting in more frequent and polluting SWO flush Discharges
- Upstreamsource BMP and SUDS controls
- Achievement of higher biochemical GQA quality status (~ Grade 2/3).
- Research work on hyperoic zone interaction andnatural groundwater remediation.
8
10
12
(mg/
l)
BOD
TOTALAMMONIA
95th % ile
RIVER REA EASTSIDE WATER QUALITY: 10 Year average
Average
RE2 Standard
% ile limits 95
0
2
4
6
Con
cent
ratio
n
DISSOLVEDCOPPER
TOTALZINC
10th % ile
10
0

8
WATER QUALITY- litter- upstream CSO discharges- illicit connections- historical pollution- polluted substrates
River Rea channel at canal junction
F l St t
Walkway along Rea north of canal junction
Fazeley Street
AMENITY- restricted ecology and habitat- little public amenity- sterile channel
1D-2D PLUVIAL
EXCEEDANCE
MODELLING
SIMULATION
Extreme event impermeable surface runoff
A proportion of flow enters the minor pipe system
Minor sewer
Continued exceedance flow conveyed over the surface
River level
Surcharging of minor system when system capacity exceeded or outfall blocked
Combination of flooding from minor system and overland flow in the major system results in surface and property flooding
1D
2D
system flow Sewer continuation to downstream system and outfall
Major system: above groundMinor system; below ground
(a) T = 0.75 h (b) T = 2.00 h
(c) T = 5.50 h (d) T = 12.00 h

9
REAL TIME PLUVIAL EXCEEDANCE FLOOD MAPPING
M100:120 eventM100:120 event
Pollution hotspot operations
Small car park area retrofits
WHERE/WHAT TO RETROFIT ON-SITE???
operationsBelow ground retrofits
Individual streetsIndividual rooftops
Hardscape street conversions

10
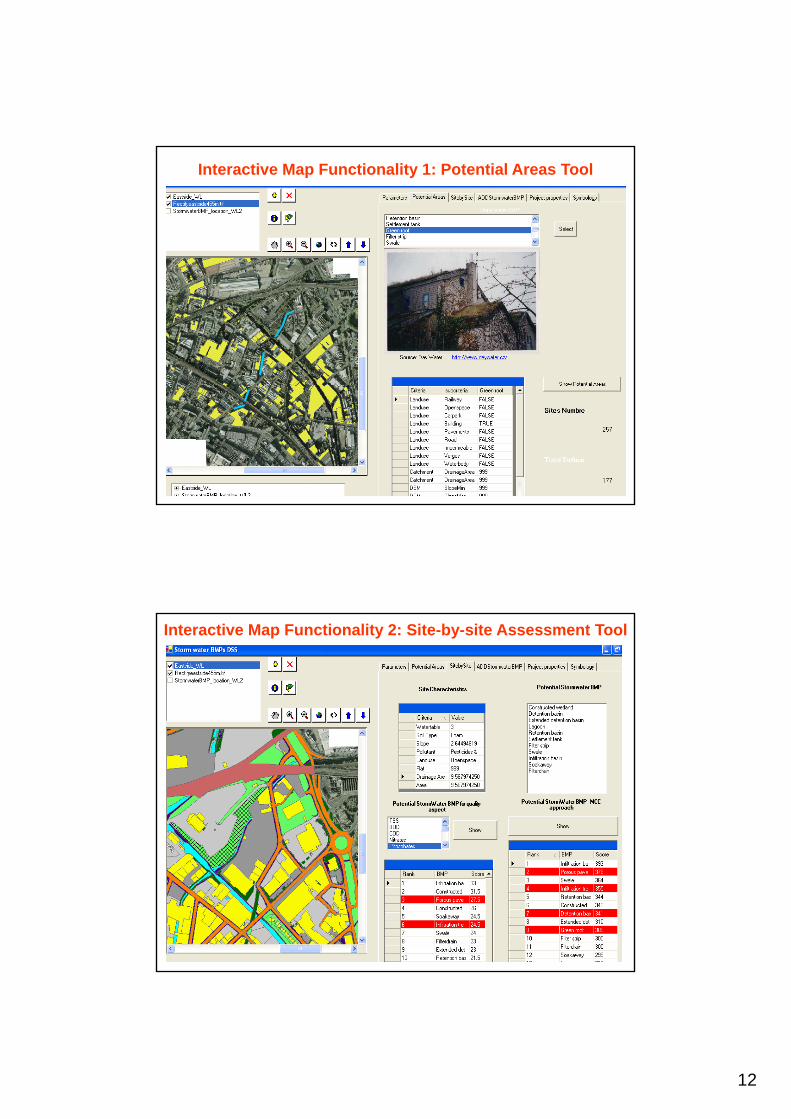
Integrates three stormwater BMP assessment components: • Site characteristics (including urban land use types)• BMP pollutant removal potential• End user preferences (multi criteria comparator)
The SWITCH Stormwater BMP Decision Support System. DSS- Interactive tool to support users in identifying appropriate BMPs and their location- Communication of information in user-friendly format - Stakeholder discussion tool for BMP decision-making
• End-user preferences (multi-criteria comparator)
GIS Interface User-Friendly Interface
BMP Assessment Component 1: Site characteristics
• Urban land use type
• Depth to groundwater • Soil type
• Slope/gradient • Contributing drainage area (rainfall-
runoff) • Presence of ‘flat’ roofs
• Default values relate BMP type to the above criteria
• Set of ‘rules’ which determine which BMP can be located at a particular site
• User able to change default settings

11
BMP Assessment Component 2: Pollutant Removal Potential
• Combination of field data and expert judgement
• Assess potential for 7 pollutant removal process to occur in range of BMPs
• Assess the potential for specific pollutants to be removed by these 7 pollutant removal processes
• Information combined to develop single unit value describing the relative potentialunit value describing the relative potential for a particular pollutant to be removed by specific BMP
• Ranking values enables a BMP pollutant-specific order of preference to be developed
BMP Assessment Component 3: Multi-criteria Comparator
• Use default scores (developed during the EU FP5 DayWater project) or
t th iuser can enter their own values • Users can apply weightings which are combined with scores to generate a BMP order of preferencepreference• Users able to assess the performance of BMPs against wide range of criteria and indicators
12
Interactive Map Functionality 1: Potential Areas Tool
Interactive Map Functionality 2: Site-by-site Assessment Tool

13
Interactive Map Functionality 3: Add BMP tool
• Basis for a user-friendly tool capable of handling data from variety of sources
• Interactive map tool supports users in identifying locations for BMPs based on site characteristics
FUTURE WORK WITH GIS DSS
BMPs based on site characteristics• List of possible BMPs can then be refined using the BMP
pollutant removal tool and/or the multi-criteria comparator tool
• Within SWITCH, this stormwater BMP DSS will be:– integrated with a hydraulic stormwater model for
identification of exceedance flow routes, velocities and ponding depths
– trialled within Birmingham, Belo Horizonte, Lodz, and the Emscher region of Germany

14
STORMWATER RISK MANAGEMENTrequires
• pluvial exceedance flood risk maps for extreme events—preferably in real time (flow routes, velocities, depths, ponding locations)
• fluvial flood (and pollution) risk maps for extreme events—based on 1D/2D sewer and river channel modelling.
• identification of vulnerability and exposure to both pluvial and fluvial flooding/pollution
• assessment of consequences e.g depth/damage curves; habitat damage etc.
• identification of mitigating controls and appropriate management approaches
Need to clarify limits of the modelling and management approaches/tools prior to attempting any integrated, holistic management decision-making framework
SWITCH WP2 STORMWATER RISK ASSESSMENT & MANAGEMENT
• Development and trialling of risk assessment methodology for flood andassessment methodology for flood and pollution management (contemporary and city-of-the-future)
• Developing GIS-based modelling tool for identifying and mitigating real time flood and pollution risksand pollution risks
• User-friendly methodologies intended to support stakeholder decision-making process for surface water infrastructure