Embed Size (px)
Citation preview
Apprenticeship Evaluation: Employers
1
BIS RESEARCH PAPER NUMBER 204
Apprenticeships Evaluation: Employers
DECEMBER 2014

Apprenticeship Evaluation: Employers
The views expressed in this report are the authors’ and do not necessarily reflect those of the Department for Business, Innovation and Skills.
Department for Business, Innovation and Skills
1 Victoria Street
London SW1H 0ET
www.gov.uk/bis
Research paper number 204
December 2014
2
Apprenticeship Evaluation: Employers
Contents Contents ........................................................................................................................................ 2
About the Ipsos MORI authors .................................................................................................... 5
Summary ....................................................................................................................................... 6
1. Introduction ......................................................................................................................... 12
Policy context ............................................................................................................................ 12
Aims of the research ................................................................................................................. 14
Methodology ............................................................................................................................. 14
2. What do Apprenticeship employers look like? ................................................................. 16
2.1 Size and sector profile ......................................................................................................... 17
2.2 General profile ..................................................................................................................... 18
2.3 Frameworks provided .......................................................................................................... 20
2.4 Apprentice numbers ............................................................................................................ 21
2.5 The Apprenticeship offer ..................................................................................................... 23
2.6 How long have employers been offering Apprenticeships? ................................................. 26
3. Taking on apprentices ........................................................................................................ 28
3.1 Recognition that employees are doing Apprenticeships ...................................................... 28
3.2 Knowledge about Apprenticeships ...................................................................................... 30
3.3 Information, support and guidance available ....................................................................... 31
3.4 Recruitment patterns ........................................................................................................... 33
4. Employer influence on and involvement in Apprenticeship delivery .............................. 38
4.1 Employers’ and providers’ involvement in Apprenticeship delivery and assessment ........... 39
4.2 Employers’ influence on Apprenticeship training ................................................................. 41
4.3 What drives employer involvement in the Apprenticeship training they are offered? ............ 47
3

Apprenticeships Evaluation 2014: Employer Report
5. Apprenticeship completion, retention and progression................................................... 56
5.1 Completion and non-completion .......................................................................................... 56
5.2 Retention ............................................................................................................................. 58
5.3 Progression to Higher Apprenticeships and other qualifications at Level 4 and above ......... 61
6. Employer satisfaction with Apprenticeships .................................................................... 64
Overall satisfaction with Apprenticeship training ........................................................................ 65
Aspects of satisfaction .............................................................................................................. 67
Do employers recommend Apprenticeships as a form of training? ............................................ 73
7. Impacts of Apprenticeships ............................................................................................... 75
Extent of other Level 2 and 3 training offered ............................................................................ 76
Why use Apprenticeship training versus other forms of training? .............................................. 78
Perceived benefits of Apprenticeships and whether these are realised ..................................... 82
8. Current apprentices and future plans ................................................................................ 87
Current apprentices ................................................................................................................... 88
English and maths provision offered to current apprentices ...................................................... 91
Paying fees for Apprenticeships ................................................................................................ 93
Future plans .............................................................................................................................. 95
9. Conclusions ........................................................................................................................ 99
Appendices ............................................................................................................................... 102
4
Apprenticeship Evaluation: Employers
About the Ipsos MORI authors
Dr. Matt Colahan is a Research Manager at Ipsos MORI who joined from the University of
East London. Matt worked on the 2013 Apprenticeship employer survey and has also
conducted studies exploring employer involvement in Apprenticeships. He is currently
evaluating the impacts of poor English and maths skills on employers, for BIS; and the
impacts of various employer-led training initiatives, for the UK Commission for
Employment and Skills.
Claire Johnson is a Research Director specialising in employment and skills research,
with 17 years’ experience gained at Ipsos MORI, the Institute for Employment Studies, and
the Institute for Employment Research. Claire directed qualitative research following up
the 2013 apprentice employer survey, to explore the barriers and enablers to greater
employer influence on Apprenticeships. Her main research interests lie in young people’s
transitions into the labour market, barriers and enablers to employment, and the evaluation
of government training and employment initiatives.
5
Apprenticeships Evaluation 2014: Employer Report
Summary This report presents the findings of the employer survey component of the 2013-14
Apprenticeship evaluation. The survey explored the views and experiences of 4,030
employers whose employees had finished an Apprenticeship between August 2012 and
March 2013. This survey builds on the findings of the 2013 apprentice employer survey
and on qualitative follow-up research on the barriers and enablers to employer influence in
Apprenticeships.
In light of the ongoing public investment in Apprenticeships and the reforms being made to
the current system, it is critical for policymakers and those engaged in delivery to know
more about how far Apprenticeships meet learners’ and employers’ needs, and to be able
to identify which aspects of the programme are under-performing. This research will inform
BIS and the SFA’s strategies to ensure continual improvement and return on investment,
as well as the ongoing implementation of the Apprenticeship reforms.
The profile of apprentice employers The profile of apprentice employers is very similar to that found in 2013. Provision is
concentrated in five framework areas: Business, Administration & Law; Health, Public
Services & Care; Retail & Commercial Enterprise; Engineering & Manufacturing
Technologies; and Construction, Planning & Built Environment. Workplaces tended to
have provided only one Apprenticeship framework.
Most apprentices (62%) were employed in small workplaces with less than 50 staff, with a
similar proportion (59%) in workplaces that were part of a larger organisation, typically a
branch or site rather than a Head Office. Irrespective of organisation size, decisions about
Apprenticeship recruitment were generally made at site level.
Most workplaces had only one (60%) or two (18%) apprentices who had finished their
training during the reference period. Workplace and organisation size were strong
determinants of apprentice numbers. Employers providing more traditional frameworks
had fewer apprentices, partly reflecting their generally smaller size.
Around two-thirds of employers (68%) had provided Level 2 frameworks and around half
of them (51%) had provided Level 3 (18% provided both). The proportion providing Level
3 has increased slightly compared with 2013. Employers providing Retail & Commercial
6

Apprenticeship Evaluation: Employers
Enterprise predominantly provided Level 2, while Level 3 was more common amongst
employers providing Health, Public Services & Care.
Employers providing more traditional frameworks were the most likely to have offered
Apprenticeships to young people aged 16-18. The proportion offering Apprenticeships to
16-18s has declined slightly since 2013, with correspondingly more employers offering
Apprenticeships to 19-24s and people aged 25+. The latter were more common amongst
employers providing Health, Public Services & Care frameworks.
Taking on apprentices There is continuing evidence that the concept of ‘Apprenticeships’ resonates less with
those employers providing less traditional frameworks and to people in older age groups.
Only six in ten employers were aware that the training they had provided was an
Apprenticeship, which fell to around four in ten (37%) of those who had drawn their
apprentices from existing staff (a reduction since 2013).
In terms of self-reported knowledge, seven in ten employers (71%) felt they knew a ‘great
deal’ or ‘fair amount’ about Apprenticeships. Knowledge was highest among large
workplaces with 100+ staff and, linked to this, among employers with higher volumes of
apprentices who employed apprentices across multiple levels, Frameworks, and age
ranges. There was also a strong link between knowledge of Apprenticeships and whether
employers had influenced or wanted to influence the training (a key element of the current
Apprenticeship reform programme).
Employers were split fairly evenly by the method that they used to recruit apprentices: 48%
recruited from existing staff and 46% recruited externally with only a small proportion using
both approaches. Recruitment approach was strongly influenced by framework(s)
provided, with a clear distinction between employers providing ‘traditional’ Apprenticeships
(who were more likely to recruit specifically) and those providing newer frameworks, who
more likely to recruit from existing staff. Younger apprentices were more likely to have
been recruited specifically, as were those working for smaller organisations and in
workplaces with only one apprentice.
At workplaces where there was specific recruitment to Apprenticeship positions, the
tendency was to use fixed-term contracts, and for apprentices to be recruited to new
positions rather than as replacement demand for staff who were leaving. By contrast, the
7

Apprenticeships Evaluation 2014: Employer Report
majority of employers who recruited internally said this was primarily to improve
employees’ skills in their existing jobs, rather than to prepare for a new job role.
The importance of employer influence Like last year, only half of employers (49%) who had received provider training said they
were able to influence the structure, content, delivery and duration of the Apprenticeship
before it started, while 58% said they were able to influence the training during the
Apprenticeship. Of those who had no influence, around a quarter (26%) said they did not
want any. Larger workplaces and those who knew more about Apprenticeships were more
likely to have had any influence over the training they received.
Around one third of employers who did not get any influence said they wanted some (35%)
an increase since 2013 (29%). Smaller workplaces were more likely than larger ones to
have wanted influence but not been able to get it.
Just over a quarter of employers (28%) said that they would have liked to have changed
something about the content, structure, delivery or duration of their Apprenticeship
training. Of these, 60% had asked the training provider to make changes but 40% had not.
CHAID analysis demonstrated that agreement with statements “We know who to speak to
about making changes to the Apprenticeship training we get” and “Our training provider
would adapt the Apprenticeship if we asked them to” were most predictive of employers’
decisions to ask for change if they wanted it, underlining the importance of the employer-
provider relationship.
Employer satisfaction with Apprenticeships Overall, 80% of apprentice employers were satisfied with their main Apprenticeship
programme (scoring it 6 out of 10 or higher). Three in five (62%) rated it at 8 out of 10 or
more, including one in three (32%) who gave it an especially high rating (a score of 9 or
10), indicating they were very satisfied. Last year these figures were similar: 60% rated
their main Apprenticeship at 8 out of 10 or above, including 30% scoring it 9 or 10.
As in 2013, overall satisfaction varied by employer size and main framework. Those
providing the Health, Public Service & Care framework as their main Apprenticeship were
significantly more likely to be very satisfied than employers nationally (68%), and more so
than in 2013 (60%). In contrast, and as found in 2013, employers whose main framework
8

Apprenticeship Evaluation: Employers
was Construction, Planning & Built Environment or ICT were less likely than average to be
‘very satisfied’.
High levels of overall satisfaction were also linked to employers’ reported levels of
influence over the Apprenticeship programme. Just a quarter of employers who had no
influence but wanted some were ‘very satisfied’ (23%), compared with three-quarters
(74%) of those who had influence before and after the training started.
Looking into satisfaction with various aspects of the Apprenticeship programme,
employers were most satisfied with the quality of the training and assessment, together
with the flexible way these were offered by their training provider. As in 2013, they were
least satisfied with their ability to influence the content, structure or duration of the
Apprenticeships, and with the quality of applicants.
Like last year, 35% of employers said they would recommend Apprenticeships without
being asked, however there was a drop (from 47% to 44%) in those who said they would
do so if asked. Thus, this year there was a high overall ‘recommendation score’ of 79%,
but this was below last year’s score of 82%. Those who wanted influence and did not
have any were significantly less likely to recommend without being asked (24%), and more
likely to be neutral or to recommend against if asked.
The benefits of Apprenticeships Employers who were aware that at least some of their trainees had been doing an
Apprenticeship were asked why they had opted for Apprenticeships, relative to other forms
of training available to them. Business relevance was the most common reason
(mentioned by 25%) while the least common was that Apprenticeships were low cost or
free (mentioned by 13%).
Different reasons for providing Apprenticeships were associated with different levels of
overall satisfaction. Employers who offered Apprenticeship training because they
considered it to be the best way of improving recruitment and retention or the most
relevant form of training to their business were more likely than others to be very satisfied
(71% and 69% respectively).
These reasons for providing Apprenticeships were reflected in anticipated and achieved
benefits. Maintaining or improving future skill levels in the business was the most
9
Apprenticeships Evaluation 2014: Employer Report
commonly anticipated benefit (95%), followed by improving product/service quality and
improving productivity (selected by over 80% of employers).
Almost nine in ten employers who had hoped for benefits received them, with the most
‘successful’ being ‘improving staff morale’ (91% of those hoping to achieve this said it was
realised), improving or maintaining future skills levels (89%), improving productivity (89%)
and improving product or service quality (86%). In contrast, the benefits which employers
felt were least realised (though still accounting for a majority of those expecting them)
were ‘winning business’ (73% of employers hoping to achieve this say it was realised), and
‘ability to attract good staff’ (79%) – both of which were in line with 2013.
Apprentice completion, retention and progression beyond Level 3 Almost eight in ten employers (78%) said that all of their apprentices who finished their
Apprenticeship between 1st August 2012 and 31st March 2012 had completed their
Apprenticeship, similar to last year. As with last year, employers offering the Health,
Public Service & Care framework were significantly more likely (82%) to have had all their
apprentices complete: these employers were more likely to have provided Apprenticeships
to existing staff, and (related to this) those aged 25+. Relative to the national profile
significantly more employers had all their apprentices complete where they were able to
influence the Apprenticeship before and during training.
Two-thirds (65%) of employers said that all of their apprentices who finished training
between August 2012 and March 2013 were still working for them at the time of the survey
(a year to 18 months later). Thirteen per cent stated that some of their apprentices were
still with them, whilst a fifth (20%) said that their apprentices had all left. This pattern is
similar to 2013. Retention is higher among those who deliver Apprenticeships to existing
staff, and to staff aged 25+.
Of those who had Level 3 apprentices complete their training in the reference period, over
half (54%) said they offered some form of progression to higher level qualifications, and
one in four (24%) had apprentices who had gone on to study these. Offering higher level
qualifications to Level 3 completers was motivated mainly by workforce development and
staff retention strategies, together with a considerable minority who offered them
specifically to enable staff to move into management positions. Among employers who did
not offer their Level 3 completers any training that led to higher-level qualifications, the
10
Apprenticeship Evaluation: Employers
main reasons were ‘no demand / need’, ‘financial constraints’, and ‘lack of knowledge’
about what to offer.
Current and future involvement in Apprenticeships Similar to 2013, three in five employers (59%) had current apprentices at the time of the
survey. Amongst those without current apprentices, the majority said that they planned to
continue their involvement with the Apprenticeship programme (59%) or were reviewing it
(22%). This is consistent with 2013 and indicates that, in most cases, the lack of current
apprentices was a temporary gap rather than a decision to discontinue with
Apprenticeships altogether.
As in 2013, the majority of employers (79%) are committed to the Apprenticeship
programme and plan to continue to offer Apprenticeships. One in six (12%) were currently
undecided or were reviewing their involvement and only nine per cent were not planning to
continue. Although still a minority, this represents a small but significant increase since last
year and appears to be driven by a rise among small employers (where the proportion who
do not plan to offer more Apprenticeships was up from 9% to 13%).
Length of involvement with the programme and size of organisation were important
determinants of the likelihood of future involvement (with larger organisations more
committed). By framework, those employers providing more traditional Apprenticeships
such as Construction, Planning and Built Environment and Engineering & Manufacturing
Technologies were slightly less likely to be committed to the programme in future (as in
2013). Importantly for the Apprenticeship reforms that are currently being implemented to
increase employer involvement, those who got all the influence they wanted were more
likely that those who wanted influence but did not get any to be committed to offering
Apprenticeships in future (83%, compared with 70%).
Overall, more employers projected that the number of apprentices they employ in future
would expand rather than contract. In total, 26% expected to provide more Apprenticeship
places than they had done in the past, compared to 13% who expected to offer fewer (or
would not offer any at all).
11

Apprenticeships Evaluation 2014: Employer Report
1. Introduction This report presents the findings of the Apprenticeship Evaluation Employer Survey 2013-
14. The survey explored the views and experiences of 4,030 employers whose employees
finished an Apprenticeship programme between August 2012 and March 2013. It builds
on the findings of the previous survey undertaken by Ipsos MORI in 2013 and on
qualitative follow-up research, also by Ipsos MORI, conducted on the barriers and
enablers to employer influence on Apprenticeships.
Policy context
Expanding and improving Apprenticeships are key components of the ambition to develop
a more flexible and better educated workforce, outlined in the Coalition’s Plan for Growth1.
Aligned with this, it is one of BIS’ strategic priorities to build a more internationally
competitive skills base and to promote more opportunities for individuals to realise their
potential. Apprenticeships are also a vital component of the education-to-work transition
routes available to young people, especially with the advent of raising the compulsory
participation age to 17 in 2013 and 18 in 2015. Accordingly, the BIS Business Plan for
2012-2015 includes a priority to expand and improve the quality of the Apprenticeship
programme including by creating 40,000 additional adult Apprenticeship places focusing
on the young unemployed; creating 10,000 additional advanced and Higher
Apprenticeships; and implementing ways to make Apprenticeships more accessible to
Small and Medium Sized Enterprises (SMEs)2.
In Investing in Skills for Sustainable Growth3, BIS commits to streamlining the FE and
skills landscape to make it more flexible and responsive to the needs of learners and
businesses, essentially shifting the balance further towards a demand-led rather than
supply-driven system. Recent reviews of the role, delivery and assessment of
Apprenticeships by the entrepreneurs Jason Holt4 and Doug Richard5 have reinforced the
move towards a more demand-driven approach. Richard recommended:
1 HMT and BIS (2011) The Plan for Growth. 2 BIS (2012) Departmental Business Plan 2012-2015. BIS. London. 3 BIS (2010) Investing in Skills for Sustainable Growth. BIS. London. http://www.bis.gov.uk/assets/biscore/further-education-skills/docs/s/10-1272-strategy-investing-in-skills-for-sustainable-growth.pdf 4 Holt, J. (2012), Making Apprenticeships More Accessible to SMEs. BIS. London. https://www.gov.uk/government/news/support-for-small-businesses-in-taking-on-Apprenticeships
12
Apprenticeship Evaluation: Employers
• Targeting Apprenticeships at those who are new to a job role or role that requires
sustained and substantial training;
• Focusing on what the apprentice can do when they complete their training and
freeing up the process by which they get there;
• The basis of every Apprenticeship should be recognised industry standards;
• Every apprentice being able to reach a good level in English and maths before they
complete their Apprenticeship;
• Government funding that incentivises investment in Apprenticeship training by
giving purchasing power to employers; and
• Greater diversity and innovation in training.
Similarly, the Holt Review recommends rebalancing ‘purchasing power’ to allow small and
medium enterprises (SMEs) to exert greater control on the supply-side of Apprenticeship
provision. The UK Commission for Employment and Skills (UKCES) has recently launched
a second round of its Employer Ownership Pilot, through which employers in England can
access direct funding from government to design and deliver their own training, of which
Apprenticeships form a major part.
In 2013, BIS published Rigour and Responsiveness in Skills6 which took on board many of
the recommendations made by Holt and Richard, setting out six areas to improve the
infrastructure of government-funded skills training, including: raising standards; creating
Traineeships to help transition young people into the workplace; creating more meaningful
and rigorous qualifications; using funding to incentivise greater responsiveness in
provision; and equipping individuals and employers with better information to make more
effective choices. The new Apprenticeship reform programme7 addresses the issues
raised by Richard and Holt in the following ways:
5Richard, D. (2012), The Richard Review of Apprenticeships. BIS. London. https://www.gov.uk/government/publications/the-richard-review-of-Apprenticeships 6 BIS (2013) Rigour and Responsiveness in Skills. BIS. London. 7 BIS (2013). The Future of Apprenticeships in England: Implementation Plan. BIS, London. https://www.gov.uk/government/uploads/system/uploads/attachment_data/file/253073/bis-13-1175-future-of-Apprenticeships-in-england-implementation-plan.pdf
13
Apprenticeships Evaluation 2014: Employer Report
• It puts employers in control – leading the design of new Apprenticeship standards
in their sectors.
• It aims to improve quality – assessment will be rigorous and synoptic8, focused at
the end of the Apprenticeship, and graded.
• It seeks to simplify the system – the new standards will be concise and easy for
both employers and learners to understand, encompassing the core skills and
knowledge that are required to be fully proficient in a particular occupation.
Alongside the reforms, BIS have announced the creation of a number of employer-led
Trailblazers for the new Apprenticeship process, focusing in high-growth and strategically
important industry sectors. The aim is to give employers the opportunity to lead the
development of new Apprenticeship standards in their sector as well as to develop the
high-level assessment approaches that will be used to test them. While Phase 1
encompassed traditional industries and high-technology manufacturing sectors, the Phase
2 Trailblazers extend to a broader range of sectors and occupations including service
industries and access to the professions. Phase 3 began in September 2014.
Aims of the research
The Apprenticeship evaluation comprises two extensive surveys of employers and
apprentices, building on a baseline first undertaken in 2011-12 and then repeated in 2013.
In light of the ongoing public investment in Apprenticeships and the reforms being made to
the current system, it is critical for policymakers and those engaged in delivery to know
more about how far Apprenticeships meet learners’ and employers’ needs, and to be able
to identify which aspects of the programme are under-performing. The research will inform
BIS and the SFA’s strategies to ensure continual improvement and return on investment,
as well as the on-going implementation of the Apprenticeship reforms.
Methodology
Ipsos MORI conducted a telephone survey with 4,030 employers whose staff had finished
an Apprenticeship programme between 1 August 2012 and 31 March 2013. The survey
fieldwork took place between the end of January and the end of March 2014. In-scope
8 Synoptic assessment encourages students to combine learning from different parts of a programme and to apply their skills in a way that demonstrates this accumulated knowledge and understanding.
14
Apprenticeship Evaluation: Employers
employers were identified using the Individualised Learner Record (ILR) which contains a
flag to identify the employer for each apprentice. The list of in-scope employers was then
matched to the Blue Sheep database to append employers’ telephone numbers,
addresses, and other ‘firmographic’ information such as industry and number of
employees (which was verified and updated during the interview if necessary). Information
on Apprenticeship frameworks, levels and numbers of in-scope apprentices were derived
and appended for each employer and these variables were also used to stratify the sample
prior to selection.
The sample was disproportionately stratified by framework and number of apprentices to
enable separate analysis for employers with large volumes of apprentices and for smaller
frameworks. The data has been weighted to be representative of all employers whose
employees finished their Apprenticeship during the reference period. More details on the
methodology can be found in the Appendices to this report.
15
Apprenticeships Evaluation 2014: Employer Report
2. What do Apprenticeship employers look like?
Key findings
The profile of apprentice employers is very similar to that found in 2013. Apprentices
are disproportionally concentrated in the same industrial sectors as last year. Similarly,
provision is concentrated in five framework areas: Business, Administration & Law;
Health, Public Services & Care; Retail & Commercial Enterprise; Engineering &
Manufacturing Technologies; and Construction, Planning & Built Environment.
Frameworks in Business, Administration & Law were provided by employers in all
sectors, possibly reflecting a more universal need for these skills. Workplaces tended
to have provided only one Apprenticeship framework.
Most apprentices (62%) were employed in small workplaces with less than 50 staff,
with a similar proportion (59%) in workplaces that were part of a larger organisation,
typically a branch or site rather than a Head Office. Irrespective of organisation size,
decisions about Apprenticeship recruitment were generally made at site level.
Most workplaces had only one (60%) or two (18%) apprentices who had finished their
training during the reference period. Workplace and organisation size were strong
determinants of apprentice numbers. Employers providing more traditional frameworks
had fewer apprentices, partly reflecting their generally smaller size.
Around two-thirds of employers (68%) had provided Level 2 frameworks and around
half (51%) had provided Level 3 (18% provided both). The proportion providing Level 3
has increased slightly compared with 2013. Employers providing Retail & Commercial
Enterprise predominantly provided Level 2, while Level 3 was more common amongst employers providing Health, Public Services & Care.
The proportion of employers providing Apprenticeships to 16-18 year olds has declined
compared with 2013, from 71% to 65%. The most frequently cited reason (mentioned
by 36% of employers not offering Apprenticeships to this age group) was that they
cannot employ under-18s in their line of work (an increase from 29% last year).
16
Apprenticeship Evaluation: Employers
2.1 Size and sector profile
This chapter provides a ‘firmographic snapshot’ of employers who had apprentices who
finished their Apprenticeship between 1st August 2012 and 31st March 2013. The size and
sector profile of employers offering Apprenticeships is (perhaps unsurprisingly) almost
identical to that of last year’s employer survey9.
Industry sector As in 2013, the vast majority (79%) of employers are private sector organisations. The
remainder are fairly evenly split between the public sector (11%) and the voluntary sector
(9%).
At a more detailed level, apprentice employers are concentrated in a relatively small
number of industries. Like 2013, the most common are: ‘Human health and social work’
(23%); ‘Wholesale and retail’ (14%); ‘Accommodation and food’ (10%); ‘Other Services’
(9%) and ‘Construction’ (9%).
Similar to last year, the ‘Human health and social work’ sector continues to represent a
disproportionately high proportion of employers who have apprentices, as the sector
accounts for only 6% of employers in England as a whole (although a higher than average
proportion of employers in this sector were not aware that their employees were doing
Apprenticeships). In contrast, the sectors which continue to be under-represented in the
provision of Apprenticeships relative to their national profile are ‘Information and
communication’ (2% of apprentice employers compared with 6% nationally);
‘Transportation and storage’ (2% compared with 6%); ‘Administrative and support service
activities’ (3% compared with 8%); and ‘Professional, scientific and technical activities’
(who represent 4% of apprentice employers compared with 14% of employers nationally).
Employer structure and size Just over half (55%) of apprentice employers were single site organisations. The
remainder were multiple-site organisations with 34% operating as a branch and 11%
functioning as the Head Office. This differs slightly from 2013, when there was a higher
proportion of Head Offices (15%) and correspondingly fewer branches (30%).
9 https://www.gov.uk/government/uploads/system/uploads/attachment_data/file/230001/bis-13-1125-Apprenticeships-evaluation-employer.pdf
17

Apprenticeships Evaluation 2014: Employer Report
The size profile of apprentice employers was very similar to last year. In terms of
individual workplace size, two-thirds had less than 25 employees, with nearly a fifth (19%)
having fewer than five employees. Looking at the size of the whole organisation10 the
profile again mirrors last year. Nearly half (48%) of apprentice employers were
organisations with 1 to 24 employees, whilst nearly a third (31%) had more than 100
employees (Figure 1).
Figure 1: Profile of apprentice employers by worksite and organisation size
2.2 General profile
In this year’s survey, new questions were asked about apprentice employers’ recruitment,
their outlook for the next 12 months, and their product market.
Recruitment Over a quarter (26%) had expanded their staff numbers over the past 12 months. In
contrast, 14% had experienced a drop in staffing. Whilst the majority of employers (59%)
said that their size had remained about the same over the past 12 months, most (88%)
reported that they had recruited somebody within the past two to three years.
10 For multi-site organisations we take the combined employee total of all worksites. Naturally, for single-site employers, the size of ‘workplace’ and ‘organisation’ are the same.
19%
18%
30%
17%
8%
5%
2%
2%
1 to 4 employees
5 to 9
10 to 24
25 to 49
50 to 99
100 to 249
250 to 499
500 or more
Base: All (4030)
31%
18%
48%
25 to 99 employees
100+ employees
Size of all worksites Size of all organisations
1 to 24 employees
18

Apprenticeship Evaluation: Employers
Around two-thirds (68%) of recruiting employers had taken on someone who was starting
their first job after leaving school, college or university. In contrast, 30% of recruiting
employers had only hired individuals with previous work experience. These figures were
mirrored in the age of the recruits, with 67% of employers saying they had recruited
someone under the age of 25, and 30% indicating that they had only hired people older
than 25. Recruitment of apprentices who were starting their first job was significantly more
common for employers providing frameworks in Agriculture, Horticulture & Animal Care
(75%) or Engineering & Manufacturing Technologies (75%). In contrast, employers
providing the Health, Public Services & Care framework area were significantly less likely
to have taken on someone to their first job straight from school, college or university
(64%), reflecting the older age profile of staff within that sector.
Market and growth outlook The majority of apprentice employers operated locally (55%) or within a specific region
(14%) (Figure 2). Private sector companies were largely confident about the next 12
months, with most (66%) expecting their business to grow. Employers who operated only
in local markets were much less likely to expect growth (12%) and much more likely to
predict that their business would remain about the same (36%). This is not necessarily a
negative, however, as many local companies may be small businesses who are not
looking to expand.
Figure 2: Market and growth outlook among apprentice employers
9%
10%
11%
14%
55%
Regionally
Nationally
Within UK
Internationally
Base: All 4030; All Private Sector employers 3119
Locally19%
47%
29%
2%1%
Grow significantly
Grow slightly
Remain the same
Contract slightly
Contract Significantly
Private Sector Confidence for the next 12 monthsOperating markets for all organisations
19
Apprenticeships Evaluation 2014: Employer Report
2.3 Frameworks provided
Data on which frameworks employers had provided was taken from administrative records
in the ILR and verified during the interview. This reflected the fact that some employers do
not recognise that the training their staff are doing is an Apprenticeship (discussed in more
detail in Section 3.1).
Similar to last year, the vast majority of employers (90%) with apprentices who finished
between August 2012 and March 2013 offered a single framework. The 10% who offered
more than one framework had a different sector profile to those who offered a single
framework, being more likely to operate in Health (33% compared with 20%) or
Accommodation (13% compared with 8%), and significantly less likely to operate in Other
Services (3% compared with 10%) or Construction (4% compared with 9%).
The framework profile mirrors last year, with the same uneven distribution between ‘newer’
and ‘traditional’ frameworks (Figure 3). By some margin, the most common framework
continues to be Business Administration and Law (34%, compared with 32% last year).
This was again followed by two main groups:
• ‘Newer’ framework areas, each offered by more than one in five apprentice
employers:
o Retail & Commercial Enterprise, 23% (22% last year)
o Health, Public Services and Care, 22% (22% last year); and
• ‘Traditional’ framework areas, each offered by around one in ten apprentice
employers:
o Engineering and Manufacturing Technologies, 10% (11% last year)
o Construction, Planning, and Built Environment, 9% (10% last year).
As with last year, the provision of other frameworks is far lower by comparison.
Figure 3 demonstrates the relatively close match between the prevalence of all framework
areas offered, and what employers regard as their main one (as might be expected given
that most employers only offer one framework). The exception to this is ‘Business,
Administration and Law’.
20

Apprenticeship Evaluation: Employers
Figure 3: Provision of all Apprenticeship frameworks and identification of ‘main framework’
Figure 3 shows that the prevalence of the Business, Administration and Law framework
overall exceeds the extent to which it is considered to be the ‘main framework’. In this
sense, relative to the other frameworks, it is more likely to be viewed as a ‘secondary’ or
‘supplementary’ framework by employers. This is related to the more ‘universal’ nature of
business and administrative skills which are often required –albeit to a lesser extent -
across a broad range of more specialised sectors such as construction or health.
2.4 Apprentice numbers The majority of apprentice employers (60%) had one apprentice who finished training
between August 2012 and March 2013; 18% had two; and 18% had between three and
nine. Only 3% had 10 or more apprentices finish during the reference period. This
distribution is almost identical to 2013.
Similar to last year, larger employers were more likely to employ larger numbers of
apprentices. Those providing the more traditional frameworks of Agriculture, Horticulture &
Animal Care; Engineering & Manufacturing Technologies; and Construction, Planning &
Built Environment were more likely to employ a single apprentice (which is linked to the
smaller size profile of these employers).
28%
22%
21%
10%
8%
4%
3%
3%
2%
34%
23%
22%
10%
9%
4%
3%
3%
3%
Business, Administration & Law
Retail, Commercial Enterprise
Health, Public Services & Care
Engineering & Manufacturing Technologies
Construction, Planning & Built Environment
Other
Leisure, Travel & Tourism
Agriculture, Horticulture & Animal Care
Information & Communication Technology
Main Framework
Proportion ofemployers offeringFramework
21

Apprenticeships Evaluation 2014: Employer Report
Two variations relative to last year’s profile were the Information & Communications
Technology, and Leisure, Travel & Tourism frameworks. Across employers providing
these frameworks there were significantly more with single apprentices, and fewer with 3-9
apprentices compared to last year (see Figure 4 below).
Figure 4: Number of apprentices finishing by framework in 2012/13 and 2013/14
Of the 1,36911 employers operating as a branch, half of them (51%) had complete
autonomy over the number of apprentices they hired, 26% recommended the number
which Head Offices then approved, and 19% had the numbers set by Head Office. There
was little difference in autonomy levels, by main framework12. However, a significantly
higher proportion of employers identifying Engineering and Manufacturing Technologies as
their main framework had their apprentice numbers set by Head Office (33%), whilst
significantly more employers with a main framework of Retail & Commercial Enterprise
had complete control (59%).
11 Weighted base. 12 The framework identified by employers as the framework most relevant to their business needs.
43%42%
76%71%
69%67%
76%78%
60%45%
55%54%
46%26%
49%51%
51%55%
19%22%
14%12%
12%12%
13%10%
12%14%
20%20%
24%29%
20%19%
17%16%
30%29%
8%14%
14%15%
9%8%
19%27%
22%22%
24%39%
24%23%
26%25%
7%7%
2%3%
5%6%
2%3%
9%14%
3%4%
6%7%
6%7%
6%4%
Health, Public Services & Care
Agriculture, Horticulture & Animal Care
Engineering & Manufacturing Technologies
Construction, Planning & Built Environment
Information & Communication Technology
Retail, Commercial Enterprise
Leisure, Travel & Tourism
Business, Administration & Law
Other
One Two Three to nine More than ten
Base: All Frameworks 2013/14 (5159): Health Public Services & Care (1250); Agriculture Horticulture Animal Care (161); Engineering Manufacturing Technologies (481); Construction Planning Built Environment (310); Information Communication Technology (151); Retail Commercial Enterprise (896); Leisure Travel Tourism (180); Business, Administration Law (1554); Other (176): All Frameworks 2012/13 (5446): Health Public Services & Care (1386); Agriculture Horticulture Animal Care (266); Engineering Manufacturing Technologies (520); Construction Planning Built Environment (315); Information Communication Technology (218); Retail Commercial Enterprise (764); Leisure Travel Tourism (267); Business, Administration Law (1498); Other (230)
Bars with gradient shading are data from 2012/13 survey
22
Apprenticeship Evaluation: Employers
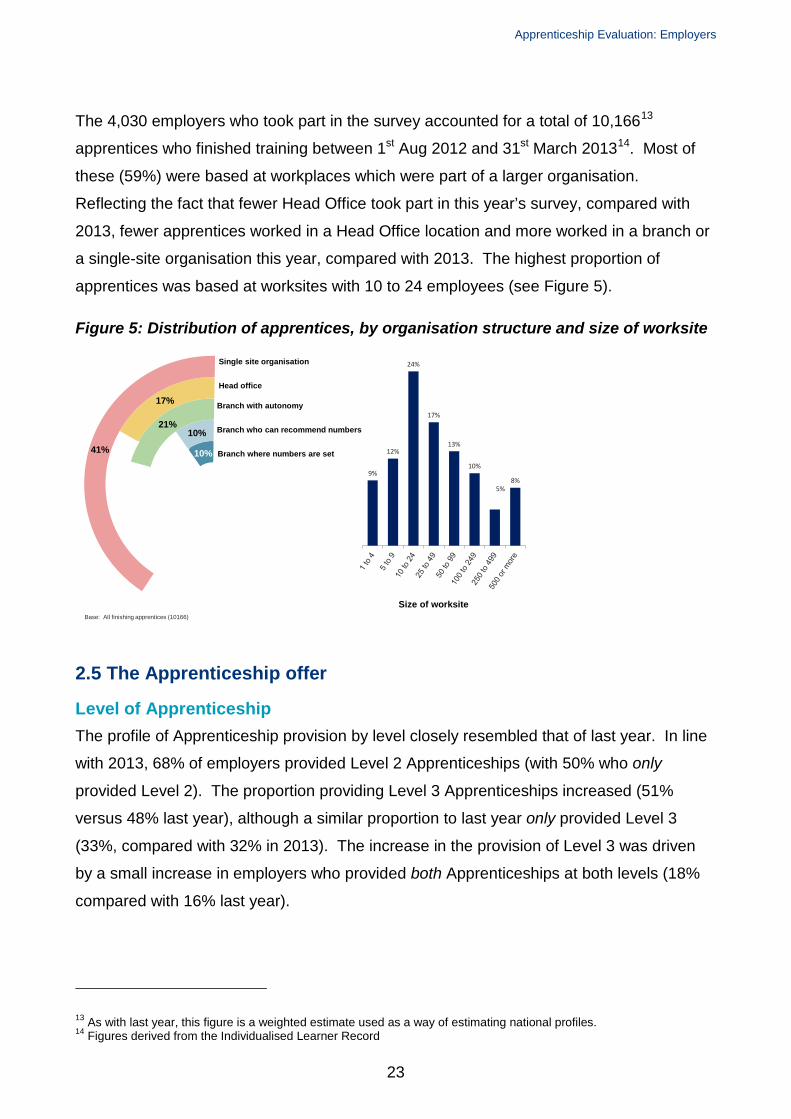
The 4,030 employers who took part in the survey accounted for a total of 10,16613
apprentices who finished training between 1st Aug 2012 and 31st March 201314. Most of
these (59%) were based at workplaces which were part of a larger organisation.
Reflecting the fact that fewer Head Office took part in this year’s survey, compared with
2013, fewer apprentices worked in a Head Office location and more worked in a branch or
a single-site organisation this year, compared with 2013. The highest proportion of
apprentices was based at worksites with 10 to 24 employees (see Figure 5).
Figure 5: Distribution of apprentices, by organisation structure and size of worksite
2.5 The Apprenticeship offer
Level of Apprenticeship The profile of Apprenticeship provision by level closely resembled that of last year. In line
with 2013, 68% of employers provided Level 2 Apprenticeships (with 50% who only
provided Level 2). The proportion providing Level 3 Apprenticeships increased (51%
versus 48% last year), although a similar proportion to last year only provided Level 3
(33%, compared with 32% in 2013). The increase in the provision of Level 3 was driven
by a small increase in employers who provided both Apprenticeships at both levels (18%
compared with 16% last year).
13 As with last year, this figure is a weighted estimate used as a way of estimating national profiles. 14 Figures derived from the Individualised Learner Record
8%5%
10%
13%
17%
24%
12%
9%
Size of worksiteBase: All finishing apprentices (10166)
10%
10%21%
17%
41%
Head office
Branch with autonomy
Branch who can recommend numbers
Branch where numbers are set
Single site organisation
23

Apprenticeships Evaluation 2014: Employer Report
Figure 6: Provision of Apprenticeship Levels 2 and 3 across all employers and by main framework15
Looking across main framework, there were some significant variations. For example,
employers providing Health, Public Services & Care (31%) or Leisure, Travel & Tourism
(24%) were more likely to provide both levels, whilst those identifying Retail & Commercial
Enterprise as their main framework were more likely to provide Level 2 only (63%).
Age of apprentices By age, the proportion of employers providing Apprenticeships to 16-18 year olds has
declined compared with 2013, from 71% to 65%. This does not necessarily mean that
fewer 16-18 year olds are doing Apprenticeships, just that relatively fewer employers are
offering them to young school or college leavers, and relatively more to older ones aged
19-24 (75% compared with 73% last year) or aged 25 and above (47% versus 45% last
year).
Nearly two-thirds of employers (63%) offered Apprenticeships to more than one age group.
Employers who offered Apprenticeships to only one age group were more likely to focus
their provision on young people aged 16-18 or 19-24 (Figure 7).
15 In last year’s survey we looked at the provision of Apprenticeship levels across all frameworks. However, we have looked at main framework this year because it is likely that an employer’s decision to offer different levels is driven by the framework which they consider most relevant to their business needs.
50%
33%
18%
68%
51%
Level 2 Level 3 Both
Offer Level
Offer this level only
18%
Base: All (4030); : Main Frameworks: Health Public Services & Care (856); Agriculture Horticulture Animal Care (99); Engineering Manufacturing Technologies (401); Construction Planning Built Environment (331); Information Communication Technology (83); Retail Commercial Enterprise (867); Leisure Travel Tourism (126); Business, Administration Law (1118); Other (149). Employer Size: 1-24 employees (2694); 25-99 (987); 100+ (327). Completions: All completed (3137); Some completions (353); No completions (415).
28%
56%
58%
51%
44%
63%
40%
55%
42%
40%
35%
33%
42%
46%
20%
36%
30%
44%
31%
9%
10%
7%
10%
17%
24%
15%
14%
Health, Public Services & Care
Agriculture, Horticulture & Animal Care
Engineering & ManufacturingTechnologies
Construction, Planning & BuiltEnvironment
Information & CommunicationTechnology
Retail, Commercial Enterprise
Leisure, Travel & Tourism
Business, Administration & Law
Other
Level 2 Only Level 3 Only Both
18%
24

Apprenticeship Evaluation: Employers
Figure 7: Provision of Apprenticeships to different age groups across all employers and all frameworks
Looking across all frameworks (Figure 7), employers providing the more ‘traditional’
subjects of Construction, Planning & Built Environment, and Engineering & Manufacturing Technologies were most likely to have taken on apprentices aged 16-18 years old. In
contrast, far fewer employers who offered Health, Public Service & Care (53%) and
Leisure, Travel and Tourism (60%) employed 16-18 year olds, favouring 19-24 year olds instead (84% and 93% respectively). Indeed, two-thirds (67%) of employers providing
Apprenticeships in Health, Public Service & Care provided these to workers aged 25+. Those employers who said that they did not employ apprentices aged 16-18 were asked to
say why not16 (Figure 8). Interestingly, reasons around regulations were more prevalent
than last year, with more than a third (36%) stating that they could not employ under-18s17
in their line of work, compared with 29% previously. In particular, employers operating in
the Health and Social Care sector were significantly more likely to say that they could not
employ under-18s (47%), whilst those in Wholesale, Retail and Motor Trades were
significantly less likely (9%). One in five employers (22%) said they would take on
someone in that age group if they were right for the job, similar to 2013, which could imply
that these employers view most younger workers as lacking the requisite skills. Although
16 This question took the form of an un-prompted multiple choice question. 17 There were no differences across employer awareness in the extent to which they stated this.
17% 13%7%
65%
75%
47%
16-18 19-24 25+
Offer to this age group
Offer to this age group only
All employers
53%84%
67%
77%67%
38%
82%64%
30%
85%62%
24%
62%81%
48%
66%74%
44%
60%93%
56%
65%79%
50%
58%72%
57%
Health, Public Services & Care
Agriculture, Horticulture & AnimalCare
Engineering & ManufacturingTechnologies
Construction, Planning & BuiltEnvironment
Information & CommunicationTechnology
Retail, Commercial Enterprise
Leisure, Travel & Tourism
Business, Administration & Law
Other
16-18 years old 19-24 years old 25+ years old
Base: All (4030); All Frameworks (5159): Health Public Services & Care (1250); Agriculture Horticulture Animal Care (161); Engineering Manufacturing Technologies (481); Construction Planning Built Environment (310); Information Communication Technology (151); Retail Commercial Enterprise (896); Leisure Travel Tourism (180); Business, Administration Law (1554); Other (176)
% of employers who offer to this age group
25

Apprenticeships Evaluation 2014: Employer Report
only 1% explicitly identified 16-18 year olds as being unsuitable as a whole, 9% stated that
nothing could convince them to hire this age group.
Figure 8: Reasons for not providing Apprenticeships to 16-18 year olds
2.6 How long have employers been offering Apprenticeships?
As with last year’s survey, 90% of employers had been offering Apprenticeships for more
than a year, with 42% having offered them for less than three years (a small increase on
last year’s figure of 39%). Beyond this, employers were fairly evenly spread in terms of
how long they had been offering Apprenticeships (Figure 9). One in three (34%) had been
offering them for more than five years including 19% who were longstanding apprentice
employers, offering them for over ten years.
Figure 9: Length of involvement with Apprenticeships across all employers and by all frameworks provided
6%
36%
19%
15%
19%
4%
A year or less
More than a year, up to 3years
More than 3 years, up to 5years
More than 5 years, up to 10years
More than 10 years
Don't know
4% 7%2% 1% 1%
6% 6% 5% 5%
23%
30%
25%38%
10%
15%7% 13% 16%
21%
17%
14%
15%
16%
16%
16%13% 9%
18%13%
20%
15%
14%
18% 32%21%
18%
28% 25% 36%28%
47%
38%30%
41% 45%
5% 8% 4% 2%12%
7% 8% 7% 7%All employers
Base: All (4030); All Frameworks (5159): Health Public Services & Care (1250); Agriculture Horticulture Animal Care (161); Engineering Manufacturing Technologies (481); Construction Planning Built Environment (310); Information Communication Technology (151); Retail Commercial Enterprise (896); Leisure Travel Tourism (180); Business, Administration Law (1554); Other (176)
36%
22%
15%
9%
6%
4%
3%
1%
We cannot employ people under 18 in our work
We would employ a 16-18 year old if they were right for the job
If there was an appropriate opening we would
Nothing could persuade us
If we received funding/ financial assistance to pay their wages
If there were changes to regulations/ the law
If it was company policy/ the Board decided to do it
They lack experience / maturity
Base: All who do not hire Apprentices who are 16 to 18 years old (1386)
26
Apprenticeship Evaluation: Employers
Looking across all frameworks offered, Figure 9 reveals a similar pattern to last year, with
employers split into two main groups18:
• The more ‘traditional’ frameworks (i.e. Construction, Planning & Built Environment,
and Engineering & Manufacturing Technologies), alongside Health, Public
Services & Care, and Agriculture, Horticulture & Animal Care, were more likely to
have been offering Apprenticeships for longer than five years (around 40% to
50%).
• Employers offering the remaining frameworks tended to have been involved for
less than five years with a minority of 25% to 30% providing them for longer.
18 Three groups were presented in last year’s report, with employers providing Health, Public Services & Care, or Agriculture, Horticulture & Animal Care ‘sitting between’ the ‘traditional’ and ‘newer’ frameworks. This year, their figures more closely resemble those of the ‘traditional’ group.
27
Apprenticeships Evaluation 2014: Employer Report
3. Taking on apprentices Key findings
Only six in ten employers (62%) were aware that the training they had provided was an
Apprenticeship, which fell to around four in ten (37%) of those who had drawn their
apprentices from existing staff (a reduction from 47% in 2013). There is continuing
evidence that the concept of ‘Apprenticeships’ resonates less with those employers
providing less traditional frameworks and to people in older age groups.
In terms of self-reported knowledge, seven in ten employers (71%) felt they knew a
‘great deal’ or ‘fair amount’ about Apprenticeships. Knowledge was highest among
large workplaces with 100+ staff and, linked to this, among employers with higher
volumes of apprentices who employed apprentices across multiple levels, Frameworks,
and age ranges. There was also a strong link between knowledge of Apprenticeships
and whether employers had influenced or wanted to influence the training (a key
element of the current Apprenticeship reform programme).
Employers were split fairly evenly by the method that they used to recruit apprentices:
48% recruited from existing staff and 46% recruited externally with only a small
proportion using both approaches. Recruitment approach is strongly influenced by
framework(s) provided, with a clear distinction between employers providing ‘traditional’
Apprenticeships (who were more likely to recruit specifically) and those providing
newer frameworks, who more likely to recruit from existing staff. Younger apprentices
were more likely to have been recruited specifically, as were those working for smaller
organisations and in workplaces with only one apprentice.
At workplaces where there was specific recruitment to Apprenticeship positions, the
tendency was to use fixed-term contracts, and for apprentices to be recruited to new
positions rather than as replacement demand for staff who were leaving. By contrast,
the majority of employers who recruited internally said this was primarily to improve
employees’ skills in their existing jobs, rather than to prepare them for a new job role.
3.1 Recognition that employees are doing Apprenticeships
A longstanding challenge in Apprenticeship research with employers is that some do not
recognise the training their staff are doing as an ‘Apprenticeship’, often because providers
28

Apprenticeship Evaluation: Employers
may not use that terminology or may place greater emphasis on the technical component
such as the NVQ. Apprenticeships are also strongly associated with young people and
may not resonate as such with employers who are providing the training to older workers
aged 25+. For this study, as in the 2013 survey, employers were sampled from official
statistics so that we could be certain they had apprentices who finished training between
August 2012 and March 2013. Like the 2013 survey, employers were not screened out if
they did not recognise that they provided Apprenticeships19. This means that the findings
are representative of the full spectrum of employer engagement and opinion.
Six in ten employers (62%) were aware that the training they had provided was an
Apprenticeship compared with 37% who were not. This clearly demonstrates the
awareness gap among employers, which has grown since the 2013 survey when seven in
ten were aware (70%) and three in ten were not (29%). The determinants of awareness
are similar to those found in last year’s survey, but have become more pronounced among
employers who recruit apprentices from their existing staff. Less than four in ten of these
(37%) recognised the training their staff received as an Apprenticeship (a decrease from
47% in 2013) compared with 89% of those who recruited apprentices externally (a much
smaller, but still significant, decrease from 92% previously). This drop is likely to be
exaggerated by small shifts in the profile this year which all combine in favour of groups
who have lower recognition: employers offering Apprenticeships to existing staff aged
over-25, Business, Administration & Law frameworks, and located in a branch as opposed
to a Head Office or single-site organisation. Notably, employers in sites with 25-99
employees were less likely than smaller or larger establishments to be aware they had
been delivering an Apprenticeship (52% compared with 65% among small sites employing
fewer than 25 staff).
By frameworks provided (Figure 10), recognition remained highest among employers
offering more ‘traditional’ frameworks such as ‘Construction, Planning & the Built
Environment’ and ‘Engineering & Manufacturing Technologies’, and to a lesser extent ICT
and Agriculture, Horticulture & Animal Care. These employers were all more likely to both
recruit apprentices as external recruits and at a younger age. Conversely, employers
offering Apprenticeships in most of the newer framework areas, and to existing employees
(who also tended to be aged 25+) were much less likely to recognise the training as an
19 Unlike the Apprenticeship employer surveys prior to 2013, where there was a relatively high volume of screen outs.
29

Apprenticeships Evaluation 2014: Employer Report
Apprenticeship. This pattern is similar to 2013, but compared with then, awareness has
fallen among employers providing frameworks in the two most common framework
groupings (‘Health, Public Service & Care’, and ‘Business, Administration & Law’).
Figure 10: Employers’ recognition that their apprentices were on an Apprenticeship, by Frameworks provided; age of apprentices; and recruitment approach
Employers who did not recognise that their staff had done an Apprenticeship were asked
to say which area of training they had been doing. The most common responses were
training in Business, Administration and Law (mentioned by 69% of those who did not
recognise they had been providing an Apprenticeship) followed by training in Retail and
Commercial Enterprise (45%) and Health, Public Services and Care (33%).
3.2 Knowledge about Apprenticeships
Employers were asked how much they knew about Apprenticeships in general20. The
majority (71%) said they knew either ‘a great deal’ (23%) or ‘a fair amount’ (48%) with
another quarter who knew ‘just a little’ (25%). Only four per cent said they had heard of
Apprenticeships but knew nothing about them. As this is a self-reported question it is
difficult to say whether employers actually do know as much as they claim, in particular
when a substantial minority are not aware they have been employing an apprentice. Some
20 Note that, to improve employers’ comprehension, the wording of this question was changed in this year’s survey compared with 2013 (when employers were asked about their knowledge of ‘the government’s Apprenticeship offer’). This means that it is not valid to compare the results of this question with 2013.
62%
10%
53%39%
25%
42%40%46%45%
22%9%
20%28%
44%
1%
1%
1%
1%
1%
1%1%1%1%
3%
1%
1%
2%
37%
89%
46%60%
74%
57%59%53%54%
76%
90%79%
72%
54%Yes, all were
Yes, some were
No, none were
Base: All employers (4030)
30

Apprenticeship Evaluation: Employers
employers may still hold more ‘traditional’ perceptions of what an Apprenticeship entails
and of who can be an apprentice.
Knowledge was highest among large workplaces with 100+ staff (where 90% knew a great
deal or fair amount compared with 69% of workplaces with between 1 and 24 staff) and,
linked to this, among employers with higher volumes of apprentices and who employed
apprentices across multiple levels, frameworks, and age ranges. Notably there was no
difference according to the overall size of the organisation: the differences by workplace
size related more to whether or not the business was single-site or a branch of a larger
business, with branches less likely to say they knew a great deal or fair amount (66%)
compared with either single sites (72%) or Head Offices (85%). Knowledge was
particularly low among employers who only offered Apprenticeships to staff aged 25+,
where just 42% knew a great deal or a fair amount about them.
As we might expect there was a strong link between employers’ knowledge about
Apprenticeships and whether they were aware of what they were providing. Four in five
(82%) who were aware they were providing Apprenticeships knew a great deal or fair
amount about them, compared with just half of those who did not recognise their training
as an Apprenticeship (52%).
There was also a strong link between knowledge of Apprenticeships and whether
employers had influenced or wanted to influence the training (a key element of the current
Apprenticeship reform programme). Employers who had no influence and did not want
any influence were less likely to say they knew a great deal or a fair amount about
Apprenticeships (60%) than those who had exerted influence both before and during the
training (77%), or who had some influence either before or during, and wanted more
(78%).
3.3 Information, support and guidance available
Almost three-quarters (73%) of employers felt there was sufficient information, support and
guidance available to employers interested in offering Apprenticeships, up from 68% in
2013. One-quarter (24%) thought the information and support available was insufficient,
compared with 29% previously. Encouragingly for BIS and the SFA, this increase is
apparent across all organisation sizes, although the gap between employers with fewer
than 25 staff (where 70% now think there is sufficient information and support) and those
31

Apprenticeships Evaluation 2014: Employer Report
with 100+ staff (79%) remains similar. The proportion who feel that information and
support is lacking has fallen to 26% of small employers (down from 35% in 2013) and 19%
of medium-sized ones (down from 24% in 2013). However, single-site organisations
remain less likely than others to say that information is sufficient (68%) and their view has
improved less notably than in Head Offices. Together with the consistent gap between
large and small employers, this suggests that future provision still needs to engage better
with small organisations.
Table 1: Whether there is sufficient information, support and guidance available to employers interested in offering Apprenticeships
Base Yes, sufficient
No, insufficient
Don't know
Frameworks provided
Health, Public Services & Care 1,250 77% 21% 2%
Agriculture, Horticulture & Animal Care 161 66% 30% 5%
Engineering & Manufacturing Technologies 481 71% 24% 5%
Construction, Planning & Built Environment 310 68% 27% 5%
Information & Communication Technology 151 64% 33% 4%
Retail & Commercial Enterprise 896 73% 23% 3%
Leisure, Travel & Tourism 180 72% 20% 8%
Business, Administration & Law 1,554 76% 21% 3%
Other 176 65% 31% 4%
Size of organisation
1-24 employees 70% 26% 3%
25-99 employees 76% 21% 3%
100+ employees 85% 13% 3%
Site function
Only site in organisation 1,797 68% 29% 3%
Head office with sites 615 80% 17% 3%
Branch of org. with sites 1,607 78% 18% 5%
Number of years involved
Up to 3 1,545 69% 27% 3%
3-10 years 1,482 76% 22% 2%
More than 10 years 861 75% 22% 3%
Total 4,030
32

Apprenticeship Evaluation: Employers
Employers who felt there was insufficient information, advice or support available would
most welcome further guidance on ‘who to approach and how to get information’, ‘what
funding is available’, ‘understanding the requirements and benefits’ of Apprenticeships,
and ‘personal advice and support’ (Figure 11). These findings are very much in line with
2013, although demand for more personal advice and support, and for information on legal
obligations/ employment contracts, has both increased significantly since last year.
Figure 11: Information, support and guidance that is missing, 2014 and 2013
There were few differences by main framework. However, among those who felt there was
insufficient information available, employers whose main framework was ‘Health, Public
Service and Care’ were more likely to want additional support on understanding the
requirements and benefits of an Apprenticeship (39% compared with 30% overall).
Employers whose main framework was Agriculture, Horticulture or Animal Care were more
likely to want advice on how to recruit apprentices (30% compared with 13% overall),
perhaps reflecting greater recruitment problems in that type of work.
3.4 Recruitment patterns
Internal and external recruitment Apprentices can either be existing employees, or recruited specifically to an
Apprenticeship position. Employers were asked about the apprentices who finished
training between August 2012 and March 2013. As in 2013 there was a fairly even balance
54%
38%
30%
27%
20%
18%
14%
13%
9%
3%
3%
1%
52%
37%
24%
20%
15%
13%
8%
11%
5%
3%
2%
1%
Who to approach/ how to get information
What funding is available and how to get it
Understanding requirements and benefits
Personal advice and support
How to find suitable training providers
How to set up training for apprentices
Legal obligations/ employment contracts
How to recruit apprentices
How to deliver the qualifications
Better quality/ more information
Other
Don't know
2014 2013
Base: All who say there is not sufficient information, 2014 (873) and 2013 (989)
33

Apprenticeships Evaluation 2014: Employer Report
between those who had recruited specifically for the Apprenticeship (46%) and those who
reported the apprentice was already an existing member of staff (48%). As before,
employers tended to use one method or the other – just 4% had used both.
As in 2013, employers who provided the more ‘traditional’ frameworks of ‘Construction,
Planning & the Built Environment’ and ‘Engineering & Manufacturing Technologies’ were
more likely to have recruited their apprentices externally, alongside, to a lesser extent, ICT
and Agriculture, Horticulture & Animal Care (Figure 12). In line with last year’s survey,
there is a much greater focus on recruiting young people to a specific Apprenticeship
position, compared with older workers (who are more likely to be existing members of
staff). For many young people aged 16 – 18 in particular, the Apprenticeship is likely to be
their first job after leaving full-time education.
Figure 12: Recruitment type by frameworks provided, level and age of apprentices
Recruitment patterns by organisation size vary in the same ways as they did in 2013.
Small employers with fewer than 25 staff were more likely to have just recruited their
apprentice(s) externally (61%) while large organisations with 100+ staff were more likely to
have only recruited internally (64%). This is also linked to sector, with internal recruitment
more prevalent in sectors which tend to include larger establishments, including
accommodation and food (77%), health and social care (60%) and wholesale, retail and
1%2%2%2%2%1%2%1%4%1%3%3% 6%5%5%6%6%6%6%10%5%6%2%4%5%7%
24%
42%
58%
40%46%42%40%30%37%
60%
78%69%
54%
34%
68%
51%
35%
52%47%52%52%60%58%
34%
17%27%
37%
57%
From exisitng employess
Recruited specifically
Both
Don't know
Base: All
34
Apprenticeship Evaluation: Employers
motor trades (57%). As in 2013, organisations with only one apprentice were more likely
to have taken them on as specific new recruits (54%). In contrast, the majority of those
with multiple apprentices had recruited them from within their existing workforce (peaking
among those with between three and nine apprentices, at 57%), or to have used both
internal and external approaches (highest among those with ten or more apprentices, at
23%).
The use of fixed-term contracts In total, half of all employers (50%) had recruited at least one apprentice externally, and of
these, 72% employed their apprentice(s) on a fixed-term contract for the period of the
training, similar to 2013. Fixed term contracts were most prevalent among employers
offering the newer, high-growth frameworks in Health, Public Service and Care (80%) or
Retail and Commercial Enterprise (79%). Conversely they were less common among
employers offering Apprenticeships in ‘traditional’ areas such as Engineering and
Manufacturing Technologies (56%) or Construction, Planning and the Built Environment
(66%).
New positions or replacement demand? Employers who had recruited their apprentices externally were also asked whether they
had done so to replace existing members of staff, or to fill new positions. Most (74%)
recruited external apprentices to fill newly created posts, rather than as direct
replacements for staff who had left or were approaching retirement (35%). Recruiting
apprentices to newly created posts, rather than to meet replacement demands within the
existing workforce, was more common among employers offering the ‘traditional’
frameworks, as well as those offering frameworks in Information and Communication
Technology and ‘other’ subjects (Figure 13 overleaf).
35
Apprenticeships Evaluation 2014: Employer Report
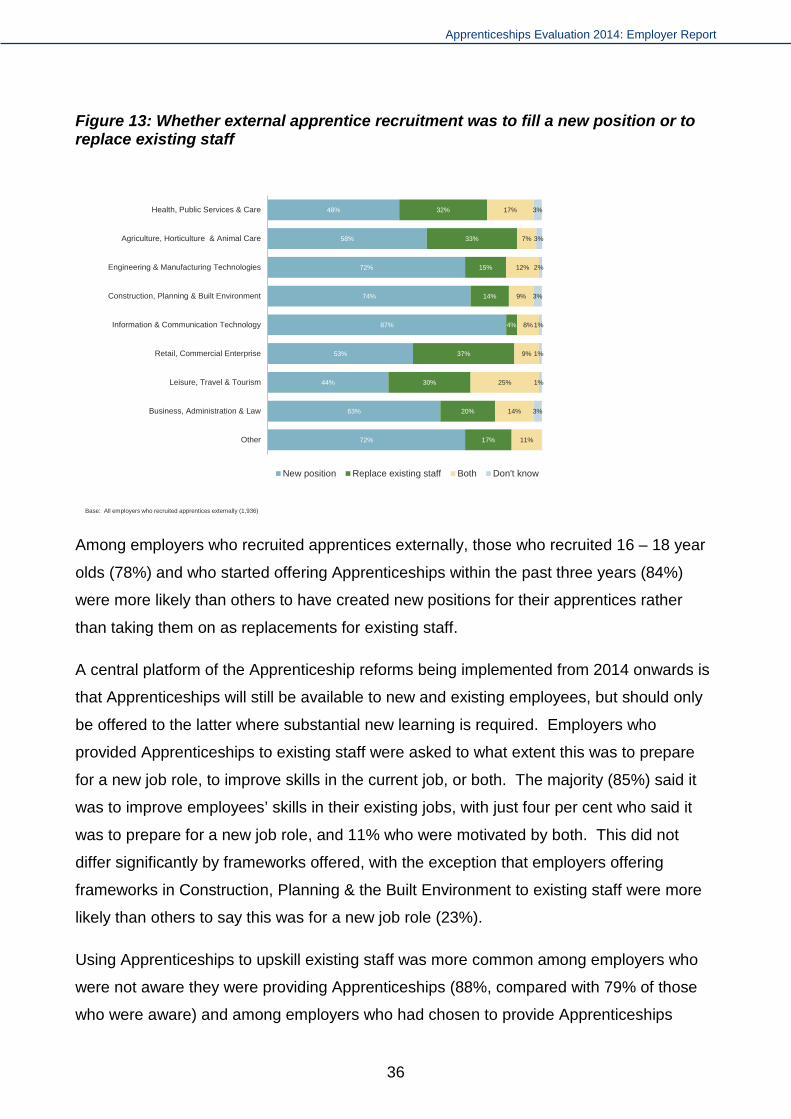
Figure 13: Whether external apprentice recruitment was to fill a new position or to replace existing staff
Among employers who recruited apprentices externally, those who recruited 16 – 18 year
olds (78%) and who started offering Apprenticeships within the past three years (84%)
were more likely than others to have created new positions for their apprentices rather
than taking them on as replacements for existing staff.
A central platform of the Apprenticeship reforms being implemented from 2014 onwards is
that Apprenticeships will still be available to new and existing employees, but should only
be offered to the latter where substantial new learning is required. Employers who
provided Apprenticeships to existing staff were asked to what extent this was to prepare
for a new job role, to improve skills in the current job, or both. The majority (85%) said it
was to improve employees’ skills in their existing jobs, with just four per cent who said it
was to prepare for a new job role, and 11% who were motivated by both. This did not
differ significantly by frameworks offered, with the exception that employers offering
frameworks in Construction, Planning & the Built Environment to existing staff were more
likely than others to say this was for a new job role (23%).
Using Apprenticeships to upskill existing staff was more common among employers who
were not aware they were providing Apprenticeships (88%, compared with 79% of those
who were aware) and among employers who had chosen to provide Apprenticeships
48%
58%
72%
74%
87%
53%
44%
63%
72%
32%
33%
15%
14%
4%
37%
30%
20%
17%
17%
7%
12%
9%
8%
9%
25%
14%
11%
3%
3%
2%
3%
1%
1%
1%
3%
Health, Public Services & Care
Agriculture, Horticulture & Animal Care
Engineering & Manufacturing Technologies
Construction, Planning & Built Environment
Information & Communication Technology
Retail, Commercial Enterprise
Leisure, Travel & Tourism
Business, Administration & Law
Other
New position Replace existing staff Both Don't know
Base: All employers who recruited apprentices externally (1,936)
36

Apprenticeship Evaluation: Employers
because they cost less or were free compared with other forms of training (88%, compared
with around three-quarters of those motivated by more positive reasons).
37
Apprenticeships Evaluation 2014: Employer Report
4. Employer influence on and involvement in Apprenticeship delivery
Key findings
At the majority of workplaces (71%) Apprenticeship training is delivered jointly by the
provider and the employer (while in nearly all other cases it is delivered only by the
training provider). The proportion of workplaces where training is only delivered by a
provider has increased slightly since last year, from 20% to 23%.
Like last year, only half of employers (49%) who had received provider training said
they were able to influence the structure, content, delivery and duration of the
Apprenticeship before it started, while 58% said they were able to influence the
training during the Apprenticeship. Larger workplaces and those who knew more
about Apprenticeships were more likely to have influenced the training they received.
Around one third of employers who did not get any influence said they wanted some
(35%) an increase since 2013 (29%), Smaller workplaces were more likely than larger
ones to have wanted influence but not been able to get it. In contrast, 63% of
employers who had no influence said that they did not want any. Overall, this equates
to around a quarter of all employers (26%) saying they do not have any influence and
do not want any.
Just over a quarter of all employers (28%) said that they would have liked to have
changed something about the content, structure, delivery or duration of their
Apprenticeship training. Of these, 60% had asked the training provider to make
changes but 40% had not. Multivariate analysis demonstrated that agreement with the
statements “We know who to speak to about making changes to the Apprenticeship
training we get” and “Our training provider would adapt the Apprenticeship if we asked
them to” was most predictive of employers’ decisions to ask for change if they wanted
it. This underlines the importance of the employer-provider relationship, as well as
providers’ willingness to be flexible, in order for employers to exert influence.
38
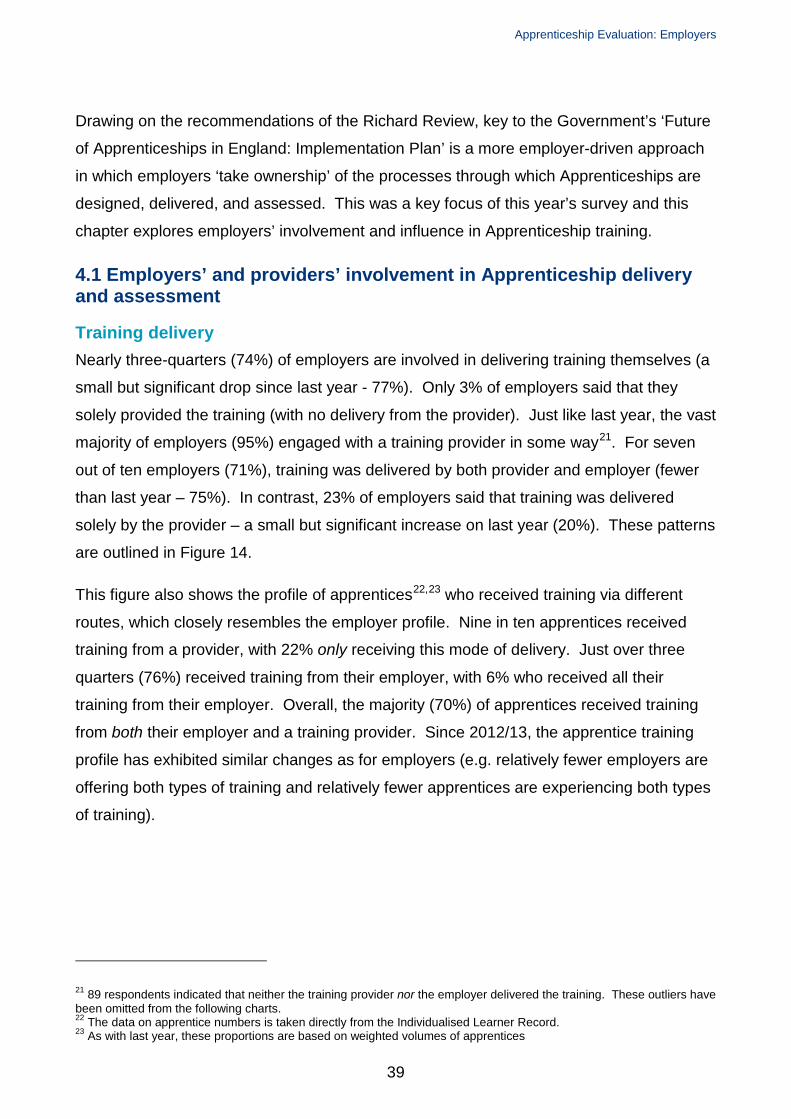
Apprenticeship Evaluation: Employers
Drawing on the recommendations of the Richard Review, key to the Government’s ‘Future
of Apprenticeships in England: Implementation Plan’ is a more employer-driven approach
in which employers ‘take ownership’ of the processes through which Apprenticeships are
designed, delivered, and assessed. This was a key focus of this year’s survey and this
chapter explores employers’ involvement and influence in Apprenticeship training.
4.1 Employers’ and providers’ involvement in Apprenticeship delivery and assessment
Training delivery Nearly three-quarters (74%) of employers are involved in delivering training themselves (a
small but significant drop since last year - 77%). Only 3% of employers said that they
solely provided the training (with no delivery from the provider). Just like last year, the vast
majority of employers (95%) engaged with a training provider in some way21. For seven
out of ten employers (71%), training was delivered by both provider and employer (fewer
than last year – 75%). In contrast, 23% of employers said that training was delivered
solely by the provider – a small but significant increase on last year (20%). These patterns
are outlined in Figure 14.
This figure also shows the profile of apprentices22,23 who received training via different
routes, which closely resembles the employer profile. Nine in ten apprentices received
training from a provider, with 22% only receiving this mode of delivery. Just over three
quarters (76%) received training from their employer, with 6% who received all their
training from their employer. Overall, the majority (70%) of apprentices received training
from both their employer and a training provider. Since 2012/13, the apprentice training
profile has exhibited similar changes as for employers (e.g. relatively fewer employers are
offering both types of training and relatively fewer apprentices are experiencing both types
of training).
21 89 respondents indicated that neither the training provider nor the employer delivered the training. These outliers have been omitted from the following charts. 22 The data on apprentice numbers is taken directly from the Individualised Learner Record. 23 As with last year, these proportions are based on weighted volumes of apprentices
39

Apprenticeships Evaluation 2014: Employer Report
Figure 14: Proportion of employers and their apprentices utilising and experiencing different methods of training provision
Looking at the mode of training delivery across employers’ main framework (Figure 15),
there are few differences except for the fact that having training providers undertake all
training was more common among employers whose main frameworks were Information &
Communication Technology (34%), Leisure, Travel & Tourism (28%), or Business,
Administration & Law (31%).
Figure 15: Profile of training provision by main framework
22%
18%
6%
3%
70%
78%
92%
96%
76%
81%
Experienced this training delivery method onlyExperienced this training method
23%
20%
3%
2%
71%
75%
95%
95%
74%
77%
Training deliveredby a training
provider
Training deliveredby the employer
Training deliveredby both providerand employer
Use this training delivery method onlyUse this training method
Bars with gradient shading are data from 2012/13 survey
Proportion of employers using different training delivery methods in 2012/13 and 2013/14
Base: All employers 2013-14 (4030); All employers 2012-13 (4009); No. of apprentices finishing training 2013-14 (26,837); No. of apprentices finishing training 2012-13 (40,447)
Proportion of apprentices experiencing different training delivery methods in 2012/13 and 2013/14
74%
72%
74%
68%
59%
78%
65%
63%
73%
22%
21%
22%
22%
34%
18%
28%
31%
21%
2%
5%
3%
7%
7%
2%
7%
3%
5%
Health, Public Services & Care
Agriculture, Horticulture & Animal Care
Engineering & Manufacturing Technologies
Construction, Planning & Built Environment
Information & Communication Technology
Retail, Commercial Enterprise
Leisure, Travel & Tourism
Business, Administration & Law
Other
Training delivered by both provider and employerTraining delivered by training provider onlyTraining delivered by employer only
Base: Main Framework: Health Public Services & Care (881); Agriculture Horticulture Animal Care (103); Engineering Manufacturing Technologies (421); Construction Planning Built Environment (345); Information Communication Technology (106); Retail Commercial Enterprise (934); Leisure Travel Tourism (130); Business, Administration Law (1363); Other (158).
40

Apprenticeship Evaluation: Employers
Beyond main framework, and as can be seen in Table 2, there was little difference in the
pattern of training delivery by the size of the worksite or the number of apprentices who
finished training.
Table 2: Method of training delivery by workplace size and number of apprentices
Base
Training Provider only
Training Provider
Employer only Employer
Both Training Provider and Employer
Size of worksite
1-24 employees 2,694 23% 96% 3% 76% 73%
25- 99 employees 987 27% 94% 3% 70% 67%
100+ employees 327 26% 95% 3% 73% 69%
Total (Excluding ‘Don’t knows’ and ‘Refusals’ for worksite size)
4,008 24% 95% 3% 74% 71%
Number of apprentices
1 apprentice 2,432 25% 95% 4% 74% 70%
2 apprentices 729 23% 95% 3% 75% 72%
3-10 apprentices 734 24% 96% 3% 75% 72%
More than 10 apprentices 135 24% 97% 2% 75% 73%
Total 4,030 24% 95% 3% 74% 71%
Assessment Shifting focus to assessment, rather than training delivery, almost all employers (97%)
indicated that the Apprenticeship assessments were conducted by a training provider, in
line with last year. Of the small group of employers who stated that the assessment was
not done by a training provider, 64% said that their own staff had conducted the
assessment24.
4.2 Employers’ influence on Apprenticeship training
In last year’s survey we asked employers if they had been able to influence the structure,
content, delivery and duration of the Apprenticeship – both before and during the training.
These issues are of particular policy interest in the light of reforms to the Apprenticeship
24 Of the remaining employers 35% said that their own staff did not conduct the assessment and 1% did not know. However, the survey did not ask these employers who had conducted the assessment.
41
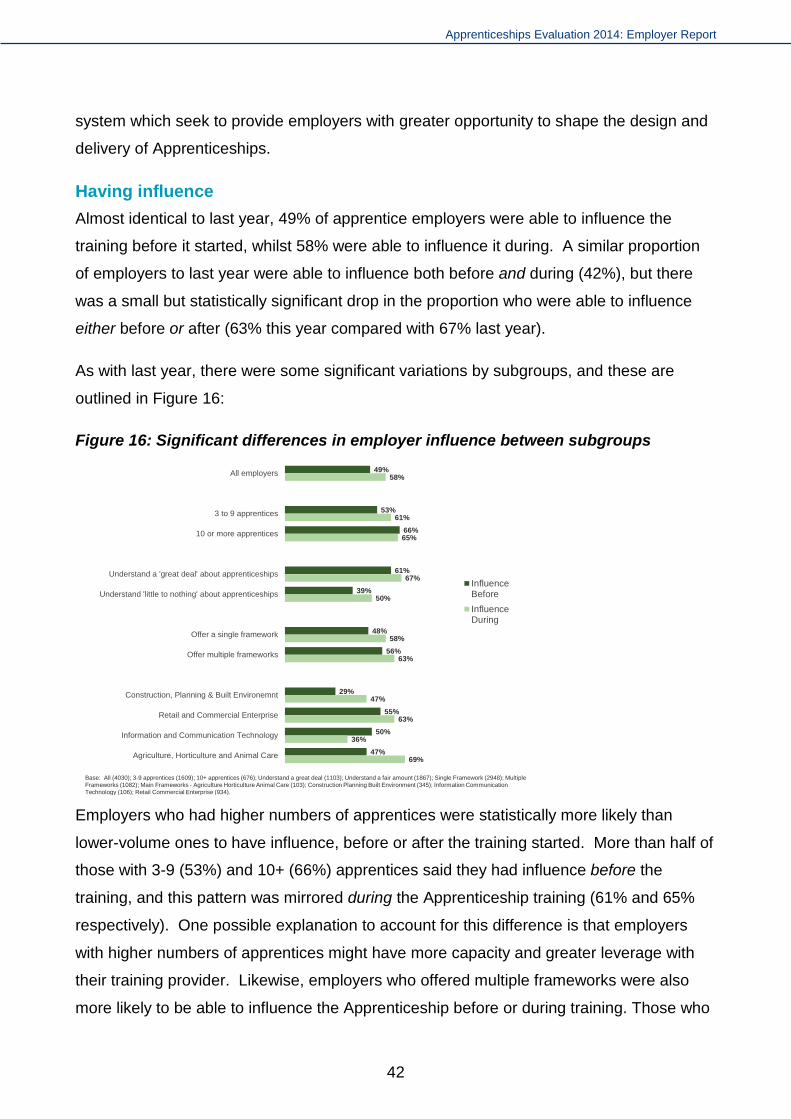
Apprenticeships Evaluation 2014: Employer Report
system which seek to provide employers with greater opportunity to shape the design and
delivery of Apprenticeships.
Having influence Almost identical to last year, 49% of apprentice employers were able to influence the
training before it started, whilst 58% were able to influence it during. A similar proportion
of employers to last year were able to influence both before and during (42%), but there
was a small but statistically significant drop in the proportion who were able to influence
either before or after (63% this year compared with 67% last year).
As with last year, there were some significant variations by subgroups, and these are
outlined in Figure 16:
Figure 16: Significant differences in employer influence between subgroups
Employers who had higher numbers of apprentices were statistically more likely than
lower-volume ones to have influence, before or after the training started. More than half of
those with 3-9 (53%) and 10+ (66%) apprentices said they had influence before the
training, and this pattern was mirrored during the Apprenticeship training (61% and 65%
respectively). One possible explanation to account for this difference is that employers
with higher numbers of apprentices might have more capacity and greater leverage with
their training provider. Likewise, employers who offered multiple frameworks were also
more likely to be able to influence the Apprenticeship before or during training. Those who
49%
53%
66%
61%
39%
48%
56%
29%
55%
50%
47%
58%
61%
65%
67%
50%
58%
63%
47%
63%
36%
69%
All employers
3 to 9 apprentices
10 or more apprentices
Understand a 'great deal' about apprenticeships
Understand 'little to nothing' about apprenticeships
Offer a single framework
Offer multiple frameworks
Construction, Planning & Built Environemnt
Retail and Commercial Enterprise
Information and Communication Technology
Agriculture, Horticulture and Animal Care
InfluenceBeforeInfluenceDuring
Base: All (4030); 3-9 apprentices (1609); 10+ apprentices (676); Understand a great deal (1103); Understand a fair amount (1867); Single Framework (2948); Multiple Frameworks (1082); Main Frameworks - Agriculture Horticulture Animal Care (103); Construction Planning Built Environment (345); Information Communication Technology (106); Retail Commercial Enterprise (934).
42

Apprenticeship Evaluation: Employers
offered multiple frameworks generally had more apprentices, and larger employers (with
100+ employees) were significantly more likely to influence the training before (66%) or
after (67%) it started.
An alternative explanation for why employers do or do not exert influence could be their
level of understanding and knowledge of Apprenticeships. For example, a higher level of
knowledge about Apprenticeships was associated with increased levels of influence before
the training. Those employers who knew a ‘great deal’ were significantly more likely to be
able to influence the Apprenticeship training than those employers with ‘little to no
understanding’ both before (61% compared with 39%) and during (67% compared with
50%). This observation supports the previous qualitative work undertaken by Ipsos
MORI25 in which a key barrier to employer influence was lack of awareness about how
Apprenticeships were delivered.
Looking at specific sector subject areas, employers who identified their main
Apprenticeship framework as Construction, Planning & Built Environment were less likely
to have influence before (29%) and during (47%) training. In contrast, those who identified
Retail & Commercial Enterprise as their main framework reported higher levels of
influence before and during training.
Wanting influence As with last year, employers who had limited influence (those who said they had not been
able to influence training either before or after it started) were asked if they had wanted
any influence over the training.
Of these, 35% said that they had wanted influence: a significant increase over last year
(29%). There was little difference in the desire for influence across frameworks. Notably,
smaller worksites (with 1-24 employees) were more likely to have wanted influence (37%
compared with 29% of worksites with 25+ employees). Like last year, single site
organisations were more likely to want influence (41%) compared with branches (24%).
Similarly, those who only recruited external apprentices wanted more influence (42%),
than those who provided Apprenticeships to existing staff (28%).
25 Ipsos MORI (2014), Employer Influence on Apprenticeships, BIS Research Paper 162. London: Department for Business, Innovation and Skills. https://www.gov.uk/government/uploads/system/uploads/attachment_data/file/284766/bis-14-601-employer-influence-on-Apprenticeships.pdf
43
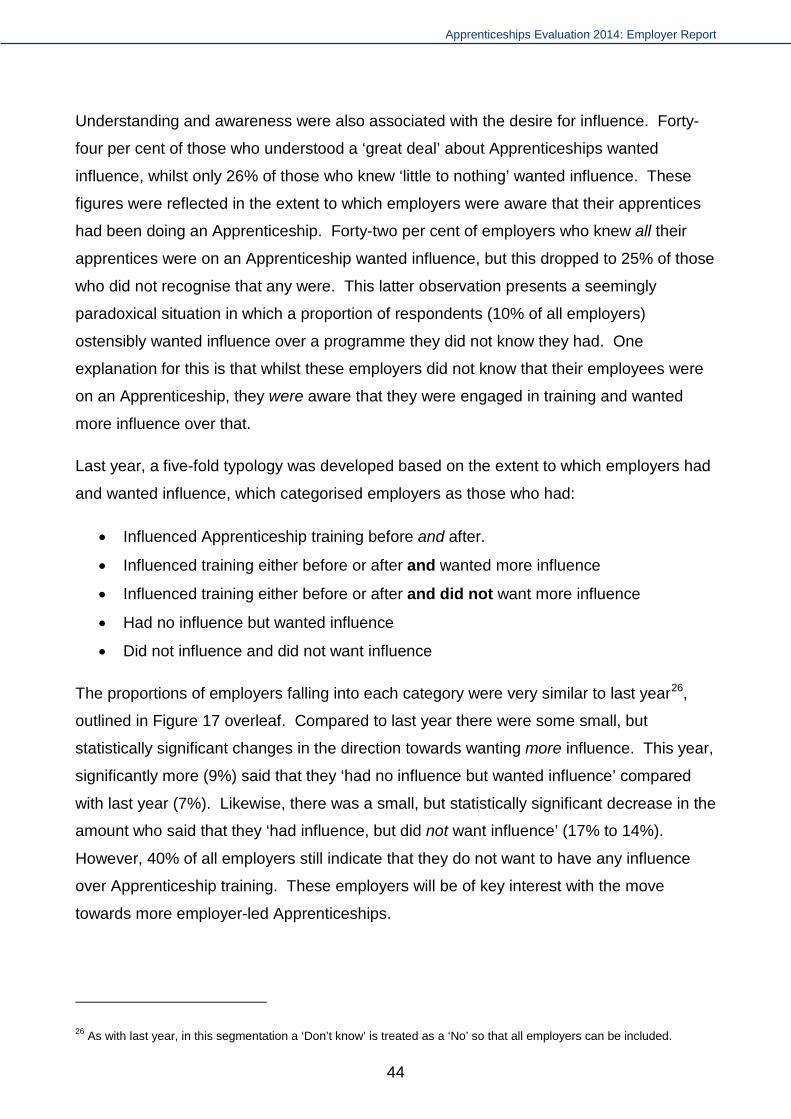
Apprenticeships Evaluation 2014: Employer Report
Understanding and awareness were also associated with the desire for influence. Forty-
four per cent of those who understood a ‘great deal’ about Apprenticeships wanted
influence, whilst only 26% of those who knew ‘little to nothing’ wanted influence. These
figures were reflected in the extent to which employers were aware that their apprentices
had been doing an Apprenticeship. Forty-two per cent of employers who knew all their
apprentices were on an Apprenticeship wanted influence, but this dropped to 25% of those
who did not recognise that any were. This latter observation presents a seemingly
paradoxical situation in which a proportion of respondents (10% of all employers)
ostensibly wanted influence over a programme they did not know they had. One
explanation for this is that whilst these employers did not know that their employees were
on an Apprenticeship, they were aware that they were engaged in training and wanted
more influence over that.
Last year, a five-fold typology was developed based on the extent to which employers had
and wanted influence, which categorised employers as those who had:
• Influenced Apprenticeship training before and after.
• Influenced training either before or after and wanted more influence
• Influenced training either before or after and did not want more influence
• Had no influence but wanted influence
• Did not influence and did not want influence
The proportions of employers falling into each category were very similar to last year26,
outlined in Figure 17 overleaf. Compared to last year there were some small, but
statistically significant changes in the direction towards wanting more influence. This year,
significantly more (9%) said that they ‘had no influence but wanted influence’ compared
with last year (7%). Likewise, there was a small, but statistically significant decrease in the
amount who said that they ‘had influence, but did not want influence’ (17% to 14%).
However, 40% of all employers still indicate that they do not want to have any influence
over Apprenticeship training. These employers will be of key interest with the move
towards more employer-led Apprenticeships.
26 As with last year, in this segmentation a ‘Don’t know’ is treated as a ‘No’ so that all employers can be included.
44

Apprenticeship Evaluation: Employers
Figure 17 also outlines the proportions of apprentices covered by each employer category.
Whilst half of apprentices are based with an employer who has influence before and
during, just over a third are with employers who appeared to be less engaged and
indicated that they either had no influence and did not want any (22%), or that they had
some influence but did not want any more (13%).
Figure 17: Profile of employers and apprentices by influence typology27
Exploring the five-fold influence typology in more detail, Figure 18 (overleaf) shows that there are some differences by main framework area. The three frameworks with the highest proportions of employers saying they do not want any more influence are
Information & Communication Technology (47%), Construction, Planning & Built Environment (47%), and Leisure, Travel & Tourism (47%). However, unlike the latter
framework, the two former frameworks also have statistically fewer employers who said they had any influence before and during the Apprenticeship (27% and 26% respectively).
27 The ‘limited influence’ category in the bar covers the four employer influence categories presented by the circles.
Some ability to influence
Wanted more influence Had some
influence but wanted more
Had some influence but did
not want any more
Had no influence
and did not want any
Had no influence but wanted influence
Did not want
influence
Unable to influence
Profile of influence for all employers
10%
14%
9%
26%
58%42%
Have limited influence (could not influence before and during)Could influence before and during
Some ability to influence
Wanted more influence
Had some influence but wanted more
Had some influence but did
not want any more
Had no influence
and did not want any
Had no influence but wanted influence
Did not want
influence
Unable to influence
Proportions of apprentices within employer influence categories
8%
7%
22%13%
50%50%
Employed at a workplace with limited InfluenceEmployed at a workplace which can influence before and during
45

Apprenticeships Evaluation 2014: Employer Report
Figure 18: Profile of influence typologies by main framework
Attitudinally speaking, employers with lower levels of understanding and awareness of
Apprenticeships are less likely to want to influence their Apprenticeship training (Figure
19). In terms of firmographic variations, there is less difference by site function, but single
sites want more influence than branches of multi-site organisations. This is likely to be
related to having greater ‘ownership’ of the training. Likewise, larger sites, and those with
more apprentices are likely to have had influence before and during, and are less likely to
be in a position of wanting more influence compared to worksites with 1-24 employees and
those with fewer apprentices. Again, as mentioned earlier, this is potentially because their
greater size and volume of apprentices means that they carry more ‘weight’ with providers,
or that providers may be more responsive to their needs.
49%
45%
45%
45%
42%
40%
44%
27%
26%
7%
7%
10%
14%
11%
11%
2%
12%
10%
8%
15%
8%
2%
7%
8%
7%
15%
17%
14%
11%
16%
12%
13%
16%
12%
22%
14%
22%
21%
22%
27%
27%
26%
35%
25%
33%
Retail, Commercial Enterprise
Other
Engineering & Manufacturing Technologies
Agriculture, Horticulture & Animal Care
Business, Administration & Law
Health, Public Services & Care
Leisure, Travel & Tourism
Information & Communication Technology
Construction, Planning & Built Environment
Able to influence before and during Some influence and wanted more influenceNo influence but wanted influence Some influence but did not want influenceNo influence and did not want any
Net % do notwant
influence
36%
33%
38%
39%
40%
42%
47%
47%
47%
Base: Main Framework - Health Public Services & Care (881); Agriculture Horticulture Animal Care (103); Engineering Manufacturing Technologies (421); Construction Planning Built Environment (345); Information Communication Technology (106); Retail Commercial Enterprise (934); Leisure Travel Tourism (130); Business, Administration Law (1363); Other (158).
46
Apprenticeship Evaluation: Employers
Figure 19: Profile of influence typology by various sub-groups
4.3 What drives employer involvement in the Apprenticeship training they are offered?
Following last year’s survey, the majority of employers were split between either wanting
more influence or not wanting any, and this prompted follow-up qualitative research to
explore the views of these employers. The findings from this follow-up research have
been reported elsewhere28, but they suggested a range of barriers and drivers which might
shape employers’ desire and ability to influence Apprenticeship training.
One of the barriers articulated by employers was perceived reluctance by their training
provider to make changes to the training offer. Therefore, this year’s survey attempted to
quantify the extent to which employers had engaged in the key ‘influencing behaviour’ of
asking their training provider to “change any aspects of the Apprenticeship training to
better meet the needs” of the employers’ business.
Wanting and asking for changes to Apprenticeship training Whilst the majority (66%) of employers indicated that they were able to influence either
before or during training (and 19% said that they would have liked more influence) only
28% of employers said that they actually would have liked to have changed something
28 Ipsos MORI (2014), Employer Influence on Apprenticeships, BIS Research Paper 162. London: Department for Business, Innovation and Skills. https://www.gov.uk/government/uploads/system/uploads/attachment_data/file/284766/bis-14-601-employer-influence-on-Apprenticeships.pdf
54%
41%
33%
44%
45%
37%
11%
10%
7%
11%
19%
7%
8%
10%
8%
10%
3%
7%
10%
15%
16%
13%
10%
16%
17%
24%
36%
22%
23%
33%
Know a great deal aboutapprenticeships
Know a fair amount
Know little to nothing
Aware that all apprenticeswere on an apprenticeship
Aware that some were
Not aware that any wereon an apprenticeship
Base: Know a great deal (1103); know a fair amount (1867); know little to nothing (1057); Aware all (2410); Aware some (103); Aware none (1517); 1-24 employees (1996); 25-99 employees (1318); 100+ employees (679); 1 apprentice (866); 2 apprentices (879); 3-9 apprentices (1609); 10+ apprentices (676)
40%
41%
59%
39%
43%
46%
56%
11%
8%
6%
11%
8%
9%
5%
10%
8%
5%
9%
9%
7%
6%
14%
16%
9%
14%
15%
14%
13%
25%
28%
21%
27%
24%
24%
20%
1 to 24 employees
25 to 99 employees
100 or more employees
1 apprentice
2 apprentices
3 to 9 apprentices
10 or more apprentices
47

Apprenticeships Evaluation 2014: Employer Report
about the content, structure, delivery or duration of the training. Of these employers, 60%
had asked the training provider to make changes whilst 40% did not (which represented
16% and 12% of the total sample respectively).
There were differences when looking across main framework area (Figure 20). Employers
who identified Health, Public Services & Care as their main framework were least likely to
have wanted to change anything about the Apprenticeship training, with 76% not wanting
to change anything. In contrast, those who identified Construction, Planning &
Environment, or Information & Communication Technology as their main frameworks were
most likely to have wanted to change something about the training (40% and 43%
respectively). There was little variation in terms of size of worksite or volume of
apprentices.
Figure 20: Employers’ desire to want and ask for change, by main framework
Reasons for not asking for change, when change was desired Those employers who wanted change but did not ask for it were questioned as to why not
(Figure 21). The most common reason was that they did not think their provider would
make the changes (32%). This barrier, along with ‘lack of contact’ (3%), and ‘lack of
continuity’ (2%) could be conceptualised as employers perceiving a lack of an opportunity
to elicit change. In contrast, reasons such as not knowing who to ask (26%), not knowing
enough about the training (11%), or not knowing who to contact (6%) could be
conceptualised as employers perceiving that they lacked the capability to elicit change.
Finally, the reasons of not having the time (10%) and Head Office dealing with it (1%)
76%
69%
72%
60%
57%
73%
67%
74%
74%
15%
15%
17%
19%
22%
15%
18%
15%
15%
8%
16%
12%
21%
22%
12%
16%
12%
11%
Health, Public Services & Care
Agriculture, Horticulture & Animal Care
Engineering & Manufacturing Technologies
Construction, Planning & Built Environment
Information & Communication Technology
Retail, Commercial Enterprise
Leisure, Travel & Tourism
Business, Administration & Law
Other
Did not want to change anything Wanted change and asked for change Wanted change but did not ask for change
Base: Main Framework - Health Public Services & Care (881); Agriculture Horticulture Animal Care (103); Engineering Manufacturing Technologies (421); Construction Planning Built Environment (345); Information Communication Technology (106); Retail Commercial Enterprise (934); Leisure Travel Tourism (130); Business, Administration Law (1363); Other (158).
48

Apprenticeship Evaluation: Employers
could be understood as motivational barriers to employers asking for change. This
conceptual framework is explored in greater detail in the following section.
Figure 21: Reasons for not asking the training provider to change anything, among employers who wanted change
Attitudes towards influencing training New to this year’s survey, a series of attitudinal questions was asked to all respondents to
further explore their desire and perceived ability to ask for changes. The attitudinal
statements were informed by a behavioural theoretical framework called COM-B, which
presents ‘Capability’, ‘Opportunity’ and ‘Motivation’ as key drivers of any behaviour29. The
new statements (and how they relate to the COM-B framework) were30:
Capability:
• “We know who to speak to about making changes to the Apprenticeship training we
get”
29 Michie et al. (2011) ‘The behaviour change wheel: A new method for characterising and designing behaviour change interventions,’ Implemenation Science 6:42. http://www.implementationscience.com/content/6/1/42 30 Two statements were chosen to explore drivers/barriers around ‘Opportunity’ and ‘Motivation’ as the qualitative research into employer influence had highlighted the importance of these.
32%
26%
11%
10%
6%
4%
3%
2%
1%
I didn't think the provider would make the changes Iwanted
I didn't know that I could ask
I didn't know enough about the training to be able toidentify what I would like to change
I didn't have time
I didn't know how to contact the provider / who to contact
It was not possible to make any changes
Lack of contact / communication with training provider
Lact of continuity of the assessors / providers
Head office / department heads deal with this
Base: All who wanted change but did not ask (428)
49

Apprenticeships Evaluation 2014: Employer Report
Opportunity
• “If we were unhappy with the Apprenticeship training we get, we could easily switch
to a different training provider”
• “Our training provider would adapt the Apprenticeship if we asked them to”
Motivation
• “It is not worth spending time trying to tailor Apprenticeship training to the specific
needs of my company”
• “You can’t expect to request changes to Apprenticeship training if you’re not paying
for it”31
Employers’ responses suggested that a key barrier to influencing Apprenticeship training is
the sense that they do not have the ‘opportunity’ to easily switch to an alternative provider
(with only 56% of employers agreeing that they could). In contrast, seven out of ten
employers indicated that they had the ‘capability’ to identify who they need to speak to if
they wanted to ask about making changes. For the other three statements, around two-
thirds of employers indicated that they were motivated to request changes, and felt that
their training provider would be amenable to adapting the training if asked (Figure 22).
Responses to these questions varied by a number of factors, although some broad
patterns did emerge. On the whole, larger worksites were significantly more likely to agree
that they had influence, and significantly more motivated to exercise influence. A similar
pattern was found for employers with more apprentices, greater understanding, more
completions, and those offering more than one framework.
31 It should be noted that many employers do pay for Apprenticeship training. This statement was designed to elicit a response based on employers’ general attitudes towards the notion of paying for training and wanting influence over it in return.
50

Apprenticeship Evaluation: Employers
Figure 22: Employers’ attitudes towards influencing Apprenticeship training
The following sections present a selection of subgroup variations for each statement:
“We know who to speak to about making changes to the Apprenticeship training we get” Relative to the national profile (where 71% of apprentice employers agreed),
agreement was higher among:
• Larger worksites with 100+ employees (85%).
• Non-profit seeking organisations (77%).
• Employers whose main framework areas were Health, Public Service & Care, or
Engineering & Manufacturing Technologies (76% and 77% respectively)
Relative to the national profile (20%), there was more disagreement from:
• Those who had no completions (30%).
• Those with little to no understanding of Apprenticeships (25%).
• Employers citing Construction, Planning & Built Environment, and Information &
Communication Technology as their main framework (27% and 37% disagreed,
respectively).
40%
28%
34%
31%
28%
29%
5%
12%
6%
10%
12%
10%
10%
10%
10%
4%
9%
11%
We know who to speak to about makingchanges to the apprenticeship training we get
If we were unhappy with the apprenticeshiptraining we get, we could easily switch to a
different training provider
Our training provider would adapt theapprenticeship if we asked them to.
Strongly agree Tend to agreeNeither agree nor disagree Tend to disagreeStrongly disagree Don't know
71%
56%
66%
Net agree
Base: All employers (4030)
41%
39%
24%
25%
7%
6%
14%
14%
11%
9%
3%
6%
It is not worth spending time trying to tailorapprenticeship training to the specific needs of
my company
You can’t expect to request changes to apprenticeship training if you’re not paying for it
Strongly disagree Tend to disagreeNeither agree nor disagree Tend to agreeStrongly agree Don't know
Net disagree
65%
64%
51
Apprenticeships Evaluation 2014: Employer Report
“If we were unhappy with the Apprenticeship training we get, we could easily switch to a different training provider” Relative to the national profile (56% agreement), employers in the following groups
were more positive:
• Larger worksites with 100+ employees (67%).
• Employers offering both Level 2 and Level 3 (60%).
• Those who understood a great deal about Apprenticeships (62%).
• Employers offering more than one framework (63%).
• Organisations that cite their main framework as Health, Public Services & Care
(66%).
Relative to the national profile (23%), there was more disagreement from:
• Employers with no completions (31%).
• Employers who wanted influence but had none (39%).
• Those who chose Apprenticeship training because it is low cost / free (35%).
• Organisations who cite their main framework as:
o Agriculture, Horticulture & Animal Care (31%)
o Engineering & Manufacturing Technologies (28%)
o Construction, Planning & Built Environment (38%)
o Information & Communication Technology32 (50%)
“Our training provider would adapt the Apprenticeship if we asked them to” Relative to the national profile (63% agreement), the following employers were more
likely to agree:
• Larger worksites with 100+ employees (78%).
• Employers offering both Level 2 and Level 3 (68%).
• Non-profit seeking organisations (71%).
• Those offering more than one framework (72%)
• Employers who chose Apprenticeship training because they perceive it to be best
for staff recruitment and retention (71%)
32 Small base size of 72.
52
Apprenticeship Evaluation: Employers
Relative to the national profile (20%), there was significantly more disagreement
among:
• Employers who chose Apprenticeships because they are required in their industry
(26%).
• Organisations whose main framework was Construction, Planning & Built
Environment (41%).
• Employers who had no influence but wanted influence (53%).
“It is not worth spending time trying to tailor Apprenticeship training to the specific needs of my company” Relative to the national profile (where 65% of apprentice employers disagreed), there
was more disagreement from:
• Larger worksites with 100+ employees (80%).
• Non-profit seeking organisations (73%).
Relative to the national profile (25%), there was significantly more agreement from:
• Those with only one apprentice who finished training (28%).
• Employers with no completions (32%).
• Employers citing Construction, Planning & Built Environment as their main
framework (34%).
• Employers using apprentices because they are low cost / free (35%) or because Apprenticeships are the required form of training in their industry (32%).
“You can’t expect to request changes to Apprenticeship training if you’re not paying for it” Relative to the national profile (where 64% disagreed), the following groups were more
likely to disagree:
• Larger worksites with 100+ employees (77%).
• Non-profit seeking organisations (70%).
• Employers citing Business, Administration & Law as their main framework (69%).
Relative to the national profile (where 24% agreed), there was significantly more
agreement from:
• Employers who understood little to nothing about Apprenticeships (28%).
53
Apprenticeships Evaluation 2014: Employer Report
• Single site organisations (27%).
• Employers who chose Apprenticeships because they are the most convenient form
of training (30%).
• Employers citing Construction, Planning & Built Environment as their main
framework (32%).
The likelihood of employers requesting training providers to make a change In order to see the impact of these attitudes on employers’ propensity to request a change
in their Apprenticeship training, CHAID analysis was run among employers who indicated
that they did want to change something about it. This analysis produced an attitudinal
segmentation of 898 employers33 based on the extent to which their net agreement and
disagreement with the five attitudinal statements correlated with their likelihood of asking
or not asking for change.
The CHAID analysis demonstrated that agreement with statements “We know who to
speak to about making changes to the Apprenticeship training we get” and “Our training
provider would adapt the Apprenticeship if we asked them to” were most predictive of
employers’ decisions to ask for change if they wanted it. This produced a threefold
segmentation of employers, each with a different likelihood of asking for change:
• Employers who know who to speak to at their training provider and believe that their
provider would adapt the Apprenticeship if asked;
• Employers who know who to speak to and are not sure / do not believe the provider
would adapt the Apprenticeship; and
• Employers who are not sure / do not know who to speak to about requesting a
change in their training.
Figure 23 outlines the likelihood of these three subgroups asking for change. It is clear
that knowing specifically who to speak to at the training provider, and believing that they
will respond to adapt the training, has a positive impact on employers’ likelihood of asking
for change. The proportion of employers in this group who did ask for change is 18
percentage points higher than those who wanted change, but who did not know who to
speak to about it at their provider.
33 Employers who gave ‘Don’t know’ and ‘Not stated’ responses were excluded from the CHAID analysis.
54

Apprenticeship Evaluation: Employers
Figure 23: Likelihood of asking providers to adapt the Apprenticeship training among those who wanted change
74%
67%
56%
26%
33%
44%
Know who to speak to and believe thattheir provider would adapt
Know who to speak to and are not sure/ do not believe the provider would
adapt
Are not sure / do not know who tospeak to
Asked for change Did not ask for change
Base: Know who + believe provider will adapt (390); Know who + do not believe provider will adapt (207); Do not know who to speak to (301)
55
Apprenticeships Evaluation 2014: Employer Report
5. Apprenticeship completion, retention and progression
Key findings
Almost eight in ten employers (78%) said that all of their apprentices who finished their
training between 1st August 2012 and 31st March 2013 had completed the
Apprenticeship, similar to last year. As with last year, employers offering the Health,
Public Service & Care framework were significantly more likely (82%) to have had all
their apprentices complete: these employers were more likely to have provided
Apprenticeships to existing staff, and (related to this) those aged 25+. Relative to the
national profile, significantly more employers had all their apprentices complete where
they were able to influence before and during training.
Two-thirds (65%) of employers said that all of their apprentices who finished training
between August 2012 and March 2013 were still working for them at the time of the
survey (a year to 18 months later). Thirteen per cent stated that some of their
apprentices were still with them, whilst a fifth (20%) said that their apprentices had all
left. This pattern is similar to 2013. Retention is higher among those who deliver
Apprenticeships to existing staff, and those aged 25+.
Of those who had Level 3 apprentices complete their training in the reference period,
over half (54%) said they offered some form of progression to higher level
qualifications, and one in four (24%) had apprentices who had gone on to study these.
Offering higher level qualifications to Level 3 completers was motivated mainly by
workforce development and staff retention strategies, together with a considerable
minority who provided them specifically to enable staff to move into management
positions. Among employers who did not offer their Level 3 completers any higher-level
training, the main reasons were ‘no demand / need’, ‘financial constraints’, and ‘lack of
knowledge’ about what to offer.
5.1 Completion and non-completion
Almost eight in ten employers (78%) said that all of their apprentices who finished their
training between 1st August 2012 and 31st March 2013 had completed their
Apprenticeship. Nine per cent said that some of their apprentices completed, whilst 10%
56

Apprenticeship Evaluation: Employers
said that none of them had. These figures are very similar to those in 2013. Like last
year, as the number of apprentices who finished during the reference period increased,
there was a concordant increase in employers saying that only some of their apprentices
completed and a decrease in the proportion saying that none did.
There were variations when looking across frameworks provided34 (Figure 24). As in 2013,
employers offering the Health, Public Service & Care framework were significantly more
likely (82%) to have had all their apprentices complete. Potentially, this could be an
upshot of more apprentices aged 25+ working in the social care sector, in which the
completion of Apprenticeship training is increasingly important for individuals to be able to
work in the sector. In contrast, like last year, those offering Construction, Planning & Built
Environment (17%), Engineering & Manufacturing Technologies (17%), or Information &
Communication Technology (21%) were more likely to have had none of their apprentices
complete their training. In these latter cases, the completion rates are likely to be related
to the higher proportions of young apprentices in these frameworks. This is reflected in
the fact that those employers who only employ 16-18 only were significantly more likely to
have had no completers (20%).
Figure 24: Whether employers said all, some or none of their apprentices completed, across all frameworks provided
34 ‘All Frameworks’ rather than ‘Main Frameworks’.
78%
82%
79%
79%
77%
77%
76%
74%
71%
65%
9%
11%
12%
7%
12%
11%
12%
5%
8%
9%
10%
4%
8%
11%
8%
10%
9%
17%
17%
21%
3%
3%
1%
2%
3%
3%
3%
3%
5%
5%
Across all Frameworks
Health, Public Services & Care
Other
Agriculture, Horticulture & Animal Care
Business, Administration & Law
Retail, Commercial Enterprise
Leisure, Travel & Tourism
Construction, Planning & Built Environment
Engineering & Manufacturing Technologies
Information & Communication Technology
All completed Some completed None completed Not sure
Base: All Frameworks (5159): Health Public Services & Care (1250); Agriculture Horticulture Animal Care (161); Engineering Manufacturing Technologies (481); Construction Planning Built Environment (310); Information Communication Technology (151); Retail Commercial Enterprise (896); Leisure Travel Tourism (180); Business, Administration Law (1554); Other (176)
57
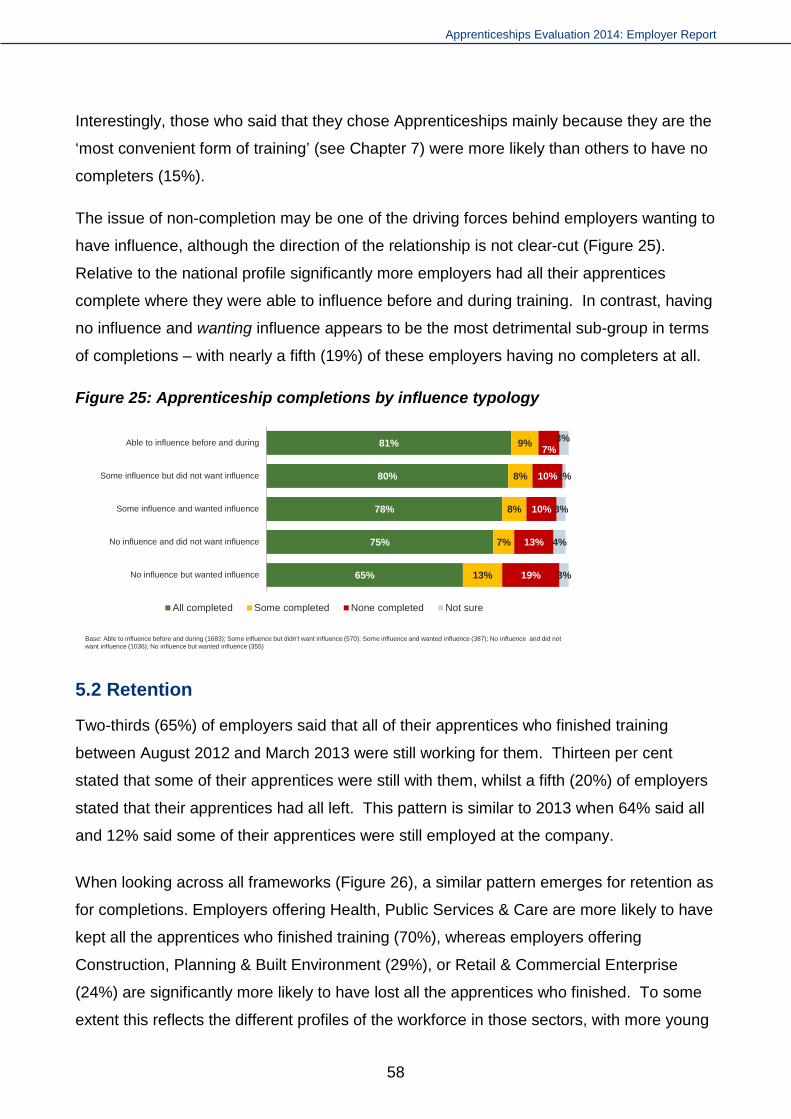
Apprenticeships Evaluation 2014: Employer Report
Interestingly, those who said that they chose Apprenticeships mainly because they are the
‘most convenient form of training’ (see Chapter 7) were more likely than others to have no
completers (15%).
The issue of non-completion may be one of the driving forces behind employers wanting to
have influence, although the direction of the relationship is not clear-cut (Figure 25).
Relative to the national profile significantly more employers had all their apprentices
complete where they were able to influence before and during training. In contrast, having
no influence and wanting influence appears to be the most detrimental sub-group in terms
of completions – with nearly a fifth (19%) of these employers having no completers at all.
Figure 25: Apprenticeship completions by influence typology
5.2 Retention
Two-thirds (65%) of employers said that all of their apprentices who finished training
between August 2012 and March 2013 were still working for them. Thirteen per cent
stated that some of their apprentices were still with them, whilst a fifth (20%) of employers
stated that their apprentices had all left. This pattern is similar to 2013 when 64% said all
and 12% said some of their apprentices were still employed at the company.
When looking across all frameworks (Figure 26), a similar pattern emerges for retention as
for completions. Employers offering Health, Public Services & Care are more likely to have
kept all the apprentices who finished training (70%), whereas employers offering
Construction, Planning & Built Environment (29%), or Retail & Commercial Enterprise
(24%) are significantly more likely to have lost all the apprentices who finished. To some
extent this reflects the different profiles of the workforce in those sectors, with more young
81%
80%
78%
75%
65%
9%
8%
8%
7%
13%
7%
10%
10%
13%
19%
3%
1%
3%
4%
3%
Able to influence before and during
Some influence but did not want influence
Some influence and wanted influence
No influence and did not want influence
No influence but wanted influence
All completed Some completed None completed Not sure
Base: Able to influence before and during (1683); Some influence but didn't want influence (570); Some influence and wanted influence (387); No influence and did not want influence (1036); No influence but wanted influence (355)
58

Apprenticeship Evaluation: Employers
people, more people on fixed-term contracts, and (in the case of Construction, Planning &
the Built Environment) more non-completers.
Figure 26: Apprenticeship retention profile across all frameworks
As with completion, it is likely that retention rates reflect the age of apprentices. Those
employers who only employed apprentices aged 25+ were significantly more likely to have
retained all of them (82%). In contrast, those who hired only 16-18 year olds or 19-24 year
olds were significantly more likely to have retained none (31% and 30% respectively).
Likewise, those offering Level 3 only were more likely to have retained all apprentices
compared to those offering Level 2 only (69% compared with 65%), whereas those
offering Level 2 only were more likely to have retained none compared to those offering
just Level 3 (24% compared with 21%).
Compared to employers who only hired new recruits as apprentices, employers who only
recruited existing staff were likely to have all of them still working for them (70% compared
with 60%). Retention was lower among those who only hired apprentices externally, as
new recruits: one in four (27%) reported that none of their apprentices were still with the
company, compared with 15% of employers who only recruited existing staff. Among
employers who hired new recruits as apprentices, there were no differences (in the
retention profile) between those who hired apprentices on fixed-term contracts and those
who used permanent contracts. For those using fixed term contracts, 59% said that all
65%
69%
69%
62%
67%
61%
59%
65%
53%
61%
13%
17%
16%
16%
11%
15%
13%
7%
18%
7%
20%
8%
14%
19%
22%
23%
26%
27%
27%
28%
2%
6%
1%
3%
1%
2%
3%
Across all Frameworks
Health, Public Services & Care
Other
Business, Administration & Law
Engineering & Manufacturing Technologies
Retail, Commercial Enterprise
Information & Communication Technology
Agriculture, Horticulture & Animal Care
Leisure, Travel & Tourism
Construction, Planning & Built Environment
All still with employer Some still with employer None still with employer Don't know
Base: All Frameworks (5159): Health Public Services & Care (1250); Agriculture Horticulture Animal Care (161); Engineering Manufacturing Technologies (481); Construction Planning Built Environment (310); Information Communication Technology (151); Retail Commercial Enterprise (896); Leisure Travel Tourism (180); Business, Administration Law (1554); Other (176)
59

Apprenticeships Evaluation 2014: Employer Report
their apprentices were still working for them, 14% indicated that some were, and 25%
stated that none were. For those offering permanent contracts, the figures were 62%,
10% and 26% respectively. This contrasts with the findings from the 2014 apprentice
learner survey in which completers who had been employed on temporary contracts were
three times more likely to be unemployed compared to completers who were hired on a
permanent basis (12% versus 4%).
Employers who had at least some of their apprentices leave were asked why they had
done so (Figure 27). By far the most common reason was that apprentices left to get
another / higher paid job (55%), in line with 2013. When looking at the reasons by
recruitment type, there is a slight shift, whereby employers who only recruited existing staff
found that their apprentices were more likely to leave for a new job (66%) compared to
those who only recruited new apprentices (45%). In contrast, those who only recruit as
apprentices were more likely to say that the apprentices were not performing to the
required standard (15% compared with 7% among those who only provided
Apprenticeships to existing employees). In addition, those who only employed new
apprentices were more likely to report they had left because they decided to do something
else (12% compared with 5%) or dropped out (10% compared with 3%). It is probable that
this pattern relates to the difference in age profile between these two types of recruits, with
external recruits more likely to be younger and at the start of their working lives.
Figure 27: Employers’ views on why their apprentices had left
55%
14%
9%
9%
8%
7%
5%
4%
3%
45%
15%
12%
8%
9%
10%
6%
4%
3%
66%
7%
5%
9%
7%
3%
2%
3%
4%
Left for another job / higher paid job
Not performing to the standard we demand
Didn't like the job / wanted to do something else
Moved away / left the area
Personal reasons (family or health issues etc.)
Did not complete the training / dropped out
Their position was no longer needed
Maternity leave
Left for University
All employers with at least someapprentices who are no longerwith themEmployers who only recruit newapprentices
Employers who only recruitexisitng employees
Base: All employers with at least some apprentices who are no longer with them (1586); Employers who only recruited new apprentices (678); Employers who only recruit existing employees
60
Apprenticeship Evaluation: Employers
5.3 Progression to Higher Apprenticeships and other qualifications at Level 4 and above
Awareness of Higher Apprenticeships On the whole, knowledge about Higher Apprenticeships was limited. Only a fifth (22%) of
employers knew a fair amount or a great deal. In contrast, almost half (49%) said that they
knew nothing about them (16%) or had never heard of them (33%). Overall this
widespread lack of knowledge could be expected given that, until recently, Higher
Apprenticeships were mainly offered in a small number of sectors and framework
groupings (predominantly accountancy and social care). Awareness was highest among
employers with high volumes of apprentices (at 38% for those with 10+ apprentices).
Progression from Level 3 Apprenticeships to higher qualifications Of those who had Level 3 apprentices complete their training in the reference period, over
half (54%) said they offered some form of progression to higher level qualifications, and
one in four (24%) had apprentices who had gone on to study these. Although there has
been a small reduction on last year (57% and 27% respectively), comparisons should be
treated with caution as the sequence and wording of the questions relating to higher level
qualifications changed.
Small worksites (with 1-24 employees) were significantly less likely to offer progression to
higher level training (50%). In addition, those employers whose main reason for delivering
Apprenticeships rather than another form of training was because they are ‘low cost/free’
or ‘most convenient’ were also significantly less likely than average to offer higher level
training to their Level 3 completers (48%), as were employers whose main framework was
Construction, Planning & Built Environment (41%), Retail & Commercial Enterprise (45%),
or Leisure, Travel & Tourism (35%).
The types of higher level qualifications that employers offered their Level 3 completers, and why Figure 28 outlines the types of higher level qualifications that are offered and the
proportion of employers who provide them. Compared to 2013, fewer employers who had
Level 3 completers said they offered Higher Apprenticeships (29% now compared with
34% then) but the proportion that had actually provided these was consistent (at 9%
compared with 11%). More employers said they offered ‘some other form of higher level
training leading to a qualification’ than in 2013 (36% compared with 31%). While these
61
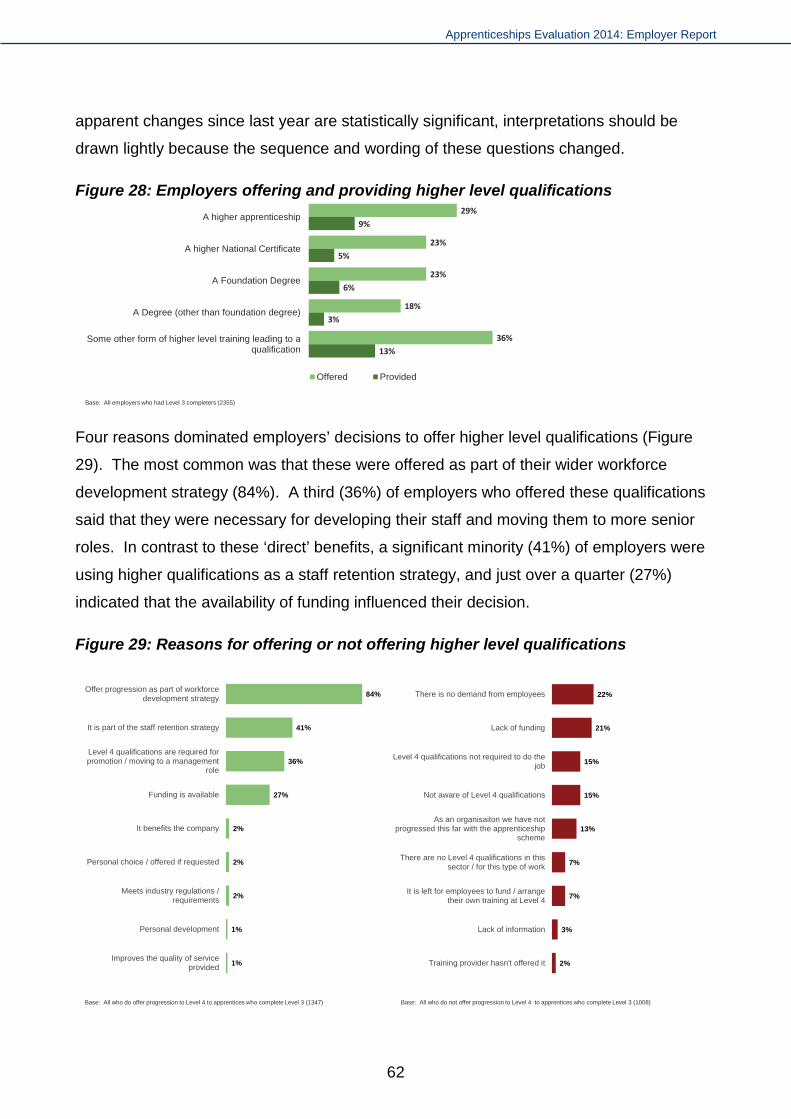
Apprenticeships Evaluation 2014: Employer Report
apparent changes since last year are statistically significant, interpretations should be
drawn lightly because the sequence and wording of these questions changed.
Figure 28: Employers offering and providing higher level qualifications
Four reasons dominated employers’ decisions to offer higher level qualifications (Figure
29). The most common was that these were offered as part of their wider workforce
development strategy (84%). A third (36%) of employers who offered these qualifications
said that they were necessary for developing their staff and moving them to more senior
roles. In contrast to these ‘direct’ benefits, a significant minority (41%) of employers were
using higher qualifications as a staff retention strategy, and just over a quarter (27%)
indicated that the availability of funding influenced their decision.
Figure 29: Reasons for offering or not offering higher level qualifications
29%
23%
23%
18%
36%
9%
5%
6%
3%
13%
A higher apprenticeship
A higher National Certificate
A Foundation Degree
A Degree (other than foundation degree)
Some other form of higher level training leading to aqualification
Offered Provided
Base: All employers who had Level 3 completers (2355)
84%
41%
36%
27%
2%
2%
2%
1%
1%
Offer progression as part of workforcedevelopment strategy
It is part of the staff retention strategy
Level 4 qualifications are required forpromotion / moving to a management
role
Funding is available
It benefits the company
Personal choice / offered if requested
Meets industry regulations /requirements
Personal development
Improves the quality of serviceprovided
Base: All who do offer progression to Level 4 to apprentices who complete Level 3 (1347)
22%
21%
15%
15%
13%
7%
7%
3%
2%
There is no demand from employees
Lack of funding
Level 4 qualifications not required to do thejob
Not aware of Level 4 qualifications
As an organisaiton we have notprogressed this far with the apprenticeship
scheme
There are no Level 4 qualifications in thissector / for this type of work
It is left for employees to fund / arrangetheir own training at Level 4
Lack of information
Training provider hasn't offered it
Base: All who do not offer progression to Level 4 to apprentices who complete Level 3 (1008)
62

Apprenticeship Evaluation: Employers
Moving to why some employers do not offer higher level qualifications, employers’ reasons
could be grouped under three main themes: ‘no demand / need’; ‘financial constraints’;
and ‘lack of knowledge’.
For the ‘no demand / need’ theme, the most common reasons cited by employers was a
lack of demand (22%), followed by the fact that Level 4 qualifications were not required for
employees to do their job (16%), or the company had not progressed this far in their
involvement with Apprenticeship training (13%).
For the ‘financial constraints’ theme, the main reason cited by employers was a lack of
funding (21%). Likewise, 7% of employers stated that it was up to the employees to
arrange / fund their own training at Level 4.
The ‘lack of knowledge’ theme included 16% of employers who were not aware of any
relevant Level 4 qualifications. Smaller numbers of employers said there is a lack of
information about them (3%), or that their training provider had not offered them (2%).
The first and third themes suggest a more passive attitude towards offering training for
higher qualifications (above Level 3) whereby the decision not to offer them is
characterised by the absence of any need, demand, or knowledge etc. In contrast, the
second theme reflects a more deliberate stance by employers not to fund Level 4 training
due to financial constraints.
.
63
Apprenticeships Evaluation 2014: Employer Report
6. Employer satisfaction with Apprenticeships
Key findings Employers remain satisfied with Apprenticeships. Three in five apprentice employers
(62%) rated their main Apprenticeship programme highly (scoring it at 8-10) including
32% who gave it an especially high rating (score of 9-10), indicating they were very
satisfied. Last year these figures were similar at 60% and 30% respectively.
As in 2013, overall satisfaction varied by employer size and main framework. Those
providing the Health, Public Service & Care framework as their main Apprenticeship
were significantly more likely to be very satisfied than employers nationally (68%), and
more so than in 2013 (60%). In contrast, and as found in 2013, employers whose main
framework was Construction, Planning & Built Environment or ICT were less likely than
average to be ‘very satisfied’.
Employers offering Level 3 Apprenticeships only were more likely to be very satisfied
than those who only offered Level 2 (67% compared with 59%). Likewise, employers
who had Level 4 apprentices were more likely to be very satisfied (70%). High levels of
overall satisfaction were also linked to employer influence. Just a quarter of employers
who had no influence but wanted some were ‘very satisfied’ (23%), compared with
three-quarters (74%) of those who had influence before and after the training started.
Looking into satisfaction with various aspects of the Apprenticeship programme,
employers were most satisfied with the quality of the training and assessment, together
with the flexible way these were offered by their training provider. As in 2013, they
were least satisfied with their ability to influence the content, structure or duration of the
Apprenticeships, and with the quality of applicants. However, in the latter case, there
was no difference by the mode of recruitment or type of contract offered.
Just like last year, 35% of employers said they would recommend Apprenticeships
without being asked, however there was a drop (from 47% to 44%) in those who said
they would do so if asked. Thus, while there was a high overall ‘recommendation
score’ of 79%, this fell slightly short of last year’s score of 82%. Those who wanted
influence and did not have any were significantly less likely to recommend without
being asked (24%), and more likely to be neutral or, if asked, to recommend against.
64

Apprenticeship Evaluation: Employers
In this section we explore employers’ views on a range of issues relating to the delivery of
Apprenticeships, including the quality of applicants, their ability to select an appropriate
framework, and the quality of support and training delivery from their training provider.
Overall satisfaction with Apprenticeship training
Employers were asked to provide an overall satisfaction rating for the Apprenticeship
programme from 0-10 (with 0 being ‘very dissatisfied’, 5 being ‘neither satisfied nor
dissatisfied’, and 10 being ‘very satisfied’). Overall, 80% of apprentice employers were
satisfied (scoring it 6 out of 10 or higher) with their main Apprenticeship programme.
Three in five (62%) rated it more highly (scoring it at 8-10) including 32% who gave it an
especially high rating (score of 9-10), indicating they were very satisfied. Last year these
figures were similar at 60% and 30% respectively.
Looking across different types of employer, we find the following patterns which are similar
to those identified in 2013:
• Larger organisations35 (with 100+ employees) had a higher proportion of ‘very
satisfied’ (scoring 8-10) employers (68%) (Figure 30).
• Likewise, employers with higher volumes of apprentices were significantly more
likely to be very satisfied (68% of those with 10 or more apprentices rated their
programme a score of 8-10 overall)
• In a similar vein, worksites which were part of a larger organisation were also
significantly more very satisfied (68% for Head offices and branches). In contrast,
fewer single site organisations were very satisfied (58%).
• Similar to last year, the Level of Apprenticeship offer played a part: Those offering
Level 3 only were more likely to be very satisfied than those who only offered Level
2 (67% compared with 59%). Likewise, employers who had Level 4 apprentices
were more likely to be very satisfied (70%) than those offering Level 2 only (see
Figure 30).
35 Please note – not worksites although the pattern was closely reflected across worksites too.
65
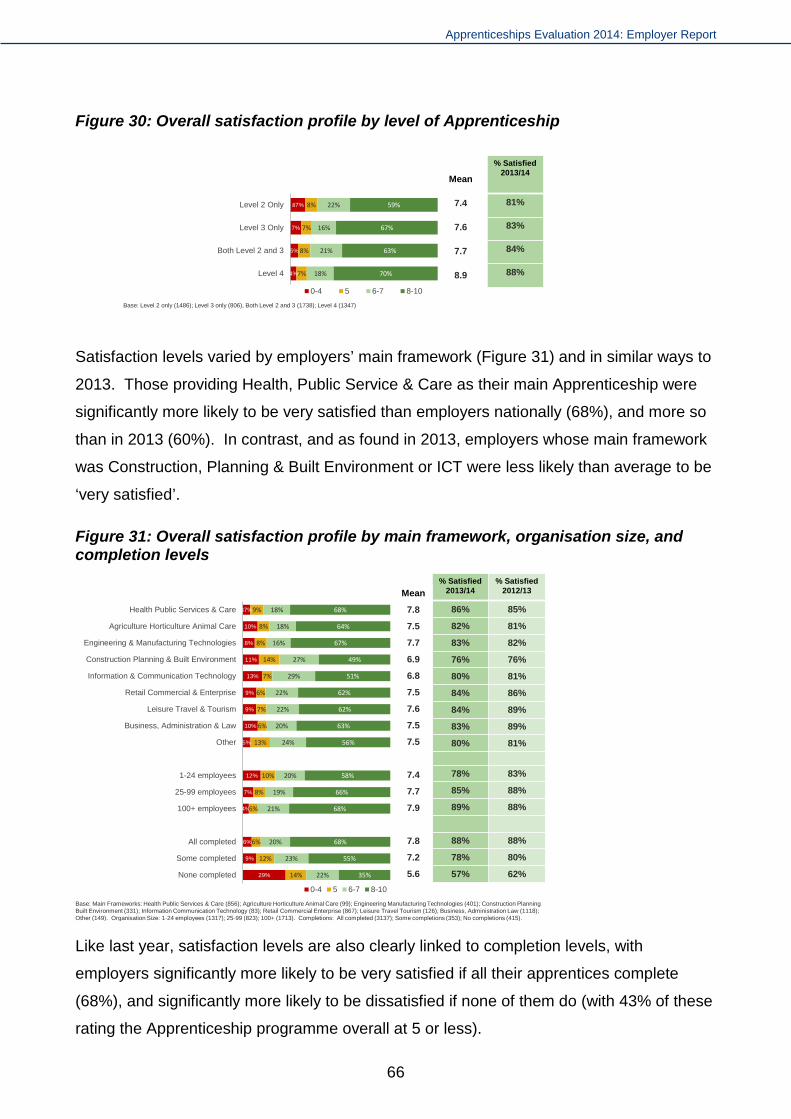
Apprenticeships Evaluation 2014: Employer Report
Figure 30: Overall satisfaction profile by level of Apprenticeship
Satisfaction levels varied by employers’ main framework (Figure 31) and in similar ways to
2013. Those providing Health, Public Service & Care as their main Apprenticeship were
significantly more likely to be very satisfied than employers nationally (68%), and more so
than in 2013 (60%). In contrast, and as found in 2013, employers whose main framework
was Construction, Planning & Built Environment or ICT were less likely than average to be
‘very satisfied’.
Figure 31: Overall satisfaction profile by main framework, organisation size, and completion levels
Like last year, satisfaction levels are also clearly linked to completion levels, with
employers significantly more likely to be very satisfied if all their apprentices complete
(68%), and significantly more likely to be dissatisfied if none of them do (with 43% of these
rating the Apprenticeship programme overall at 5 or less).
87%
7%
5%
4%
8%
7%
8%
7%
22%
16%
21%
18%
59%
67%
63%
70%
Level 2 Only
Level 3 Only
Both Level 2 and 3
Level 4
0-4 5 6-7 8-10
Base: Level 2 only (1486); Level 3 only (806), Both Level 2 and 3 (1738); Level 4 (1347)
% Satisfied 2013/14
81%
83%
84%
88%
Mean
7.4
7.6
7.7
8.9
87%
10%
8%
11%
13%
9%
9%
10%
5%
12%
7%
4%
6%
9%
29%
9%
8%
8%
14%
7%
6%
7%
6%
13%
10%
8%
6%
6%
12%
14%
18%
18%
16%
27%
29%
22%
22%
20%
24%
20%
19%
21%
20%
23%
22%
68%
64%
67%
49%
51%
62%
62%
63%
56%
58%
66%
68%
68%
55%
35%
Health Public Services & Care
Agriculture Horticulture Animal Care
Engineering & Manufacturing Technologies
Construction Planning & Built Environment
Information & Communication Technology
Retail Commercial & Enterprise
Leisure Travel & Tourism
Business, Administration & Law
Other
1-24 employees
25-99 employees
100+ employees
All completed
Some completed
None completed
0-4 5 6-7 8-10
Base: Main Frameworks: Health Public Services & Care (856); Agriculture Horticulture Animal Care (99); Engineering Manufacturing Technologies (401); Construction Planning Built Environment (331); Information Communication Technology (83); Retail Commercial Enterprise (867); Leisure Travel Tourism (126); Business, Administration Law (1118); Other (149). Organisation Size: 1-24 employees (1317); 25-99 (823); 100+ (1713). Completions: All completed (3137); Some completions (353); No completions (415).
% Satisfied 2013/14
% Satisfied 2012/13
86% 85%
82% 81%
83% 82%
76% 76%
80% 81%
84% 86%
84% 89%
83% 89%
80% 81%
78% 83%
85% 88%
89% 88%
88% 88%
78% 80%
57% 62%
Mean
7.8
7.5
7.7
6.9
6.8
7.5
7.6
7.5
7.5
7.4
7.7
7.9
7.8
7.2
5.6
66
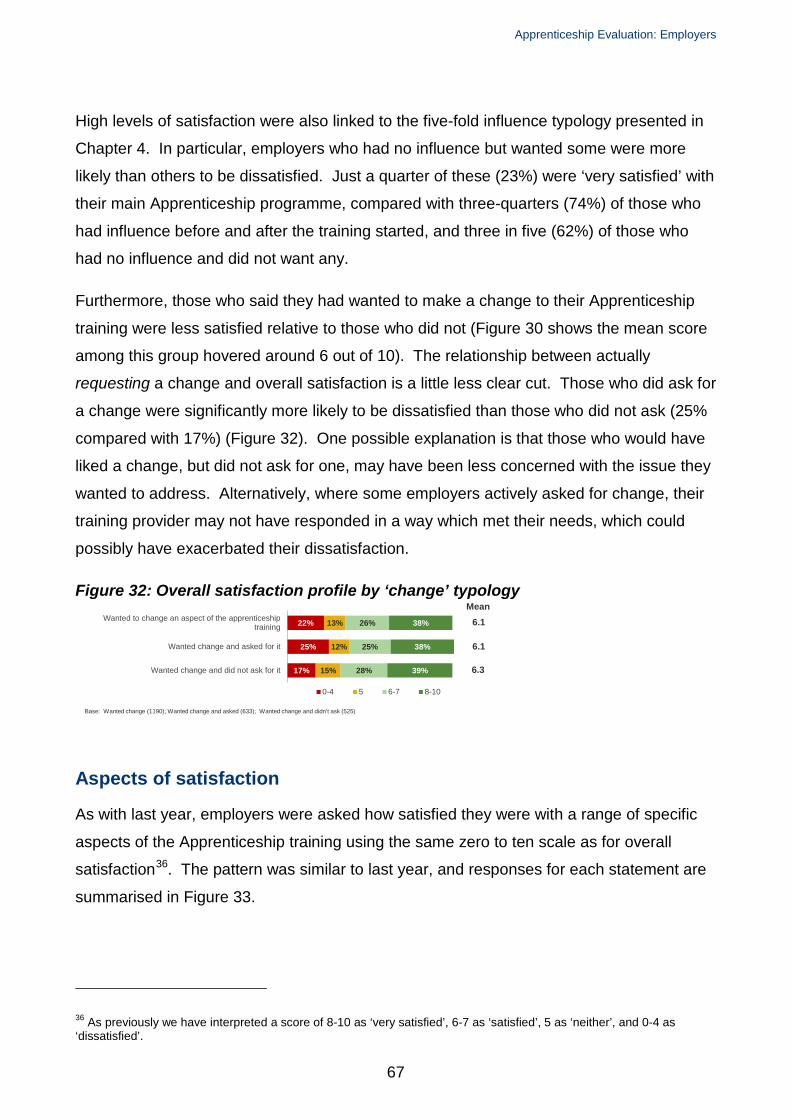
Apprenticeship Evaluation: Employers
High levels of satisfaction were also linked to the five-fold influence typology presented in
Chapter 4. In particular, employers who had no influence but wanted some were more
likely than others to be dissatisfied. Just a quarter of these (23%) were ‘very satisfied’ with
their main Apprenticeship programme, compared with three-quarters (74%) of those who
had influence before and after the training started, and three in five (62%) of those who
had no influence and did not want any.
Furthermore, those who said they had wanted to make a change to their Apprenticeship
training were less satisfied relative to those who did not (Figure 30 shows the mean score
among this group hovered around 6 out of 10). The relationship between actually
requesting a change and overall satisfaction is a little less clear cut. Those who did ask for
a change were significantly more likely to be dissatisfied than those who did not ask (25%
compared with 17%) (Figure 32). One possible explanation is that those who would have
liked a change, but did not ask for one, may have been less concerned with the issue they
wanted to address. Alternatively, where some employers actively asked for change, their
training provider may not have responded in a way which met their needs, which could
possibly have exacerbated their dissatisfaction.
Figure 32: Overall satisfaction profile by ‘change’ typology
Aspects of satisfaction
As with last year, employers were asked how satisfied they were with a range of specific
aspects of the Apprenticeship training using the same zero to ten scale as for overall
satisfaction36. The pattern was similar to last year, and responses for each statement are
summarised in Figure 33.
36 As previously we have interpreted a score of 8-10 as ‘very satisfied’, 6-7 as ‘satisfied’, 5 as ‘neither’, and 0-4 as ‘dissatisfied’.
22%
25%
17%
13%
12%
15%
26%
25%
28%
38%
38%
39%
Wanted to change an aspect of the apprenticeshiptraining
Wanted change and asked for it
Wanted change and did not ask for it
0-4 5 6-7 8-10
6.1
6.3
6.1
Base: Wanted change (1190); Wanted change and asked (633); Wanted change and didn’t ask (525)
Mean
67

Apprenticeships Evaluation 2014: Employer Report
Figure 33: Satisfaction profile for specific aspects of Apprenticeship training
Variations in responses to each statement are explored in more detail in the following
sections. It should be noted that there were some general patterns, which are not reported
in detail:
• There was very little difference when looking across the level of the Apprenticeship,
however employers offering both Levels 2 and 3 were slightly more likely to say
they were ‘very satisfied’, and so too were employers with Level 4 apprentices.
• Employers tended to be more dissatisfied if they either wanted to change
something about the Apprenticeships or if they wanted influence but did not have
any.
Quality of the assessment carried out by the provider
• There was little variation by size of employer for this aspect of Apprenticeship
training, with the only difference being that employers with 1-24 employees were
more likely to say they were dissatisfied (8%).
7%
8%
9%
12%
8%
9%
15%
17%
5%
7%
7%
7%
11%
13%
16%
14%
19%
19%
18%
19%
25%
23%
25%
30%
64%
64%
64%
60%
52%
51%
39%
34%
5%
2%
2%
2%
5%
4%
6%
6%
The quality of the assessment carried out bythe provider
How the provider offered training /assessment in a flexible way to meet your
needs
The quality of the training delivered by theprovider
The support and communication from theprovider
Your ability to select an apprenticeshipframework relevant to your needs
The amount and complexity of anypaperwork and bureaucracy required of you
as an employer
Your ability to influence the structure,content, delivery and duration of the
apprenticeship training
The quality of applicants for apprenticeshippositions
Dissatisfied Neither satisfied nor dissatisfied Satisfied Very satisfied Not stated
Base: All (4030) except for + = All who se providers train and/or assess (3995); * = All who recruit externally (1936); o = All whose providers train (3843);
% Satisfied 2013/14
% Satisfied 2012/13
83%+ n/a
83%+ 84%
82%o 81%
79%o 80%
76% 78%
74% 72%
64% 66%
64%* 66%
7% 5% 19% 64% 5%The quality of the assessment carried out bythe provider
68
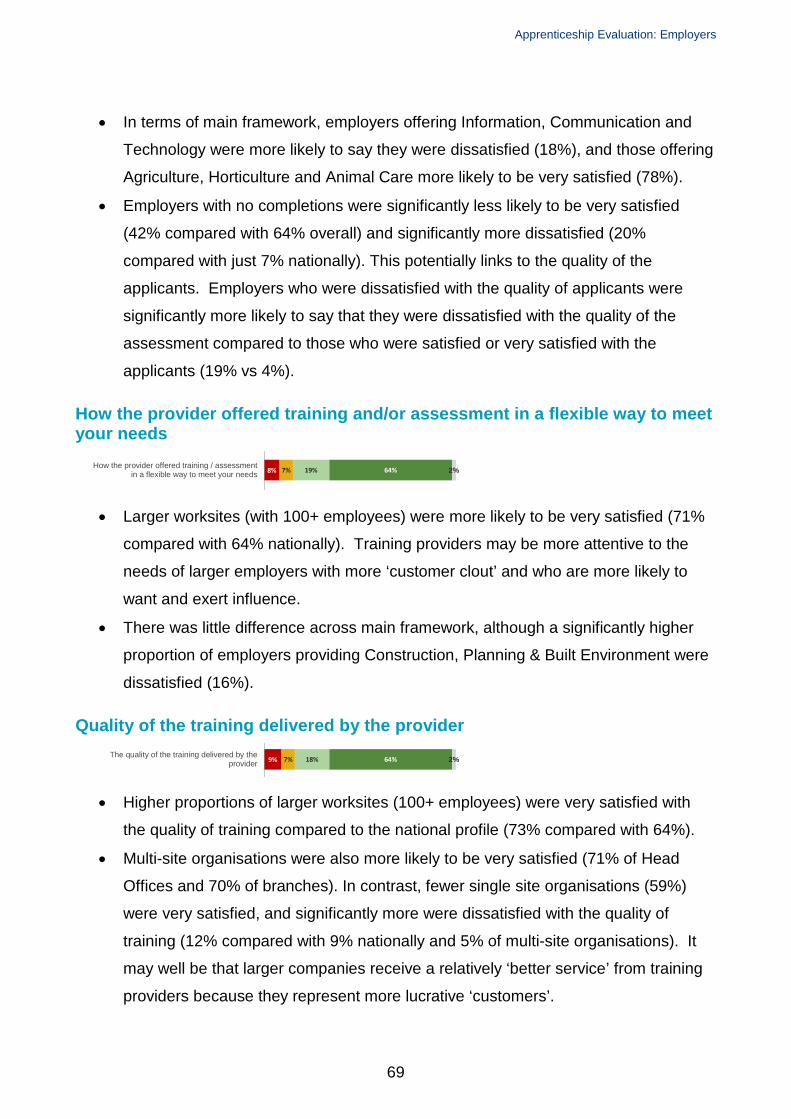
Apprenticeship Evaluation: Employers
• In terms of main framework, employers offering Information, Communication and
Technology were more likely to say they were dissatisfied (18%), and those offering
Agriculture, Horticulture and Animal Care more likely to be very satisfied (78%).
• Employers with no completions were significantly less likely to be very satisfied
(42% compared with 64% overall) and significantly more dissatisfied (20%
compared with just 7% nationally). This potentially links to the quality of the
applicants. Employers who were dissatisfied with the quality of applicants were
significantly more likely to say that they were dissatisfied with the quality of the
assessment compared to those who were satisfied or very satisfied with the
applicants (19% vs 4%).
How the provider offered training and/or assessment in a flexible way to meet your needs
• Larger worksites (with 100+ employees) were more likely to be very satisfied (71%
compared with 64% nationally). Training providers may be more attentive to the
needs of larger employers with more ‘customer clout’ and who are more likely to
want and exert influence.
• There was little difference across main framework, although a significantly higher
proportion of employers providing Construction, Planning & Built Environment were
dissatisfied (16%).
Quality of the training delivered by the provider
• Higher proportions of larger worksites (100+ employees) were very satisfied with
the quality of training compared to the national profile (73% compared with 64%).
• Multi-site organisations were also more likely to be very satisfied (71% of Head
Offices and 70% of branches). In contrast, fewer single site organisations (59%)
were very satisfied, and significantly more were dissatisfied with the quality of
training (12% compared with 9% nationally and 5% of multi-site organisations). It
may well be that larger companies receive a relatively ‘better service’ from training
providers because they represent more lucrative ‘customers’.
8% 7% 19% 64% 2%
How the provider offered training / assessmentin a flexible way to meet your needs
9% 7% 18% 64% 2%
The quality of the training delivered by theprovider
69
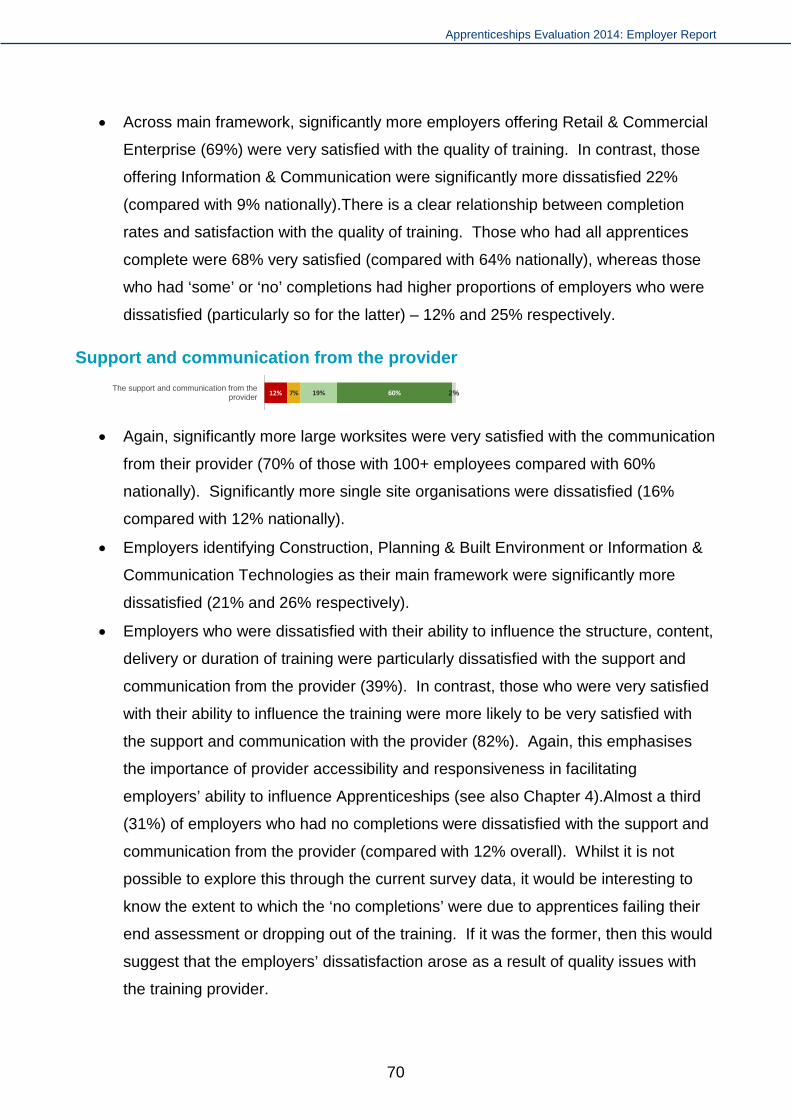
Apprenticeships Evaluation 2014: Employer Report
• Across main framework, significantly more employers offering Retail & Commercial
Enterprise (69%) were very satisfied with the quality of training. In contrast, those
offering Information & Communication were significantly more dissatisfied 22%
(compared with 9% nationally).There is a clear relationship between completion
rates and satisfaction with the quality of training. Those who had all apprentices
complete were 68% very satisfied (compared with 64% nationally), whereas those
who had ‘some’ or ‘no’ completions had higher proportions of employers who were
dissatisfied (particularly so for the latter) – 12% and 25% respectively.
Support and communication from the provider
• Again, significantly more large worksites were very satisfied with the communication
from their provider (70% of those with 100+ employees compared with 60%
nationally). Significantly more single site organisations were dissatisfied (16%
compared with 12% nationally).
• Employers identifying Construction, Planning & Built Environment or Information &
Communication Technologies as their main framework were significantly more
dissatisfied (21% and 26% respectively).
• Employers who were dissatisfied with their ability to influence the structure, content,
delivery or duration of training were particularly dissatisfied with the support and
communication from the provider (39%). In contrast, those who were very satisfied
with their ability to influence the training were more likely to be very satisfied with
the support and communication with the provider (82%). Again, this emphasises
the importance of provider accessibility and responsiveness in facilitating
employers’ ability to influence Apprenticeships (see also Chapter 4).Almost a third
(31%) of employers who had no completions were dissatisfied with the support and
communication from the provider (compared with 12% overall). Whilst it is not
possible to explore this through the current survey data, it would be interesting to
know the extent to which the ‘no completions’ were due to apprentices failing their
end assessment or dropping out of the training. If it was the former, then this would
suggest that the employers’ dissatisfaction arose as a result of quality issues with
the training provider.
12% 7% 19% 60% 2%
The support and communication from theprovider
70
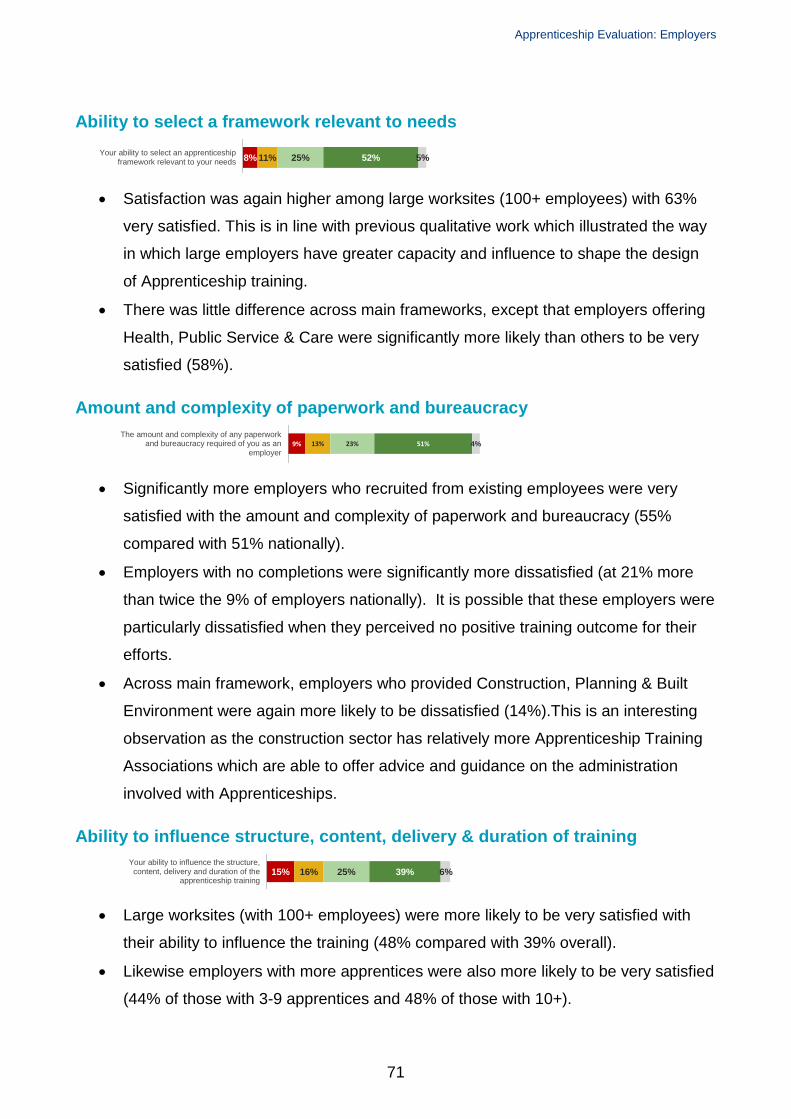
Apprenticeship Evaluation: Employers
Ability to select a framework relevant to needs
• Satisfaction was again higher among large worksites (100+ employees) with 63%
very satisfied. This is in line with previous qualitative work which illustrated the way
in which large employers have greater capacity and influence to shape the design
of Apprenticeship training.
• There was little difference across main frameworks, except that employers offering
Health, Public Service & Care were significantly more likely than others to be very
satisfied (58%).
Amount and complexity of paperwork and bureaucracy
• Significantly more employers who recruited from existing employees were very
satisfied with the amount and complexity of paperwork and bureaucracy (55%
compared with 51% nationally).
• Employers with no completions were significantly more dissatisfied (at 21% more
than twice the 9% of employers nationally). It is possible that these employers were
particularly dissatisfied when they perceived no positive training outcome for their
efforts.
• Across main framework, employers who provided Construction, Planning & Built
Environment were again more likely to be dissatisfied (14%).This is an interesting
observation as the construction sector has relatively more Apprenticeship Training
Associations which are able to offer advice and guidance on the administration
involved with Apprenticeships.
Ability to influence structure, content, delivery & duration of training
• Large worksites (with 100+ employees) were more likely to be very satisfied with
their ability to influence the training (48% compared with 39% overall).
• Likewise employers with more apprentices were also more likely to be very satisfied
(44% of those with 3-9 apprentices and 48% of those with 10+).
8% 11% 25% 52% 5%
Your ability to select an apprenticeshipframework relevant to your needs
9% 13% 23% 51% 4%
The amount and complexity of any paperworkand bureaucracy required of you as an
employer
15% 16% 25% 39% 6%
Your ability to influence the structure,content, delivery and duration of the
apprenticeship training
71

Apprenticeships Evaluation 2014: Employer Report
• Findings by main framework were fairly consistent although employers providing
Construction, Planning & Built Environment were again more likely to be dissatisfied
(25%).
• Those who wanted to change something were more likely to be dissatisfied with
their ability to influence training compared to those who did not want change (33%
compared with 8% respectively).
• Employers with Level 4 apprentices were more likely to say they were very satisfied
with their ability to influence training (44%) and less likely to be dissatisfied (10%).
This may be an upshot of employer involvement in the Government’s Higher
Apprenticeship Fund, which provided funding to the development of certain Level 4
frameworks.
Quality of applicants
• Employers overall remained least satisfied with this aspect of Apprenticeships.
Relatively more large worksites (100+ employees) were very satisfied with the
quality of applicants (42%). In contrast, worksites with 1-24 employees were
significantly more dissatisfied (19%). It is likely that larger worksites attract more
applications in general, and they may well be more attractive to apprentices who
wish to progress to further training (as outlined in Chapter 5).
• Interestingly, there was no association between employers’ satisfaction with the
quality of applicants and the age of the apprentices they recruited.
• Similarly, there was no difference between those who only recruited new
apprentices and those who recruited both new apprentices and existing staff.
Neither was there any difference when looking at the type of contract offered (i.e.
fixed-term versus permanent).
• Satisfaction was generally consistent across main frameworks too, except that
employers providing Retail & Commercial Enterprise were significantly more likely
to be dissatisfied (25%).
• Employers with no Apprenticeship completions were significantly more likely to be
dissatisfied with the quality of applicants (31%) compared to those who had some
apprentices complete (22%) or all apprentices complete (13%).
17% 14% 30% 34% 6%
The quality of applicants for apprenticeshippositions
72

Apprenticeship Evaluation: Employers
Do employers recommend Apprenticeships as a form of training?
Similar to last year’s survey, employers were asked whether they would recommend
Apprenticeships to other employers. Just like last year, 35% said they would recommend
Apprenticeships without being asked, however there was a drop (from 47% to 44%) in
those who said they would do so if asked. Thus, while this year’s overall ‘recommendation
score’ remained high at 79%, it was below that of 2013 (82%). Only three per cent of
employers said they would recommend against Apprenticeships, whilst 18% would be
neutral (similar to the findings last year).
Advocacy was statistically higher for larger worksites and those with more apprentices.
There was very little difference by main framework, although employers providing
Business, Administration and Law were more likely to recommend without being asked
(40% compared with 35% nationally). Similarly, there was little variation when looking at
the level of the Apprenticeships, although employers offering both Level 2 and Level 3
were more likely to recommend (83% saying they would recommend either ‘without being
asked’ or ‘if asked’), and employers with Level 4 apprentices were more likely to
recommend without being asked (39%).
In terms of the influence typology outlined in Chapter 4, the key difference was for those
who wanted influence and did not have any. They were significantly less likely to
recommend without being asked (24%), and more likely to be neutral or to recommend
against if asked (Figure 34).
73
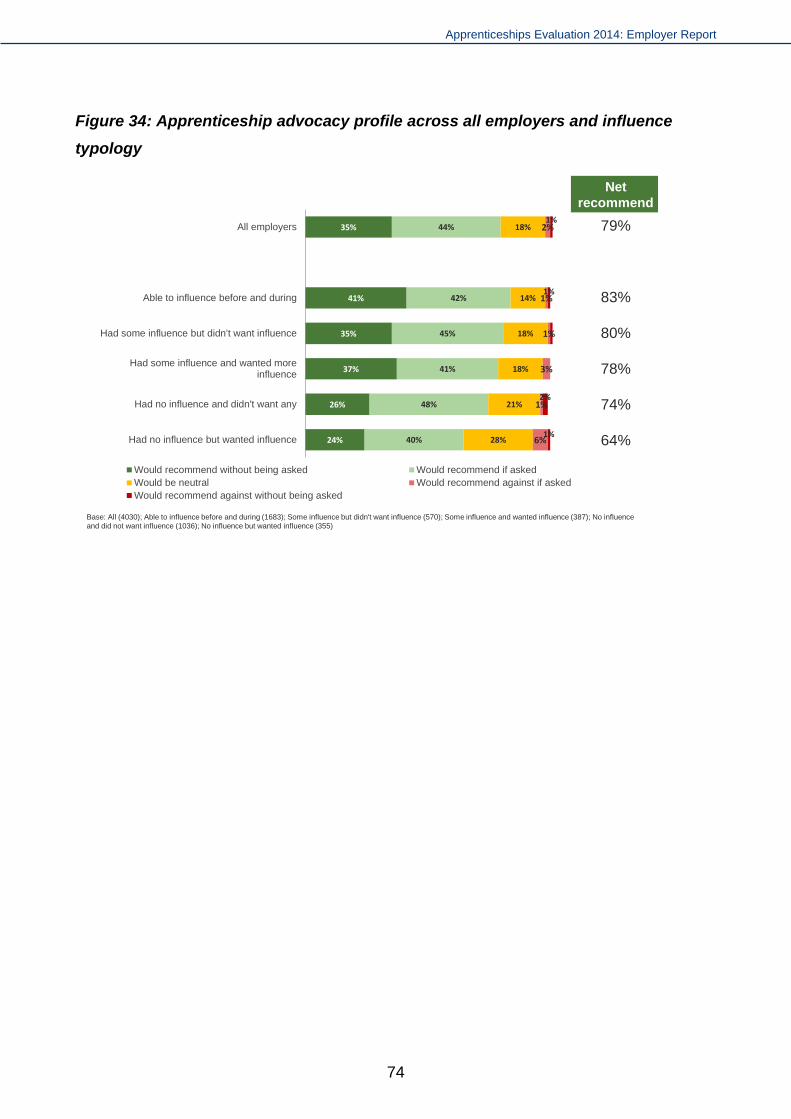
Apprenticeships Evaluation 2014: Employer Report
Figure 34: Apprenticeship advocacy profile across all employers and influence typology
35%
41%
35%
37%
26%
24%
44%
42%
45%
41%
48%
40%
18%
14%
18%
18%
21%
28%
2%
1%
1%
3%
1%
6%
1%
1%
2%
1%
All employers
Able to influence before and during
Had some influence but didn't want influence
Had some influence and wanted moreinfluence
Had no influence and didn't want any
Had no influence but wanted influence
Would recommend without being asked Would recommend if askedWould be neutral Would recommend against if askedWould recommend against without being asked
Net recommend
79%
83%
80%
78%
74%
64%
Base: All (4030); Able to influence before and during (1683); Some influence but didn't want influence (570); Some influence and wanted influence (387); No influence and did not want influence (1036); No influence but wanted influence (355)
74
Apprenticeship Evaluation: Employers
7. Impacts of Apprenticeships Key findings
Employers who were aware that at least some of their trainees had been doing an
Apprenticeship were asked why they had opted for Apprenticeships, relative to other
forms of training available. Business relevance was the most common reason
(mentioned by 25%) while the least common was that Apprenticeships were low cost or
free (mentioned by 13%).
Different reasons for providing Apprenticeships were associated with different levels of
overall satisfaction. Of the five reasons presented, the two which were associated with
the highest levels of satisfaction were ‘offering Apprenticeship training because it is the
best way of improving recruitment and retention’ (71% of these employers were very
satisfied) or because it is ‘the most relevant form of training to their business’ (70%
very satisfied).
These two reasons for providing Apprenticeships were reflected in anticipated and
achieved benefits. Maintaining or improving future skill levels in the business was the
most commonly anticipated benefit (95%), followed by improving product/service
quality and improving productivity (mentioned by over 80% of employers).
Almost nine in ten employers who had hoped for benefits received them, with the most
‘successful’ being ‘improving staff morale’ (91% of those hoping to achieve this said it
was realised), ‘improving or maintaining future skills levels’ (89%), ‘improving
productivity’ (89%) and ‘improving product or service quality’ (86%). In contrast, the
benefits which employers felt were least realised (though still accounting for a majority
of those expecting them) were ‘winning business’ (73% of employers hoping to achieve
this say it was realised), and ‘ability to attract good staff’ (79%) – both of which were in
line with 2013.
In this section we explore the extent to which employers have offered other forms of
training as well as Apprenticeships. We then look at the reasons why employers have
chosen to provide Apprenticeship programmes versus other forms of work-based training.
We also examine the benefits that employers expected to get from providing
Apprenticeships and the extent to which these have been realised.
75

Apprenticeships Evaluation 2014: Employer Report
Extent of other Level 2 and 3 training offered
Off the job training Almost two-thirds (64%) of worksites said that they had arranged or funded other forms of
off-the-job training or development in the past 12 months. This was far more common at
larger worksites employing 100+ staff (87%) than smaller worksites with 1-24 staff (57%).
It was also significantly more likely at Head Offices (81%) than branches (63%) or single
site organisations (62%).
Looking across main framework, more employers providing Health, Public Services & Care
provided other off-the-job training compared to the national profile (77%), whilst employers
providing Construction, Planning & Built Environment or Retail & Commercial Enterprise
were significantly less likely to have done so (57% and 49% respectively).
On the job training The pattern of providing on-the-job training (in addition to Apprenticeships) closely reflects
that for off-the-job training. Just over two thirds (68%) of employers offered other forms of
on-the-job training and again this was more prevalent at larger worksites (90% of those
with 100+ staff compared with 60% of workplaces in the smallest category).
Providing other on-the-job training was also significantly more common in non-profit
organisations (81% compared with 68% nationally), and where employers recruited both
new apprentices and existing employees (79%).
Employers who had no apprentice completions were significantly more likely to say that
they did not offer any other on-the-job training (40% compared with 31% nationally).
Given that this group were also most likely to be dissatisfied with training providers, they
may be reticent to source further training.
Again, there was no association between the provision of additional on-the-job training and
employer influence. However, those employers who wanted to change aspects of the
Apprenticeship training and did ask were significantly more likely to have provided other
on-the-job training (73%). This suggests those who ask may have a greater level of
engagement with training in general compared to those who do not.
By main framework, more Health, Public Services & Care employers than average
provided other on-the-job training (82%), whilst employers whose main frameworks were
76

Apprenticeship Evaluation: Employers
Engineering & Manufacturing Technologies (38%), Construction, Planning & Built
Environment (42%), or Retail & Commercial Enterprise (43%) were significantly less likely
to have done so. Possible explanations for this observation might be that employers in the
Health and Social Care sector may require employees to engage in continual professional
development to a greater extent, or this sector may see more frequent legislative or health
and safety changes which require additional training.
Achieving other Level 2 and 3 Qualifications Those employers who had arranged or funded other forms of (on- or off-the-job) training
over the past 12 months were asked if this training had led to any Level 2 or 3
qualifications (other than those associated with Apprenticeships). In total, 47% of
employers said that the training had led to other qualifications, whilst the remaining
employers (53%) indicated that it had not. The breakdown of achievements by level is
shown below in Table 3, and it was fairly evenly split across Levels 2 and 3.
Table 3: Achievement of Level 2 and 3 qualifications through training other than Apprenticeships
Base Level 2 only
Level 2
Level 3 only
Level 3
Both Levels 2 and 3 None
Size of worksite
1-24 employees 1,435 11% 29% 9% 27% 18% 57%
25- 99 employees 1,160 12% 38% 7% 33% 26% 49%
100+ employees 641 8% 48% 9% 49% 40% 37%
Total (All employers who had arranged other training)
3,263 11% 34% 9% 32% 23% 53%
Larger worksites (100+ employees) were more likely to have provided training that led to
qualifications at both levels (40%), whilst smaller worksites (1-24 employees) and single
site organisations were significantly more likely to have had none (57% and 58%
respectively).
Unsurprisingly (given the profile of additional training provision), employers that identified
Health, Public Services & Care as their main framework were more likely to have provided
other qualifications at both levels (35%), and those providing Construction, Planning &
77

Apprenticeships Evaluation 2014: Employer Report
Built Environment were more likely to have provided none (64%) - perhaps due to the
dominance of Apprenticeships versus other forms of training in the construction sector.
Why use Apprenticeship training versus other forms of training?
Understanding why employers chose to use Apprenticeships is an important focus. In
2013, BIS commissioned a qualitative report37 which identified a typology of different types
of motivation for providing Apprenticeships, as opposed to other forms of training. To
quantify the relative prevalence of these views, this typology was distilled into five
statements, which were tested in this year’s survey questionnaire. Employers who were
aware38 that at least some of their trainees had been doing an Apprenticeship were asked
why they had opted for Apprenticeships, relative to other forms of training available to
them. They could only select one answer from the following list:
1) Apprenticeships are the required form of training in this industry / occupation
2) Apprenticeships are most relevant to the needs of the business
3) Apprenticeships cost less than the alternatives / are free.
4) Apprenticeships are most convenient because the training provider handles most of the
recruitment and/or administration
5) Apprenticeships are the best way to aid recruitment and retention
On the whole, views were fairly evenly represented across employers; with business
relevance being the most common reason (mentioned by 25%) and Apprenticeships being
provided at low cost or free being the least common (mentioned by 13%).
37 Hogarth T., Adams L., Gambin L., Garnett E. and M. Winterbotham (2014) 'Employer Routed Funding: Employer Responses to Funding Reform', BIS Research Paper 161. London: Department for Business, Innovation and Skills. 38 62% of the employer population versus 37% who were not aware (see Chapter 2).
78

Apprenticeship Evaluation: Employers
Figure 35: Reasons for using Apprenticeships across all employers, and by size of worksite, and employer type
There was little difference by size of organisation, but some difference when looking at
size of worksite. Whilst the reasons given by small worksites (<50 employees) typically did
not differ from the national profile, larger worksites (250+ employees) were significantly
more likely to state Apprenticeships were relevant to business needs (35%) or the best
way to aid recruitment and retention (38%). Larger sites were also less likely to say
Apprenticeships were chosen for their convenience (because the training provider handled
most of the recruitment and/or administration, mentioned by 8%) or that Apprenticeships
were the required form of training in this industry / occupation (again, mentioned by 8%).
Private sector organisations looking to make a profit were more likely to say
Apprenticeships were the required form of training in their industry / occupation (19%),
whilst non-profit organisations were significantly more likely to say Apprenticeships were
the best way to aid recruitment and retention (26%). There was no statistically significant
difference in their propensity to outline cost as a driver. In contrast, whilst there was little
difference in terms of recruitment-related reasons, those employers who only recruited
existing employees were more likely to state they chose Apprenticeships due to cost
(17%). Relative to the national profile, employers who only recruit existing employees are
more likely to operate in the following sectors: Wholesale, Retail and Motor Repair (16%
vs 14%); Accommodation and food services (16% vs 10%), and Human Health and Social
17%
18%
13%
9%
19%
16%
10%
19%
8%
25%
24%
28%
35%
24%
26%
26%
25%
27%
13%
13%
14%
8%
12%
13%
14%
12%
16%
21%
22%
21%
8%
22%
19%
19%
22%
18%
21%
20%
21%
38%
20%
21%
25%
19%
26%
3%
3%
3%
2%
3%
5%
6%
3%
5%
All employers
Size of worksite
<50 employees
50-249 employees
250+ employees
Size of organisation
<50 employees
50-249 employees
250+ employees
Private sector organisations
Non-profit organisations
Required form of training in this industry / occupationMost relevant to the needs of the business2Cost less than the alternatives / are freeMost convenient because the training provider handles most of the recruitment and/or administrationBest way to aid recruitment and retentionOther / Don't know
Base: All employers who are aware that training was an Apprenticeship (2513); Size of worksite - <50 (1715); 50-249 (530); 250+ (274). Size of organisation - <50 (1234); 50-249 (451); 250+ (762). Private sector (1936); Non-profit (577)
79

Apprenticeships Evaluation 2014: Employer Report
Work (29% vs 23%). Whilst employers in the Human Health and Social Work sector are
more likely to arrange or fund training in addition to Apprenticeships, employers based in
the other two sectors are significantly less likely to. This suggests that employers in these
sectors may be more reluctant to train existing staff if they have to fully fund the training
themselves.
There were some variations by main framework (Figure 36). Employers citing Engineering
& Manufacturing Technologies were more likely to say that Apprenticeships were the most
relevant training to address the needs of their business (32%) and the required form of
training in their sector (22%). Similarly, significantly more employers providing
Construction, Planning & Built Environment (39%) or Retail & Commercial Enterprise
(25%) stated that Apprenticeships were the required form of training in their sector.
Figure 36: Reasons for using Apprenticeships across main framework provided
Employers whose main Apprenticeship framework was in Business, Administration & Law
were more likely than most other employers to have selected Apprenticeships because of
convenience (27%), or because they regarded Apprenticeships as the best way to aid
recruitment and retention (25%). Employers whose main frameworks were Business,
Administration & Law (18%) or Information & Communication Technologies (27%) were
17%
14%
13%
22%
39%
1%
25%
11%
3%
16%
25%
29%
28%
32%
20%
18%
26%
17%
23%
17%
13%
14%
14%
6%
5%
27%
9%
19%
18%
11%
21%
18%
20%
18%
16%
31%
17%
27%
27%
26%
21%
20%
16%
21%
14%
20%
19%
19%
25%
24%
3%
5%
9%
1%
6%
3%
4%
7%
4%
6%
All employers
Health, Public Services & SocialCare
Agriculture, Horticulture and AnimalCare
Engineering and ManufacturingTechnologies
Construction, Planning and BuiltEnvironment
Information, Communication andTechnology
Retail and Commercial Enterprise
Leisure, Travel and Tourism
Business, Administration and Law
Other
Required form of training in this industry / occupationMost relevant to the needs of the businessCost less than the alternatives / are freeMost convenient because the training provider handles most of the recruitment and/or administrationBest way to aid recruitment and retentionOther / Don't know
Base: All employers who are aware that training was an Apprenticeship (2513); Main sector subject area: Health Public Services & Care (667); Agriculture Horticulture Animal Care (112); Engineering Manufacturing Technologies (319); Construction Planning Built Environment (248); Information Communication Technology (52); Retail Commercial Enterprise (362); Leisure Travel Tourism (99); Business, Administration Law (577); Other (71).
80
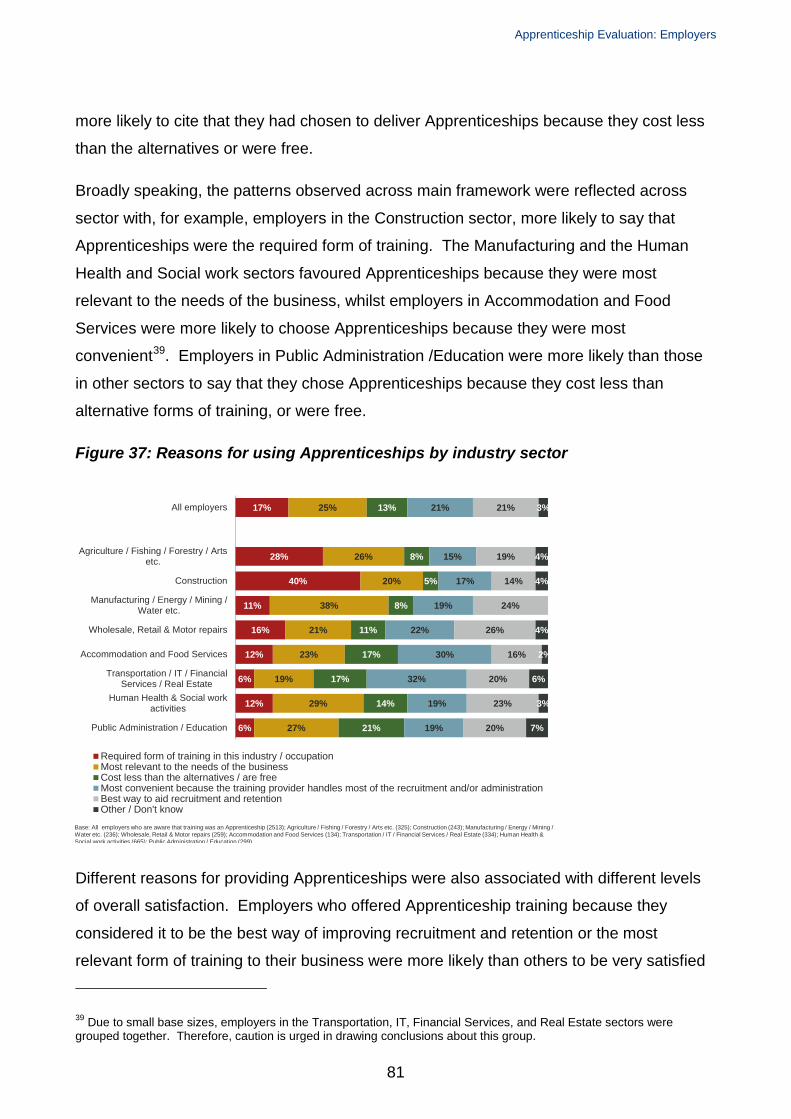
Apprenticeship Evaluation: Employers
more likely to cite that they had chosen to deliver Apprenticeships because they cost less
than the alternatives or were free.
Broadly speaking, the patterns observed across main framework were reflected across
sector with, for example, employers in the Construction sector, more likely to say that
Apprenticeships were the required form of training. The Manufacturing and the Human
Health and Social work sectors favoured Apprenticeships because they were most
relevant to the needs of the business, whilst employers in Accommodation and Food
Services were more likely to choose Apprenticeships because they were most
convenient39. Employers in Public Administration /Education were more likely than those
in other sectors to say that they chose Apprenticeships because they cost less than
alternative forms of training, or were free.
Figure 37: Reasons for using Apprenticeships by industry sector
Different reasons for providing Apprenticeships were also associated with different levels
of overall satisfaction. Employers who offered Apprenticeship training because they
considered it to be the best way of improving recruitment and retention or the most
relevant form of training to their business were more likely than others to be very satisfied
39 Due to small base sizes, employers in the Transportation, IT, Financial Services, and Real Estate sectors were grouped together. Therefore, caution is urged in drawing conclusions about this group.
17%
28%
40%
11%
16%
12%
6%
12%
6%
25%
26%
20%
38%
21%
23%
19%
29%
27%
13%
8%
5%
8%
11%
17%
17%
14%
21%
21%
15%
17%
19%
22%
30%
32%
19%
19%
21%
19%
14%
24%
26%
16%
20%
23%
20%
3%
4%
4%
4%
2%
6%
3%
7%
All employers
Agriculture / Fishing / Forestry / Artsetc.
Construction
Manufacturing / Energy / Mining /Water etc.
Wholesale, Retail & Motor repairs
Accommodation and Food Services
Transportation / IT / FinancialServices / Real Estate
Human Health & Social workactivities
Public Administration / Education
Required form of training in this industry / occupationMost relevant to the needs of the businessCost less than the alternatives / are freeMost convenient because the training provider handles most of the recruitment and/or administrationBest way to aid recruitment and retentionOther / Don't know
Base: All employers who are aware that training was an Apprenticeship (2513); Agriculture / Fishing / Forestry / Arts etc. (325); Construction (243); Manufacturing / Energy / Mining / Water etc. (236); Wholesale, Retail & Motor repairs (259); Accommodation and Food Services (134); Transportation / IT / Financial Services / Real Estate (334); Human Health & Social work activities (665); Public Administration / Education (299)
81
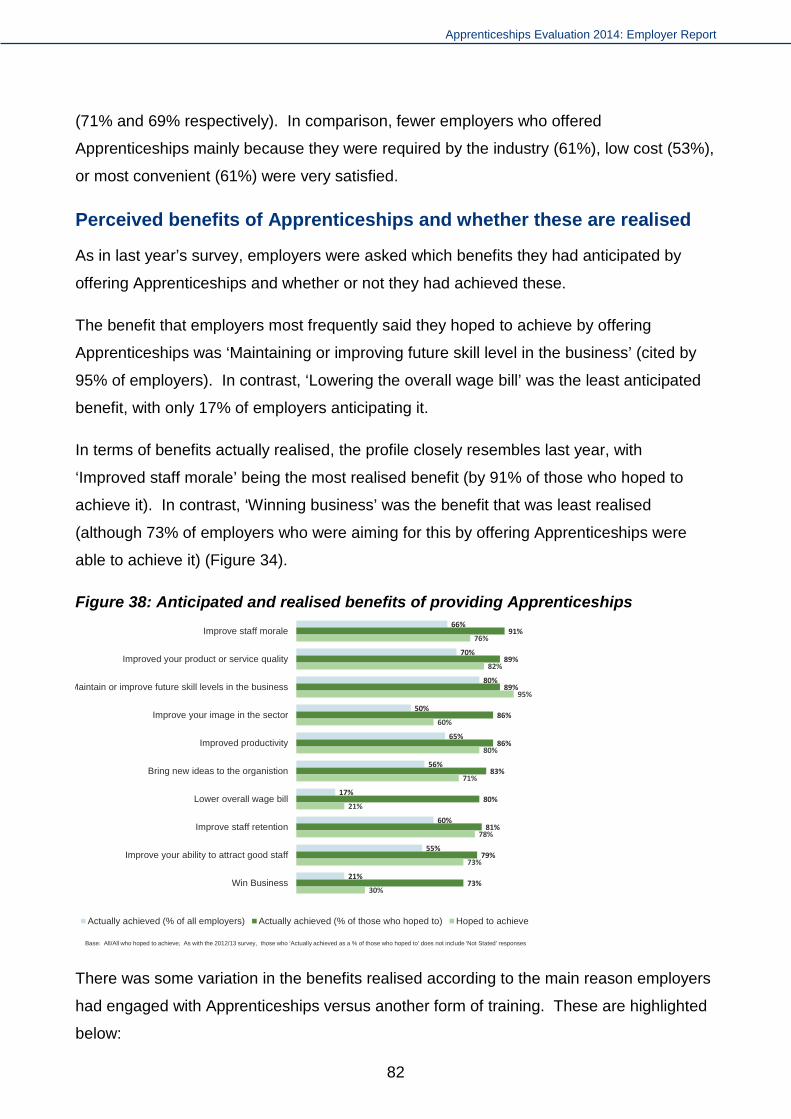
Apprenticeships Evaluation 2014: Employer Report
(71% and 69% respectively). In comparison, fewer employers who offered
Apprenticeships mainly because they were required by the industry (61%), low cost (53%),
or most convenient (61%) were very satisfied.
Perceived benefits of Apprenticeships and whether these are realised
As in last year’s survey, employers were asked which benefits they had anticipated by
offering Apprenticeships and whether or not they had achieved these.
The benefit that employers most frequently said they hoped to achieve by offering
Apprenticeships was ‘Maintaining or improving future skill level in the business’ (cited by
95% of employers). In contrast, ‘Lowering the overall wage bill’ was the least anticipated
benefit, with only 17% of employers anticipating it.
In terms of benefits actually realised, the profile closely resembles last year, with
‘Improved staff morale’ being the most realised benefit (by 91% of those who hoped to
achieve it). In contrast, ‘Winning business’ was the benefit that was least realised
(although 73% of employers who were aiming for this by offering Apprenticeships were
able to achieve it) (Figure 34).
Figure 38: Anticipated and realised benefits of providing Apprenticeships
There was some variation in the benefits realised according to the main reason employers
had engaged with Apprenticeships versus another form of training. These are highlighted
below:
66%
70%
80%
50%
65%
56%
17%
60%
55%
21%
91%
89%
89%
86%
86%
83%
80%
81%
79%
73%
76%
82%
95%
60%
80%
71%
21%
78%
73%
30%
Improve staff morale
Improved your product or service quality
Maintain or improve future skill levels in the business
Improve your image in the sector
Improved productivity
Bring new ideas to the organistion
Lower overall wage bill
Improve staff retention
Improve your ability to attract good staff
Win Business
Actually achieved (% of all employers) Actually achieved (% of those who hoped to) Hoped to achieve
Base: All/All who hoped to achieve; As with the 2012/13 survey, those who ‘Actually achieved as a % of those who hoped to’ does not include ‘Not Stated’ responses
82
Apprenticeship Evaluation: Employers
1. Employers who chose to offer Apprenticeships because they “are the required form
of training in this industry / occupation” were:
o More likely to say that they had maintained or improved future skill levels in
the business (92%)
o Less likely to say they had lowered the overall wage bill (65%).
2. Employers who engaged in Apprenticeships because they “are most relevant to the
needs of the business” were:
o More likely to have realised a range of benefits, including improved staff
morale (94%), improved product or service quality (93%), improved
productivity (91%), introducing more new ideas to the organisation (89%),
and improved staff retention (86%).
3. Employers who chose to use Apprenticeships because they “cost less than the
alternatives / are free” were:
o More likely to say they lowered the overall wage bill (87%).
o Less likely to have improved staff retention (70%), improved their ability to
attract good staff (70%), or to bring new ideas to the organisation (76%).
4. Employers who chose Apprenticeships mainly because of convenience (because
the training provider handles most of the recruitment and/or administration) were:
o More likely to have lowered the overall wage bill (87%).
o Less likely to report they had won business (68%), improved staff morale
(86%), improved their image in the sector (82%), or maintained or improved
future skill levels (85%).
5. Employers who chose Apprenticeships because they believed they “are the best
way to aid recruitment and retention” were:
o More likely to say they have won business (81%), improved staff retention
(84%), improved their ability to attract good staff (85%), or improved staff
morale (93%).
83
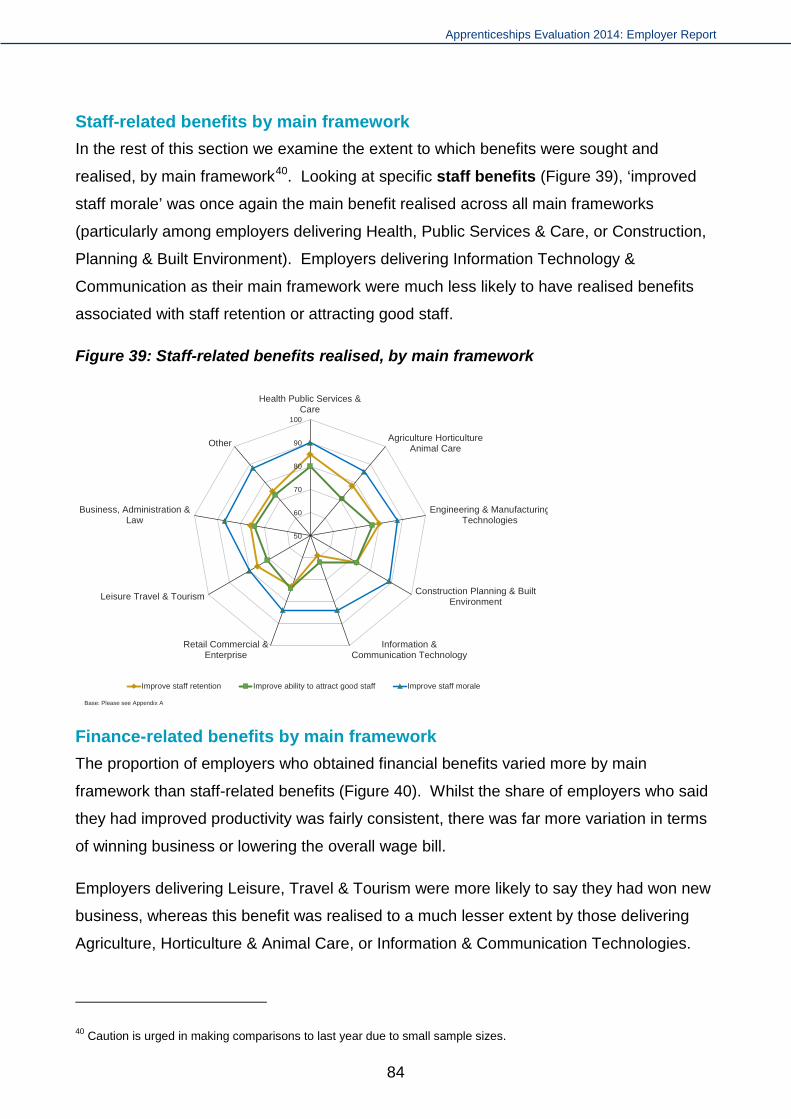
Apprenticeships Evaluation 2014: Employer Report
Staff-related benefits by main framework In the rest of this section we examine the extent to which benefits were sought and
realised, by main framework40. Looking at specific staff benefits (Figure 39), ‘improved
staff morale’ was once again the main benefit realised across all main frameworks
(particularly among employers delivering Health, Public Services & Care, or Construction,
Planning & Built Environment). Employers delivering Information Technology &
Communication as their main framework were much less likely to have realised benefits
associated with staff retention or attracting good staff.
Figure 39: Staff-related benefits realised, by main framework
Finance-related benefits by main framework The proportion of employers who obtained financial benefits varied more by main
framework than staff-related benefits (Figure 40). Whilst the share of employers who said
they had improved productivity was fairly consistent, there was far more variation in terms
of winning business or lowering the overall wage bill.
Employers delivering Leisure, Travel & Tourism were more likely to say they had won new
business, whereas this benefit was realised to a much lesser extent by those delivering
Agriculture, Horticulture & Animal Care, or Information & Communication Technologies.
40 Caution is urged in making comparisons to last year due to small sample sizes.
50
60
70
80
90
100
Health Public Services &Care
Agriculture HorticultureAnimal Care
Engineering & ManufacturingTechnologies
Construction Planning & BuiltEnvironment
Information &Communication Technology
Retail Commercial &Enterprise
Leisure Travel & Tourism
Business, Administration &Law
Other
Improve staff retention Improve ability to attract good staff Improve staff morale
Base: Please see Appendix A
84

Apprenticeship Evaluation: Employers
Lowering the overall wage bill was more frequently realised by those delivering ‘Other’41
Frameworks or Information & Communication Technology. However, again, caution is
recommended in drawing conclusion due to the small base sizes.
Figure 40: Realisation of financial related benefits by main framework
Business improvements by main framework The final four benefits grouped under business improvements42 were cited consistently by
employers across all main frameworks43, except for ‘Bringing new ideas to the
organisation’ (Figure 41). This benefit was realised more by employers delivering
Construction, Planning & Built Environment, or Agriculture, Horticulture & Animal Care,
and less by those delivering Leisure, Travel & Tourism or Information & Communication
Technologies.
Across the other business improvement benefits, employers citing Health, Public Services
& Care were most likely to say that delivering Apprenticeships had ‘Improved their image’
and ‘Maintained or improved future skill levels’. In addition, they were most likely to say
that Apprenticeship training had led to ‘Improved product or service quality’.
41 ‘Other’ consists mainly of Arts and Education Frameworks 42 In last year’s report ‘Win business’ was included in this group. This year, ‘Win business’ has been moved to Financial Benefits, because the newly added benefit of ‘Maintaining or Improving future skill levels in the business’ has been included here. 43 Please note the finer grained scale on Figure 41.
50
60
70
80
90
100
Health Public Services &Care
Agriculture HorticultureAnimal Care
Engineering & ManufacturingTechnologies
Construction Planning & BuiltEnvironment
Information &Communication Technology
Retail Commercial &Enterprise
Leisure Travel & Tourism
Business, Administration &Law
Other
Win business Improve Productivity Lower overall wage bill
Base: Please see Appendix A
85
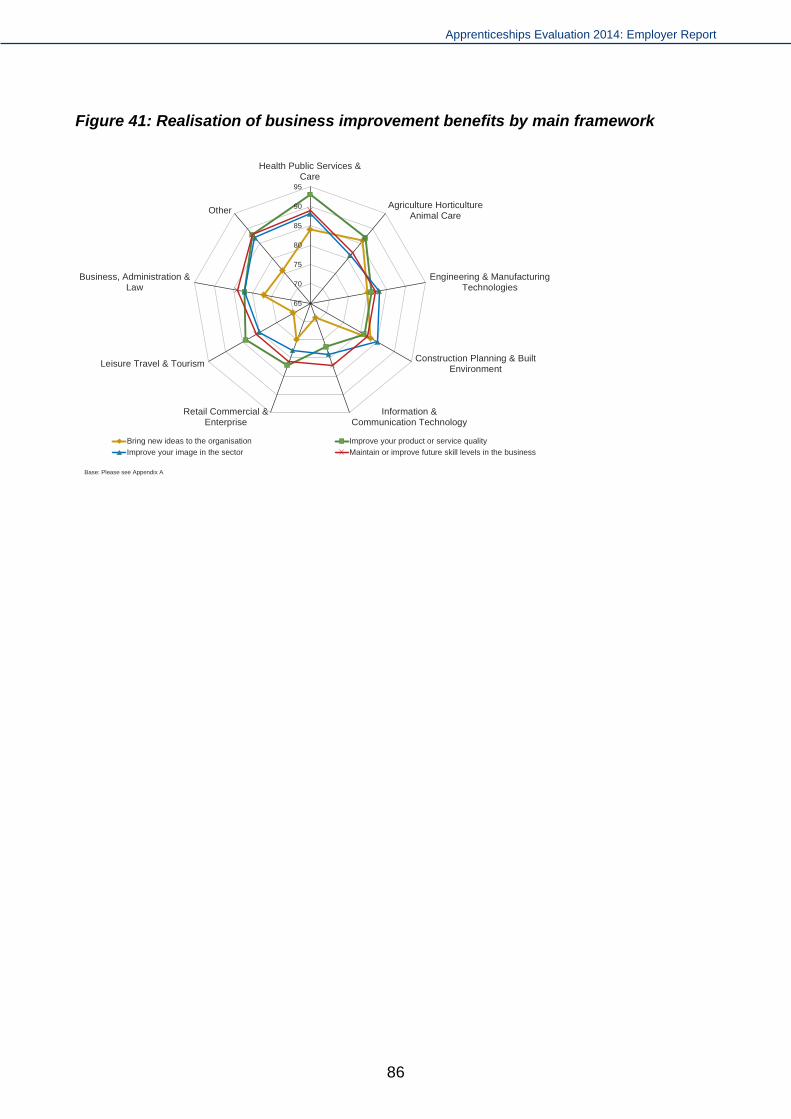
Apprenticeships Evaluation 2014: Employer Report
Figure 41: Realisation of business improvement benefits by main framework
65
70
75
80
85
90
95
Health Public Services &Care
Agriculture HorticultureAnimal Care
Engineering & ManufacturingTechnologies
Construction Planning & BuiltEnvironment
Information &Communication Technology
Retail Commercial &Enterprise
Leisure Travel & Tourism
Business, Administration &Law
Other
Bring new ideas to the organisation Improve your product or service qualityImprove your image in the sector Maintain or improve future skill levels in the business
Base: Please see Appendix A
86

Apprenticeship Evaluation: Employers
8. Current apprentices and future plans
Key findings
Similar to 2013, three in five employers (59%) had current apprentices at the time of
the survey. Amongst those without current apprentices, the majority said that they
planned to continue their involvement with the Apprenticeship programme (59%) or
were reviewing it (22%). This is consistent with 2013 and indicates that, in most cases,
the lack of current apprentices was a temporary gap rather than a decision to
discontinue altogether.
As in 2013, the majority of employers (79%) are committed to the Apprenticeship
programme and plan to continue to offer Apprenticeships. One in six (12%) were
currently undecided or were reviewing their involvement and only nine per cent were
not planning to offer further Apprenticeships. Although still a minority, this represents a
small but significant increase since last year and appears to be driven by a rise among
small employers (up from 9% to 13%).
Length of involvement with the programme and size of organisation were important
determinants of likelihood of future involvement (with larger organisations more
committed). By framework, those employers providing more traditional
Apprenticeships such as Construction, Planning and Built Environment and
Engineering & Manufacturing Technologies were slightly less committed to the
programme in future (as in 2013). Importantly for the Apprenticeship reforms that are
currently being implemented to increase employer involvement, those who got all the
influence they wanted were more likely that those who wanted influence but did not get
any to be committed to delivering Apprenticeships in future (83%, compared with 70%).
Overall, more employers projected that the number of apprentices they employ in
future would increase rather than decrease. In total, 26% expected to provide more
Apprenticeship places than they had done in the past, compared to 13% percent who
expected to offer fewer (or would not offer any at all).
Although the primary focus of the survey was on apprentices who had finished their
training, questions were also asked about current provision and future plans to assess how
87

Apprenticeships Evaluation 2014: Employer Report
employer engagement and provision might change in the near future. This section focuses
on those issues.
Current apprentices
At the time they were surveyed, 59% of employers in the sample had current apprentices
in their workplace, in line with 2013 (62%). Figure 42 shows whether those employers
currently had fewer, the same or more apprentices than they had finishing between August
2012 and March 2013 (using the same size bands for current and completed apprentices).
Amongst those with only one apprentice who finished within that timescale, 46% did not
have any current apprentices on-site, with just over a quarter who continued to employ one
(28%) and a similar proportion that now employed more than one (26%). As in 2013, the
proportion of employers with no current apprentices declined in line with the volume of
apprentices that had finished training in the year before. Employers whose main
frameworks were in ‘Health, Public Service and Care’ or ‘Engineering and Manufacturing
Technologies’ were more likely than average to be currently employing apprentices (71%
and 66% respectively), with the former also more likely to be employing multiple
apprentices (34% currently had three or more at their site).
Figure 42: Number of current apprentices by number of apprentices who finished their training between August 2012 and March 2013
Overall the findings are in line with the picture from 2013, which suggested that even some
longstanding and high-volume apprentice employers do not have them all the time, but
How many apprentices do you currently have at this site?
Base: All employers excluding don’t knows (3,897)
44%
32%
28%
22%
41%
20%
31%
35%
10%
28%
15%
32%
39%
27%
26%
27%
8%
22%
One (857)
Two (866)
Three – Nine (1,555)
Ten or more (619)
Total (3897)
None Fewer Same More
Number of apprentices who finished
88
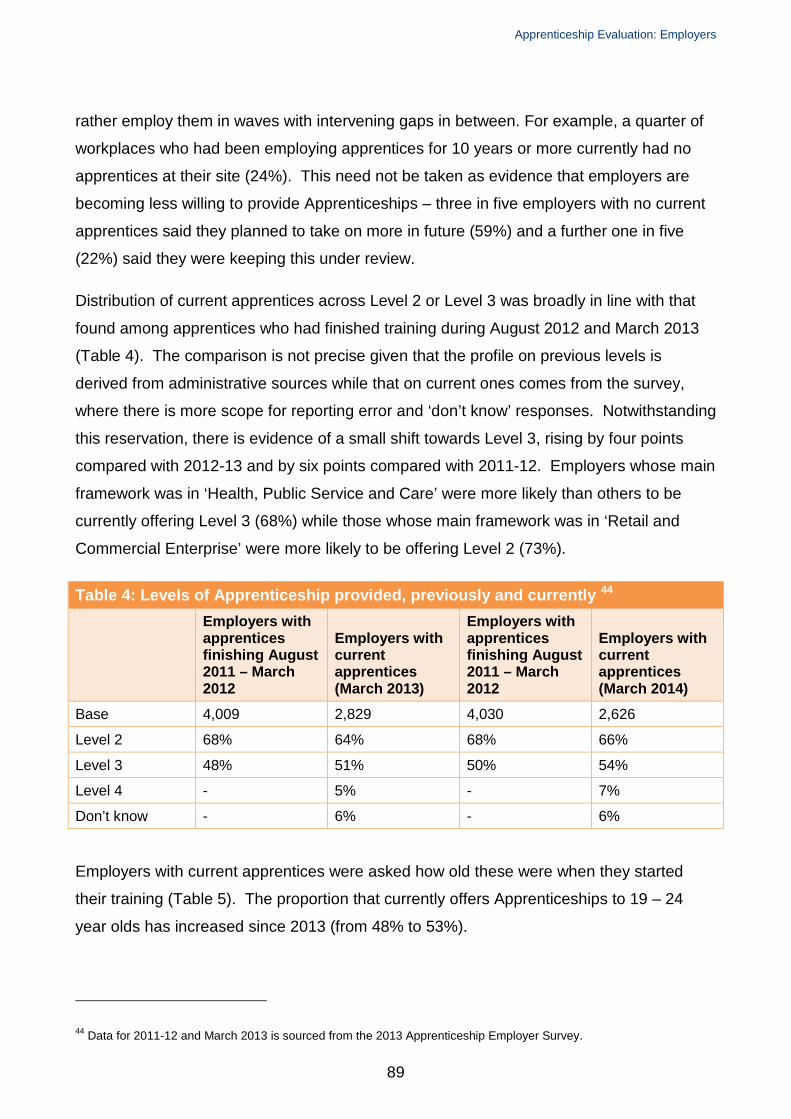
Apprenticeship Evaluation: Employers
rather employ them in waves with intervening gaps in between. For example, a quarter of
workplaces who had been employing apprentices for 10 years or more currently had no
apprentices at their site (24%). This need not be taken as evidence that employers are
becoming less willing to provide Apprenticeships – three in five employers with no current
apprentices said they planned to take on more in future (59%) and a further one in five
(22%) said they were keeping this under review.
Distribution of current apprentices across Level 2 or Level 3 was broadly in line with that
found among apprentices who had finished training during August 2012 and March 2013
(Table 4). The comparison is not precise given that the profile on previous levels is
derived from administrative sources while that on current ones comes from the survey,
where there is more scope for reporting error and ‘don’t know’ responses. Notwithstanding
this reservation, there is evidence of a small shift towards Level 3, rising by four points
compared with 2012-13 and by six points compared with 2011-12. Employers whose main
framework was in ‘Health, Public Service and Care’ were more likely than others to be
currently offering Level 3 (68%) while those whose main framework was in ‘Retail and
Commercial Enterprise’ were more likely to be offering Level 2 (73%).
Table 4: Levels of Apprenticeship provided, previously and currently 44 Employers with
apprentices finishing August 2011 – March 2012
Employers with current apprentices (March 2013)
Employers with apprentices finishing August 2011 – March 2012
Employers with current apprentices (March 2014)
Base 4,009 2,829 4,030 2,626
Level 2 68% 64% 68% 66%
Level 3 48% 51% 50% 54%
Level 4 - 5% - 7%
Don’t know - 6% - 6%
Employers with current apprentices were asked how old these were when they started
their training (Table 5). The proportion that currently offers Apprenticeships to 19 – 24
year olds has increased since 2013 (from 48% to 53%).
44 Data for 2011-12 and March 2013 is sourced from the 2013 Apprenticeship Employer Survey.
89

Apprenticeships Evaluation 2014: Employer Report
Overall, when compared with 2013, there is a suggestion of a continued shift towards
more employers offering Apprenticeships to 19 – 24 year olds and fewer to 16 – 18s,
which is likely to be linked to the older age profile in newer, high-growth framework areas
such as Health, Public Service and Care.
Table 5: Age of current and former apprentices45 Which of the
following age groups have you offered Apprenticeships? (March 2011 – August 2012)
How old were your current apprentices when they started? (March 2013)
Which of the following age groups have you offered Apprenticeships? (March 2012 – August 2013)
How old were your current apprentices when they started? (March 2014)
Base 4,009 2,829 4,030 2,626
16-18 years old
71% 61% 65% 58%
19-24 years old
73% 48% 75% 53%
25 years or older
45% 26% 47% 28%
Don’t know 1% 1% 1% 1%
By framework, the findings on current age groups are in line with those identified earlier in
this report for completed apprentices (see Section 2). As in 2013, there are stark
differences between the more ‘traditional’ and the newer framework areas (Figure 43).
Among current apprentice employers, four in five of those providing Apprenticeships in
‘Construction, Planning and the Built Environment’ or ‘Engineering and Manufacturing
Technologies’ offer Apprenticeships to 16 – 18 year olds, while those who use frameworks
in ‘Health, Public Service and Care’ and ‘Business Administration’ are more likely to be
providing Apprenticeships to 19 – 24 year olds and those aged 25+ than to 16 – 18s.
45 It is important to note the differences in question wording used for previous and current apprentices, which partly account for the differences in results.
90

Apprenticeship Evaluation: Employers
Figure 43: Age of current apprentices when they started, by Frameworks offered
English and maths provision offered to current apprentices
Employers with current apprentices were asked whether training providers had offered any
of their apprentices the opportunity to study towards GCSE level or higher in English or
maths46 (Table 6). At present, Level 2 apprentices need to achieve a Level 1 qualification
in English and maths, but they should be offered the opportunity to study at Level 2 (i.e.
GCSE level) to ensure they have the opportunity to progress. It is important to note that
the survey just tells us that employers had staff that were offered those qualifications and
not whether they were taken up. Around one in five (18%) employers did not know (similar
to 2013, when it was 22%). Among the rest, half said their apprentices were offered the
opportunity to do English or maths (50%) – an increase from 42% in 201347.
Some apprentices will already have GCSE level or higher English and maths qualifications
and therefore will not need to be offered that element as part of their Apprenticeship
training. This is reflected in the differences shown in Table 6. Differences by frameworks
provided were in line with 2013. Employers who offered frameworks in Construction,
Planning and the Built Environment were still less likely to say their current apprentices
had been offered English and maths tuition as part of the Apprenticeship they were doing
46 This includes functional skills qualifications as well as GCSEs and higher. 47 It should also be noted that this does not necessarily equate to the percentage of apprentices who did English and maths as part of their training.
How old were your current apprentices when they started?
54%
62%
54%
49%
61%
45%
44%
46%
59%
Age 19 - 24
54%
53%
42%
61%
44%
80%
62%
43%
Other (108)
Business, Administration & Law(1,019)
Leisure Travel & Tourism (117)
Retail Commercial & Enterprise(563)
Information & CommunicationTechnology (107)
Construction Planning & BuiltEnvironment (199)
Engineering & ManufacturingTechnologies (337)
Agriculture Horticulture AnimalCare (101)
Health Public Services & Care(917)
Age 16 - 18
28%
32%
45%
23%
25%
14%
14%
20%
44%
Age 25+
Base: All employers with current apprentices (2,626)
91

Apprenticeships Evaluation 2014: Employer Report
(45%) than those providing other frameworks, especially when compared with those who
offered frameworks in Health, Public Service and Care (62%) or Retail and Commercial
Enterprise (57%). The proportion of employers who say their apprentices have been
offered English and maths has increased significantly among those providing Health,
Public Service and Care, Business Administration and Law, and Retail and Commercial
Enterprise, compared with 2013.
Table 6: Whether current apprentices had been given the opportunity to study GCSE level or higher in English or maths Base48 Yes No Don't know All frameworks provided Health, Public Services & Care 917 62% 26% 12% Agriculture, Horticulture & Animal Care 101 49% 38% 14% Engineering & Manufacturing Technologies
337 40% 34% 26%
Construction, Planning & Built Environment
199 45% 43% 12%
Information & Communication Technology
107 39% 31% 30%
Retail & Commercial Enterprise 563 57% 27% 17% Leisure, Travel & Tourism 117 34% 38% 28% Business, Administration & Law 1,019 46% 35% 20% Other 108 50% 29% 21% Current levels Level 2 1,884 51% 32% 17% Level 3 1,546 52% 33% 15% Level 4 260 51% 40% 9% Current number of apprentices 1 apprentice 675 49% 29% 23% 2 apprentices 504 51% 33% 16% 3-9 apprentices 1,099 50% 34% 16% More than 10 apprentices 459 54% 36% 10% Size of organisation 1-24 employees 760 53% 31% 17% 25-99 employees 600 45% 34% 21% 100+employees 1,157 49% 33% 18% Total 2,626 50% 32% 18%
48 Employers with current apprentices
92
Apprenticeship Evaluation: Employers
Paying fees for Apprenticeships
A quarter (25%) of employers with current apprentices said they had paid fees to a
provider for the cost of the Apprenticeship training. By frameworks provided, there was a
very similar pattern to that identified in 2013, with employers falling into two main groups
(Table 7). Paying fees remained much more common among employers providing the
more ‘traditional’ Apprenticeship frameworks of Engineering and Manufacturing
Technologies and Construction, Planning and the Built Environment, as well as
Agriculture, Horticulture and Animal Care, and ICT, where around two in five employers
had done so. This compares with around one in five among employers who had paid fees
for Apprenticeships in Health, Public Service and Care; Retail and Commercial Enterprise;
or Leisure Travel and Tourism.
Patterns remained very similar to those reported in 2013, with payment of fees being more
common among employers who currently had 10 or more apprentices (38%) and in larger
organisations (32%). Paying for Apprenticeships was also more common among
employers who were currently providing Level 4, where around half said they had paid
fees towards the cost of the training (49%).
93
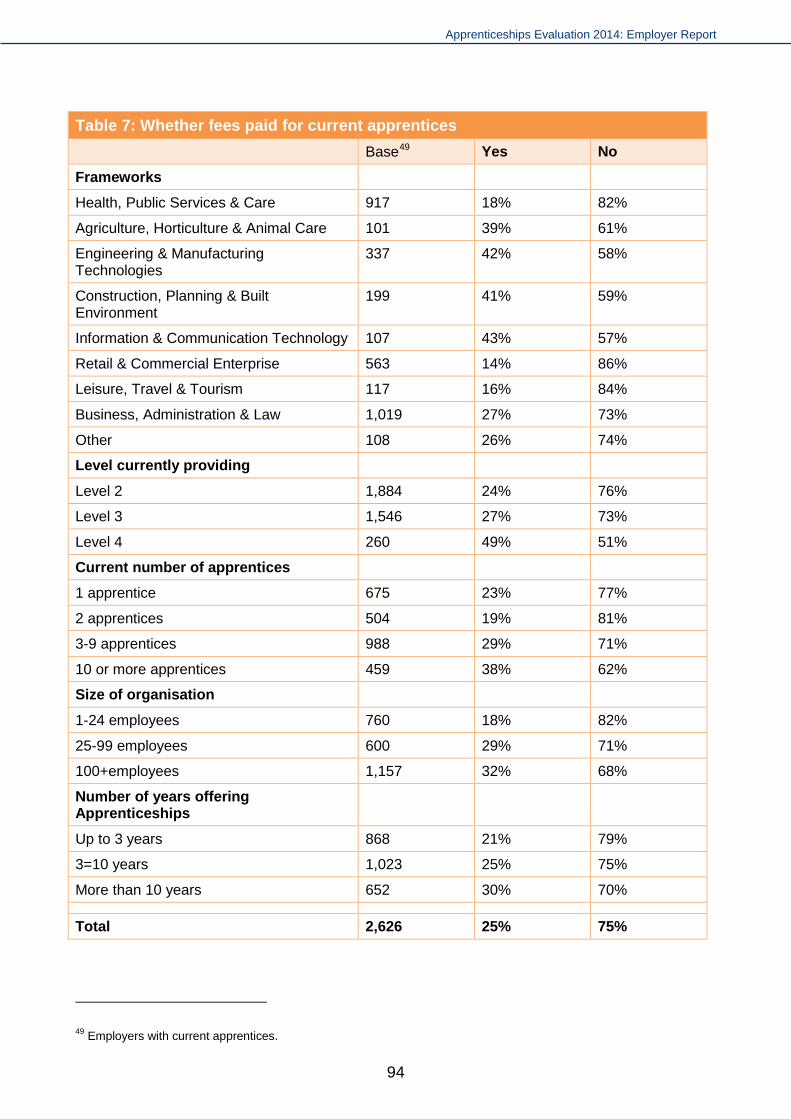
Apprenticeships Evaluation 2014: Employer Report
Table 7: Whether fees paid for current apprentices Base49 Yes No Frameworks
Health, Public Services & Care 917 18% 82%
Agriculture, Horticulture & Animal Care 101 39% 61%
Engineering & Manufacturing Technologies
337 42% 58%
Construction, Planning & Built Environment
199 41% 59%
Information & Communication Technology 107 43% 57%
Retail & Commercial Enterprise 563 14% 86%
Leisure, Travel & Tourism 117 16% 84%
Business, Administration & Law 1,019 27% 73%
Other 108 26% 74%
Level currently providing
Level 2 1,884 24% 76%
Level 3 1,546 27% 73%
Level 4 260 49% 51%
Current number of apprentices
1 apprentice 675 23% 77%
2 apprentices 504 19% 81%
3-9 apprentices 988 29% 71%
10 or more apprentices 459 38% 62%
Size of organisation
1-24 employees 760 18% 82%
25-99 employees 600 29% 71%
100+employees 1,157 32% 68%
Number of years offering Apprenticeships
Up to 3 years 868 21% 79%
3=10 years 1,023 25% 75%
More than 10 years 652 30% 70%
Total 2,626 25% 75%
49 Employers with current apprentices.
94

Apprenticeship Evaluation: Employers
Technically, Apprenticeships for 16 – 18s are fully-funded. However, as in 2013, a
minority of employers whose current apprentices had started in that age group said they
had paid fees for them (Figure 44). Employers were more likely to be paying fees for
apprentices aged over the age of 19, as in 2013.
Figure 44: Payment of fees for current apprentices, by age group
Future plans
The majority of employers (79%) were committed to Apprenticeships and said they
planned to continue offering them in future. One in six (12%) were currently reviewing
their involvement, with nine per cent who said they did not plan to offer Apprenticeships in
future. Although a very small minority of employers, this is an increase since 2013 (6%)
which appears to be driven by a small but significant rise in the proportion of small
organisations who say they will stop offering Apprenticeships, from 9% to 13% (Figure 45).
Patterns by frameworks provided remain similar to 2013, with employers providing more
‘traditional’ frameworks in Engineering and Manufacturing Technologies and Construction,
Planning and the Built Environment less likely to say they plan to offer Apprenticeships in
future (proportions did not differ significantly from 2013). Employers providing
Apprenticeships in Heath, Public Service and Care were the only ones who were
significantly more likely to say they would continue to offer Apprenticeships in future,
compared with 2013 (91% compared with 86% last year).
Have you paid fees to a training provider for the cost of the Apprenticeship training?
24%
24%
16%
Age groups of current apprentices for whom fees have been paid
16-18 years old
19-24 years old
25+ years old
Base: All employers currently employing apprentices in those age groups; 1,436 (16-18s); 1,638 (19-24s); 978 (25+)
95

Apprenticeships Evaluation 2014: Employer Report
Given the renewed policy emphasis on employer influence in Apprenticeships, it is notable
that those employers who either had influence over their training both before and during
(82%), or who had influence either before or during, and did not feel they needed any
more (83%) were more likely to say they would continue offering Apprenticeships than
those who did not have any influence but wanted some (70%).
Similarly, employers who had actively decided to offer Apprenticeships because they were
required by their industry (82%), the most relevant training for their business (87%), or the
best type of training to aid recruitment and retention (86%) were more likely to say they
would continue to use Apprenticeships than employers motivated by low cost (70%) or
convenience (73%).
Figure 45: Employers who plan to continue offering Apprenticeships
Employers who said they would continue to offer Apprenticeships in future were asked
whether they expected the number of Apprenticeship places they offered at their
workplace to increase, stay the same or decrease over the next two to three years (Table
8). Overall, around three in five employers expected this to remain static (57%). Where
change is expected, it is predominantly in a positive direction, with 26% saying they will be
increasing the number of Apprenticeship places they offer and 13% decreasing or
withdrawing them altogether. As in 2013, the only framework grouping with a negative
‘balance’ in future is Agriculture, Horticulture and Animal Care (possibly linked to
recruitment difficulties in those areas of work, as these employers were the least likely to
9%9%16%12%13%12%11%12%11%
19%15%6%
5%7%
13%10%8%9%8%6%
18%13%
13%
3%
86%84%
72%78%79%79%81%82%
71%68%73%
91%
Yes
No
Don't know /it depends /undecided /reviewing it
Base: All employers (4030)
96

Apprenticeship Evaluation: Employers
be satisfied with the quality of applicants and the most likely to want more advice on
recruitment). Employers offering frameworks in Health, Public Service and Care and ICT
both had a high positive balance driven by projected increases in recruitment.
Table 8: Number of Apprenticeship places expect to offer in next 2-3 years
Base More Same Less
Will not offer in future
Don't know Net
Frameworks Health, Public Services & Care 29% 57% 6% 3% 5% +21 Agriculture, Horticulture &
Animal Care 9% 68% 4% 13% 5% -8
Engineering & Manufacturing echnologies
21% 58% 4% 12% 4% +5
Construction, Planning & Built Environment
24% 53% 3% 19% 4% +1
Information & Communication Technology
36% 49% 4% 5% 6% +25
Retail & Commercial Enterprise 24% 59% 4% 8% 5% +12 Leisure, Travel & Tourism 31% 61% 3% 3% 3% +25 Business, Administration & Law 27% 56% 4% 9% 4% +14 Other 19% 59% 17% 4% 1% +9 Organisation size 1-24 employees 23% 58% 3% 13% 4% +6 25-99 employees 30% 53% 6% 7% 4% +19 100+employees 28% 57% 5% 5% 5% +18 Number of apprentices 1 apprentice 24% 57% 4% 11% 4% +9 2 apprentices 26% 58% 5% 6% 4% +10 3-10 apprentices 27% 58% 6% 5% 5% +17 More than 10 apprentices 38% 47% 6% 4% 5% +29 Level Level 2 25% 57% 4% 9% 4% +12 Level 3 27% 57% 5% 7% 4% +16 Number of years offering Apprenticeships
Up to 3 years 30% 51% 4% 12% 2% +16 3-10 years 24% 60% 6% 7% 4% +13 More than 10 years 23% 65% 3% 6% 3% +14 Total 4,030 26% 57% 4% 9% 4% +13
97

Apprenticeships Evaluation 2014: Employer Report
Larger workplaces and those with 10+ apprentices who finished their training between
August 2012 and March 2013 were more likely to say they expect to increase the number
of Apprenticeship places they offer – a positive sign for overall Apprenticeship growth
seeing as these contribute a high percentage of the overall apprentice intake in any one
year. Table 8 shows that, even among small workplaces and those who have been
involved in Apprenticeships for the least length of time, there were more employers who
planned to increase their intake than to decrease it or withdraw altogether.
98

Apprenticeship Evaluation: Employers
9. Conclusions Like last year, this year’s evaluation has found high levels of satisfaction with the
Apprenticeship programme among both employers and apprentices. Employers and
apprentices alike continue to report a range of economic and skills-related benefits from
their involvement in Apprenticeships, demonstrating that the programme is delivering the
qualifications and skills they need. Improved skill levels, better staff morale, enhanced
product or service quality and higher productivity were the most anticipated and the most
commonly reported employer benefits.
Overall satisfaction with Apprenticeships remains high among employers, who were most
satisfied with the quality of the Apprenticeship training and assessment, and the flexible
way these were offered by their training provider. However, there remain stubborn
variations by main framework area. Small employers, too, remain consistently less likely
to be satisfied both overall and on a range of supporting measures, in particular the extent
of influence, which, along with the quality of applicants, is the area where employers were
least satisfied as a whole.
The Apprenticeship reforms are built on the assumption that employers want to have
influence – which many do – but some employers who want influence still find it difficult to
exercise this because of limited opportunity, capability or belief that having an influence is
possible, and others do not want any influence at all. This is a continuing challenge for the
Apprenticeship reforms going forward, although it is encouraging that more employers this
year said they wanted influence, than last year. As could be expected, small employers
feel less able to exert influence because, compared to larger employers they employ fewer
apprentices and have a less established training infrastructure. However, small employers
also account for the majority of employers with apprentices, and therefore, their
engagement in, and ability to shape, the training their employees receive is critical to
meeting the objectives of the reforms to create a demand-led and employer-responsive
skills system.
The survey findings show that employers who had influence were more likely than those
who did not to be satisfied with Apprenticeships overall and on a range of other measures,
as well as reporting higher completions and greater commitment to offering
Apprenticeships again in future. This suggests that the reforms’ emphasis on increasing
99
Apprenticeships Evaluation 2014: Employer Report
employer influence in Apprenticeship content and standards will have positive impacts on
these factors going forward. This survey focuses on employers with apprentices who
finished their training between August 2012 and March 2013, which means that the cohort
it covers are unlikely to have been directly affected by reforms such as Apprenticeship
Trailblazers, being implemented from late 2013 onwards. The impact of such reforms
should start to come through among employers with apprentices who finish their training in
2014-15 and beyond.
Limited awareness and therefore engagement in Apprenticeships remains an issue among
certain subgroups, reflected in the continuing lack of recognition among a significant
minority of employers and apprentices that they are undertaking an Apprenticeship. This
may simply suggest a lack of awareness about what the training is called, but on a deeper
level it could also suggest a lack of engagement in what the training delivers – further
research would be beneficial here. This was most apparent amongst employers who had
recruited from existing staff, as well as amongst the apprentices recruited in this way.
Linked to this, employers and apprentices in the newer frameworks (Retail & Commercial
Enterprise; Health, Public Service & Care; Leisure, Travel & Tourism; and Business,
Administration & Law) were most likely to be unaware that they were doing an
Apprenticeship. Apprentices undertaking these frameworks were mainly interested in
getting a qualification.
Since the vast majority of employers were using providers to deliver their Apprenticeship
training, these findings underline the questions raised in last year’s report about how
providers are presenting Apprenticeship programmes to some employers and apprentices.
They also raise questions about the possible impacts of changes to Apprenticeship
funding. With greater financial co-investment required of employers in future, will they
continue to fund an Apprenticeship programme if they are unclear about what they are
getting, or more interested in specific elements of the programme, like the technical
certificate? Among employers who recognised they were delivering an Apprenticeship,
those who only recruited existing employees were more likely to say they were using
Apprenticeships because these cost less than the alternatives, or were free (although this
reason was still the least common). This is a particular issue in sectors where the
Apprenticeships being offered to existing staff are primarily aimed at developing skills in a
current job role, rather than to prepare for a new or different job: the reforms mean that in
100
Apprenticeship Evaluation: Employers
future, Apprenticeships should only be offered to existing employees where substantial
training is required to achieve competency in their occupation.
Finally, last year’s evaluation highlighted variations in the extent to which the different
frameworks are delivering value for money (which is also closely inter-related to how
employers are using the programme). The apprentice findings showed very different
learner experiences depending on the framework undertaken and similar patterns were
found in this year’s survey. In the case of the newer frameworks highlighted above, the
amount of time spent training remains shorter compared to other frameworks, as does the
average length of time taken to complete training. A wide number other benefits such as
perceived impact, pay rises and promotions were reported by a smaller proportion of
apprentices on newer frameworks. As strong growth in apprentice numbers has taken
place in these frameworks, and further expansion of Apprenticeships is planned, it remains
important to ensure the quality of training and its ability to make a genuine difference to the
life of the apprentice is not compromised.
101

Apprenticeships Evaluation 2014: Employer Report
Appendices A1 Survey methodology
The Apprenticeship Evaluation Employer Survey 2013 comprised 4,030 interviews with employers who had “employees who had finished (though not necessarily completed) Apprenticeship training between 1st August 2012 and 31st March 2013”. The interviews were conducted using Computer Assisted Telephone Interviewing (CATI). Fieldwork took place from 5th February to 26th March 2014.
Sample design The sample frame of in-scope employers was derived from the Individual Learner Record (ILR), which contained a flag to identify the employer for each apprentice. This enabled a sample frame of employers offering Apprenticeships during the reference period to be identified. The list of in-scope employers was then matched to the Blue Sheep database to append employers’ telephone numbers, addresses, employee sizes and industry sector information. The additional information about each employer’s apprentices50 was also appended to the sample to inform the sample design and analysis.
The survey adopted random probability sampling. The sample was stratified by “number of apprentices who finished training during the reference period” prior to selection. All employers with more than 10 apprentices were included since this group was relatively rare. A representative sample by framework was drawn within each strata.
Response rate The adjusted response rate was 38%. The co-operation rate was 58%. A detailed breakdown is presented in Table A1 overleaf.
50 Such as the total number of apprentices, framework(s) delivered and the level of the Apprenticeship qualification(s).
102
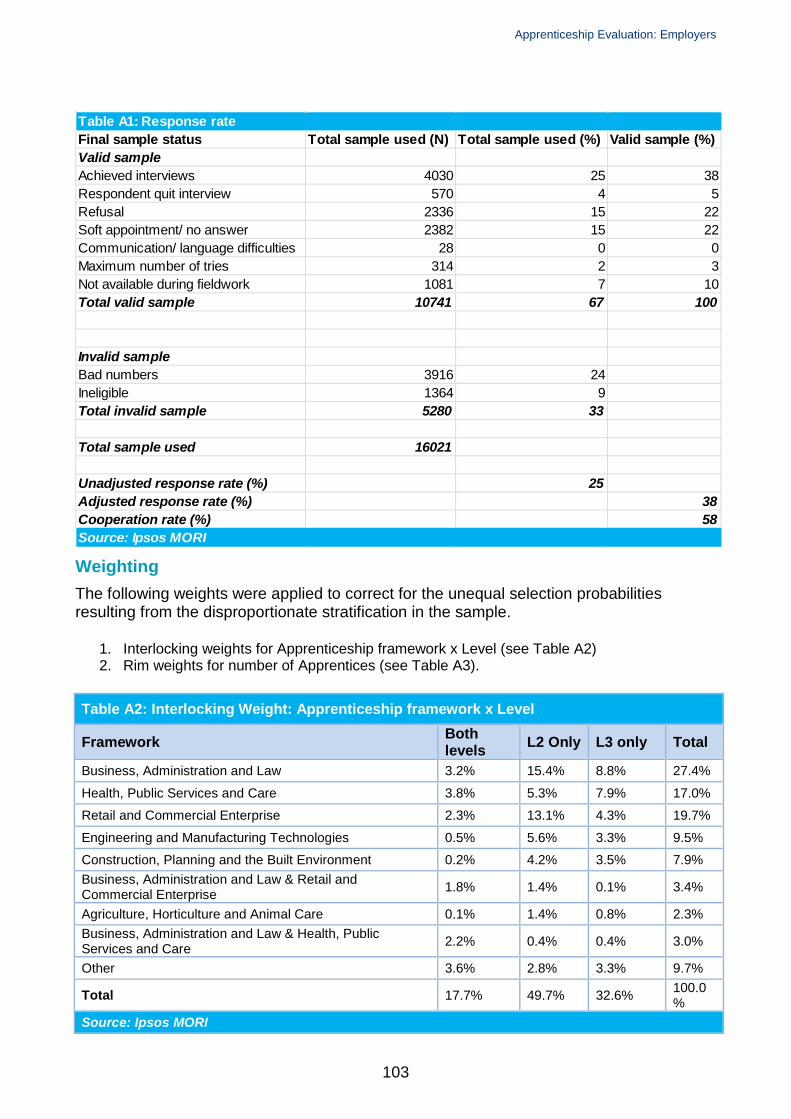
Apprenticeship Evaluation: Employers
Weighting The following weights were applied to correct for the unequal selection probabilities resulting from the disproportionate stratification in the sample.
1. Interlocking weights for Apprenticeship framework x Level (see Table A2) 2. Rim weights for number of Apprentices (see Table A3).
Table A2: Interlocking Weight: Apprenticeship framework x Level
Framework Both levels L2 Only L3 only Total
Business, Administration and Law 3.2% 15.4% 8.8% 27.4%
Health, Public Services and Care 3.8% 5.3% 7.9% 17.0%
Retail and Commercial Enterprise 2.3% 13.1% 4.3% 19.7%
Engineering and Manufacturing Technologies 0.5% 5.6% 3.3% 9.5%
Construction, Planning and the Built Environment 0.2% 4.2% 3.5% 7.9% Business, Administration and Law & Retail and Commercial Enterprise 1.8% 1.4% 0.1% 3.4%
Agriculture, Horticulture and Animal Care 0.1% 1.4% 0.8% 2.3% Business, Administration and Law & Health, Public Services and Care 2.2% 0.4% 0.4% 3.0%
Other 3.6% 2.8% 3.3% 9.7%
Total 17.7% 49.7% 32.6% 100.0%
Source: Ipsos MORI
Table A1: Response rateFinal sample status Total sample used (N) Total sample used (%) Valid sample (%)Valid sampleAchieved interviews 4030 25 38Respondent quit interview 570 4 5Refusal 2336 15 22Soft appointment/ no answer 2382 15 22Communication/ language difficulties 28 0 0Maximum number of tries 314 2 3Not available during fieldwork 1081 7 10Total valid sample 10741 67 100
Invalid sampleBad numbers 3916 24Ineligible 1364 9Total invalid sample 5280 33
Total sample used 16021
Unadjusted response rate (%) 25Adjusted response rate (%) 38Cooperation rate (%) 58Source: Ipsos MORI
103

Apprenticeships Evaluation 2014: Employer Report
Table A3: Number of apprentices weighting profile
Number of apprentices Weighted %
1 60.4%
2 18.1%
3 to 5 14.5%
6 or more 7.1%
Total 100%
Source: Ipsos MORI
104

Apprenticeships Evaluation: Employer
© Crown copyright 2014
You may re-use this information (not including logos) free of charge in any format or medium, under the
terms of the Open Government Licence. Visit www.nationalarchives.gov.uk/doc/open-government-licence,
write to the Information Policy Team, The National Archives, Kew, London TW9 4DU, or
email: [email protected].
This publication is also available on our website at www.bis.gov.uk
Any enquiries regarding this publication should be sent to:
Department for Business, Innovation and Skills 1 Victoria Street London SW1H 0ET Tel: 020 7215 5000 If you require this publication in an alternative format, email [email protected], or call 020 7215 5000. URN BIS/14/1207