Embed Size (px)
Citation preview

1
© 2012 Deloitte SA. Private and confidential.
Audit.Tax.Consulting.Corporate Finance.
Appréhender la gestion des risques au sein de différents types d’entreprises
David Stréliski,
Financial Risk Management, 26.04.2012
© 2012 Deloitte SA. Private and confidential.
Contents
Banking sector
• Banks structure and their types of risk
• Risk Management framework
Asset Managers
• Managing systemic and specific risks
• Impact of Solvency II for insurance clients
Risk Management in non-financial corporations
Risk management in Commodity Trading
1
2
3
4
2

2
© 2012 Deloitte SA. Private and confidential.
Banking Sector: 1
• Banks structure and their types of risk
• A Risk Management Framework
© 2012 Deloitte SA. Private and confidential.
Comprendre les domaines d’activités et drivers de
profitabilité d’une banque
4
• LE FINANCEMENT
Prêter à des particuliers et/ou entreprises pour financer un projet donné.
Rentabilité: structure des taux de prêt vs source de fonds, spreads de crédit:
Rdt = Δ [ TauxActifs - TauxPassifs ] = Transformation d‟échéances + Spread de crédit
• LE NEGOCE
Négoce de titres financiers sur les marchés financiers organisés ou de gré à gré:
• Compte propre (marché secondaire): rentabilité des fonds propres de la banque
• Pour tiers et market making (marché primaire): émissions, structurations, etc.
Rentabilité à CT: revente d‟un instrument financier à un prix supérieur au coût brut
Rdt = Δ [ Prixvente – CoûtAchat – Coût Trading – CoûtFinancement ]
• LES DEPOTS ET L‟EPARGNE
• Dépôts des clients de la banque désireux de « sécuriser » leurs liquidités et permettant par ailleurs de financer une partie de ses activités
• Produits d‟épargne pour offrir aux client un rendement sur leurs liquidités et sur lesquels la banque perçoit des commissions. Comprend la banque privée
Rentabilité: Source stable de financement de l‟actif et source de commissions de gestion.
Rdt = Δ [ Commission de gestion – Rémunération des dépôts ]

3
© 2012 Deloitte SA. Private and confidential.
Comprendre les risques essentiels d’une banque
5
• LE FINANCEMENT:
o Risque de taux d‟intérêt
o Risque de crédit
o Risque de contrepartie
o Risque pays
• LE NEGOCE:
o Risque de marché systémique (béta)
o Risque de marché spécifique (alpha)
o Risque de liquidité systémique
(liquidité de marché)
o Risque de liquidité spécifique
(liquidité d‟un titre en particulier)
• LES DEPOTS/L’EPARGNE:
o Risque de liquidité de financement
o Risque de taux d‟intérêt
• AUTRES RISQUES TRANSVERSAUX:
o Risques opérationnels
o Risques de réputation
o Risques stratégiques
o Risques réglementaires
o Risques émergents
© 2012 Deloitte SA. Private and confidential.
Gestion du risque de taux ALM
6
Actifs taux fixe
Actifs taux
variable
Passifs taux
variable
Passifs taux fixe
Risque de sensibilité
des fonds propres
Risque de sensibilité
de la marge
Potentiellement
élevé si différentiel
de duration important
A priori nul car
marge connue à
court terme
A priori nul car
variabilité des taux à
court terme
A priori faible car
marge connue mais
attention au risque
de base
Elevé Elevé
Bilan bancaire
Jambe
receveuse taux
variable
Jambe payeuse
taux fixe
Σ (Cft . e-rt)
De 1 à n années
Δ (Cft) De 1 à 12 mois
Fonds propres
• Effet de valeur = risque de baisse de la valeur économique des fonds propres suite à une variation de la courbe des taux d‟intérêt
• Effet de revenu = risque de baisse des bénéfices suite à une variation similaire.
Hors-Bilan
Profil de risque du portefeuille
en vue dynamique
Après couverture
Avant couverture
σ (R) E(R)

4
© 2012 Deloitte SA. Private and confidential.
Banking Sector: 1
• Banks structure and their types of risk
• A Risk Management Framework
© 2012 Deloitte SA. Private and confidential.
Le cadre de la gestion des risques
La fonction Risque doit conjuguer rôle de surveillance opérationnelle et support du
développement stratégique et du pilotage des activités.
8

5
© 2012 Deloitte SA. Private and confidential.
Les dimensions du Risk Management dans une banque
La réglementation Suisse impose un cadre d‟analyse Risk Management des banques qui
détermine le découpage entre les différentes dimensions.
9
© 2012 Deloitte SA. Private and confidential.
Définitions des classes de risques dans la banque
Source pour A-E: Basel Committee on Banking Supervision; Source pour F-H: Best Practice
10

6
© 2012 Deloitte SA. Private and confidential.
Asset Management: 2
• Managing systemic & specific risks
• Impact of Solvency II for insurance clients
© 2012 Deloitte SA. Private and confidential.
Introduction Un univers instable
• La rémunération de la prime de risque à long terme n‟est plus garantie et le défi essentiel
du gestionnaire d‟actifs se meut peu-à-peu de „gagner de l‟argent‟ à „ne pas en perdre‟
• Les modèles statiques imposés par la théorie financière classique, que cela soit pour la
gestion de portefeuille comme Markowitz, ou bien la gestion des risques comme la Value-
at-Risk, ne sont plus un gage de confiance et de stabilité
• L‟impératif de performance sur le long terme nécessite désormais plus de flexibilité et de
créativité au sein du portefeuille, tout en maintenant un environnement de gestion des
risques de plus en plus pointu, et reposant sur l‟étude systématique de scenarii divergeant
du cas de base
• Le choix des investissements est de plus en plus crucial, et le recours à des gérants de
fonds compétents et intègres doit se reposer sur une méthodologie sans faille
12

7
© 2012 Deloitte SA. Private and confidential.
Contents
13
Gestion du risque systémique et allocation tactique
Gestion du risque spécifique et sélection des investissements
© 2012 Deloitte SA. Private and confidential.
Principes clés
• Les stratégies de placement doivent être dûment documentées au sein d‟une politique
• La stratégie d‟investissement doit être en adéquation en tous temps avec la politique et
l‟appétit au risque fixé par l‟institution
• La gouvernance en matière de décision d‟investissement, de re-balancement et de
désinvestissement doit être clairement définie et documentée, et appliquée
systématiquement de manière cohérente
• L‟institution doit mettre en œuvre des méthodologies adaptées au profil de risque des
portefeuilles gérés et utiliser des outils qui soient en phase avec le degré de complexité
• Les méthodes de calcul de la performance et des indicateurs de risque doivent être
documentées afin d‟offrir le maximum de transparence aux investisseurs
• Un reporting détaillé doit être produit régulièrement afin d‟obtenir une vision optimale
de l‟évolution du profil de risque du portefeuille, y compris dans un contexte de stress
scenario
14
8
© 2012 Deloitte SA. Private and confidential.
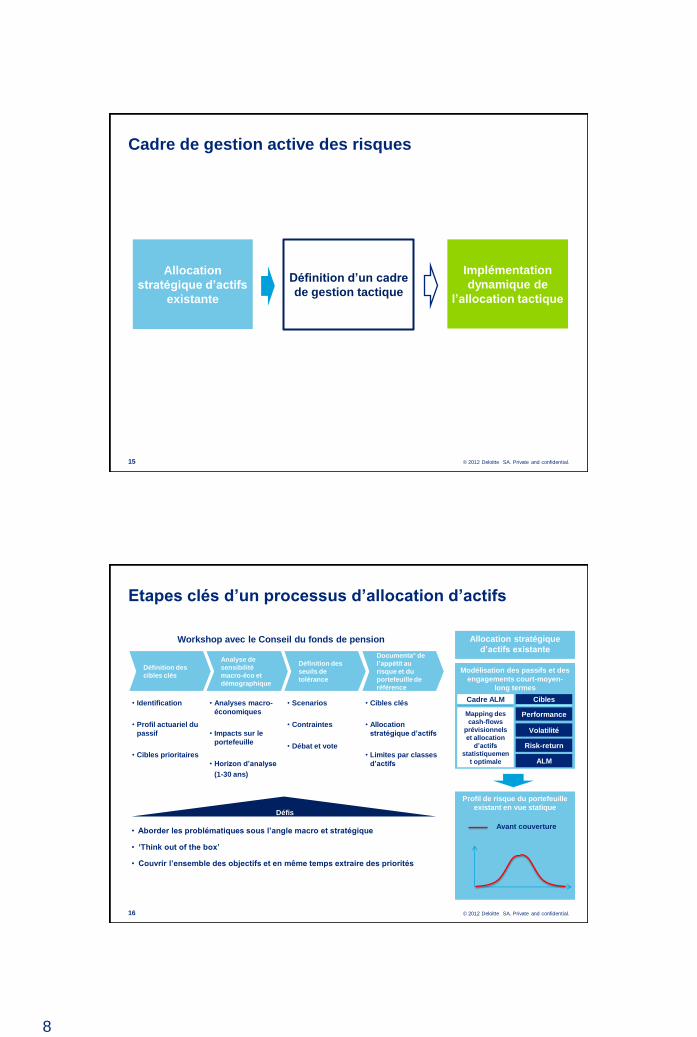
Cadre de gestion active des risques
15
Allocation
stratégique d’actifs
existante
Implémentation
dynamique de
l’allocation tactique
Définition d’un cadre
de gestion tactique
© 2012 Deloitte SA. Private and confidential.
Etapes clés d’un processus d’allocation d’actifs
16
• Aborder les problématiques sous l’angle macro et stratégique
• ‘Think out of the box’
• Couvrir l’ensemble des objectifs et en même temps extraire des priorités
Analyse de
sensibilité
macro-éco et
démographique
Définition des
seuils de
tolérance
Documenta° de
l’appétit au
risque et du
portefeuille de
référence
• Analyses macro-
économiques
• Impacts sur le
portefeuille
• Horizon d’analyse
(1-30 ans)
• Identification
• Profil actuariel du
passif
• Cibles prioritaires
• Scenarios
• Contraintes
• Débat et vote
• Cibles clés
• Allocation
stratégique d’actifs
• Limites par classes
d’actifs
Définition des
cibles clés
Workshop avec le Conseil du fonds de pension
Défis
Modélisation des passifs et des
engagements court-moyen-
long termes
Performance
Volatilité
Allocation stratégique
d’actifs existante
Profil de risque du portefeuille
existant en vue statique
Avant couverture
Risk-return
ALM
Mapping des
cash-flows
prévisionnels
et allocation
d’actifs
statistiquemen
t optimale
Cibles Cadre ALM

9
© 2012 Deloitte SA. Private and confidential.
Définition d’un cadre de gestion tactique
Définition de scenarii de
stress
Fixation de niveaux de
tolérance au risque sous
l’angle de la résilience du
portefeuille aux scenarii de
stress
Impacts sur les sensibilités
Marges d’allocations
tactiques
• Consolider les différents compartiments du portefeuille:
- Méthodologie et outils d‟analyse du risque pour l‟agrégation des différents effets dus
aux facteurs de risques
- Perspective consolidée du risque via un reporting performant
- Système de limites opérationnelles/tactiques en parallèle des limites stratégiques
• Prévoir un budget de risque pour les opérations de couverture du portefeuille:
- Définition et mise en pratique d‟un overlay « risk management » au sein du
portefeuille
- Vision tactique et ajustement à court ou moyen terme du profil d‟investissement
autour du portefeuille cible stratégique
• Effectuer une cartographie détaillée des impacts, en particulier en cas d‟occurrence des
scenarii de stress poussés:
- Mouvements des facteurs de risque et distorsions éventuelles de liquidité générées
par de tels chocs.
- Effets corrélatifs et de propagation des différents facteurs de risque
• Définir un scénario de base + plusieurs scenarii de stress (« stress tests ») en
considérant à la fois:
- Hypothèses systémiques/macro-économiques de grands chocs
- Hypothèses spécifiques
17
© 2012 Deloitte SA. Private and confidential.
Construction de portefeuille et stratégie de couverture
optimale • Définir les types de stratégies de couverture à tester:
- Faisabilité, coûts/bénéfices, besoins opérationnels, scénario „worst
case‟ et stratégies de sortie
- Anticipation des impacts sur les différents horizons de gestion et de
couverture du portefeuille
• Produire des scenarii de couverture versus sans couverture:
distribution + stress scenario et en extraire un programme de
couverture de nature contra-cyclique, avec un budget de risque
(volatilité) strict et optimal
• Eviter les biais directionnels dans les hypothèses des stratégies et
pour le testing
• „Vendre‟ la stratégie au Conseil et aux auditeurs
• Implémenter et piloter la stratégie à long terme avec un focus tactique
à court/moyen terme reposant sur un panel d‟ajustements possibles
en cas de réalisation d‟un scénario de stress donné
• Fixation d‟un système de limites élaboré à plusieurs niveaux:
opérationnel/tactique et stratégique, reposant sur des indicateurs et
de risque et des analyses de natures technique et fondamentale
Implémentation dynamique
de l’allocation tactique
Mise en place d’une allocation
tactique flexible via un budget
de risque prédéfini
Système de limites et de
contraintes stratégiques et
opérationnelles
Analyses des scenarii de
stress et des stratégies de
couverture optimales
Programme de couverture
contra-cyclique
Profil de risque du portefeuille
en vue dynamique
Après couverture
Avant couverture
σ (R) E(R)
18

10
© 2012 Deloitte SA. Private and confidential.
Gestion du risque systémique et allocation tactique Vue d‟ensemble
19
Révision du profil d’investissement
dans une perspective d’allocation
tactique et de gestion dynamique
des risques
Modélisation des passifs et des
engagements court-moyen-
long termes
Performance
Volatilité
Allocation stratégique
d’actifs existante Implémentation
dynamique de l’allocation
tactique
Définition de scenarii de stress
Fixation de niveaux de tolérance
au risque sous l’angle de la
résilience du portefeuille aux
scenarii de stress
Impacts sur les sensibilités
Mise en place d’une allocation
tactique flexible via un budget de
risque prédéfini
Système de limites et de
contraintes stratégiques et
opérationnelles
Analyses des scenarii de
stress et des stratégies de
couverture optimales Marges d’allocations tactiques
Profil de risque du portefeuille
existant en vue statique
Modélisation des facteurs clés de
risques et analyse en cas de base
et en stress scenarii
1y 2y
Avant couverture
Risk-return
Corrélations
Profil de risque du portefeuille
en vue dynamique
Après couverture
Avant couverture
Mapping des
cash-flows
prévisionnels
et allocation
d’actifs
statistiquemen
t optimale
Cibles Cadre ALM
Définition d’un cadre de
gestion tactique
Programme de couverture
contra-cyclique
σ (R) E(R)
© 2012 Deloitte SA. Private and confidential.
Contents
20
Gestion du risque systémique et allocation tactique
Gestion du risque spécifique et sélection des investissements

11
© 2012 Deloitte SA. Private and confidential.
Etapes du processus d’investissements
Stratégie d’investissement
Allocation d’actif
Analyse
Quantitative
Sélection des investissements
Analyse
Qualitative
Due diligence
opérationnelle
Décision
d’investissement
Surveillance / Suivi / Reporting
21
© 2012 Deloitte SA. Private and confidential.
Analyse Qualitative
Les 4 pierres angulaires
22
Consistance de
la performance Capacités de
recherche
démontrées
Processus
d’investissement
Stabilité de la
société de
gestion
• Préparation aux entretiens
• Analyse au niveau du groupe
• Evaluation du manager et de son équipe
• Analyse d‟attribution de la performance
• Entretiens
• Groupe:
• Statut
• Culture
• Discipline
• L‟équipe
• Expérience
• Changements
• Style & créativité
• Autres responsabilités

12
© 2012 Deloitte SA. Private and confidential.
Analyse Quantitative
23
• Mesures de surperformance (Alpha)
• Betas (sensibilités aux facteurs de risque)
• Autres ratios (information, Sharpe, Sortino, Omega)
• Maximum Drawdown
• VaR et scénarii de stress
• Style drift
• Attribution performance
• Passé l‟étape 2:
• Expérience: gestionnaire et équipe
• Analyse de style
• Analyse d‟attribution de performance
1. Screening de
l’univers 2. Analyse quantitative
3. Recherche
préliminaire
• Secteurs/segments appropriés par classe d‟actifs
• Consistance: Track record et performance
• Critères de taille minimale
© 2012 Deloitte SA. Private and confidential.
Analyse Opérationnelle
24
• Préparation du questionnaire
‒ Questions sur les processus opérationnels
‒ Approche audit et gestion des risques
‒ Couverture optimale des risques structurels et opérationnels
• Domaines couverts
‒ Test d‟intégrité des gérants
‒ Performance des avoirs sous gestion: administrateurs, dépositaires indépendants
‒ Risque de contrepartie sur les tiers: brokers, administrateurs, auditeurs, etc.
‒ Structure et gouvernance chez le gestionnaire
‒ Capacités des systèmes vs stratégie d‟investissement (intensité/fréquence des
transactions, liquidité des marchés investis, etc.)
13
© 2012 Deloitte SA. Private and confidential.
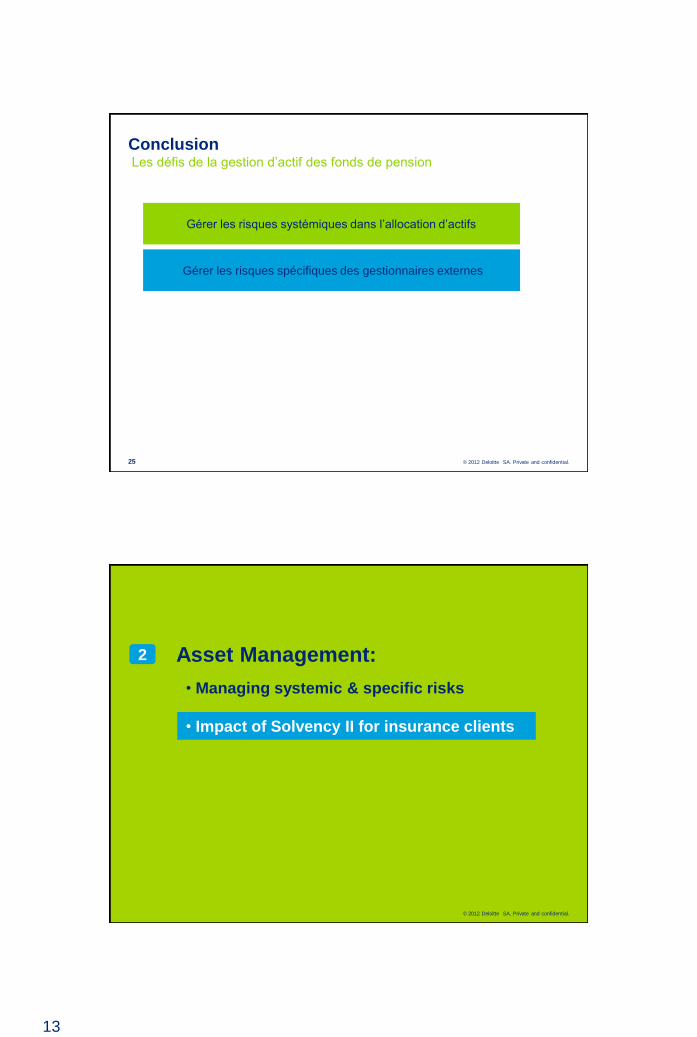
Conclusion Les défis de la gestion d‟actif des fonds de pension
25
Gérer les risques systémiques dans l‟allocation d‟actifs
Gérer les risques spécifiques des gestionnaires externes
© 2012 Deloitte SA. Private and confidential.
Asset Management: 2
• Managing systemic & specific risks
• Impact of Solvency II for insurance clients

14
© 2012 Deloitte SA. Private and confidential.
Contents
What is Solvency II for insurers
Implications for Asset Managers
27
© 2012 Deloitte SA. Private and confidential.
How is Solvency II regime structured?
Pillars are used as a way of grouping SII requirements
Solvency II can be thought of as being based on three guiding principles (pillars) which cut
across strategic, market, credit, operational, insurance and liquidity risk.
28
Liquidity Risk
Insurance Risk
Market Risk
Credit Risk
Operational Risk
SOLVENCY II
Quantification Governance Disclosure
Strategic and
Reputational Risk Pillar 1 Quantitative
Requirements
Pillar 2 Qualitative Requirements
& Rules on Supervision
Pillar 3 Supervisory Reporting
and Public Disclosure
Capital Requirements
Valuation of Assets and
Liabilities
Own Funds
System of Governance
Own Risk and Solvency
Assessment (ORSA)
Capabilities and powers
of regulators, areas of
activity
Transparency
Disclosure
requirements

15
© 2012 Deloitte SA. Private and confidential.
Pillar 1 concerns the Solvency II balance sheet. It ‘requires
regulated firms to calculate its capital requirement using either
a standard formula or an internal model’.
Solvency II foresees two levels of capital requirements:
• Solvency Capital Requirements (SCR)
–Level of capital to enable firm to absorb significant unforeseen
losses
–Gives reasonable assurance to policyholders and beneficiaries
–Calibrated at 99.5% confidence over 1 year
–Can use standard formula or own Internal Model
• Minimum Capital Requirements (MCR)
–Threshold that could trigger the ultimate supervisory action if
breached
–Unacceptable risk to policyholder
–Consider expenses in run-off
Pillar I: Quantitative requirements
Pillar 1
Quantitative
Requirements
Minimum capital
Requirement
Solvency Capital
Requirement (SCR)
Technical Provisions
Investment Rules
Own funds
Quantification
29
© 2012 Deloitte SA. Private and confidential.
Risk Types Covered by Pillar I for a life insurance
company
Economic capital
Aggregation
Market
risk
Credit
risk
Underwriting
risk
Operational
risk
• Interest rate
• Equity
• Property
• Spread
• Currency
• Concentratio
n
• Corporate
bonds
• Counterparty
:
reinsurance,
reimburseme
nt
• Mortality
• Longevity
• Disability
• Expense
• Revision
• Lapse
• Catastrophe
• Poor internal
processes,
fraud, errors,
IT problems
…
• External
events,
changing
risk, legal
changes…
Minimum Financial
Requirements
• Appropriate Technical
Provisions
(Economic Value)
• Solvency Capital
Requirement based on
complete risk profile
• Appropriate Assets
supporting the obligations
Pillar I
30

16
© 2012 Deloitte SA. Private and confidential.
‒ The Supervisory Authorities and General Rules:
• supervisors shall be responsible for evaluating how insurance and
reinsurance undertakings are assessing their capital adequacy needs
relative to their risks (i.e. the Supervisory Review Process, or SRP).
• To perform this role, they are empowered to require remedial actions
when capital does not seem to be adequate.
‒ The System of Governance: robust governance requirements being a
pre-requisite for an efficient solvency system, (re)insurance company
are requested to comply with the requirements on fit and proper, risk
management, the own risk and solvency assessment (ORSA), internal
control, internal audit, the actuarial function and outsourcing.
In particular, the underlying objective of the ORSA is to ensure
• they identify and assess all risks they are (or could be) exposed to;
• they maintain sufficient capital to face these risks; and
• they develop and better use risk management techniques in
monitoring and managing these risks.
Pillar II: Qualitative Requirements & Rules on
Supervision
1
2
Pillar 2
Qualitative
Requirements &
Rules
on Supervision
Own Risk and
Solvency
Assessment (ORSA)
Capabilities and
powers of regulators,
areas of activity
Governance
31
© 2012 Deloitte SA. Private and confidential.
Pillar III: Supervisory Reporting and Public Disclosure
Pillar 3
Supervisory
Reporting and Public
Disclosure
Transparency
Disclosure
requirements
Competition related
Elements
ctivity
Disclosure
Pillar III deals with market transparency and discipline in the insurance
industry, ensuring that firms publish key information that is relevant to
the market.
• Market transparency and discipline will be increased in order to provide a
better insight into the actual risk and return profile of an insurance company.
• Disclosure, market transparencies and market disciplines will include:
– Solvency & Financial Condition Report
– Extensive publishing duties
– Risk-Management Processes
– Scenario-Analysis
– Reinsurance Processes
– Push transparency towards corporate governance
– Dialogue with IASB
• Pillar 3 will aim to harmonise reporting to supervisors, including different
types of information a supervisor needs to perform its functions and
information normally not in public domain
• A more consistent and open regulatory framework should make it easier for
companies to sell across different markets, promoting competition
32

17
© 2012 Deloitte SA. Private and confidential.
Contents
What is Solvency II for insurers
Implications for Asset Managers
33
© 2012 Deloitte SA. Private and confidential.
Opportunities and challenges for asset managers Solvency II is presenting opportunities and challenges for asset managers. Asset managers who
recognise the opportunities and address the challenges early will have a competitive advantage
over their peers.
.
Pillar 3 Market Discipline
Opportunities
• Insurers need managers who can provide quality data in a timely fashion
Providing quality data in a timely
fashion is a business imperative for attracting insurance business
Challenges
• Report delivery time and frequency In general, the current report delivery timelines are not satisfactory for public disclosure requirements and the frequency does not allow the management to react quickly to changes in business or environment. Insurers will need quality data within days of quarter end to meet current proposed reporting requirements to regulators of 20 business days.
• On-demand capability
A compliant insurer must be able to answer supervisor’s queries promptly and provide supportive quantitative information.
Pillar 2 Supervisor Review
Opportunities
• Insurers will want to invest with managers that can evidence minimal operational risks
Insurers are required to understand and
manage all risks including outsourced services.
Challenges
• Evidencing risk management to clients
SAS 70s generally cover financial reporting risks, so evidencing risk management over investment risks will be a challenge (regular DD reviews are not likely to fulfil this requirement). Insurers need to quantify the risks embedded in the asset manager.
• On-going risk management Insurers will need to monitor asset
managers and their products on an on-going basis.
Pillar 1 Quantitative Requirements
Opportunities
• Creating bespoke products Insurers will need tailor made products
that reflect their risk tolerances and minimise capital requirements
Challenges
• Availability and quality of input data Updated quantitative methodologies may require more detail on investment strategy and investments data from the investment manager which may require new processes with custodians and administrators.
• Granularity of data and analysis
The regulation requires more detailed analysis of risks and sensitivities, which increases the volume of modelling data that needs to be processed by actuaries.
• Different requirements Different Insurers are likely to have
different information requirements for their models.
34

18
© 2012 Deloitte SA. Private and confidential.
ALM in light of Solvency II Capital charge by asset type and some consequences
35
Some predictions you have certainly already
heard :
• Increasing demand for government bonds
• Reduction of investments in risky assets
• Increasing demand for derivative instruments
and structured products
49%
39%
25%
7.5%3.3% 2.7%
0%
25%
11%9%
0%
10%
20%
30%
40%
50%
Private Equity/ Hedge
Funds
Equities Property Credit BBB Credit AA Credit AAA Government bond
10 year credit
3 year credit
But also increased discussions regarding:
• Risk/return asset profile vs. liability profile
• Initial solvency position and risk appetite
• Business strategy and choice of risks
retained
ALM is a major component of Pillar II and
ORSA (Own Risk and Solvency Assessment)
© 2012 Deloitte SA. Private and confidential.
Tailored asset structures for Solvency II purposes Challenges of transparency on risk reporting
36
•Under the Solvency II Standard Formula, insurers will need to obtain reporting on the
sensitivity of each investment to the following dimensions defined in the market risk
module: Equity, Spread, Interest, Property, Currency, Illiquidity and Concentration
• The capital charge for market risk module (SCRMarket) is calculated at each sub-module
and then a pre-defined correlation matrix is used to determine overall capital requirement
• Treatment of investment funds under (SCRMarket) can follow on of those 3 methods:
• Look-through approach: composition of the fund is known and each sub module
applied to relevant underlying assets of the fund to estimate overall SCRMarket
• ->This is the approach to favor
• Mandate-based approach: assumes the investment fund invests in accordance with
its mandate in a way to produce the maximum overall capital requirement
• -> Need to define the maximum risk under the mandate
• Alternatively, if the investment fund is neither transparent nor its mandate clear
enough, it triggers the highest capital requirement (40%).
• -> The trigger to disinvestment by many insurers from hedge funds real estate
and private equity

19
© 2012 Deloitte SA. Private and confidential.
Risk Management in non-financial
Corporations
3
© 2012 Deloitte SA. Private and confidential.
Contents
Introduction: New Context
Integrated Corporate Financial Risk Management
38

20
© 2012 Deloitte SA. Private and confidential.
More global means more risks Corporations in Switzerland are getting more global...
... and this creates additional risks
39
Interest rates
Good: current cost of financing
Bad:
• Refinancing 2011-13: term & currency
• Value of leveraged/financed projects
• Cost of hedging (upward slope + vol)
• Low return on liquidities and cash
Cash management
• Pooling of cash with multiple
currencies, locations
• Dealing with more banks (credit &
country risk)
• Capital movement restrictions in some
countries
Exchange rates
Good: imports, global acquisitions
Bad:
• Competitiveness of exports (pricing,
margins)
• Consolidated value of net assets
• Transaction risks intercompany
• Cost/benefits of business relocations
Commodity price
• Cost & supply of inputs for food &
beverage, manufacturing, etc.
• Energy: cost of transportation, shipping
and heating/cooling
• Uncertain value of inventories
• New commodities = new risks
• Volatility = cost of hedging (margin)
© 2012 Deloitte SA. Private and confidential.
Hedging challenges Some exposures are naturally hedged but some remain
40
• Identify and measure how
FX, commodity and interest
rates interact and affect
results on a consolidated
basis (eg. oil cost vs USD
revenues)
1. Modify the business model (pricing,
integration, M&A, relocate production in
export markets,...)
but these decisions have strategic
and structural implications (tax,
human capital, infrastructures, inputs
supply, know how, feasibility, timing…)
2. Consider financial hedges: key domain
of the treasurer
Two ways to hedge net exposure
Assess net exposure across
all risks and business

21
© 2012 Deloitte SA. Private and confidential.
Contents
Introduction: New Context
Integrated Corporate Financial Risk Management
41
© 2012 Deloitte SA. Private and confidential.
The risk management framework How to optimize the hedging strategy with corporate objectives
42
Business model
Key Targets
Working Capital
EBIT Net Inc
ROCE ROE
EVA SVA
+ =
Board of Directors Treasurer
Pro-forma financials
Risk factors sensitivity
Forecasted cash flows
EBIT = Earnings Before Interests & Taxes; ROCE = Return On Capital Employed;
ROE = Return On Equity; EVA = Economic Value Added; SVA = Shareholder Value Added;
Hedging strategy
+
Derivatives
Hedge Accounting
Hedge Accounting
Results risk profile
After hedging
Key risk factors
1y 2y
Before hedging
1
2
3
5 4

22
© 2012 Deloitte SA. Private and confidential.
Setting risk appetite and objectives Tone from the top
43
Challenges:
• Keep discussion at macro and strategic level
• Avoid consensus forecast (think out of the box)
• Cover all strategic objectives and prioritize at the same time
Macro
sensitivity
analysis
Define
tolerance
levels
Document risk
appetite
• Economic &
Accounting
• Prices impact
• Horizon (1-3y)
• Identify
• Prioritize
• Debate & vote
• Scenarios
• Constraint
• Debate & vote
• Key targets
• Tolerance levels
• Hedging
approach
Define
key targets
Workshop with the Board of Directors
Key Targets
Working Capital
EBIT Net Inc
ROCE ROE
EVA SVA
1
© 2012 Deloitte SA. Private and confidential.
Identifying business model exposures Key challenges
44
Pro-forma
financials
Risk
factors
sensitivity
Forecasted
cash flows
Hedge
Accounting
• Define clear pro forma financials based on expected results and market prices
• Develop long term forecasts of corporate cash flows
• Identify all relevant market risks impacting financial results (B/S, I/S, CFS, ratios, etc)
• Map material accounts impacted by change in key risk factors:
- Translate risk factor changes into accounting results and cash movements over
the time horizon
- Combine cross effects of risk factors (eg. FX + Interest rates)
• Consolidate all accounts with modeled sensitivities
- Need tool to combine all accounts under specific GAAP with consolidation of risk
factor effects
- Consolidated picture & single entity perspective
- Avoid being lost in details & keep coherence of results
• Add capacity for financial hedges to the business model
- Define types of derivatives and related accounting rules (Fwd, Swap, Futures,
Options)
- Assess financial statements impacts from changes in markets, with hedge
accounting or not
Business model
Pro-forma financials
Risk factors sensitivity
Forecastedcash flows
Hedge Accounting
2

23
© 2012 Deloitte SA. Private and confidential. 45
Modeling market risk factors Key challenges
• Coherent with past data
and current markets
• Steps (month/quarter)
• Horizon (1 – 3 y)
• Use historical data
• Mean reversion
• Regime changes
• Seasonnality
Building scenarii &
models
Testing scenarii &
models
• Coherent co-
dependence &
correlations
• Don‟t miss potential
worst cases
• Back-test results
• Usable in business
model
Forecast key risk
factors
3
© 2012 Deloitte SA. Private and confidential.
• Present key target variables and time horizon
• Illustrate tolerance levels
• Present clear distribution of net risk exposures
• Measure combined effect of different risk factors
• Measure aggregate impact on the whole business model
46
Building corporate risk reporting Key challenges
Results risk profile
Before hedging
4
24
© 2012 Deloitte SA. Private and confidential.
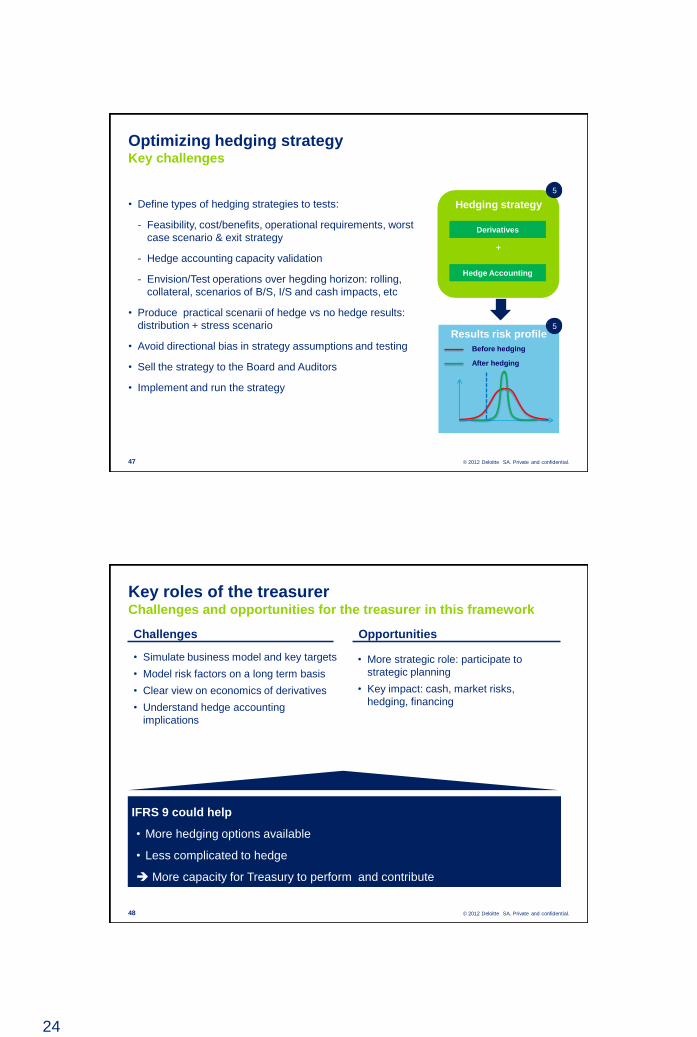
• Define types of hedging strategies to tests:
- Feasibility, cost/benefits, operational requirements, worst
case scenario & exit strategy
- Hedge accounting capacity validation
- Envision/Test operations over hegding horizon: rolling,
collateral, scenarios of B/S, I/S and cash impacts, etc
• Produce practical scenarii of hedge vs no hedge results:
distribution + stress scenario
• Avoid directional bias in strategy assumptions and testing
• Sell the strategy to the Board and Auditors
• Implement and run the strategy
47
Optimizing hedging strategy Key challenges
Results risk profile
After hedging
Hedging strategy
+
Derivatives
Hedge Accounting
Before hedging
5
5
© 2012 Deloitte SA. Private and confidential.
Key roles of the treasurer Challenges and opportunities for the treasurer in this framework
48
Challenges Opportunities
• Simulate business model and key targets
• Model risk factors on a long term basis
• Clear view on economics of derivatives
• Understand hedge accounting
implications
• More strategic role: participate to
strategic planning
• Key impact: cash, market risks,
hedging, financing
IFRS 9 could help
• More hedging options available
• Less complicated to hedge
More capacity for Treasury to perform and contribute

25
© 2012 Deloitte SA. Private and confidential.
Risk Management in Commodity
Trading
4
© 2012 Deloitte SA. Private and confidential.
Business Strategies and Related Risks
An entity may choose to engage in various business strategies, including certain types of financial
activities (thereby incurring risk), because it believes that it is well positioned to profit from such activity.
REWARD
RISKLow High
High
Low
Marketing
Trading
Dealing
Note: marketing and dealing activities may present
greater or lesser risks depending on specific
strategies utilized.
An integrated energy company may engage in
marketing, dealing, or trading.
Each of these activities entails very different
risk profiles with corresponding risk/return
relationships as depicted.
Marketing is the activity of selling available
energy that is backed up by a company‟s
generation assets.
Dealing is the process of entering into
simultaneous transactions for which the risks
offset, locking in a margin in between.
Trading entails consciously taking a market
position based on a proprietary view of market
conditions and prices. In trading, there is a
clear recognition that the proprietary positions
result in market price exposure, but there is an
expectation of additional profit from assuming
this risk.
50

26
© 2012 Deloitte SA. Private and confidential.
The risk of human error or
fraud, or that the system of
control will fail to adequately
record, monitor, and account
for transactions or positions.
The potential financial loss
resulting from a counterparty‟s
failure to honor its obligations.
The potential change in value
of a contract, liability or cash
flow given adverse movements
in market factors.
Policies and
procedures
Controls
Limits
Probability of
counterparty default
Amount of
counterparty
exposure
Volatility of markets
Price Risk
Curve/Model Risk
Liquidity Risk
Spread Risk
Location Risk
Option Risk
Volumetric Risk
Operational
Risk
Credit Risk
Market Risk
Definition Components Risk Type
Difficult to Measure
Measurable
Measurable
Measurability
Energy Trading Related Risks There are 4 categories of risk to measure and manage
The risk to fall short of
liquidities in the overall books
of the companies due to the
structure of cash inflows and
outflows
Contractual inflows
and outflows
Cost of financing
Effects of Market and
Credit Risks on cash
Treasury
Risk
Difficult to Measure
51
© 2012 Deloitte SA. Private and confidential.
Accounting Flow Transaction Order
Economical Flow Product Pricing
Month 2
Brent
Physical Flow Product
Transportation Time
Treasury Flow Definitive Cash Settlement
Transaction Flow View
Transaction Risk View
Market Risk
Operational Risk
Credit Risk
Treasury Risk
Provisional Cash Flow
Inventory Recording
Risks in a transaction lifecycle There are four dimensions of flows that interact to impact the
different types of risk over the lifecycle of commodity trading
52

27
© 2012 Deloitte SA. Private and confidential.
Drivers of Risk Affects Examples
Market Changes Prices Oil Price Increase
Volatilities Spark-Spread
Correlation Trader Confidence
Demand Volatilities
Liquidity
Commodity Physical System Changes Storage Available Capacity
Capacity Forced Outage
Delivery
Transmission
Human Error Trader Administrative Error
Quant Valuation Error
Management Trading Loss
Credit Management Decision
Modeling
Drivers of Risk Amount and change in level of risk can be affected by a number of
drivers
53
© 2012 Deloitte SA. Private and confidential.
Volumetric Risk:
Changes in value of assets and liabilities from the change in customer demand.
Example:
Power demanded varies in response to customer outages, weather, market prices etc. These
changes in demand can affect market prices, net supply positions, and portfolio value.
Credit Risk:
Credit Risk is the potential loss of value from the default of payment or delivery by a
counter-party less recovery.
Examples:
1. Counter-party does not deliver power associated with a physical call option. Power must be
procured at current market prices.
2. Counter-party does not pay for delivered power.
Volumetric and Credit Risks Value of a portfolio can change as a result of volatility in market
price, physical volume demanded and counterparties ability to fulfil
commitments
54

28
© 2012 Deloitte SA. Private and confidential.
Types of Risk Analysis
• Current Risk: Portfolio Mark to
Market
• Probable Risk: Value at Risk (VAR)
• Improbable Risk: Risk Stress and
Scenario Simulation
• Portfolio Sensitivity
–Delta
–Gamma
–Vega
–Theta
–Rho
• Credit Exposure/Credit Value at Risk
Measures
• Portfolio value at a period of time
• Measures potential losses to portfolio value in a given
time period with a confidence interval
• Provides a broader view of potential market scenario
occurrences including unusual events
• Measures the sensitivity of portfolio value changes to
changes in drivers
• Sensitivity to price change
• Sensitivity to volatility change
• Sensitivity to time
• Sensitivity to discount rates
• Sensitivity to changes in delta
• Measures current and potential exposure to risk of default
of payment and delivery as well as potential recovery.
CVAR measures potential exposure.
Type of Risk Analysis Market Risk is measured by analyzing changes in portfolio values
55
© 2012 Deloitte SA. Private and confidential.
Constructing a forward curve that is useful for trading and risk management
purposes often involves an elaborate extrapolation exercise
The resulting curve is typically partly market-based and partly model-based,
and hence may not be entirely transactable.
If a majority of price setters end up using similar econometric models – for
example mean-reverting -- it is possible (but by no means guaranteed) that
model-based forward prices converge to market prices at the longer end of
the curve.
As the markets get deeper and more liquid, longer dated instruments will
begin to appear, and the forward curve will be more market-based and less
model-based in course of time.
While longer dated contracts are presently transacted in OTC markets, the
forward curves underlying these transactions are not publicly available.
Understandably, these curves are viewed as extremely proprietary.
Given liquidity in energy and especially power markets is limited to short maturities (12-
18 months), a forward curve needs to be synthetically constructed from market data.
Type of Risk Analysis – Current Risk Forward curves
56

29
© 2012 Deloitte SA. Private and confidential.
The maximum shortfall of earnings, relative to a specified
target, that could be experienced over a given horizon
period at a given level of confidence.
The maximum shortfall of value, relative to a specified
target, that could be experienced over a given horizon
period at a given level of confidence.
The maximum shortfall of net cash generated, relative to a specified target, that could be experienced over a given horizon period at a given level of confidence.
Earnings at Risk
(EaR)
Value at Risk
(VaR):
Cash Flow at Risk
(CFaR):
Type of Risk Analysis – Probable Risk Probable risk measures take into consideration the stochastic
variation of historical prices to indicate potential exposure
57
© 2012 Deloitte SA. Private and confidential.
Management and Measurement of Risks
58
VIEW
RISK OBJECTIVE
RISK MEASURE
PERFORMANCE MEASURE
TRADING WHOLESALE
MARKETING
RETAIL
MARKETING RESOURCES
Long-Term Long-Term Short-Term Short-Term
Balanced Minimized Minimized Exposed
EaR EaR VaR VaR
CFROI CFROI RAROC RAROC
PORTFOLIOS
An activity based book structure more meaningfully distinguishes between different
risk objectives and capital utilization, and better supports alternative risk and
performance measures.
Cash Flow Return on Investment (CFROI): an approximation of the average real rate of return earned by a
company on all of its operating assets; a discounted cash flow (DCF) metric.
Risk Adjusted Return on Capital (RAROC)): the ratio of return (often adjusted by expected loss) to economic
capital, where economic capital is defined as VaR and GMaR for trading activities plus unexpected loss.
58

30
© 2012 Deloitte SA. Private and confidential.
Tiers of Complexity for Advanced Analytics
Market
Research
Deterministic
Models
Dynamic
Valuation/Risk Measurement
Dynamic
Optimization
• Optimize individual assets (e.g. storage)
• Optimize portfolios using risk and expected return
• Optimize tactical activities (e.g. fuel procurement)
• Incorporate volatility and correlation
• Generate Earnings/Cash Flow @ Risk measures
• Quantify optionality across the value chain
• Forecast flat prices and diffs
• Model arbitrage opportunities
• Generate intrinsic value estimates of options
• Process fundamental and technical market data
• Estimate market trends
59
© 2012 Deloitte SA. Private and confidential.
Example of Advanced Analytics – O&G
60
Market
Research
Price
Forecasting
Arbitrage
Transport
(pipelines/shipping)
Portfolio
Optimization
Crude
Supply
Directional
intuition only
Deterministic
Models
Dynamic
Valuation/Risk
Measurement
Using
fundamental
and/or technical
methods
Dynamic
Optimization
Storage
Using
Fundamental
and/or
technical
methods
Includes
single price
forecasts and
other market
conventions
Generates
“intrinsic value”
estimates
based on
deterministic
forecast
Incorporate
volatility and
correlation
Generate “extrinsic
value” estimates
for location spread.
Real option value of
destination switching
Quantify the option
to wait to purchase
crude supply
Options across time
and crude type
Time spread
options
Optimal injection/
withdrawal
Portfolio of assets,
structured
contracts, hedges
and trades each
with a value and a
risk level
Maximize the
portfolio value
given an specified
level of risk
60
31
© 2012 Deloitte SA. Private and confidential.
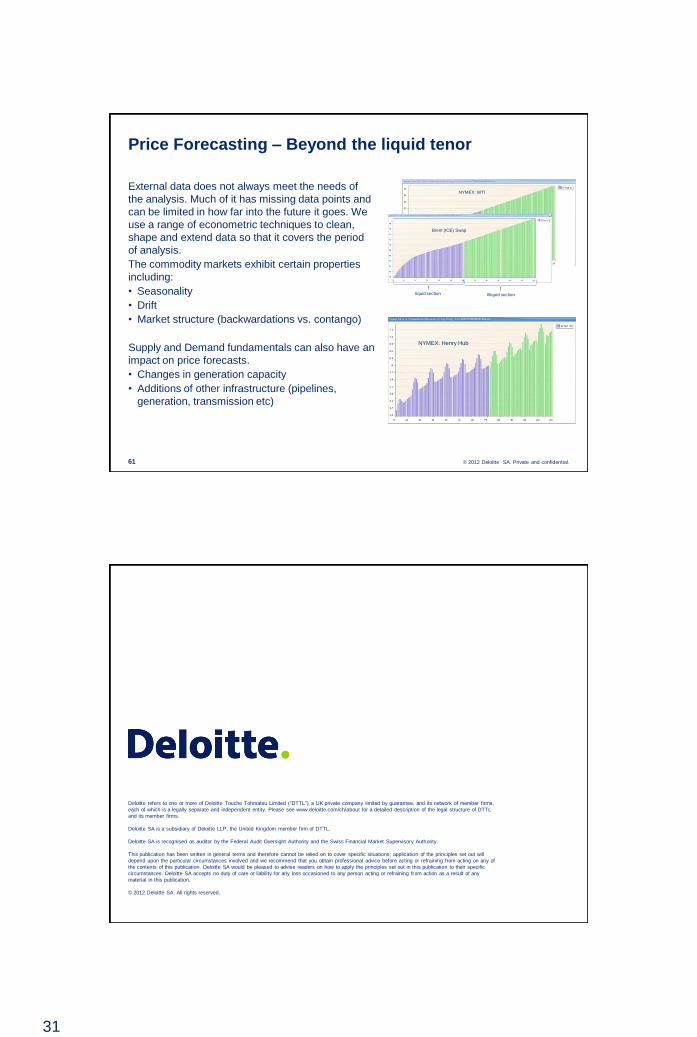
External data does not always meet the needs of
the analysis. Much of it has missing data points and
can be limited in how far into the future it goes. We
use a range of econometric techniques to clean,
shape and extend data so that it covers the period
of analysis.
The commodity markets exhibit certain properties
including:
• Seasonality
• Drift
• Market structure (backwardations vs. contango)
Supply and Demand fundamentals can also have an
impact on price forecasts.
• Changes in generation capacity
• Additions of other infrastructure (pipelines,
generation, transmission etc)
Price Forecasting – Beyond the liquid tenor
NYMEX: WTI
Brent (ICE) Swap
Illiquid sectionliquid section
NYMEX: Henry Hub
61
© 2012 Deloitte SA. Private and confidential.
Deloitte refers to one or more of Deloitte Touche Tohmatsu Limited (“DTTL”), a UK private company limited by guarantee, and its network of member firms,
each of which is a legally separate and independent entity. Please see www.deloitte.com/ch/about for a detailed description of the legal structure of DTTL
and its member firms.
Deloitte SA is a subsidiary of Deloitte LLP, the United Kingdom member firm of DTTL.
Deloitte SA is recognised as auditor by the Federal Audit Oversight Authority and the Swiss Financial Market Supervisory Authority.
This publication has been written in general terms and therefore cannot be relied on to cover specific situations; application of the principles set out will
depend upon the particular circumstances involved and we recommend that you obtain professional advice before acting or refraining from acting on any of
the contents of this publication. Deloitte SA would be pleased to advise readers on how to apply the principles set out in this publication to their specific
circumstances. Deloitte SA accepts no duty of care or liability for any loss occasioned to any person acting or refraining from action as a result of any
material in this publication.
© 2012 Deloitte SA. All rights reserved.
62