Embed Size (px)
Citation preview
APPRAISAL OF SEVERAL METHODS OF TESTING ASPHALTIC CONCRETE
FRED J. BENSON RESEARCH ENGINEER
THE TEXAS A. AND M. COLLEGE SYSTEM
G11JB GILCHRIST, Chancellor
TEXAS ENGINEERING EXPERIMENT STATION
BL'LLETIN NO. 126 H. W. BARLOW, Director
JUNE 1952 ARTHUR W. l\IELLOH, Vice-Direetor
COLLEGE STATION, TEXAS Lours ]. HoRr-;, Sllf'u"l'i>m of P11hlic,i/ion•
PUBLISHED IN 1952
ii
FOREWORD
During the past twenty years a number of laboratory methods have been developed for compacting asphaltic concrete mixtures and testing them for stability or resistance to displacement under load. Their use has brought speculation by engineers as to correlation between methods.
In research to determine correlation the Texas Engineering Experiment Station tested about 1600 specimens of asphaltic concrete. The work involved study of six laboratory methods of test for stability and of three compaction procedures.
Correlation between results of the six stability test procedures ranged from none to rather good. Different stability test procedures were found to measure the fundamental factors of internal friction and cohesion in quite different ways. Data were also obtained on the manner of variation of the stability values with change in type of aggregate, change in asphalt content, change in hardness of asphalt, and change in compa~tion procedure.
The research brought out also that one of the greatest ~1eeds in the field of testing of asphaltic concrete is agreement on a standard procedure for laboratory compaction of the specimens for testing.
Details of the experimentation are presented in this bulletin for the information of the working group in highway technology.
iii
ACKNOWLEDGMENT
The author expresses his appreciation to Joe Schultz, Gus R. Pape, W. B. Collier, J. H. McFarland, Pete Styner, Norman C. Arthur, Roy Carpenter, W. M. Hillis, Truman Evans, and W. C. Wright for preparing the test specimens and assisting with the testing and to Marshall Brown and Harry A. Sandberg, Texas Highway Department Laboratory, for advice and assistance in connection with the laboratory tests. He also gratefully acknowledges gifts of materials for the project as follows: asphalt cement, the Texas Company; cut-back asphalt, American Republic Oil Company; limestone aggregate, Servtex Materials Company, New Braunfels, Texas; and sand and gravel, GiffordHill Company, Hearne, Texas.
iv
CONTENTS
Summary __ 1
Introduction__ 2
Materials and Mixtures 3
Preparation of Specimens and Determination of Density 8
The Stability Test Procedures __ ---- - .17
Experimental Results _
Correlations Between the Stability Tests
Effect of Variations in Constituents upon the Stability of Hot-Mix Asphaltic Concrete as Measured by the
- - __ 32
.40
Various Stability Test Procedures .56
Effect of Molding Procedure on Density of Laboratory Specimens _ .63
Effect of Compaction by the Marshall and Texas Highway Department Methods on the Stability Values .64
GeneraL _ 66
Conclusions__ .. 67
References__ _71
Selected Bibliography 73
v
APPRAISAL OF SEVERAL METHODS OF
TESTING ASPHALTIC CONCRETE
SUMMARY
This bulletin presents the results of a rather extensive study of asphaltic concrete test procedures. Three methods of compaction-the Marshall method, the Texas Highway Department method, and the Asphalt Institute method-were used. Six stability test procedures-the Hveem stability test, the Marshall stability test, the direct compression test, the Asphalt Institute stability test, the cohesiometer test, and a modification of the Texas Highway Department punching shear test-were studied. The primary objectives of the studies were: (1) to determine whether or not correlation existed between the various test procedures, (2) to study the effect of variations in type of aggregate, quantity of asphalt, and grade of asphalt on the various stability values, and (3) to study the effect of compaction procedure on the density of the mixtures and on the results of the stability tests.
The three compaction procedures were found to produce significant differences in density. The Marshall and Texas Highway Department procedures were studied for all of the stability procedures except the Asphalt Institute and were found to produce specimens showing considerable difference in stability values for all test procedures except the Hveem. These differences indicate a definite need for agreement on a laboratory compaction procedure for asphaltic concrete mixtures.
No correlation was found between the results of the Hveem stability test and the results of the other stability test procedures. Some correlation was found between the other stability test procedures. The correlation ranged in degree from good to very poor.
All of the stability test results except those from the Hveem stability test were materially influenced by the grade of asphalt cement used in the mixture.
The Marshall stability, Texas Highway Department punchlng shear, the ultimate strength in direct compression, and the !lsphalt Institute stability test results all show the same type )f variation in stability with variation in asphalt content.
1
TESTING AsPHALTIC CONCRETE
For the Marshall compaction procedure and a given grade of asphalt the maximum stability values for the Marshall stability, the ultimate strength in direct compression, the Asphalt Institute stability and the Hveem stability all indicate approximately the same difference in aggregate characteristics for the four aggregate combinations studied. The Hveem stability test is considered to be the best for studying the characteristics of the mixture which are dependent on the type of aggregate.
INTRODUCTION
Asphaltic concrete pavements are plant mixtures of aggregates and asphaltic materials usually laid and compacted by machine. The requirements normally placed on the compacted mixture are those for stability (ability to resist the traffic load) and those for density. It is generally considered that the stability of asphaltic concrete mixtures is dependent upon the shear strength of the compacted mixture. The shear strength of granular materials is a function of the intergranular resistance to sliding or internal friction and the intergranular resistance to being pulled apart (cohesion).
A number of methods for determining the stability of asphaltic concrete mixtures are in present day use. These test methods measure the stability of the mixture in a more or less arbitrary manner, and their value lies in the extent to which the stability value obtained from the test has been correlated with the performance of the material in the pavement. Little work has been done with the idea of establishing the relationship between these variable test procedures and this research was instituted with the major objective of studying the relation between a number of the commonly used test procedures.
The specific objectives of this research project were as follows:
1. A study of six methods for determining the stability of asphaltic concrete to determine whether or not correlation exists between the methods. The stability methods studied were: Hveem stabilometer .~.~ .. <;.]\) Marshall stability,''·' Texas Highway Department punching shear,' direct compression, 11 ·1~
cohesiometer.~· and Asphalt Institute stability test.~
2. A study of the effect of variations in type of aggregate, percentage of asphalt in the mixture, and hardness of asphalt upon the stability values found by the six procedures.
TESTING ASPHALTIC CONCRETE •) ·.)
3. A study of the effect of three methods of preparing laboratory specimens-(1) the Marshall compaction method, (2) the gyratory compaction method used by the Texas Highway Department, and (3) the Asphalt Institute compaction method-upon the density of various asphaltic concrete mixtures.
4. A study of the effect of two methods of preparing laboratory specimens-the Marshall compaction method and the gyratory compaction method used by the Texas Highway Department-upon the stability values found by the following methods: Hveem stabi.lometer, Marshall stability, Texas Highway Department punching shear, direct compression. and cohesiometer.
The six stability test procedures selected for study cover those most widely used for the testing of asphaltic concrete in the United States and cover a wide range of type of test.
MATERIALS AND MIXTURES
The major portion of about 1600 specimens tested were prepared using standard aggregates and aggregate combinations. The aggregates used in the project were as follows:
1. Crushed limestone in various sizes.
2. Limestone dust obtained from the crushed limestone by grinding it in a ball mill and screening through a No. 200 sieve.
3. Washed gravel.
4. Washed sand originally intended for use in portland cement concrete from which the fraction larger than the No. 10 sieve was discarded for thi.s project. This sand is hereafter referred to as sand A.
5. A field sand or blow sand which was prepared for use by washing it over a No. 200 sieve in order to remove the major portion of the silt and clay and by screening it over a No. 10 sieve. This sand is hereafter referred to as sand B.
Five sieve analyses were run on each of the aggregates except the limestone dust. The average values c•btained from these sieve analyses are shown in Table 1.
The bulk specific gravity of the aggregates was obtained by the "Standard Method of Test for Specific Gravity and
TESTING ASPHALTIC CoNCRETE
Absorption of Fine Aggregate" (AASHO T 84-45 and ASTM C 128-42) except that a vacuum was used to remove the air from the water. Three bulk specific gravity determinations were made for each material. The bulk specific gravity was checked by using the pycnometer method employed by the Texas Highway Department. The average specific gravities of the rna terials are shown in Table 1.
TABLE 1
SIEVE A:\"ALYSIS A:\'D SPECIFIC GRAVITY OF AGGREGATES lTSED I~ ASPHALTIC COKCRETE .'\IIXTPRES
Fine Aggregates (Predominately Finer than ~o. 10 Sieve)
Sand A Sand B
Pa~s 11" ~ereen, ret'd. no. 10 siE:>vc, per cent
Pa~~ no. 10 ~den· ret 'd. no. 40 sieYl', per cent ~-5
Pa~" no. 40 s~eve ret'd. no. 10 ~ieve. per cent 4:2.(i :37.7
Pass no. ~0 sieve ret'd. no. 200 sieve, 1wr cent
Pa~s no. 200 :-;iew· 0.4 2.9
Specific gravity 2.024 2.622
--- ~-~-- Fraction of Limestone Limestone Screeninns Screenings
12.2
47.6
13.4
9.fi
17.3
2.573
Passing No. 10 Sieve
54.2
15.3
IO.H
19.7
2.573
Coarse Aggregates (PrPdominatt•ly Coarser than Xo. 10 Sieve)
Pas,_ ,-,,.." ~ereen, ret\l. 1:.!"
~cre:::n, 1wr eent
Pa.s.s 1 :.!" scret•n, ret'd. 1 1 "
screen, per cent
Pass 1,4" screen, ret'd. no. 10 ~ievc, per cent
Pas~ no. 10 ,.;ievt•, rct'd. no. 40 sieve. per cpnt
Pa::-s no. 40 si('Ve. rwr cent
SpE:cific gravity
Crushed Limestor;e :Y ... "- ~;.j_,
94.9
1.3
0.0
0.0
2.525
:\Iineral Fillers
Pass no. 1"0 "-ieve. ret' d. no. 200 sieve, JH•r cent
Pass no. 20(1 ~ie\·e. per cent
Specific gravity
Crusted __ _ Lim!!~tone
lfJ"-No. 10
0.0
10.4
77.9
11.:3
o.:J
2.516
Portland Cement
3.0
97.0
3.100
Washed River Gravel
·-1>." -No. 10
0.0
46.1
44.3
8.f>
1.0
2.624
Limestone Dust
0.0
100.0
2.725
The asphalt cements used in preparing the asphaltic concrete mixtures were obtained from the Texas Company. The
TESTING ASPHALTIC CONCRETE
four grades of asphalt cements used conformed to the Texas Highway Department specifications.
The specific gravities of the asphalt cements were obtained in accordance with the "Standard Method of Test for Specific Gravity of Bituminous Materials" (AASHO T 43-35) using the pycnometer method. The grades of asphalt used, and the respective specific gravities were:
Grade of Asphalt Cement Oil At>phalt OA-55 150-!.JO pl'nt>tration) Oil A~phalt OA-~10 j R5-100 pent'tration l
Oil Asphalt OA-1:35 Oil Asphalt OA-2:10
( 120-150 penetration l 1210-250 penetration 1
Specific Gravity 1.016 1.021 lsh<'('t asphalt mixtUl't.'f'l
1.004 1 a~phalti<" eoncn t~· mixtur"s \ 1.010 1.011
The RC-2 cut-back asphalt used in the preparation of the cut-back asphaltic concrete mixtures was obtained from the Talco Refinery of the American Republic Oil Company. The material conformed to the specifications of the Texas Highway Department. The distillation residue at 680'F. was determined in accordance with AASHO T 28-49 ·'Distillation of Cut-Back Asphaltic Products." The amount of residue was found to be 77.5 per cent by weight and the specific gravity of the residue was found to be 1.025.
Four groups of mixtures were tested. The first group consisted of seven series of sheet asphalt mixtures prepared in the laboratory and conforming to Texas Highway Department Specifications S-317 "Hot-Mix Asphaltic Concrete Pavement Type E." The second group consisted of 22 series (16 mixtures) of laboratory hot-mix asphaltic concrete mixtures conforming to Texas Highway Department Specification S-317 "Hot-Mix Asphaltic Concrete, Type D.'' The third group consisted of five series (three mixtures) of cut-back asphaltic concrete mixtures conforming to Texas Highway Department Specification S-309 "Cut-Back Asphaltic Concrete, Type M.'' The fourth group consisted of 10 series (five mixtures) of asphaltic concrete mixtures furnished by the Texas Highway Department from actual highway construction projects. All of the mixtures in the fourth group conformed to Texas Highway Department Specification S-317. Three of them were Type "D" and two Type "C." The mixtures of group four were sampled at the paving plant, and approximately 200 pounds of the complete mixture as taken from the mixed batches was furnished to the laboratory for testing.
The compositions of the mixtures for each of the groups are shown in Tables 2, 3, 4, and 5 along with the governing specifications.
(i TESTING ASPHALTIC CONCRETE
TABLE 2
Co:\IPOSITIO:\ OF SHEET ASPHALT .\IIXTl'RES CO:\FOR:\ll:\G TO TEXAS HIGHWAY DEPART:\IE:\T SPECIFICATIO:\ S-317
"HOT-~IIX ASPHALTIC COXCRETE PAYE~IEXT, TYPE E"
Seri~s A
Sand A ·10.n I.im<'~tonp . ..-1-r·.·•·ninv~
s,.nd H .J(J.IJ Filkt· t Jimt·>-tOnl· clu~~ jl~l:-:~ir1g IW, 2(!() :-;lPVt·l 10.0
Filkt· l P'or1 :and (\_•mvntl
.\:-;phalt l't·m(>J1t
(()r\~JOJ 10.0
C'ompui<ltion of ~fixtures
Sedes B
~(}.0
.JIJ.O
10.0
1<l.O
PER CENT BY WEIGHT
Series c
:i7 .s
to.o
10.0
Series 0
:20.0
H.O
Series E
J :l.o
~-0 10.0
Sp<>cifications and Grading of Total AggT<>gate ----------------
Specifi--- -Serf~S -- -Series cation A B
-----
SiYiesc
Series 0
1-'as~ 10 ret'd. 40 i.S-·10 ~:i.~l 2a.!1 :!2.~ 21.0 Pass 40 ret'ct. so :!0---J.!i :i.).O ; .. ,G.i) :n. t :n.:i Pas:-; fill ret'd. 200 12-:52 21.H 2t<'.O :!fl.l :!:4.7 Pass200 11)-20 12.{) t:2.5 1~ .. ~ :23.0
Series E
2~.;; ;~:).!-j
:2fj.5 17 . .t
Series I<
:~~. :2 :z:·LH 2.-.:.9 1.).0
Series L
o<.o
The :.:>JH"'cificatim;--r;~-;-,j~~.-;:;-th-;\t tht' a~~pha]tif' -J~;;lt(-'rial ~hall i·~l~·m mixture- by \veight.
----
from 'i.:) to 1~', of the
TABLE :3
CO~IPOSITIO:\ OF FI:\E GRADED HOT-~IIX ASP HAL TIC COXCRETE ~IIXTl'RES CO:\FOIDII"G TO TEXAS HIGHWAY DEPARDIE:\T SPECIFICATIO:\ S-317, HOT-~IIX ASPHALTIC CO"ClmTE PA.\'E-
:\IEXT, TYPE "D"
Composition of A g·gregatt's
Cru,:.:.hed lime~tone ..• -; '' -'c1 '1
Cru,:.:.hed limt.-'stone, 1-! "-no. 10 \Vashed river gravel Limestone screenings Sand "A" Sand "B"
l----·--- _f'Eil_ CENT BY WEIGHT · Series Series Series ---Series
AD, BD FG, GO I<D. LD PD. QD CD, DO HD. 10 MD. NO RD. SO
:JO :JO
20 15 lt-i
()()
I~~mestone rlu:"t (pa,;sing no. 200 ...;ic\·e!
20 !!5
!)
Specifications and Grading of Total Ag·gregate
Pa~ ;,.., '' s~r~-;~---~--Pas~ L~" sereen Pa~s 1 ~" sert>e>n ret'd. 1,.1 " screen Pa~s 1 .1 " screen ret' d. no. 10 sieve Total ret'rl. on no. 10 sieve Pa.st5 nu. 10 r<"t'd. no. 40 Pass no. 40 ret'd. no. 1'10 Pass nu. 1'10 ret'd. no. 200 Pass no. 200
,____ PERCENTBYWEIGHT ---~--sirie5 Series Series
Specification : AD. BD FG. GO 1<0, LD _________ CD_._D_D_ HD. 10 MD. NO
100 H7 -100 2!5-C>O 15-:)fi 50-tiO
0-2El fi-25 5-25 2-10
100 99.1 21).:3 :lO.I
li>.:l 12.:" IG.h
!5.1
100 9~.9 ;)1.f)
2:i.~ fil).5 1·1.0 14.3
9.7 5.;)
100 100 26.~ 21'.9 55.7 17.~
9.\1 11.1
fi.O
Series PO, QD RD, SO 100 100
27.6 2(-;,t)
54.~ l5.f3 14.~ s.s 0.5
Grade of Asphalt Cement
OA 90
TESTING ASPHALTIC CONCRETE
Type and Quantity of Asphaltic Material
Quantity 1 Quantity -------QuantT\YT---, -Quantity Series Per Cent Series Per Cent 1 Series Per Cent i Series Per Cent
By Weig:..ht._,_ __ _,_ By Weight_' -···· ___ Br_Weightj_. _____ By Weight
AD ADT
HD
BDT
CD
CDT
DD
4.5 4.5
5.2:)
5.25
6.0
6.0
6.75
FD 4.5
GD 5.25
HD 6.0
lD 6.75
KD KDT LD
MD
4.5
4.5
5.25
6.0
4.0
4.0
PD 4.5
QD 5.25
RD 6.0
SD 4.0
------------ ------· --- --- --LD
3 5.25 OA 55
OA 135
OA 230
CD3
CD,
CD,
6.0
6.0
6.0
LD, 5.25
LD2
5.25
7
The specification requires that the asphaltic material shall form from 4 to 7.5'_,;. of the mixture by weight.
TABLE 4
COMPOSITION OF CPT-BACK ASPHALTIC CONCRETE PAVING MIXTURES COKFORl\IING TO TEXAS HIGHWAY DEPART:\fENT SPECIFICATION S-309, TYPE "M", FINE GRADED SllRFACE
COURSE
Composition of Mixtures
SERIES Total Mixture
Per Cent by Weight Aggregate Only All
Mixtures
----cB~M;----, DM ____ EM--
Crushed limestone, %-:1;4 Crushed l~mestone, lJ.i-10
Sand "A" Sand "B" RC-2
35 35 15 15
BM EM M M
32.9 32.9 14.1 14.1
6.0
32.73 32.73 14.02 14.02
6.5
83.07 33.07 14.1fl 14.1~
5.5
Specification and Grading of Aggregates
Pasging y..," screen
Passing 1;~" screen Passing lj~" screen, retained on lJ.!" screen
Passing ~" screen, retained on no. 10 sieve
Passing no. 10 sieve, retained on no. 40 sieve
Passing no. 40 sieve, retained on no. 80 sieve
Passing no. 80 sieve
100 97-100 30-60 20-40
5-20 5-15 5-15
100
98.~
36.8 27.8 12.1 12.2 9.~
The spedfication requires that the cut-back asphalt form from 5 tu 7t; of the mixturt" by weight.
8 TESTING ASPHALTIC CONCRETE
TABLE 5
COMPOSITION OF FIVE MIXTURES FROM TEXAS HIGHWAY DEPARTMENT CONSTRUCTION PROJECTS CONFORMING TO TEXAS HIGHWAY DEPARTMENT SPECIFICATION S-317, TYPE "D"
AND TYPE "C"
Type "D" Mixtures (Gradings Shown Are for Field Extraction)
Specifi· Series Series Series cations SB SG su
Pass% " scr een , ret' d. ~h " scr een 0-3 1.4 2.2 0.5 Pass 1f2" screen , ret' d. 1;4" screen 25-50 35.4 31.6 26.5 Pass 14 " screen , ret ' d. no. 10 s ieve 15-35 15.2 21.0 22.4 Total r etained on no. 10 s ieve 50-60 52.0 54 .8 49.4 Pass n o. 10 s ieve, ret' d . n o. 40 s ieve 0-25 12.2 17.3 16.5 P ass n o. 40 s ieve, re t' d. n o. 80 s ie ve 5-25 16.7 13.2 18.4 Pass no. 80 s ieve, r et' d . n o. 200 s ieve 5-25 11. 1 6.0 5.8 Pass no. 200 s ieve 2-10 3.6 3.8 5.3 Asph a lt cem en t 4.0 to 7.5 4.4 4.9 4.6
Grade aspha lt cement OA-90 OA-23 0 OA-230
Type "C" Mixtures (Gradings Shown Are for Field Extraction)
Pass 1" scr een, ret' d. ~4 " screen, pe r cent Pass %_" scr een , ret' d. 1,4 " screen , per cent Pass 7'2 " screen , ret'd.1,4 " screen , per cent Pass 1;4 " scr~en , r et ' d. n o. 10 s ieve Total retained on no. 10 s ieve, per cent Pass no. 10 s ieve , r et' d. no. 40 sieve, per cent Pass n o. 40 s ieve, r et' d. n o. 80 s ieve , per cen t Pass n o. 80 s ieve , ret' d. no. 200 s ieve, per ce n t Pass no. 200 s ieve Asp ha lt cement
Grade asph a lt cem en t
Specifications
0-3 15-40 15-40 10-30 50-65
0-25 5-25 5-25 1-10
3.5-7
Series SP
1.0 17.0 23.2 14 .7 55.9 14.8 11.9
8.8 4.6 4.0
OA-90
Series sc 0.5
19.5 22.4 17.1 59 .5 11.2 10.4
7.7 5.1 6.1
OA-1 35
PREPARATION OF SPECIMENS AND DETERMINATION OF DENSITY
Three compaction procedures, the Marshall compaction procedure, the Texas Highway Department compaction procedure , and the Asphalt Institute compactiOJ1 procedure were used in preparing the specimens. The details of proportioning, mixing, and compaction of the specimens are given in the following pages.
Sheet Asphalt Specimens and Hot-Mix Asphaltic Concrete SpeCimens
Marshall Compaction Procedure-The procedure used in preparation of the specimens by the Marshall method is given in "The Marshall Method for the Design and Control of Bituminous Paving Mixtures, Third Revision, February 1949."
1. The separate aggregates were dried and the quantities, to the nearest gram, required for a 1200-gram batch, were
TESTING ASPHALTIC CONCRETE 9
weighed into tared aluminum pans. The aggregates were thoroughly mixed with a small trowel.
2. The pans were then placed in a 350°F . oven and left for a minimum of four hours. Just prior to mixing of a set of specimens, the asphalt cement was heated in a separate container to 350°F .
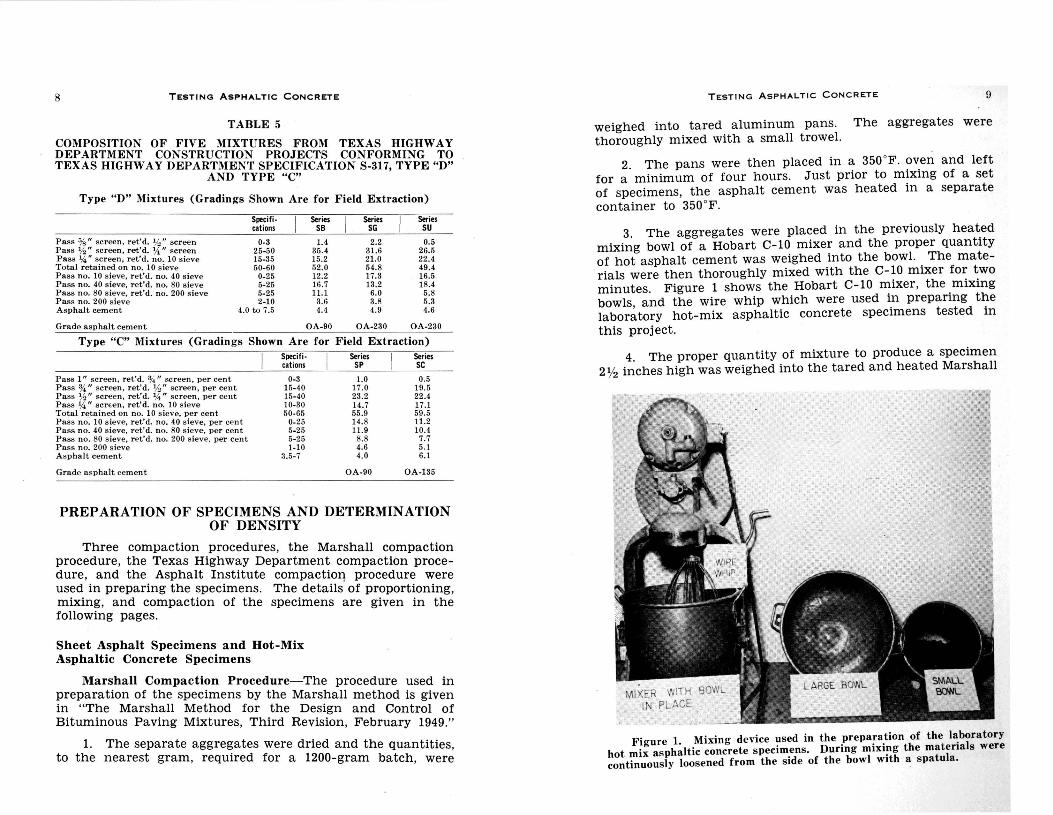
3. The aggregates were placed in the previously heated mixing bowl of a Hobart C-10 mixer and the proper quantity of hot asphalt cement was weighed into the bowl. The materials were then thoroughly mixed with the C-10 mixer for two minutes. Figure 1 shows the Hobart C-10 mixer , the mixing bowls and the wire whip which were used in preparing the labor~tory hot-mix asphaltic concrete specimens tested in this project.
4. The proper quantity of mixture to produce a specimen 2 lj
2 inches high was weighed into the tared and heated Marshall
Figure L Mixing device ~sed in the prepa~a.tion of the l~boratory hot mix asphaltic concrete specimens. Durmg miXmg the matenals were continuously loosened from the side of the bowl with a spatula.
10 TESTING ASPHALTIC CONCRETE
compaction mold and rodded with a trowel to eliminate segregation as much as possible.
5. The specime~ was then compacted by applying 50 blows to one face With the compaction hammer. The mold was then inverted and 50 blows were applied to the opposite face . .
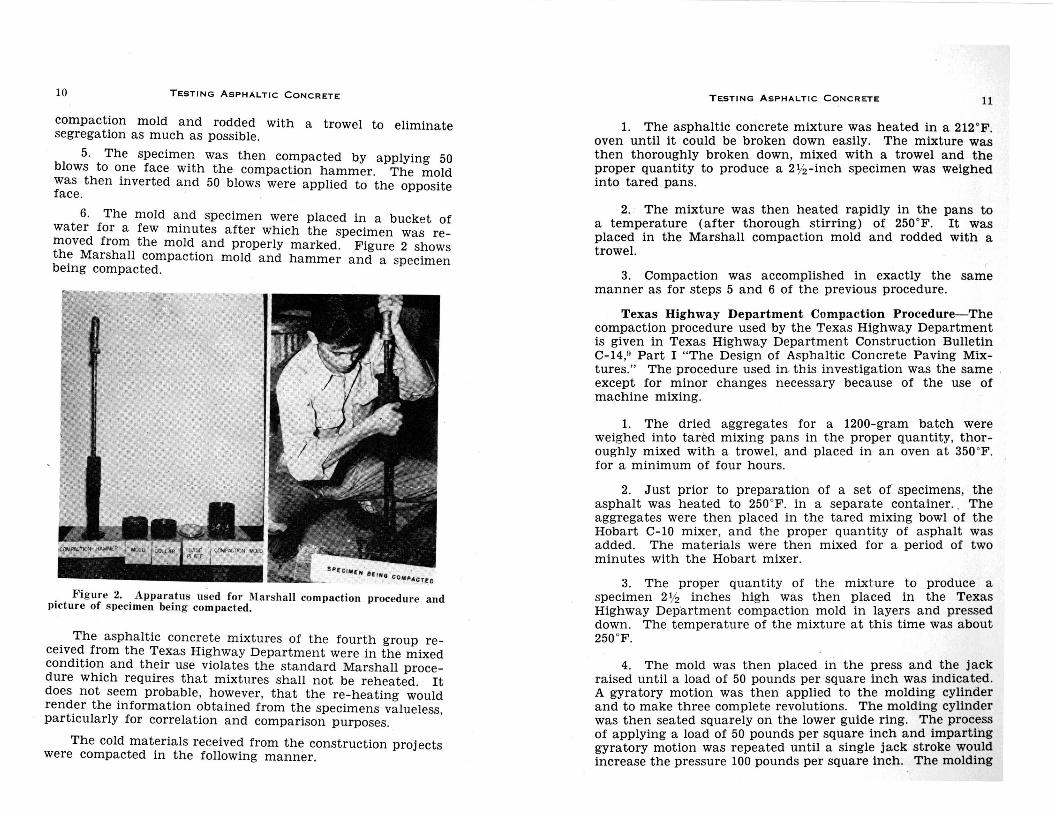
6. The mold and specimen were placed in a bucket of water for a few minutes after which the specimen was removed from the mold and properly marked. Figure 2 shows th~ Marshall compaction mold and hammer and a specimen bemg compacted.
. Figure 2 .. Apparatus u~ed for Mars·hall compaction procedure and picture of specimen being compacted.
. The asphaltic concrete mixtures of the fourth group received from the Texas Highway Department were in the mixed conditioi?- and th:ir use violates the standard Marshall procedure Which reqmres that mixtures shall not be reheated. It does not seem probable, however, that the re-heating would render the information obtained from the specimens valueless particularly for correla tion and comparison purposes. '
The cold materials received from the construction projects were compacted in the following manner.
TESTING ASP HAL TIC CONCRETE 11
1. The asphaltic concrete mixture was heated in a 212 °F. oven until it could be broken down easily. The mixture was then thoroughly broken down, mixed with a trowel and the proper quantity to produce a 2'l2-inch specimen was weighed into tared pans.
2. The mixture was then heated rapidly in the pans to a temperature (after thorough stirring) o! 250°F. It was placed in the Marshall compaction mold and rodded with a trowel.
3. Compaction was accomplished in exactly the same manner as for steps 5 and 6 of the previous procedure.
Texas Highway Department Compaction Procedure-The compaction procedure used by the Texas Highway Department is given in Texas Highway Department Construction Bulletin C-14,9 Part I "The Design of Asphaltic Concrete Paving Mixtures." The procedure used in this investigation was the same except for minor changes necessary because of the use of machine mixing.
1. The dried aggregates for a 1200-gram batch were weighed into tarM mixing pans in the proper quantity, thoroughly mixed with a trowel, and placed in an oven at 350°F. for a minimum of four hours.
2. Just prior to preparation of a set of" specimens, the asphalt was heated to 250°F. in a separate container. . The aggregates were then placed in the tared mixing bowl of the Hobart C-10 mixer, and the proper quantity of asphalt was added. The materials were then mixed for a period of two minutes with the Hobart mixer.
3. The proper quantity of the mixt ure to produce a specimen 2 Y2 inches high was then placed in the Texas Highway Dep'artment compaction mold in layers and pressed down. The temperature of the mixture at this time was about 250°F .
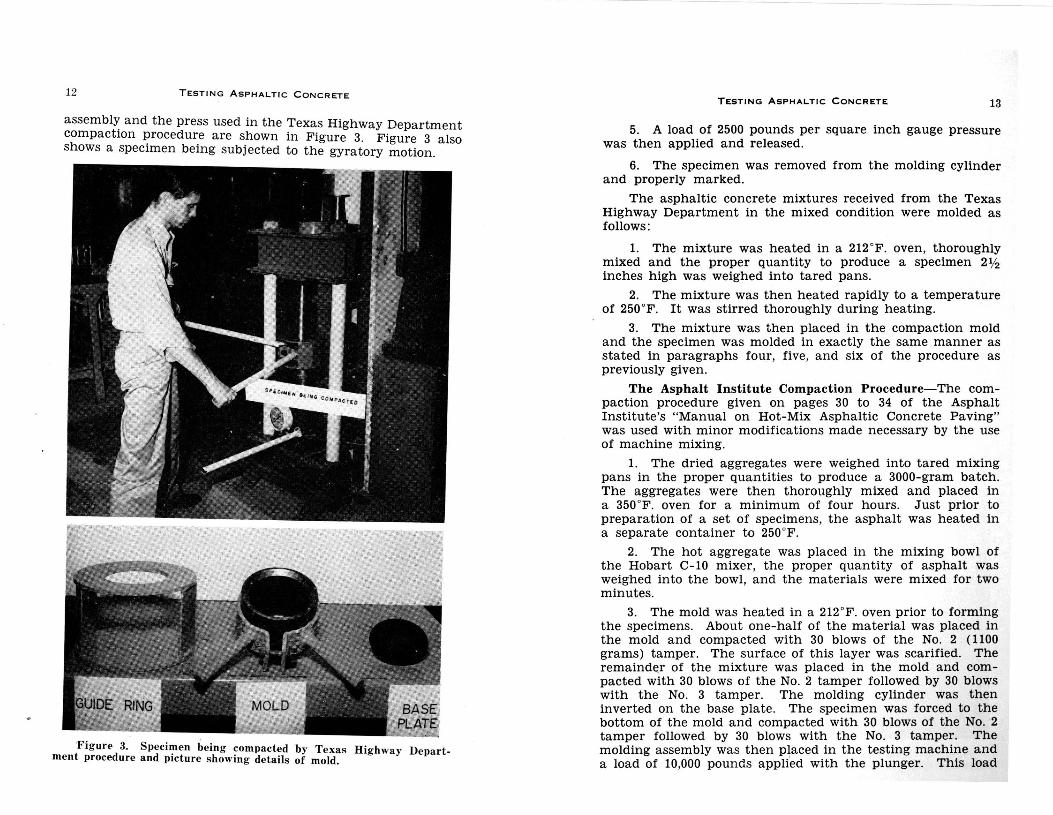
4. The mold was then placed in the press and the jack raised until a load of 50 pounds per square inch was indicated. A gyratory motion was then applied to the molding cylinder and to make three complete revolutions. The molding cylinder was then seated squarely on the lower guide ring. The process of applying a load of 50 pounds per square inch and imparting gyratory motion was repeated until a single jack stroke would increase the pressure 100 pounds per square inch. The molding
12 TESTING ASP HAL TIC CONCRETE
assembl~ and the press used in the Texas Highway Department compactiOn I?rocedu~e are shown in Figure 3. Figure 3 also shows a specimen bemg subjected to the gyratory motion.
Figure 3. Specimen being compacted by Texas Highway Department procedure and picture showing details of mold.
TESTING ASPHALTIC CONCRETE 13
5. A load of 2500 pounds per square inch gauge pressure was then applied and released.
6. The specimen was removed from the molding cylinder and properly marked.
The asphaltic concrete mixtures received from the Texas Highway Department in the mixed condition were molded as follows:
1. The mixture was heated in a 212 °F. oven, thoroughly mixed and the proper quantity to produce a specimen 2'!2 inches high was weighed into tared pans.
2. The mixture was then heated rapidly to a temperature of 250°F. It was stirred thoroughly during heating.
3. The mixture was then placed in the compaction mold and the specimen was molded in exactly the same manner as stated in paragraphs four, five , and six of the procedure as previously given.
The Asphalt Institute Compaction Procedure-The compaction procedure given on pages 30 to 34 of the Asphalt Institute's "Manual on Hot-Mix Asphaltic Concrete Paving" was used with minor modifications made necessary by the use of machine mixing.
1. The dried aggregates were weighed into tared mixing pans in the proper quantities to produce a 3000-gram batch. The aggregates were then thoroughly mixed and placed in a 350°F. oven for a minimum of four hours. Just prior to preparation of a set of specimens, the asphalt was heated in a separate container to 250°F.
2. The hot aggregate was placed in the mixing bowl of the Hobart C-10 mixer, the proper quantity of asphalt was weighed into the bowl, and the materials were mixed for two minutes.
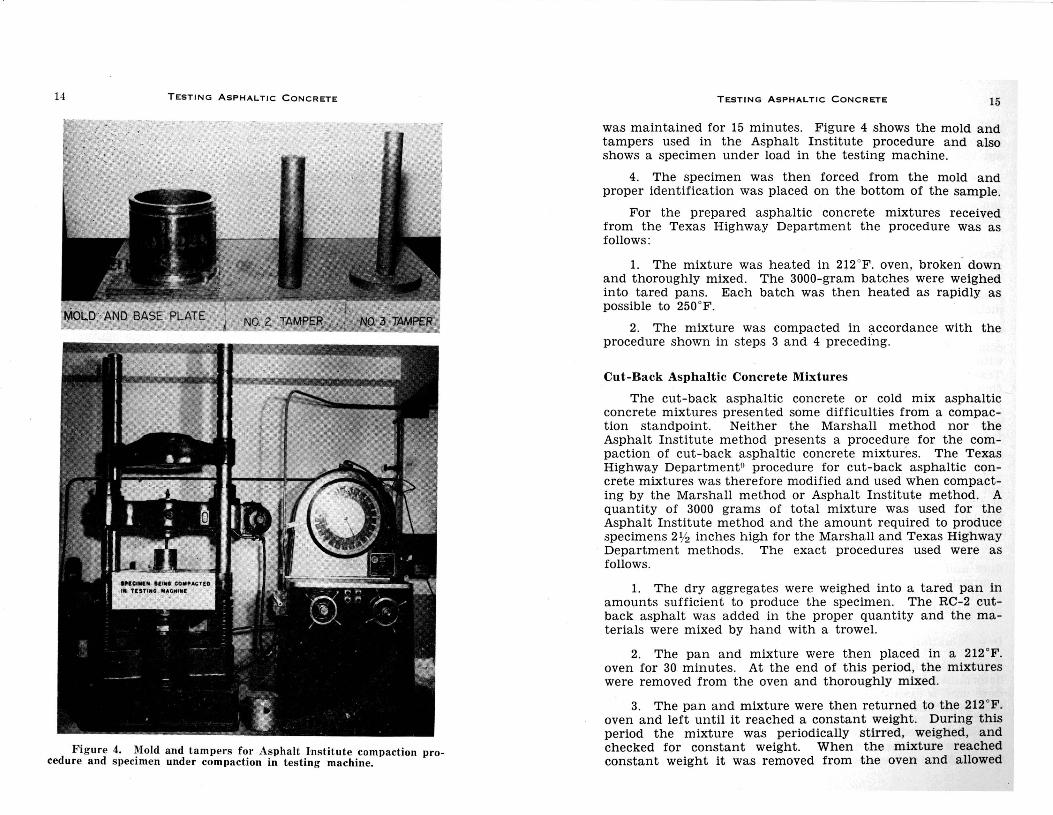
3. The mold was heated in a 212 °F. oven prior to forming the specimens. About one-half of the material was placed in the mold and compacted with 30 blows of the No. 2 (1100 grams) tamper. The surface of this layer was scarified. The remainde,r of the mixture was placed in the mold and compacted with 30 blows of the No. 2 tamper followed by 30 blows with the No. 3 tamper. The molding ~ylinder was then inverted on the base plate. The specimen was forced to the bottom of the mold and compacted with 30 blows of the No. 2 tamper followed by 30 blows with the No. 3 tamper. The molding assembly was then placed in the testing machine and a load of 10,000 pounds applied with the plunger. This load
14 TESTING ASPHAL.TIC CONCRETE
Figure 4. ~fold and tampers for Asphalt I·nstitute compaction procedure and specimen under compaction in tes ting machine.
TESTING ASP HAL. TIC CONCRETE 15
was maintained for 15 minutes. Figure 4 shows the mold and tampers used in the Asphalt Institute procedure and also shows a specimen under load in the testing machine.
4. The specimen was then forced from the mold and proper identification was placed on the bottom of the sample.
For the prepared asphaltic concrete mixtures received from the Texas Highway Department the procedure was as follows:
1. The mixture was heated in 2l2 . F. oven, broken- down and thoroughly mixed. The 3000-gram batches were weighed into tared pans. Each batch was then heated as rapidly as possible to 25o·F .
2. The mixture was compacted in accordance with the procedure shown in steps 3 and 4 preceding.
Cut-Back Asphaltic Concrete Mixtures
The cut-back asphaltic concrete or cold mix asphaltic concrete mixtures presented some difficulties from a compaction standpoint. Neither the Marshall method nor the Asphalt Institute method presents a procedure for the compaction of cut-back asphaltic concrete mixtures. The Texas Highway Departmentn procedure for cut-back asphaltic concrete mixtures was therefore modified and used when compacting by the Marshall method or Asphalt Institute method. A quantity of 3000 grams of total mixture was used for the Asphalt Institute method and the amount required to produce specimens 2 Y2 inches high for the Marshall and Texas Highway Department methods. The exact procedures used were as follows .
1. The dry aggregates were weighed into a tared pan in amounts sufficient to produce the specimen. The RC-2 cutback asphalt was added in the proper quantity and the materials were mixed by hand with a trowel.
2. The pan and mixture were then placed in a 212 ·F. oven for 30 minutes. At the end of this period, the mixtures were removed from the oven and thoroughly mixed.
3. The pan and mixture were then returned to the 212 •F. oven and left until it reached a constant weight. During this period the mixture was periodically stirred, weighed, and checked for constant weight. When the mixture reached constant weight it was removed from the oven and allowed
16 TESTING ASPHALTIC CONCRETE
to cool. During the cooling period the mixture was stirred at intervals in order to maintain a uniform temperature throughout the mixture.
4. Marshall compaction procedure. When the mixture was cooled to 140°F. it was molded using exactly the same procedure as that given in steps 4, 5, and 6 of the Marshall compaction procedure for hot-mix asphaltic concrete.
The procedure used in compacting these specimens by the Marshall method was not considered to be entirely satisfactory in that proper density was not obtained in the specimens. When studying the results of the stability tests on the cutback asphaltic concrete mixtures prepared by the Marshall method, this fact should be kept in mind.
5. Texas Highway Department compaction procedure. The cold mixture was cooled to 100°F. and molded in accordance with the same procedure as given in steps 4, 5, and 6 for the Texas Highway Department procedure for hot-mix asphaltic concrete.
6. Asphalt Institute compaction procedure. The cold mixture was cooled to 140°F. and molded in accordance with the same procedure as given in steps 3 and 4 for the Asphalt Institute procedure for hot-mix asphaltic concrete.
This procedure, while it was the best of several tried, did not produce specimens of the quality desired for determination of the stability by the Asphalt Institute method. Results of stability tests made on the specimens were quite erratic and are not shown in the following pages.
The problem of adapting the Marshall compaction procedure and the Asphalt Institute compaction procedure to the compaction of cut-back asphaltic concrete mixtures was not satisfactorily solved in this investigation. This problem warrants further study.
Determination of Specific Gravity
The specific gravity of all the specimens prepared was determined by using the same general procedure. The procedure used is essentially that recommended by the Texas Highway Department in Construction Bulletin C-14Y
1. A waxed thread was looped around the specimen. The specimen was then weighed in air to the nearest gramweight A.
TESTING ASPHALTIC CONCRETE 17
2. The specimen was dipped several times into paraffin held at a temperature of 2°F. to 4'F. above its melting point. The paraffin coated specimen was then allowed to cool and weighed in air to the nearest gram-weight B.
3. The specimen was then suspended completely in water on the waxed thread and weighed to the nearest gramweight C.
4. The specific gravity was determined from the expression:
Specific Gravity (d) =. ------- ---
(B-C)- [ _ A
(B-A) S;.::::dfic Gravity
of Paraffin ] 5. The theoretical specific gravity was then calculated
as follows:
Theoretical 100 Specific Gravity (D) =
(
Percentage by weight of ) " component of mixture
Specific gravity of component
For example the theoretical density of sheet asphalt mixture series A is calculated as follows (see Table 1 and Table 2):
100 D= ~ 2.275
40 + 40 + 10 + 10 2.624 2.622 2.725- 1.021
6. The percentage of voids is then obtained from the expression:
Per cent voids .~·. ( ·-~=--~) 100 D
THE STABILITY TEST PROCEDURES
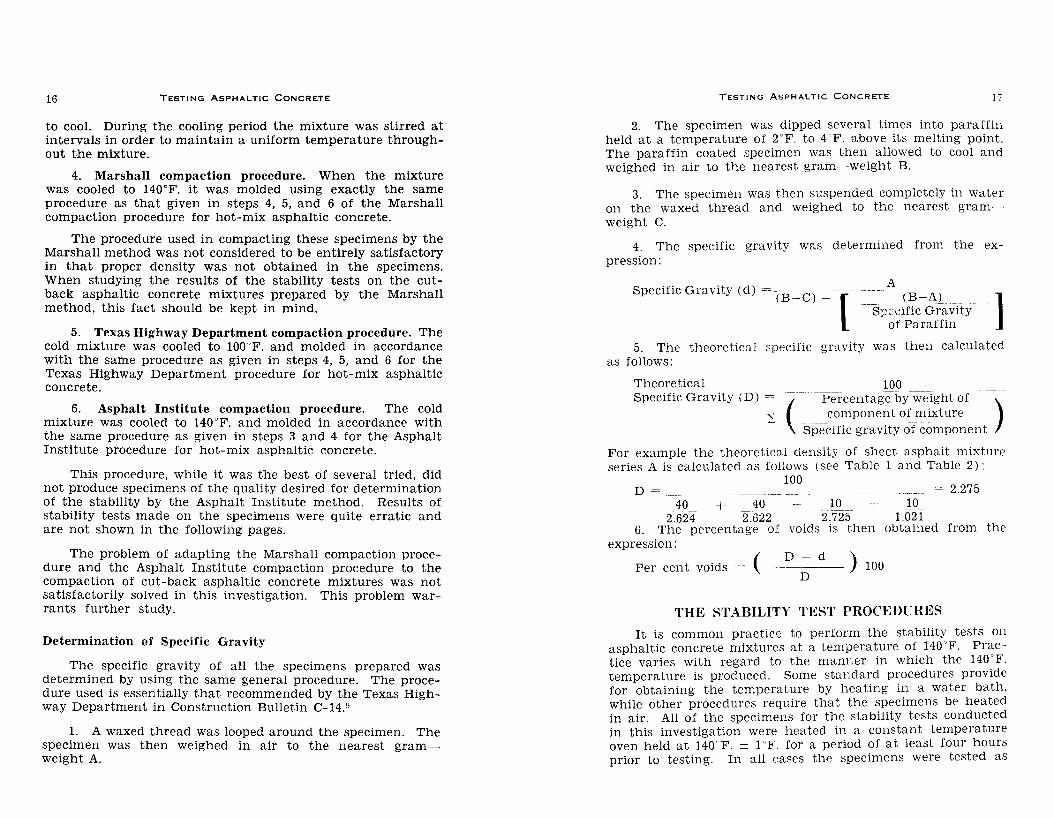
It is common practice to perform the stability tests on asphaltic concrete mixtures at a temperature of 140°F. Practice varies with regard to the manner in which the 140'F. temperature is produced. Some standard procedures provide for obtaining the temperature by heating in a water bath, while other procedures require that the specimens be heated in air. All of the specimens for the stability tests conducted in this investigation were heated in a constant temperature oven held at 140' F. ::±: 1 F. for a period of at least four hours prior to testing. In all cases the specimens were tested as
18 TESTING ASPHALTIC CONCRETE
DEFORMATION
p
LOADING HEAD
ADJUSTABLE SUPPORT
- SPECIMEN UN-O·ER . TEST
Figure 5. The Hveem stability test.
RUBBER DIAPHRAM
WATER
TESTING ASPHALTIC CONCRETE 19
rapidly as possible after removal from the oven in order to avoid loss of heat.
Hveem Stability Test
In the Hveem stability test the specimen is tested in a closed system. An increasing vertical pressure is applied to the 4-inch diameter faces of the specimens and the lateral pressure transmitted through a rubber diaphragm in which the specimen is held is measured. Figure 5 shows the details of the test schematically and a view of the stabilometer in the testing machine during an actual test.
The detailed test procedure used in performing the test was that of the Texas Highway Department, the essential features of which are:
1. The initial displacement of the stabilometer was adjusted to a value betwe:m .070 and .080.
2. The specimen to be tested was removed from the 140°F. oven and a serrated skirt of 2%-inch gummed tape was placed around the specimen. The paper sl{irt was necessary to protect the rubber diaphragm from injury due to sharp aggregates in the specimens. The lower plate of the stabilometer was set to conform to the height of the specimen.
3. A 4-inch paper disc was placed over the lower head. The specimen was placed on the disc and the body of the stabilometer was lowered over the specimen. The initial lateral pressure of five pounds per square inch was then applied with the pump after which the angle valve was closed. A second paper disc was placed over the specimen.
4. The specimen was placed in the testing machine and the loading head was brought into position for loading. The deflection measuring device was adjusted into position for reading the vertical movements of the specimen during testing. The load was applied at a rate of .05 inches per minute movement.
5. Readings of the lateral pressure and of the vertical movement were made at vertical loads of 500, 1000, 1500, 2500 , and 3000 pounds and at each 1000 pounds of vertical load thereafter. The vertical load corresponding to a lateral pressure of 200 pounds per square inch was also determined.
6. The vertical load was reduced to 1000 pounds, the angle valve was opened, and the final displacement measurement was made.
20 TESTING ASPHALTIC CONCRETE
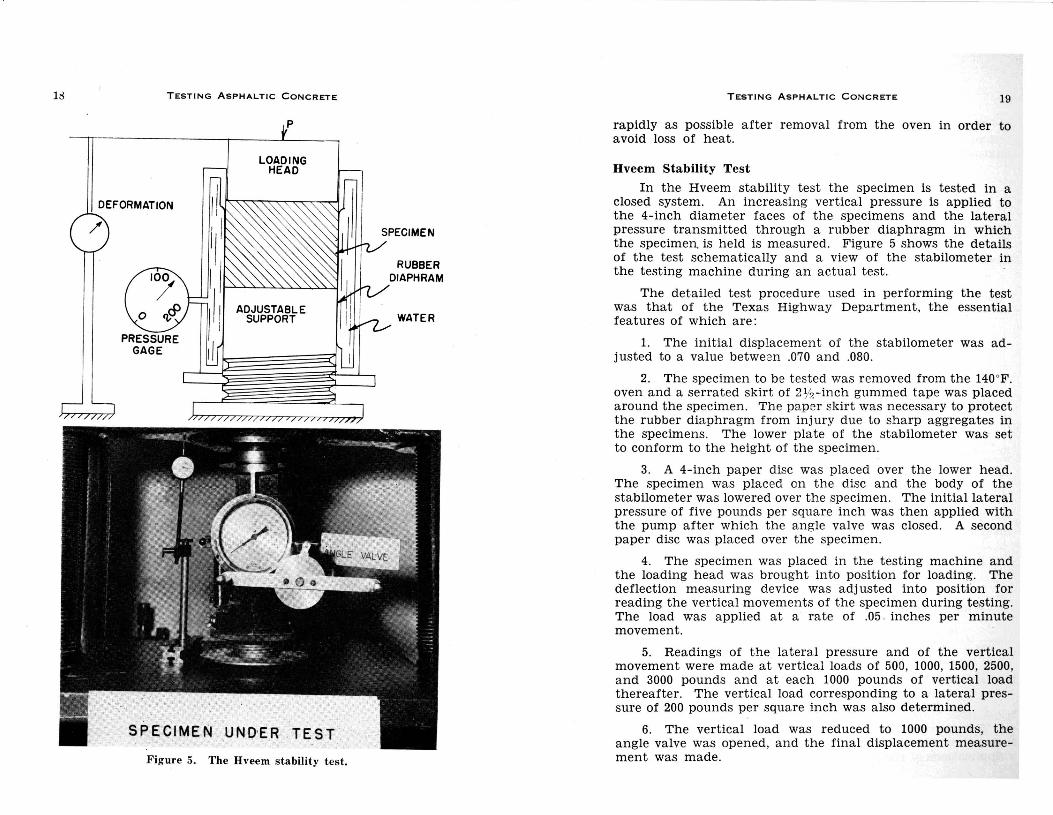
Figure 6 shows a typical set of data obtained from the test of a specimen. Five specimens of each of the individual mixtures were tested.
ASPHALTIC CONCRETE RESEARCH HVEEM ST ABILOMETER TEST
Asphaltic Concrete Date Design No. Spec. No. Ht. Spec.
BD-16 Bv 2.49 inches I.iitial Dis pl. 0.07 4
Final Displ. 0.136 Remarks:
VERTICAL LOAD (LB. I
HVEEM VERTICAL I VERTICAL GAUGE (LB.) i AMES (IN.) LOAD !LB.)
-----
100 0.000 500 6 .OO:l
1,000 8 .007 1,500 10 .009 2,000 12 .011 2,500 15 ,(Jl!i :],000 1~ .015 4,000 25 .020 5,000* :17 .024 6,0(;0 46 .OZH 7,000 59 .082 R,OOO 75 .086 9,000 H2 .040
10,COO 110 .044 Hveem (,/( Stability (For 2-5/16" Ht. Spec.) Hveem lf( Stability (Corrected to 2.5'' Ht.)
11.001; 12,000 18,000 14,000 15,000 16,00fJ 17,001• 18,00!1 19,000 20,000 21,000 22,01.0 28,000 24,000
*Critical Pressure for determining Hveem Stability.
HVEEM GAUGE (LB. I
132 155 1%
I4~~~T~~~\
61.5 64.7
.047
.051
.057
Figure 6. Typical set of data for Hveem stability test.
The stability value for each specimen was computed by means of the emperical formula:
s = RD
400- R
22.2
+ .222
Where S is the relative stability,
R is the stabilometer gauge reading at 400 pounds per square inch applied load (5000 pounds total load), and
D is the number of turns displacement of the specimen (one turn is equivalent to one revolution of the Ames dial or 0.1 inch indicated movement).
Further interpretation of the test results was also made using the method recommended by L. E. McCarty in his paper "Applications of the Mohr Circle and Stress Triangle Diagrams
TESTING ASPHALTIC CONCRETE 21
6oo.------.------.------.-----.------,----------------,
iii n.
~ 4 o o f...-------+-----...f?S£--r--.__;::--+------1 w :r (/)
.J ct
BD-16 C=60
TAN 6= 0.814 6=39.1"
0 200f---7f~--4-----~---+--~+----.----,~ i= a: w >
iii n.
60
a! 40 ct w :r (/)
0
0
200 400 600 800 1000 1200 1400 NORMAL STRESS, POUNDS PER SQUARE INCH
G D-13 c = 10
~ TAN 6•0.66 6=33.4°
v / -.......
" ;:1 20 2 1-a: w > ~ ~ \
200 400 600 800 1000 1200 1400 NORMAL STRESS, POUNDS PER SQUARE INCH
300
(/)
n. 200 -----·
a! <t !
RD-14 C• 0
w :r (/)
.J 100 <t 2 1-a: w >
~ TAN 8= 0.30
I i 6=16.7"
..-----? ~ n 0 100 200 300 400 500 600 700
NORMAL STRESS, POUNDS PER SQUARE INCH
Figure 7. Typical Mohr circles ~~?tained by plotting vertical and lateral pressures from the Hveem stab1hty test.
to Test Data Taken with the Hveem Stabilometer." The Mohr circles were plotted for each vertical unit pressure and the corresponding lateral pressure. A line was then drawn tangent to the circle at 400 pounds per square inch vertical pressure
22 TESTING ASPHALTIC CONCRETE
and to the circle at 200 pounds per square inch lateral pressure. For specimens in which the maximum vertical pressure was below or not much in excess of 400 pounds per square inch (5000 pounds vertical load) the best average line tangent to the stress circles was drawn. The angle of internal friction was taken as the slope of the line, and its intercept on the shear stress axis as the unit cohesive strength. A typical set of these curves with the tangent lines drawn appears in Figure 7.
For each mixture the results of the five tests were averaged. Values which were obviously in error were thrown out. The results obtained from the tests were: Hveem stability value, per cent; angle of internal friction, degrees; and cohesive strength, pounds per square inch.
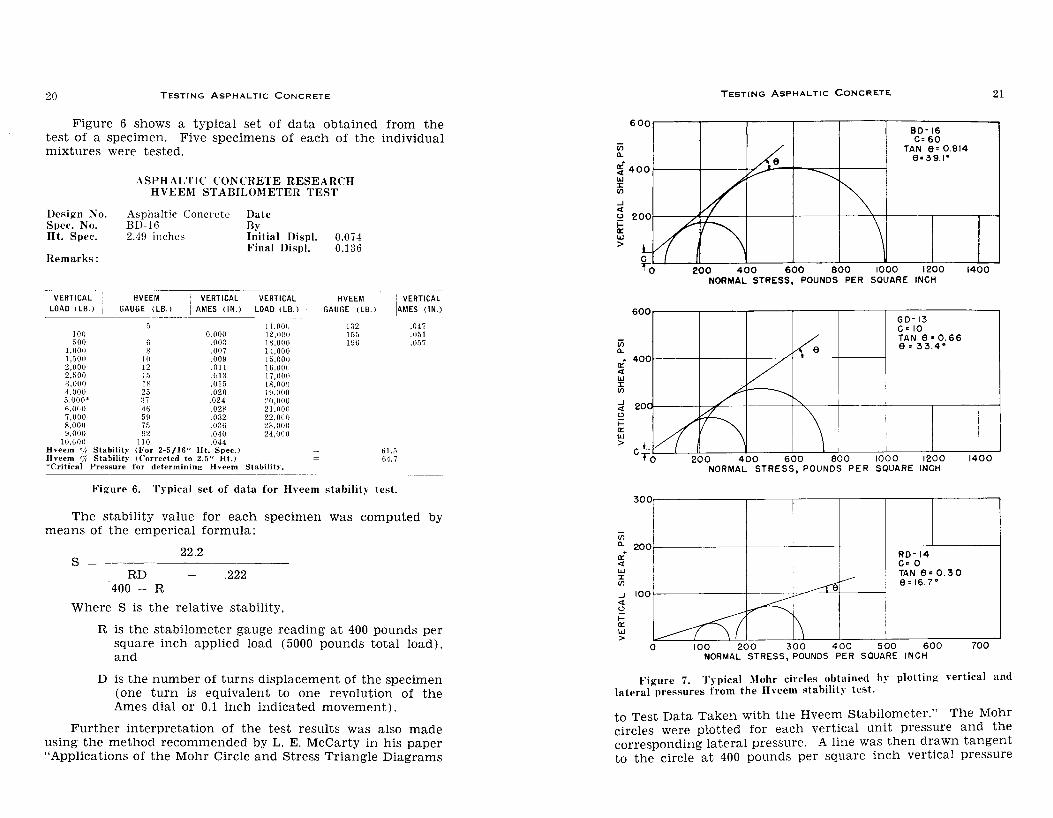
Marshall Stability Test
In the Marshall stability test the 4-inch diameter specimens are loaded along the perimeter of the specimen through two circular loading heads. The load is applied at the rate of 2.0 inches per minute. As the specimen is compressed the vertical movement is measured. The loading method is shown schematically in Figure 8 along with a view of a specimen in the machine ready for testing. The procedure used in performing the test was as follows:
1. The loading heads were heated to 140°F. in the constant temperature oven.
2. The specimen to be tested was taken from the oven and placed in the loading heads. The heads were placed in the stability machine in position for testing. The Ames dial reading flow (vertical movement) was set at zero.
3. The load was applied at the rate of 2.0 inches per minute. The maximum load and the vertical movement at maximum load were read and recorded.
Five specimens were tested for each mixture. The results were averaged, discarding the values for those specimens which were obviously in error. The Results obtained from the test were : (1) stability value (maximum load) in pounds, and (2) flow (vertical deformation at maximum load) in inches.
Texas Highway Department Punching Shear
For a number of years the Texas Highway Department used a punching shear test to measure the stability of asphaltic
TESTING ASPHALTIC CONCRETE 23
p Figure 8. The Marshall stability test.
24 TESTING ASPHALTIC CONCRETE
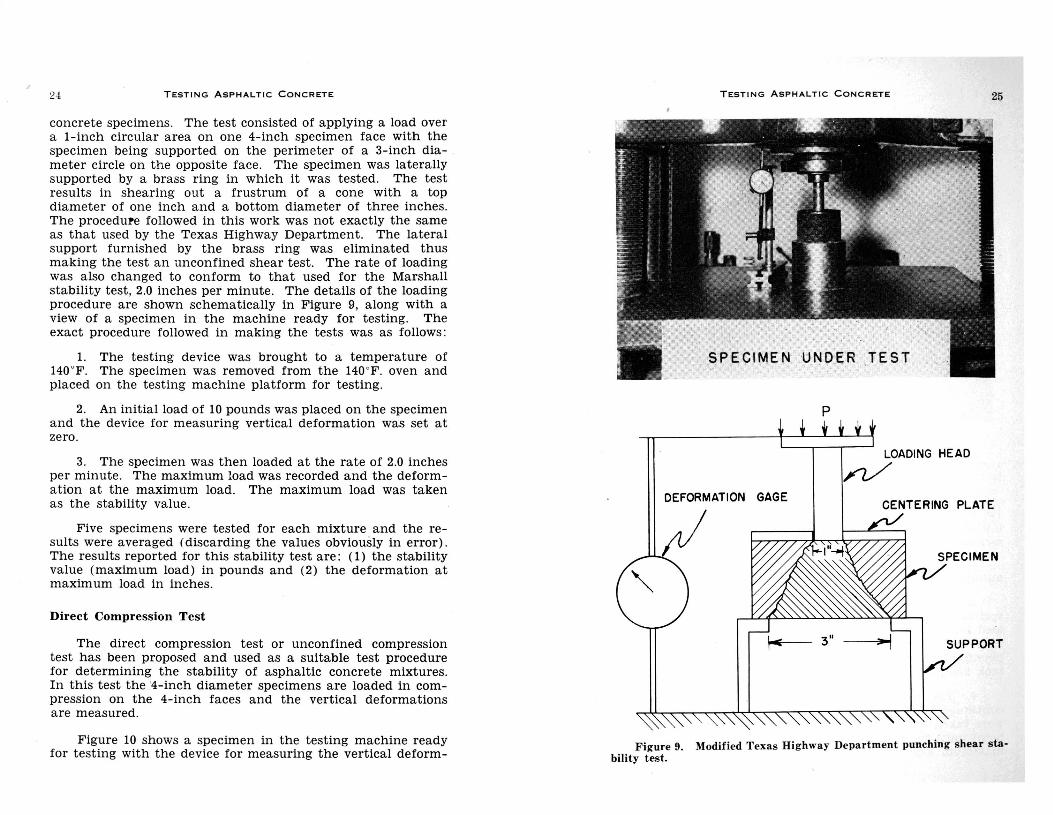
concrete specimens. The test consisted of applying a load over a l-inch circular area on one 4-inch specimen face with the specimen being supported on the perimeter of a 3-inch dia- . meter circle on the opposite face. The specimen was laterally supported by a brass ring in which it was tested. The test results in shearing out a frustrum of a cone with a top diameter of one inch and a bottom diameter of three inches. The proceduPe followed in this work was not exactly the same as that used by the Texas Highway Department. The lateral support furnished by the brass ring was eliminated thus making the test an unconfined shear test. The rate of loading was also changed to conform to that used for the Marshall stability test, 2.0 inches per minute . The details of the loading procedure are shown schematically in Figure 9, along with a view of a specimen in the machine ready for testing. The exact procedure followed in making the tests was as follows:
1. The testing device was brought to a temperature of 140"F. The specimen was removed from the 140°F. oven and placed on the testing machine platform for testing.
2. An initial load of 10 pounds was placed on the specimen and the device for measuring vertical deformation was set at zero.
3. The specimen was then loaded at the rate of 2.0 inches per minute. The maximum load was recorded and the deformation at the maximum load . The maximum load was taken as the stability value.
Five specimens were tested for each mixture and the results were averaged (discarding the values obviously in error). The results reported for this stability test are: (1) the stability value (maximum load) in pounds and (2) the deformation at maximum load in inches.
Direct Compression Test
The direct compression test or unconfined compression test has been proposed and used as a suitable test procedure for determining the stability of asphaltic concrete mixtures. In this test the '4-inch diameter specimens are loaded in compression on the 4-inch faces and the vertical deformations are measured.
Figure 10 shows a specimen in the testing machine ready for testing with the device for measuring the vertical deform-
TESTING ASPHALTIC CONCRETE 25
SPECIMEN UNDER TEST
p
LOADING HEAD
/?/' DEFORMATION GAGE
CENTERING PLATE
SPECIMEN
3" SUPPORT
Figure 9. Modified Texas Highway Department punching shear stability test.
26 TESTING ASP HAL TIC CONCRETE
SPECIMEN . UNDER TEST
Figure 10. Details of direct compression test.
ation in place. The specific steps taken in performing the test were:
1. The specimen, immediately upon removal from the 140°F. oven, was centered in the testing machine and an initial vertical load of 10 pounds applied. The deformation measuring device was set at zero.
2. The load was applied at the rate of .05 inches per minute.
3. The initial deformation reading was taken at 50 pounds vertical load for weak mixtures and at 100 pounds vertical load for the stronger materials. Readings of vertical deformation thereafter were taken at 50 pound, 100 pound, or 200 pound intervals depending upon the rate at which the material took load.
4. The maximum load was determined. Loading was continued beyond the maximum load and the load readings were taken for .020 or .025 inch increments of vertical movement until the vertical load dropped to about one-half of the maxim urn load.
r-- - +-
0 0 IZ)
N
0 0 <t N
0 0 0 t\1
TESTING ASPHALTIC CONCRETE
- r-----
0 0 <D
0 0 N
SONnOd '01:101
0 0 CZ)
0 0 <t
N 0
0
27
28 TESTING ASPHALTIC CONCRETE
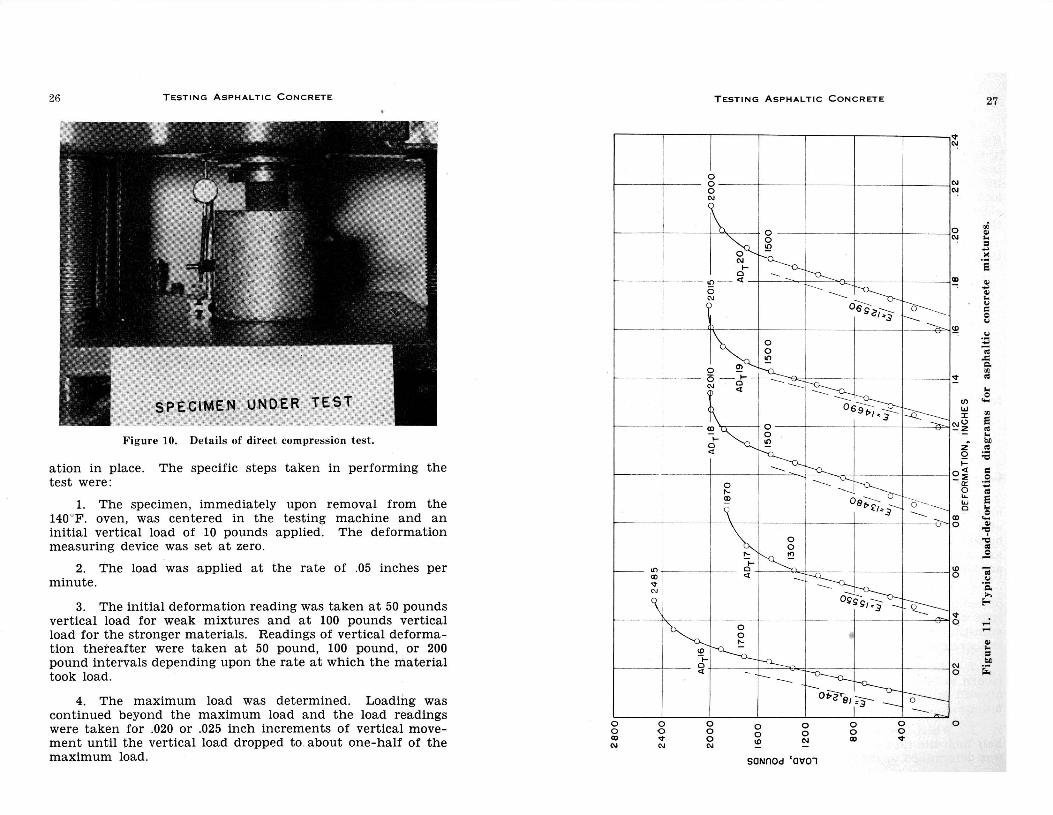
Upon completion of the test, curves were plotted showing the relation between the load and the vertical deformation. A typical set of these curves is shown in Figure 11. From these curves, the proportional limit load was determined as the maximum load for which a linear relationship between load and deformation existed, see Figure 11. The modulus of elasticity was also determined for each specimen by correcting the straight line portion of the curve to make it pass through
Ph the origin and using the fundamental relationship: E = ---
6.A E modulus of elasticity, pounds per square inch. P any load on corrected curve below the propor
tional limit, pounds. A = cross section area of specimen ( 12.56), square
inches. 6. = vertical deformation corresponding to P, inches. h = height of specimen, inches.
Five specimens were tested and the results averaged. The following information resulted from the test :
Proportional limit, pouhds. Ultimate strength, pounds. Modulus of elasticity, pounds per square inch.
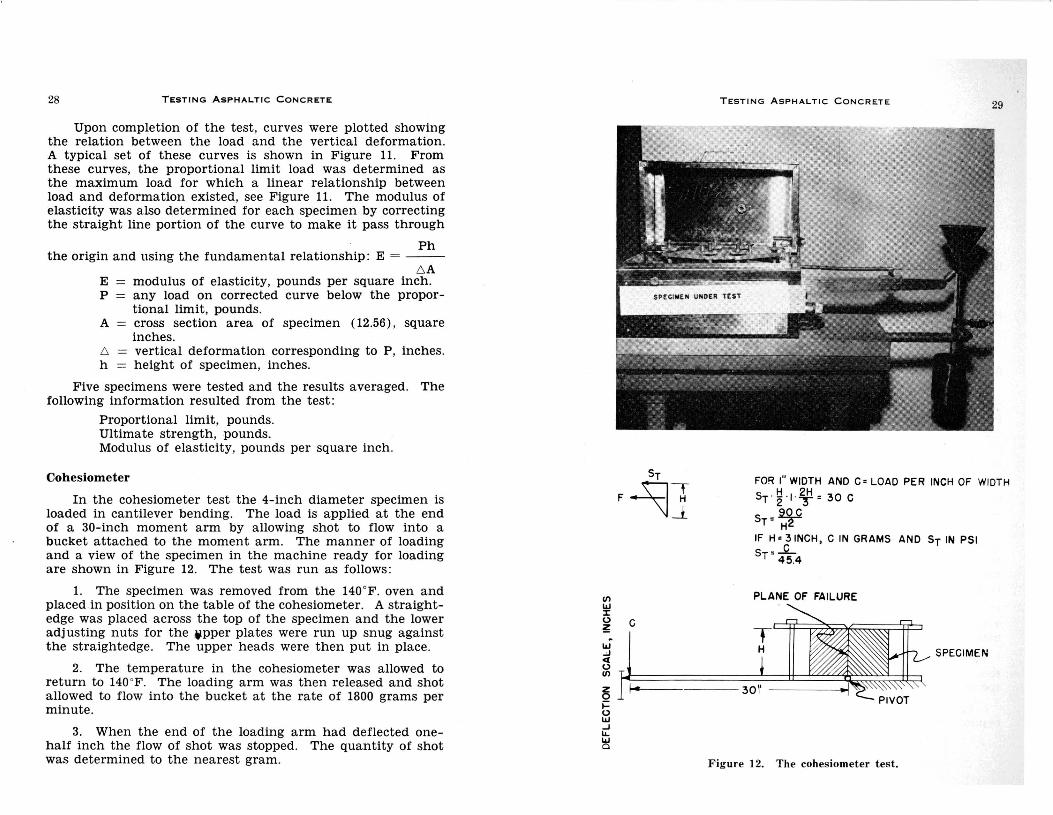
Cohesiometer
In the cohesiometer test the 4-inch diameter specimen is loaded in cantilever bending. The load is applied at the end of a 30-inch moment arm by allowing shot to flow into a bucket attached to the moment arm. The manner of loading and a view of the specimen in the machine ready for loading are shown in Figure 12. The test was run as follows :
1. The specimen was removed from the l40°F . oven and placed in position on the table of the cohesiometer. A straightedge was placed across the top of the specimen and the lower adjusting nuts for the jpper plates were run up snug against the straightedge. The upper heads were then put in place.
2. The temperature in the cohesiometer was allowed to return to l40°F. The loading arm was then released and shot allowed to flow into the bucket at the rate of 1800 grams per minute.
3. When the end of the loading arm had deflected onehalf inch the flow of shot was stopped. The quantity of shot was determined to the nearest gram.
Ill w X 0 c ~
w .J 4 0 Ill
~ i= 0 w -' LL w 0
TESTING ASPHALTIC CONCRETE 29
FOR I" WIDTH AND C= LOAD PER INCH OF WIDTH
ST · ~ · I · ~= 30 C
Sr=~ IF H = 31NCH, C IN GRAMS AND Sr IN PSI
sr = :fs.4
PLANE OF FAILURE
SPECIMEN
Fig ure 12. The cohesiometer test.
30 TESTING ASPHALTIC CONCRETE
4. The load in grams was then converted to the load per inch for a 3-inch height by means of the equation:
C = L
.80H + .178H2
C = load per inch corrected to 3-inch height, grams. L = cohesiometer load at 1j2 inch deflection, grams. H = height of specimen, inches.
5. The modulus of rupture (MR) in pounds per square c
inch, if desired can be obtained by the expression: MR = ---45.4
Five specimens of each mixture were tested in the cohesiometer. The following average results were obtained.
Load per inch corrected to 3-inch height, grams.
Asphalt Institute Stability Test
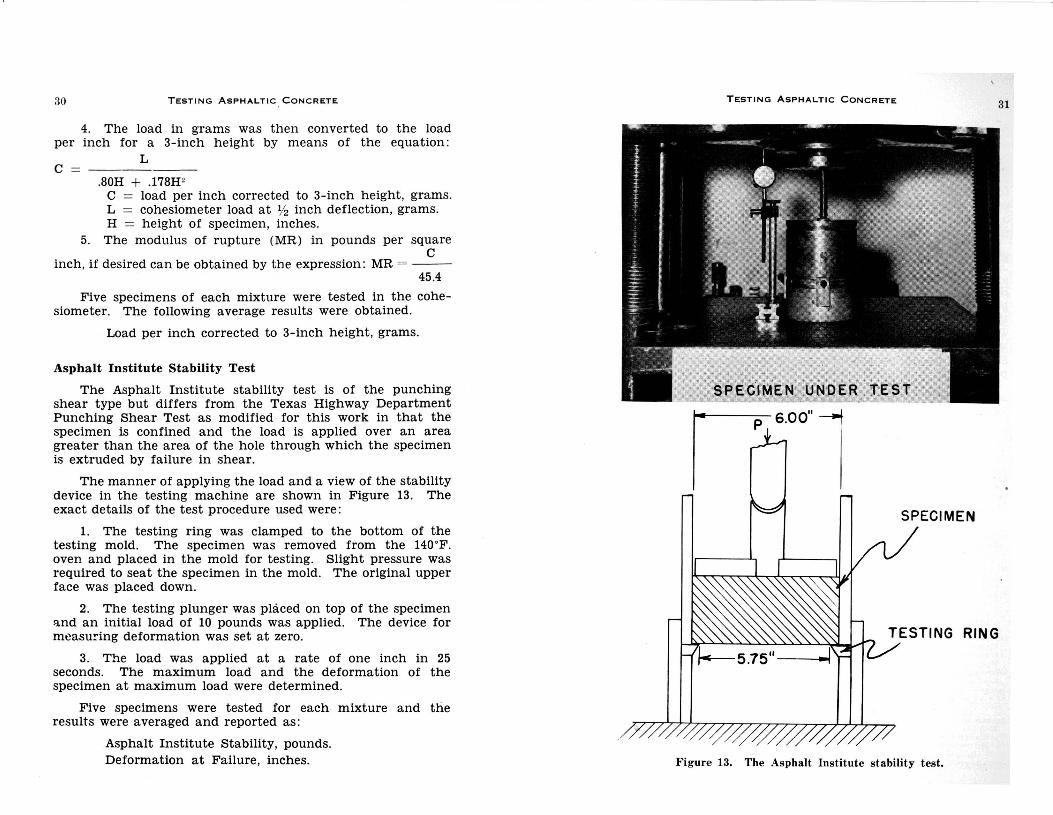
The Asphalt Institute stability test is of the punching shear type but differs from the Texas Highway Department Punching Shear Test as modified for this work in that the specimen is confined and the load is applied over an area greater than the area of the hole through which the specimen is extruded by failure in shear.
The manner of applying the load and a view of the stability device in the testing machine are shown in Figure 13. The exact details of the test procedure used were:
1. The testing ring was clamped to the bottom of the testing mold. The specimen was removed from the 140°F. oven and placed in the mold for testing. Slight pressure was required to seat the specimen in the mold. The original upper face was placed down.
2. The testing plunger was placed on top of the specimen l'l.nd an initial load of 10 pounds was applied. The device for measuring deformation was set at zero.
3. The load was applied at a rate of one inch in 25 seconds. The maximum load and the deformation of the specimen at maximum load were determined.
Five specimens were tested for each mixture and the results were averaged and reported as :
Asphalt Institute Stability, pounds. Deformation at Failure, inches.
TESTING ASPHALTIC CONCRETE 31
176.00"--f
Figure 13. The Asphalt Institute stability test.
TESTING ASPHALTIC CONCRETE
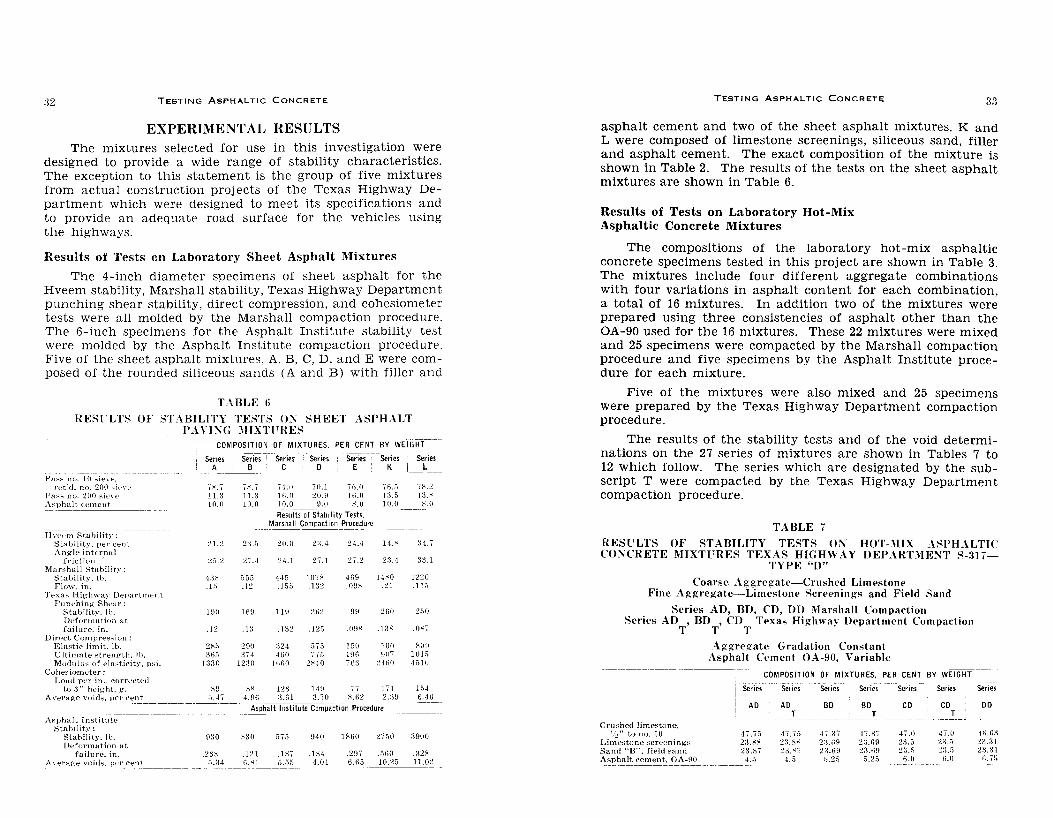
EXPERIMENTAL RESULTS The mixtures selected for use in this investigation were
designed to provide a wide range of stability characteristics. The exception to this statement is the group of five mixtures from actual construction projects of the Texas Highway Department which were designed to meet its specifications and to provide an adequate road surface for the vehicles using the highways.
Results of Tests on Laboratory Sheet Asphalt Mixtures
The 4-inch diameter specimens of sheet asphalt for the Hveem stability, Marshall stability, Texas Highway Department punching shear stability, direct compression, and cohesiometer tests were all molded by the Marshall compaction procedure. The 6-inch specimens for the Asphalt Institute stability test were molded by the Asphalt Institute compaction procedure. Five of the sheet asphalt mixtures, A, B, C, D, and E were composed of the rounded siliceous sands (A and B) with filler and
TABLE 6
RESl'LTS OF STABILITY TESTS 0:\ SHEET ASPHALT I' A VI:\G :\IIXTPRES
COMPOSITION OF MIXTURES. PER CENT BY WEIGHT
S.ries S.ries : S.ries ~ries Series S.ries series A B c D E K I L
--------
Pass no. 10 sie-YP, ret'd. no. 200 o-h"'\·v l."'.'"i 7.".1 74.0 70.1 711.0 16.fl 71'.:2
Pas~ no. ~00 sieve 11.3 11.:) lfi.fl :w.H 16.0 1:-L5 13.:--Asphalt ePment 10.0 10.0 10.0 9.0 .~.0 10.0 1--.0
ResultsotStability Tests. Marsllall Compaction Procedure
----------------
HY<'(·m Stability: Stability. per cent ~1.:2 :2:-LS 20.0 2:1.4- 24.4 14.,>.: :14.7 Angle internal
friction. 20.:2 27.4 2-1.1 27.1 27.2 2:3.4 :J:J.1 Marshall Stability:
Stability, lb. 4:{, ... S5:i 44S 107X 4fi9 l·L'O 1220 Flow, in. ,l;) .1:! .1.55 .132 .091< .21 .115
TPxas Highway Departml·nt Punehing Sht•ar:
Stability, lb. I HO 1fi9 119 ~tii 99 zno ~I){)
[)pformation at failure. in. .12 .]:J .132 .125 .09K .l3X .0~!
DirPct Compression: Elastie limit. lb. 2~;) ifH) :l24 !liS 150 700 KOO Ultimate :-;trength. lb. 860 :374 4GO 775 1 ~)(i HOI 1011) 1\tlodulus of ela:-ticity. p:-;i. I :330 12:JO ltiGO 2~40 /(i8 24()() 451(1
Cohesiometer: Load per in .. corrt>ct~·d
to 8" hei!-(ht, g. ;<9 '" 123 149 'il 111 ]1)4 Average voids, per cent .j_4j 4.!"HJ :l.61 3.70 ~.tl2 2.:-\9 6.40 ---- ----------- -------- ------- -----------
Asphalt lnstitutefo-.l,iJaction Procedure ------ -------
Asphalt Institute Stability:
Stability. lb. 9:l0 -'30 ;)/,~ 940 !St)O 2750 :39(10 [)pformation at
failurt>, in. .~3B .121 .1~7 .1K4 .297 .RGO .:J2~
A veragt> voids, per Ct>nt 5.:J4 C.~l 5.1)5 4.01 6.65 10.25 11.02 --------------- ---------------
-
-
TESTING ASPHALTIC CONCRETE 33
asphalt cement and two of the sheet asphalt mixtures, K and L were composed of limestone screenings, siliceous sand, filler and asphalt cement. The exact composition of the mixture is shown in Table 2. The results of the tests on the sheet asphalt mixtures are shown in Table 6.
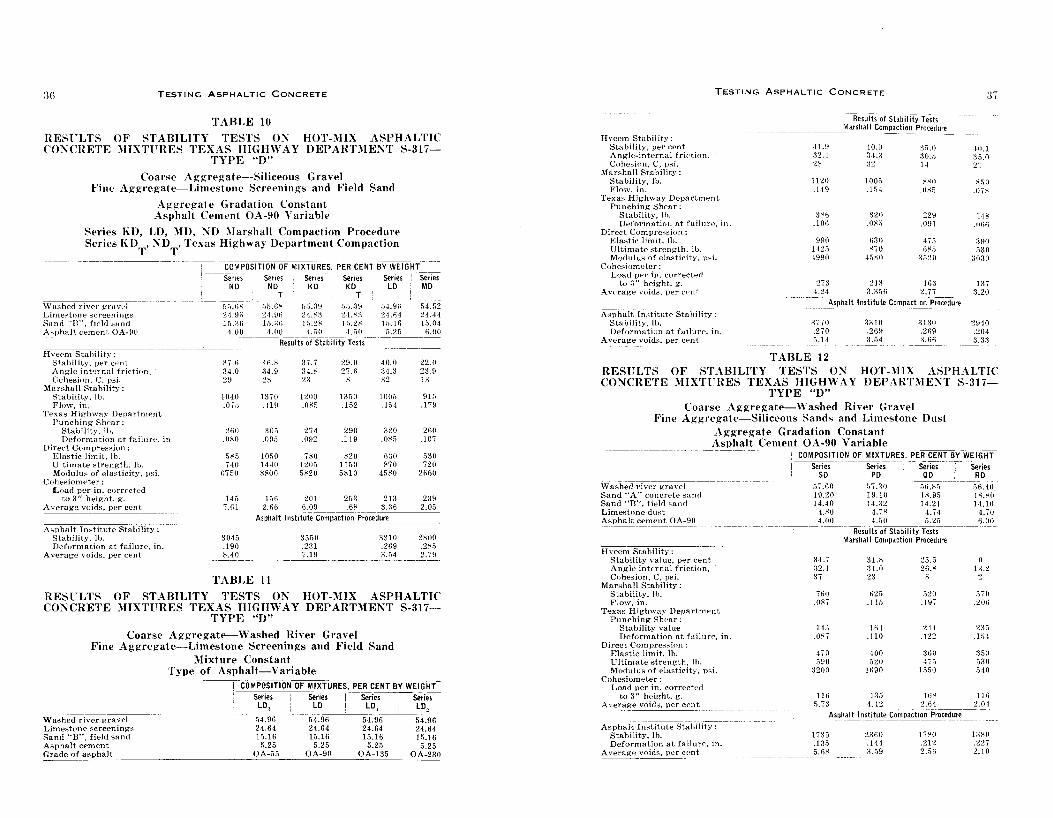
Results of Tests on Laboratory Hot-Mix Asphaltic Concrete Mixtures
The compositions of the laboratory hot-mix asphaltic concrete specimens tested in this project are shown in Table 3. The mixtures include four different aggregate combinations with four variations in asphalt content for each combination, a total of 16 mixtures. In addition two of the mixtures were prepared using three consistencies of asphalt other than the OA-90 used for the 16 mixtures. These 22 mixtures were mixed and 25 specimens were compacted by the Marshall compaction procedure and five specimens by the Asphalt Institute procedure for each mixture.
Five of the mixtures were also mixed and 25 specimens were prepared by the Texas Highway Department compaction procedure.
The results of the stability tests and of the void determinations on the 27 series of mixtures are shown in Tables 7 to 12 which follow. The series which are designated by the subscript T were compacted by the Texas Highway Department compaction procedure.
TABLE 7
RESULTS OF STABILITY TESTS Ol'\ HOT-:\IIX ASPHALTIC CO~CRETE !\IIXTFRES TEXAS HIGHWAY DEPART3IE~T S-31i
TYPE "D" Coarse Aggregate-Crushed Limestone
Fine Aggregate-Limestone Screenings and Field Sand
Series AD, BD, CD, DD :\Iarshall Compaction Series AD , BD , CD Texas Highway Department Compaction
T T T
Crm;hed limestone, ~'·) to no. 10
Li~l·stone screenin-"'s Sand "B". field sand Asphalt cement, OA-90 ------------------- -------
Aggregate Gradation Constant Asphalt Cement OA-90, Variable
COMPOSITION OF MIXTURES. PER CENT BY WEIGHT
Series Serie-s --
Series Series. Series Series
AD AD BD BD CD CD T T T
'l 7 .7S 47.1;) !I .:17 cll.:r; 4~.0 4~.0
z:~.:-1"- 28.~X :2:-U-i9 :2:-Ui9 2:3.5 23.!5 23.M7 i:L"i' :za.•;~ 2:1.t)!) :za.G 2:),i)
4.5 4.5 5.25 G.2f) f)_() ti.O . --
Series
DD
4f).f);~
~:l.!l1 ~:J.:JI
f).7!i,
34 TESTING ASPHALTIC CONCRETE
----------- ----·----Results oTStability Tests ·---------
Hveem Stability: Stability, per cent 55.4 57.0 58.4 24.0 M.6 11.0 35.6 Angle internal friction, 40.4 3H.6 3H.9 24.5 87.9 19.1 35.2 Cohesion, psi. 36 34 44 10 40 0 18
Marshall Stability: Stability, lb. 1550 2020 1750 1H60 1760 IH95 1170 Flow, in. .075 .133 .OH1 .145 .139 .146 .142
Texas Highway D(•partment Punching Shear:
Stability. lb. 208 283 395 354 3il4 342 zs:J Deformation at
failure, in. .06H .07~ .OHO .135 .132 .164 .093 Direct Compression:
Elastic limit, lb. 1240 1500 1670 16~0 1100 1420 650 Ultimatt• strength, lb. 1430 2080 2025 2350 1420 1770 900 Modulus of
elasticity, psi. HH10 14950 10350 10350 7H60 7>'20 4140 Cohesiometer:
Load per in. corrected to 3 11 height, g. 142 215 151 251 163 245 182
Average voids, Pf:>r cent 7.03 3.1:J 6.43 .714 4.57 .15 2.79
Asphalt Institute Compaction Procedure Asphalt Institute
Stability: Stability, lb. 4720 6070 41HO 8920 Deformation at
failure, in. .214 .222 .239 .276 Average voids, p€r ct>nt 10.57 7.55 6.57 2.40
------
TABLE 8
RESULTS OF STABILITY TESTS 0~ HOT-:\1IX ASPHALTIC CO:KCRETE :\IIXTlTRES TEXAS HIGHWAY DEPART:\lE~T S-317-
TYPE "D"
Coarse Aggregate-Crushed Limestone Finl' Aggregate-Limestonl' Screenings and FiPid Sand
:\lixturl' Constant Type of Asphalt Variable
~~~~~~·==~~==~~~==~ i_ COM~OSITION OF MIXTUR~i~_CENT BY WEIGHT_
Crushed limestone, ~~2" to no. 10 Limestone screenings Sand B, field sand Asphalt cement Grade of asphalt cement
Hveem Stability: Stability, per cent Angle intt'rnal friction, c
Cohegion, psi. Marshall Stability:
Stability, lb. Flow, in.
Texas Highway Department Pun<.'hing Shear:
Stability, lb. Deformation at failure-, in.
Direct Compre"Ssion: Elastic limit, lb. Ultimate strength, lb. Modulus of elasticity, psi.
Cohesiometer: Load per in. corrected
to :-3" height, g. A vcrage voitls, per cent
I Series Series Series Series CD" CD co, C02
47.0 47.0 47.0 47.0 23.5 23.5 23.5 23.5 28.5 23.5 23.5 23.5
6.0 6.0 6.0 6.0 OA-55 OA-90 OA-135 OA-230
----------------Results of Stability Tests
Marshall Compaction Procedure
49.5 54.6 55.7 55.0 37.3 :17.9 3H.3 89.3 :JO 40 40 37
2430 1760 1530 645 .107 .139 .ORO .070
591 334 333 71 .105 .132 .088 .056
1400 1100 750 575 1870 1420 1035 690 6600 7860 5310 4990
~07 162 132 60 5.00 4.57 4.47 5. 78
TESTING ASPHALTIC CONCRETE
_____ Asp~-~ lnstitUte_~O~E3ctiOn Procidure
A.sphalt Institute Stability: Stability. lb. 4230 :)120 ~7~10
Deformation of fnilurt', in. .2t;:~ .14'< AvPrage voidt', per cent 7 .5:~ fi.07 ?i.i)7 G.H7
TABLE 9
RESlTLTS OF STABILITY TESTS 0:\ HOT-:\IIX ASPHALTIC CO:\CRETE :\IIXTPRES TEXAS HIGHWAY DEPAin~IE:\T S-31 7-
TYPE "D"
Coarsl' Aggrl'gatP-Crushed Limestonl' Fine Aggrl'gatl'-Siliceous Sand
Aggt·egate Gradation Constant Asphalt C!'lllPnt OA-90 Variable
COMPOSITION OF MIXTURES. PER CENT BY WEIGHT
Crusht:d limestone. 1/:/' to no. 10
Sand •· A", concrete sand
Sand "B", field sand
Limestone Uu:-;t
Asphalt cement, OA-90
Hveem Stability: Stability value, per cent
Angle of internal friction, 0
Cohesion, C, psi.
Marshall Stability: Stability value, lb.
Flow, in.
Texa . .::, Highway Departme-nt Punching Shear:
Stability value. lb.
Deformation at failure, in.
Direct Compression: Elastic limit, lb.
Ultimate strength, lb.
Modulus of elasticity, psi.
Cohesiometer:
A veragt:> load per in. correch"d to 3" height, g.
Average voids, per cent
Asphalt Institute Stability: Average stability, lb.
Average deformation at failure, in.
Average voids, per cent
Series Series Se-rieS Serie$ FD GO HD 10
57.:10 .){)_,...;;; 5f).-t fl5.!1fi
19.10 l'"-Jl5 1!"1." l~.fj;)
14.~:J 11.21 11.1 l:l.99
4.77 4. 7l 4.7 4. il~l
4.50 5.25 ~.0 f). 75
Results of Stability Tests. Marshall Compaction Procedure
40.0 :17.0 24.0
:J6.f; :~ 7.0 :Ju< ~-1
3,, 10 (I
1170 12!)0 ll'-':11 91i0
.07 4 .1:!1 .1-t:-1 .2'-l:{
194 21-t 21:1 229
.o;1 .o..:...: .10" .200
~,>.:() 1:2.')0 0:20 570
10."'5 1•170 7:)0 7"'i0
7970 1t12:~j) :]:] jf) 1K10
llll lli() 19' 1 ~I)
7.51 :l.il' 2.:w l.f)7()
Asphalt ln$titute Compaction Procedure
~K!lO :J:;:ll) ll:lO 27:-<0
.201 .17:-) .:!79 .:~:!0
7 ,:)!) -t::s 1.1)9 0.:--;!1
:36 TESTING ASP HAL TIC CONCRETE
TABLE 10
RESULTS OF STABILITY TESTS 0"\' HOT-:\IIX ASPHALTIC COX CRETE :\IIXTPRES TEXAS HIGHWAY DEPART:\lE~T S-317-
TYPE "D"
Coarse Aggregate-Siliceous Gravel Fine Aggregate-Limestone Screenings and Field Sand
Aggregate Gradation Constant Asphalt Cement OA-90 Variable
Series KD, LD, l\ID, XD :\larshall Compaction Procedure Series KD , NO , Texas Highway Department Compaction
T T
Washed river gravd Lime.; tone .screening~ Sand "B'', fidd .sand Asphalt cement. OA-HP
Hveem Stability: Stability, per cent Angle int{'rnal friction. Cchesion, C. psi.
Mar"hall Stability: Stability, lb. Flow, in.
Texas Highway Department Punching Shear:
Stability, lb. Deformation at failure. in.
Direct Compre:-;sion: Elastic limit, lb. Ultimate .strength. lb. Modulus of elasticity, psi.
Cohesiometer: :)0 530 740 1440 1205 IJ50 1<70 720
,;750 ~800 51':20 5~10 4580 2660
145 15G 201 253 213 239 7.61 2.66 6.09 .6~ 3.:J6 2.05
Asphalt ln~stitute Compaction Procedure
3045 :3550 8310 2h00 .190 .2:31 .269 .2h5 8.40 7.19 3.54 2.79
------~--~-------
TABLE 11
RESULTS OF STABILITY TESTS OK HOT-:\IIX ASPHALTIC CONCRETE :\liXTPRES TEXAS HIGHWAY DEPARTMEI\T S-317-
TYPE "D"
Coarse Aggregate-Washed River Gravel Fine Aggregate-Limestone Screenings and Field Sand
:\fixture Constant
Washed river gravel Limestone screenings Sand "B", field sand Asphalt cement Grade nf asphalt
Type of Asphalt-Variable ----~~COMPOSITION OF MIXTUilES,PEi!CENT BY WEIGHT
Series Series 1 Series~~~-siri.,-
LD,. LD I LD, LD,
ii4.96 54.96 54.96 ___ 54.96 24.64 24.64 24.64 24.64 15.16 15.16 15.16 15.16
5.25 5.25 5.25 5.25 OA-55 OA-90 OA-135 OA-230
TESTING ASPHALTIC CONCRETE
Hveem Stability: Stability, per CPnt Angle-internal friction. Cohesion, C, psi.
Marshall Stability: Stability, lb. Flow, in.
Texas Highway DepartmPnt Punching Shear:
Stability, lb. DPformat:on at failure, in.
Direct Compre:-<sion: Elastic limit, lb. Ultimate strength, lb. Modulus. of elasticity, p:-.i.
Cohesiom<'ter: Load per in. eorrectf-'d
to a, height, g. Av{•rage voids, per cen+
Asphalt [n.stitute Stability: Stability, lb. Deformation at failure, in .
Average voids, per cent
Results of Stability Tests _______ Marshall Compaction Procedure
11.9 .o.o :)i'>.O 32.1 3·l.:l :JO.o 28 :)2 1"
Jl20 100ii 1<~0 .119 .1!5 j .O~fi
:lBG :J20 229 .IOfi .0~:) .091
990 630 ~7!)
J '25 >'70 hMS 1990 45,lll :Jo20
27:l 21:! 16:! 4.24 8.:)f)fi 2.77
Asphalt Institute Compaction Procedure
:l770 .270 il.l4
TABLE 12
3:lJO .269 :1.54
:l 1:l0 .269 :~.fl(i
37
-10.1 35.0 27
.'<50 .07.'<
14x .066
:J90 530
ao:Jo
13~
3.20
2H40 .204 :u:J
RESULTS OF STABILITY TESTS OX HOT-:\IIX ASPHALTIC CO~ CRETE l\IIXTtTRES TEXAS HIGHWAY DEPART:\IEXT S-317-
TYPE "D" Coarse Aggregate-\Vashed River Gravel
Fine Aggregate-Siliceous Sands and Limestone Dust Aggregate Gradation Constant Asphalt Cement OA-90 Variable
-------eDMl'OSITIO~ffofMTXTLJRES, PER CENT BY WEIGHT
Washed river gravel Sand "A" concrete sand Sand "B", field sand Limestone du~t Asphalt cement OA-90
H veem Stability: Stability value, pt>r cent Angle internal friction, Cohesion, C. psi.
Marshall Stability: Stability, lb. Flow, in.
Texas Highway Department Punching Shear:
Stability value Deformation at failure-, in.
Direct Compression: Elastic limit, lb. Ultimate strength, lb. Mo-dulus of elasticity, psi.
Cohesiomete-r: ,Load per in. correctt>d
to 3" height, g. Average voids, per cent
Asphalt Institute Stability: Stability, lb. Deformation at failure, in.
Average voids, per CPnt ---~--~-
~ ~~
Series Series Series Series SD PD QD RD
57.60 fi7 .30 .5fl . .'<.i) on.40 19.20 19.10 1K.95 1 K.X(I 14.40 14.32 14.21 14.10
4)'0 4.7:-< 4.74 4.70 4.00 ·l.f>O il.25 6.00
-~--~-
Resultsof Stability Tests--Marshall Compaction Procedure
---------- -
34.7 :l!.X 25.5 0 :)2.1 :n.o :26.~ l:l.2 37 2:3 fi
760 fi2i) 520 !)70 .0~7 .115 .197 .206
u:; 16" 244 2:1:) .OK7 .110 .12:! .1:),1
470 •no :~GO :)511 590 520 ~7!) G80
:)200 1ii90 1 i)f:i() 540
1 l!i 1:35 ]I)~ ] lt)
f:i. i3 4.H 2.6·1 2.04 Asphalt Institute Compaction Pro-cedure
----------
17:l5 2860 17KO I:JHO .135 .144 .212 .227 5.6~ :l.59 2.:)() 2.10
38 TESTING ASPHALTIC CONCRETE
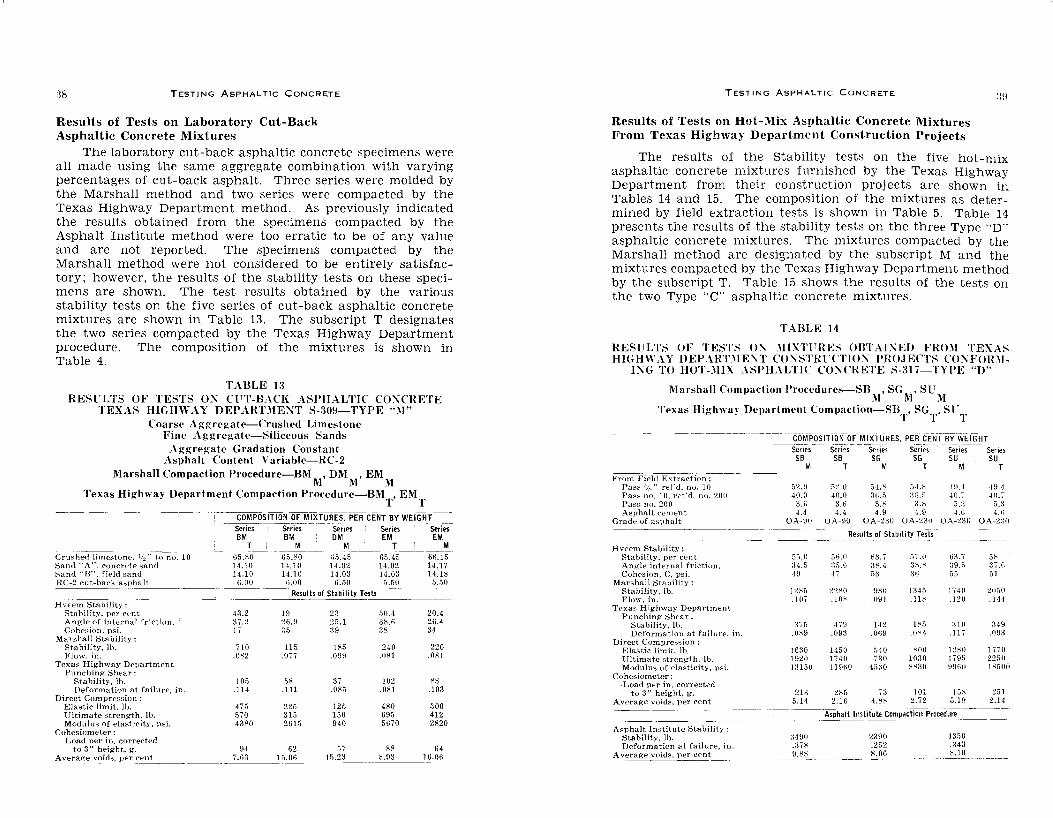
Results of Tests on Laboratory Cut-Back Asphaltic Concrete Mixtures
The laboratory cut-back asphaltic concrete specimens were all made using the same aggregate combination with varying percentages of cut-back asphalt. Three series were molded by the Marshall method and two series were compacted by the Texas Highway Department method. As previously indicated the results obtained from the specimens compacted by the Asphalt Institute method were too erratic to be of any value and are not reported. The specimens compacted by the Marshall method were not considered to be entirely satisfactory; however, the results of the stability tests on these specimens are shown. The test results obtained by the various stability tests on the five series of cut-back asphaltic concrete mixtures are shown in Table 13. The subscript T designates the two series compacted by the Texas Highway Department procedure. The composition of the mixtures is shown in Table 4.
TABLE 13 RESrLTS OF TESTS 0:\' CPT-BACI\. ASPHALTIC CO'\CRETE
TEXAS HIGHWAY DEPART:\IE'\T S-309-TYPE ":\1" Coarse Aggregate-Crushed Limestone
Fine Aggregate-Siliceous Sands Aggregate Gradation Constant
Asphalt Content Y ariable-RC-2 Marshall Compaction Procedure-EM , DM , EM
M M M Texas Highway Department Compaction Procedure-EM., EM . T T
------- --------COMPosTfToN. OFMJXTURES. PER CEN'TBY WEIGHT Series Series ----Sen:e:s-- Series -, - SerieS-BM BM DM EM EM
T M M T M Cr-usht>-d limestone. 1{;" to no:- 10- - --- ~------ ---------- -------~-~
65.80 65.KO f)5.45 65.45 66.15 Sand ''A'', concrete sand 14.10 14.10 14.02 14.02 14.17 Sand "B", field sand 14.10 14.10 14.03 14.03 14.JH RC-2 cut-back asphalt 1;.oo ILOO 6.50 5.50 5.50
Results of Stability Tests --
HvEem Stability: Stability. per Ct:'nt 43.2 19 2:J 50.4 20.4 Angle of inte:!"'nal frictirm, 37.2 26.9 25.1 3H.6 26.4 Cohesion, psi. l'i :15 39 38 34
Marshall Stability: Stability, lb. 'ill) 115 1~5 240 220 Flow. in. .082 .077 .099 .OK! .OK1
Texas Highway Department Punching Shear:
Stability, lb. 105 5K 37 102 88 Deformation at failure, in. .114 .111 .0~5 .081 .103
Direct Compression : Elastic limit, lb. 475 225 125 480 300 Ultimate strength. lb. 570 31G 150 695 412 Modulus of elasticity, psi. 4380 2615 940 5670 2K20
Cohesiomt>ter: Load per in. corrected
to 3" ht>ight, g. 94 62 57 88 64 Average voids, per cent ______ 7.63 15.06 15.23 8.9:3 16.06
TESTING ASPHALTIC CONCRETE
Results of Tests on Hot-Mix Asphaltic. Com~rete Mixtures From Texas Highway Department Construction Projects
The results of the Stability tests on the five hot-mix asphaltic concrete mixtures furnished by the Texas Highway Department from their construction projects are shown in Tables 14 and 15. The composition of the mixtures as determined by field extraction tests is shown in Table 5. Table 14 presents the results of the stability tests on the three Type "D'' asphaltic concrete mixtures. The mixtures compacted by the Marshall method are designated by the subscript M and the mixtures compacted by the Texas Highway Department method by the subscript T. Table 15 shows the results of the tests on the two Type "c·· asphaltic concrete mixtures.
TABLE 14
RESVLTS OF TESTS 0'\ :\IIX1TRES OHTAI'\ED FR0:\1 TEXAS HIGHWAY DEPAR'L\IE'\T CO'\STRlTTIO'\ PROJECTS CO'\FOR:\1-
1'\G TO HOT-:\IIX ASPHALTIC CO'\CRETE S-317-TYI'E "D"
Marshall Compaction Procedures-SB , SG .. SF l\1 M :VI
Texas HighwaY Department Compaction-SH , SG . S l" . . T T T
From Field Extraction : Pas~ :>/...," ret'd. no. 10 Pass no. 10, ret' d. no. 200 Pas:;;. no. 200 Asphalt cement
Grade of asphalt
Hveem Stability: Stability, per cent Angle internal friction. Cohesion, C, p~i.
Marshall Stability: Stability, lb. Flow. in.
Texas Highway Department Punching Shear:
Stability, lb. Deformation at failure. in.
Direct Compression: Elastic limit, lb. Ultimate strength, lb. Modulus of elasticity, psi.
Cohesiometer: •Load per in. corrected
to 3'' height, g. Average voids, per cent
Asphalt Institute Stability : Stability, lb. Deformation at failure, in.
Average voids, per cent
cor~POSITION OF MIXTURES, PER CENT BY WEfG-HT Senes SB
M
G2.0 40.0
3.t) 4..1
OA-~!0
5S.O :l4.5 4~1
12.'5 .] 07
16:10 1920 1:1150
:1490 .87K 9.8~
serT~s SB
T
;)2.0 40.0 3.6 4.4
UA-90
Series SG
M
54.:--: :~fi.5
3.!' 4.9
OA-2:30
54.~
:Fi.G :l.X 4.9
OA-2ao
Results of Stability Tests
5fi.ll :~fi.6
47
22~0
.10~
479 .093
1450 1740 Il9GO
1-i3.'"i 3X.4 53
930 "091
142 .069
540 7:30
45:10
23!!0 .252 ~.06
fi7 .0
;:)I)
1:--:5 .m<4
set-ie-s--5erie~-
su su M T
4~).4 4!1.4 40:7 40.7 5.:~ G.a 4.6 4.6
OA-2:JO OA-2:111
1/40 .120
:no .117
12XO 179fi 991iiJ
4350 .843 X.JO
5o 37.fo 51
1770 2250 lt-:fiOO
40 TESTING ASPHALTIC CONCRETE
TARLE 15
RESlTLTS OF TESTS 0~ :\IIXTURES OBTAI;'/ED FRO~I,THE 1E)~~"l HIGHWAY DEPART:\lE~T CO~STRUCT~O~TPER\)J3~~T~i?i .,~,. -
I~G TO HOT-MIX ASPHALTIC CO~CRE • S- /-
Marshall Compaction Procedures-SCM, SP M
Texas Highway Department Compaction-SeT SP T
----------- ---------- i COMPOSITION OFMlXTURE~~~ci!!_:r_i3'[~EI_G~ :·------Series ___ --- SerieS--~ : Series Ser1es
SP SP SC SC M T M T
From Field Extraction: ~ 59 55.9 59)) Pas8 1" scre(.'n, ret'd. no. 10 ~·5 ·
5 35.5 29.3
Pass no. 10, ret'd. no. 200 : 4_~ 6 ·Lfi fi.l Pass no. 200
4_0
4.0 6.1 Asphalt cement OA-go OA-90 OA-131>
59.5 29.3
5.1 1'-1
OA-13G Grade asphalt cement _ ----~-- _______ _
-~-------------------= 1 =-=--~--Re_S<Jits_o_f_S_!aiJjlj\y_:rests ______ _ H veem Stability:
Stability, per cent Angle of internal friction, " Cohesion, C, psi.
Marshall Stability: Stability, lb. Flow, in.
Texas High,vay Department Punching Shear:
Stability, lb. . Deformation at failure. m.
Direct Compresf'ion: Elastic limit, lb. Ultimate strength, lh. Modulu~ of elasticity, psi.
Co hesiometer:
54.1'1 35.5 49
1240 .099
870
1:J70 1590
14.noo
57.2 3R.O :39
1460 .0~2
900 1120 Ro7o
52.F 34.0 5/i
2200 .15R
410 .096
1400 19:30 ROOO
Load per in. corrected 119
lGO ~t)9 to 3" height, g.
4 R
3 2.97 2.72
49.S :n.4 65
2115 .!6R
574 .099
2010 2660
15,250
332 1.08 Average voids, per cent -·-·---------~--. ____ _
--------·-·--- ~-- AS(Jh_al_t_l~titu~e ~11\pact10n Proce_<lu_i! -----·
Asphalt Institute Stability: Stability, lb. Deformation at failure. in.
Average voids, per cent
2060 .22~
7.56
3700 .430 6.32
CORRELATIONS BETWEEN THE STABILITY TESTS
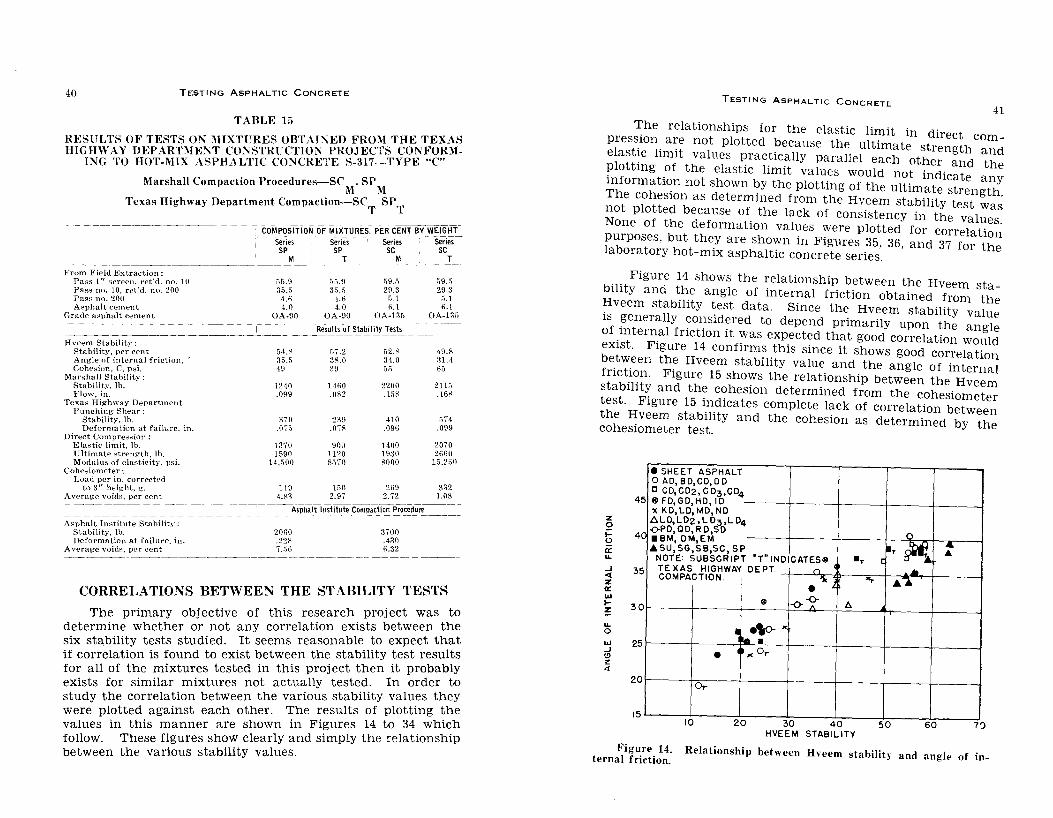
The primary objective of this research project was to determine whether or not any correlation exists between the six stability tests studied. It seems reasonable to expect that if correlation is found to exist betwe~n th~ stability ~est results for all of the mixtures tested in th1s proJect then 1t probably exists for similar mixtures not actually teste_d_. In order to study the correlation between the various stab1llty valu~s they were plotted against each other. The results of plottmg ~he values in this manner are shown in Figures 14 to 34_ wh1~h follow. These figures show clearly and simply the relatwnsh1p between the various stability values.
TESTING ASP HAL TIC CONCRETE 41
The relationships for the elastic limit in direct compression are not plotted because the ultimate strength and elastic limit values practically parallel each other and the plotting of the elastic limit values would not indicate any information not shown by the plotting of the ultimate strength. The cohesion as determined from the Hveem stability test was not plotted because of the lack of consistency in the values. None of the deformation values were plotted for correlation purposes, but they are shown in Figures 35, 36, and 37 for the laboratory hot-mix asphaltic concrete series.
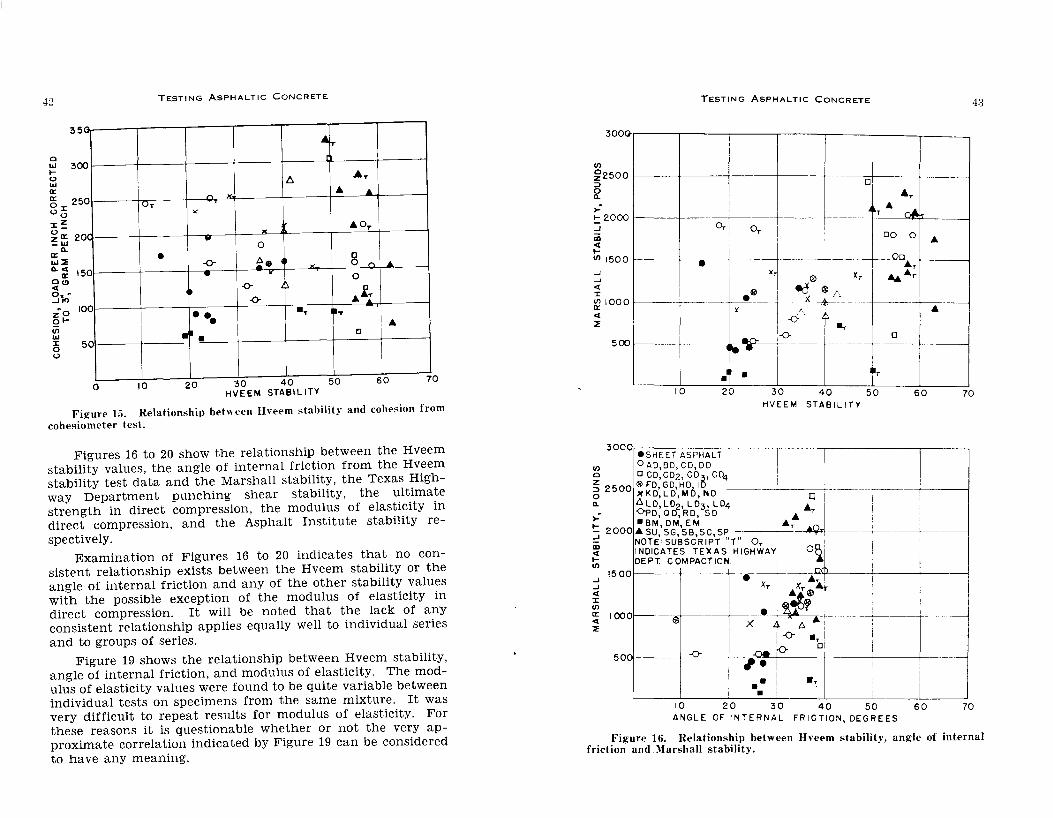
Figure 14 shows the relationship between the Hveem stability and the angle of internal friction obtained from the Hveem stability test data. Since the Hveem stability value is generally considered to depend primarily upon the angle of internal friction it was expected that good correlation would exist. Figure 14 confirms this since it shows good correlation between the Hveem stability value and the angle of internal friction. Figure 15 shows the relationship between the Hveem stability and the cohesion determined from the cohesiometer test. Figure 15 indicates complete lack of correlation between the Hveem stability and the cohesion as determined by the cohesiometer test.
e SHEET ASPHALT OAD,BD,CD,DD
4 D CD, CD2, C D3,CD4
58 FD,GD,HD, 10 'lC KD, LD, MD, NO ALD,LD2,L D?t,L 04
·C -oPD, QD, R D, D •BM, DM,EM
z 0 .... 4 0 a: ~
.J <(
z a: w .... z ~
0
3
3
5
0
w 2 .J
5 I!> z 4
2 0
5
.ASU,SG,SB,SC, SP NOTE: SUBSCRIPT "T"INDICATES~ TEXAS HIGHWAY DE PT. __Q COMPACTION. I .... I.
I ~ -o-1" ~ •\0-" ~· • ><Or
Or
10 20 30 40
• T
/;.
HVEEM STABILITY
0
.. K : [ ...
..... "'"'
50 60 7
Figure 14. Relationship between HYeem stability and angle of internal friction.
42
35 G
a w 300 1-0 w a: a: 250 O::z: oo ::z:Z 0 ~ 20 ~w a:Cl. w~ n.: 15 0 0(!) <I o._Jr<l
zO 10 ol
0
·1/l w a 5 0 0
0
jOT
'
10
TESTING ASPHALTIC CONCRETE
AT
6 ,A.T
r. .... • A
><
X •oT
• 0
• ~· []
-o- "· 0 r. .... • ,...
0 -0- •\l .i: -o- .T ",. ••• I
.~. c I• I I
20 60 70 30 40 50 HVEEM STABILITY
Figure 15. Relationship between Hveern stability and cohesion from cohesiorneter test.
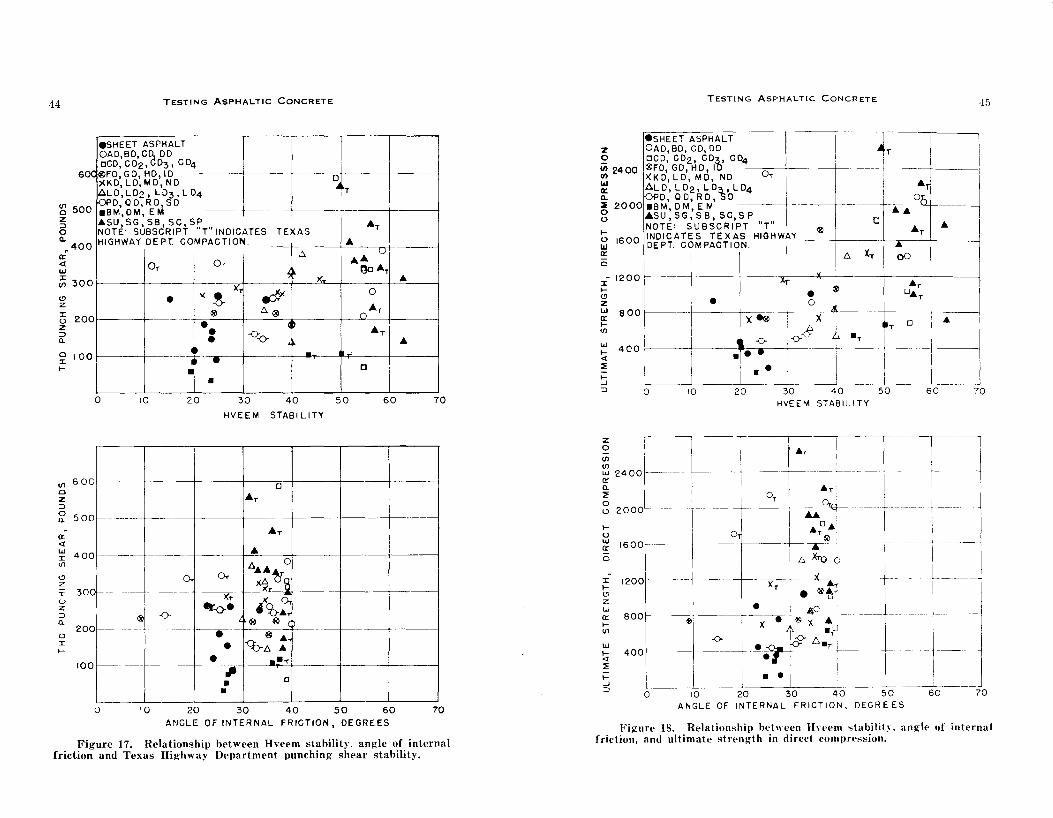
Figures 16 to 20 show the relationship between the Hveem stability values, the angle of internal friction from the Hveem stability test data and the Marshall stability, the Texas Highway Department punching shear stability, the ultimate strength in direct compression, the modulus of elasticity in direct compression, and the Asphalt Institute stability respectively.
Examination of Figures 16 to 20 indicates that no consistent relationship exists between the Hveem stability or the angle of internal friction and any of the other stability values with the possible exception of the modulus of elasticity in direct compression. It will be noted that the lack of any consistent relationship applies equally well to individual series and to groups of series.
Figure 19 shows the relationship between Hveem stability, angle of internal friction, and modulus of elasticity. The modulus of elasticity values were found to be quite variable between individual tests on specimens from the same mixture. It was very difficult to repeat results for modulus of elasticity. For these reasons it is questionable whether or not the very approximate correlation indicated by Figure 19 can be considered to have any meaning.
TESTING ASPHALTIC CONCRETE
300G-~----r-----~-----r-----,-----,----~------
z:g2500 1 ~ zooo r----+----+~----+- . T ·----o • • -~~-----~ erl ~ I +· ~ I ' i DO 0 •
~ "00 .- +--i --~-~- ,, ~ e 1 ed ' L ~ 1000 f------·· ·---- f--_J ____ ___) -- .l(_-t~--:'- ··+-----+-------1 <( ~ I .:', • :::< i-o .,.
5 00 L - ---+----- .0, j__• -o 0 ~ .... : -i -- -~ ~---+---___j
10 20 30 40 50 60 70 HVEEM STABILITY
10 20 30 40 50 60 70 ANGLE OF INTERNAL FRICTION, DEGREES
Figure 16. Relationship between Hveern stabilitv angle of internal friction and :\Iarsh all stability. · '
44 TESTING ASP HAL TIC CONCRETE
eSHEET ASPHALT OAD,BD, CD DO ceo, co2 , co3 , co4
60 ( ®FD, GO, HD, ID --- ~ ·-- 1------ -------0 1---- ----)(KD, LD, MD, NO ~1D,LD2, LD3,LD4
D,OD,RD,SD •BM,DM, EM .to.SU,SG,SB,SC,SP NOTE• SUBSCRIPT "T" INDICATES TEXAS
(/") 500 0
z :::> 0
HIGHWAY DEPT COMPACTION. 2..
Or Or ~,. x:.
l(
,:Y • )(
~ ® l:.®
• ~~ • -o-o-•
a. . 400 a: 4 w :I:
300 (/")
(!) z :I:
200 (.)
z :::> a.
_ _. ---.---f----- .. 0 100 :I: 1- • •
0 10 20 30 40 HVEEM STABILITY
<f) 6 00-0 z :::> li' 500- ----
a: <t
0
~, T
j .to.T
A
AA v go A 1
A 0
_D Ar
AT A
0
50 60 70
~ 4 00 -- --- ------+----+A""----::+-----11---·---+----(/") Ll.AA 0
~ 300 - -- ---- _o.-+---Or~+--'x~'\.r_tr~l s'l-----+----+----1 XT ~ u ~~ ~
3 et-o• • c.tr ... u. ® 0 L® ®
200--- - --.----r--®:;:o--... +---+----+-------j 0 I 1- • "<b-Ll. ...
100
0 10
• .."T - ---1--- .,. -t----....-+---+-----1------i
20
• • 30
c
40 50 60 ANGLE OF INTERNAL FRICTION, DEGREES
70
Figure 17. Relationship between Hveem stability. angle of internal friction and Texas Highway Department punching shear stability.
z 0
~ 2400 .., 0::
TESTING ASPHALTIC CONCRETE
esHEET ASPHALT OA D, BD, CD, DO ~-~~J~ ®FD, GD, HD, 10 -~--+----T--- f---- ----><KD, LD, MD, NO Or ALD, LD2, LD~, LD4 I A 1
-Hi
a. ::1 0 0
IJCD, C02, CD3, CD4 1
I = ~ D,OD,RD,SD 1 I ~
2000 •BM D M EM -----+ _T--- -- -Asu:sG;se, sc,sP 1 ......
NOTE· SUBSCRIPT "T" D .to. ::; l600 INDICATES TEXAS HIGHWAY ® AT-t-----1
; "00 DEPT ~0 IMPACTT- ~- ' 1 fi " aJ ~~ ~ I ~ ~ + lJAT~ ~ eool- I I xi®-~ -x t--- o --t• w i \ -o 0..!; f •r I
~ 400, I -.1
.:. I -~------j
:::>
z 0 (/") (/")
w 2400 cr Q.
:!: 0 0 2000
to ~ 1600 0
-
0
:I: 1200-!(!)
800
10 20 30 40 50 60 70 HVEEM STABILITY
I I ~ ... , I I' j--~+--:-f-.: --t l __ l
l I T I Or I I I ---r- -----r.u~Q- I
_l_- _-_l x, ~1}~- -n L- -~1 z w 0:: 1-!/)
w 1-<t :!: 1-..J :::>
®, I X • + ® X ~d I _j 400L--~~~-o--_-r~t_~_:~_.~~-6-·_:~~---_L-___ ·-~I- ____ j
0 10 20 30 40 50 60 70 ANGLE OF INTERNAL FRICTION, DEGREES
Figure 18. RelationHhip between H YPem stabilil v, angle of internal friction, and ultimate strength in direct compression:
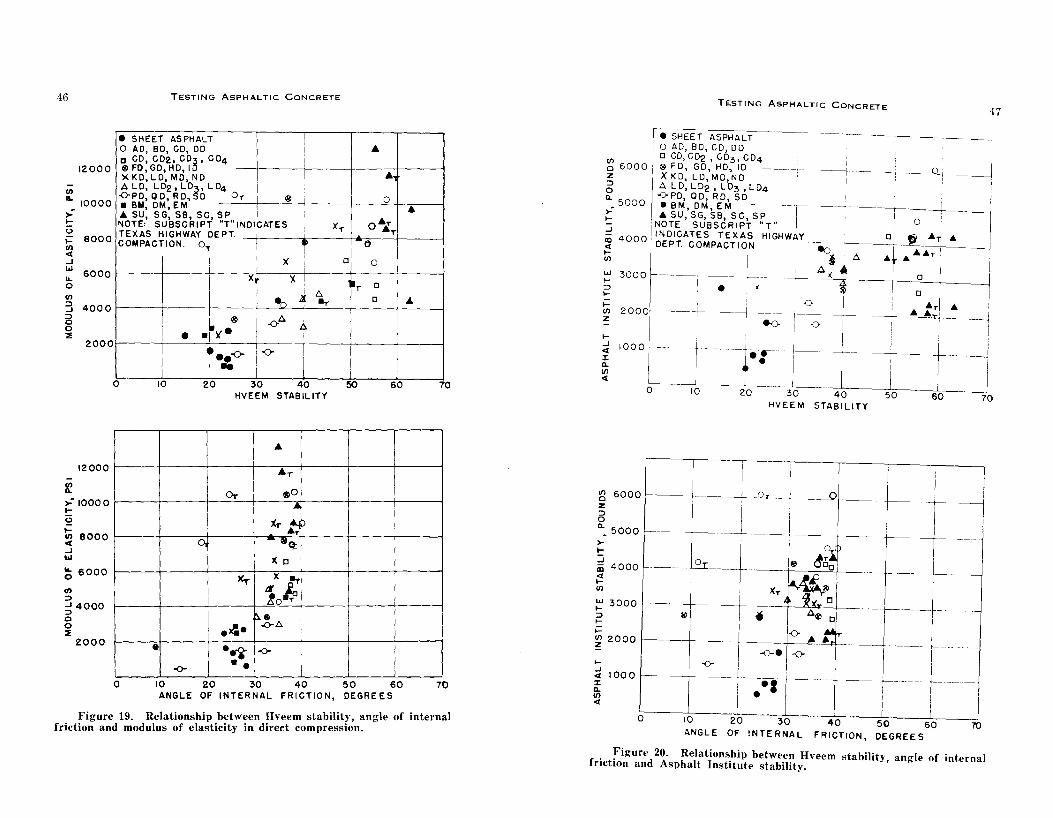
46 TESTING ASPHALTIC CONCRETE
e SHEET ASPHALT ' I • 0 AD, BD, CD, DO I
12000
1/) IL
10000 ~ !:: 0
~ 8000 1/) ct ...J w
6000 IL 0 1/) ::::l 4000 ...J ::::l 0 0 ::!:
2000
D CD, C02, COB, CD4 ' ® FO, GO, HD, I I
! • XKD,LD,MD,ND ! ALO, LD2 ,LD~,LD4
OPD,QD,RD, 0 0.,. ® I 0 • BN, OM, EM A SU, SG, SB, SC, SP I o•.,. NOTE: SUBSCRIPT "T"INOICATES
I )(T I
TEXAS HIGHWAY DEPT. A.,.
COMPACTION. o,. l f ol 0
I I X 0 I
I X )( I •r 0
.6. ~ 4 .... 0
I ® .()-.6. l i • ·"l(. J
• •• -<>- 1-o- '
I .. j 0 10 20 30 40 50 60
12000
~ .,.: 10000 ~
0 ~ 1/) 8000
"' ...J
"' ~ 6000
1/)
::::l ...J 4000 ::::l 0 0 2:
2000
0
HVEEM STABILITY
• i Ar
I Or «P I
I A
XT:} ~ "ctl
l( 0 :
~ X !!.ITI
i IX~· ! lo•.,.!
.4• ~~.6. : i
• •q -o-
-o- •• I 10 20 30 40 50 60 ANGLE OF INTERNAL FRICTION, DEGREES
•
•
70
70
Figure 19. Relationship .~tw~en ~veem stabilit!, angle of internal friction and modulus of elasticity m direct compressiOn.
I ~ 6ooo I z ::::l 0
TESTING ASPHALTIC CONCRETE 47
e SHEET ASPHALT 0 AD, 80, GO, DO o GO, GDz, G03, G04 ® FO, GO, HO, 10 X KO, LO, MD, NO A L o, L 02 • L 03 , L 04 I -0-PO, oo, RO, so I
I
--; ___ .;_ ____ _Q_:-----------!
Cl. 5000 .,.: ~
• BM, OM, EM ·t-----•sU,SG,SB,SC,SP I
0 1
NOTE SUBSCRIPT "T" ' 1 I ...J 4000 I INDICATES TEXAS HIGHWAY o/ ' •11 • i
tii I i t ~ .6. ·r ... ...... T: I
~ r~PT COMPACTION eo _JI
w 30 o o - ------,-------.___ .6. >< I o i ~ I • I ~ I 0 I
"' _ ___L__ _ ___ j ~I ---;:1:1~1 ~ o 10 20 3o 40 so 60 io
HVEEM STABILITY
I
~ 6000 f------+------- ~L---t-- o I i_r __
~ 5000 f--------r--------+------+-----+----1- - -->- 0 p ' ~ ~~ J. ~ •ooo e--- -!"'- x. ~ _ - _ _
~ 3000 ----®+---+--~--____::!--~.6.~~<--0-+---- - - -
i :::: ~ --~ ~ +-:·:·~c--I-t _ ~ • I I I
0 10 20 30 40 50 60 70 ANGLE OF INTERNAL FRICTION, DEGREES
Figure 20. Relationship between Hveem stability, angle of internal friction and Asphalt Institute stability.
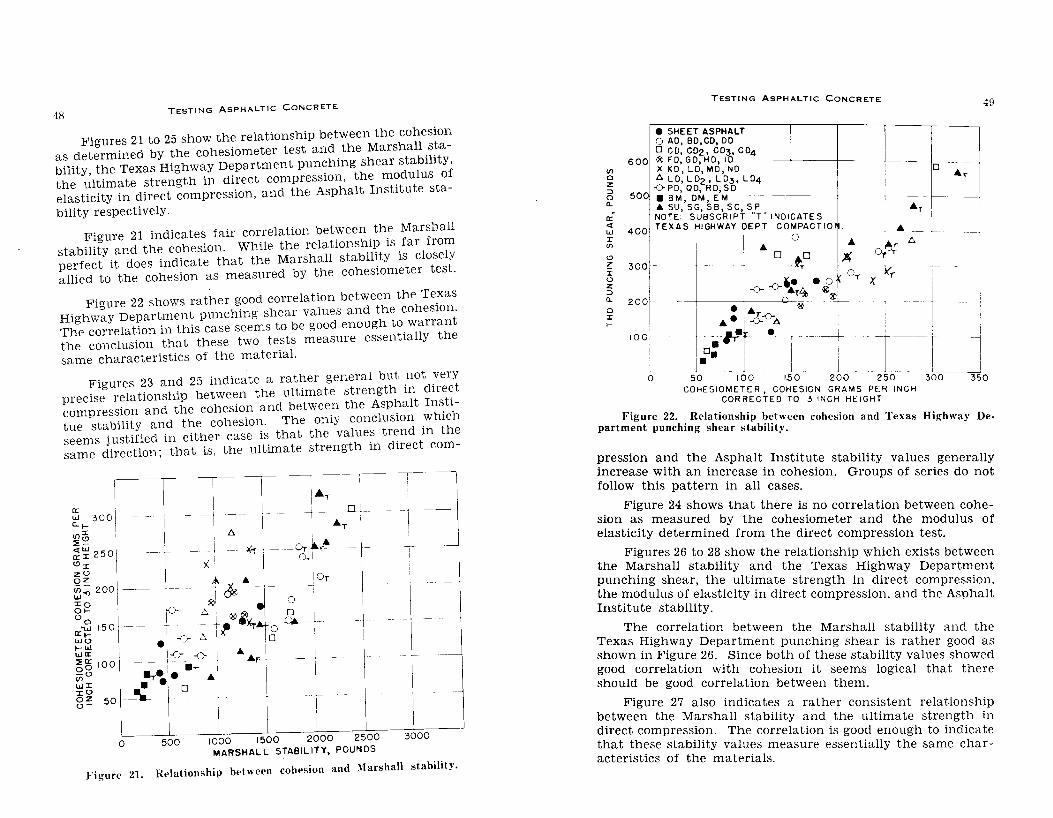
48 TESTING ASPHALTIC CONCRETE
Figures 21 to 25 show the relationship between the cohesion as determined by the cohesiometer test and the Marshall .s~ability, the Texas Highway Department pun~hing shear stability, the ultimate strength in direct compressiOn, the m?dulus of elasticity in direct compression, and the Asphalt Institute sta-
bility respectively.
Figure 21 indicates fair correlation bet:veen. th~ ~arsball stability and the cohesion. While the relatwnsh.IJ? 1s .far from perfect it does indicate that the Marshall stabil~ty 1s c.losely allied to the cohesion as measured by the coheswmeter test.
Figure 22 shows rather good correlation between the Te.xas Highway Department punching shear values and the coheswn: The correlation in this case seems to be good enough to warrant the conclusion that these two tests measure essentially the same characteristics of the material.
Figures 23 and 25 indicate a rather general but .not .very precise relationship between the ultimate strength m due~t compression and the cohesion and between the Asp~alt In~tltue stability and the cohesion. The only concluswn .wh1ch seems justified in either case is that the value~ trend m the same direction; that is. the ultimate strength m d1rect com-
0 500 1000 1500 2000 2500 MARSHALL STABIL lTV, POUNDS
3000
Figure 21. Relationship between cohesion and :\larshall stability.
VI a z ~ 0 a.
lr <f w r <f)
<!)
z r (.)
z ~ a. 0 r f-
600
TESTING ASPHALTIC CONCRETE
e SHEET ASPHALT 0 AD, BD,CD, DO 0 CD, C02, CD3, CD4 ® FD, GO, HD, ID X KD, LD, MD, NO t:. LD, LD2, LD3, LD4
500 OPD, 00, RD, SO • BM, OM, EM 4 SU, SG, SB, SC, SP NOTE SUBSCRIPT "T" INDICATES TEXAS HIGHWAY DEPT COMPACTIOI ·-· ' '
0 ,~0 : ~· ,-r l( OT v ·¥1.,. T' i,
-o- -o-• ... • 1>. • 2 'I nTTw ""® , I
400
300 -
200
-
---t--... -=--+-~~T--()-_t:._.J.;)~®= . . - t ~--
1 0~~ #f. • I - -- -r ----- ; -i 100
4\J
I• • I ~~------;;;;~ j_-=-"IC'7'_~1 0---- - 50 I 00 150 200 250 300 350
COHESIOMETER, COHESION GRAMS PER INCH CORRECTED TO 3 INCH HEIGHT
Figure 22. Relationship between cohesion and Texas Highway Department punching shear stability.
pression and the Asphalt Institute stability values generally increase with an increase in cohesion. Groups of series do not follow this pattern in all cases.
Figure 24 shows that there is no correlation between cohesion as measured by the cohesiometer and the modulus of elasticity determined from the direct compression test.
Figures 26 to 28 show the relationship which exists between the Marshall stability and the Texas Highway Department punching shear, the ultimate strength in direct compression. the modulus of elasticity in direct compression, and the Asphalt Institute stability.
The correlation between the Marshall stability and the Texas Highway Department punching shear is rather good as shown in Figure 26. Since both of these stability values showed good correlation with cohesion it seems logical that there should be good correlation between them.
Figure 27 also indicates a rather consistent relationship between the Marshall stability and the ultimate strength in direct compression. The correlation is good enough to indicate that these stability values measure essentially the same characteristics of the materials.
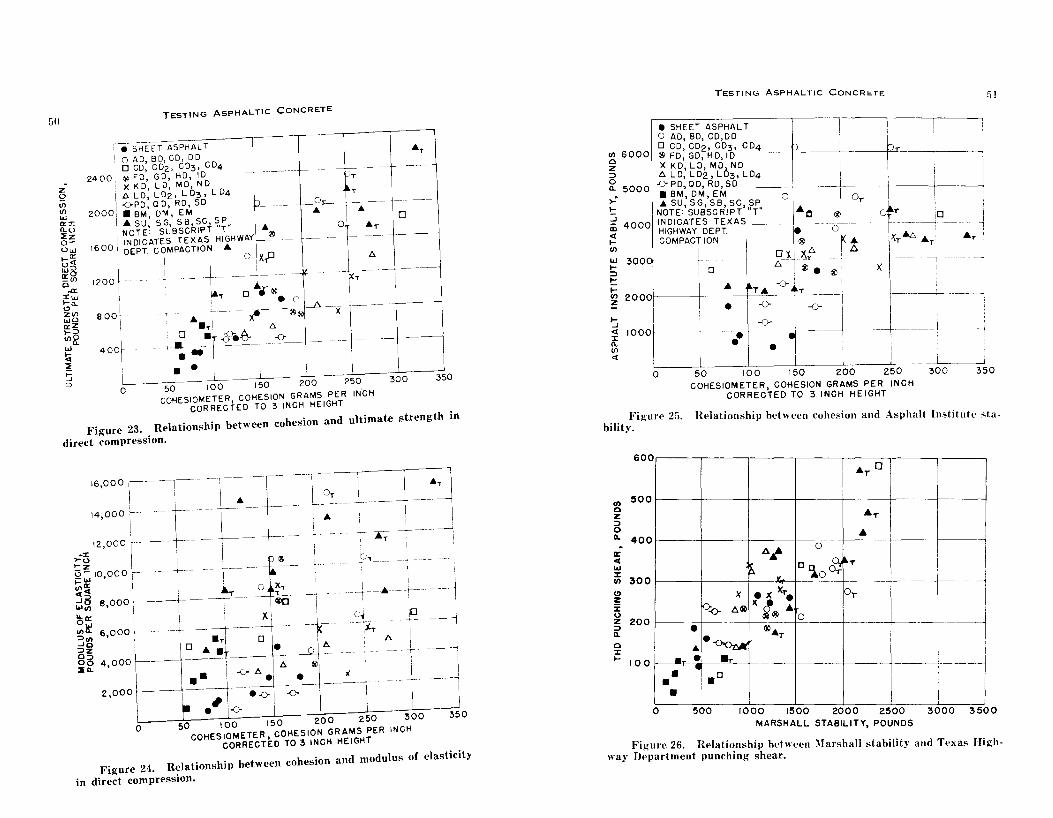
50
z Q <ll <ll UJ o:::r. n.o ::Ez oow ,_o:: o<t ..,:::> o::O _<f) 0
..a: ::c ... 1-n. C> Z<ll UJO o::Z t-::>
"'d: UJ
!ci ::E
5 :::>
TESTING ASPHALTIC CONCRETE
i e SHEET ASPHALT 0 AD, BD,CD, DO
, 0 CD, CDz, CD3 , CD4 2400' ~ FO, GO, HD, 10
I I -r--- -- -+----- -p;- -- -~
X KO, LD, MD, NO I l!> LD, LD2, LD3, LD4 ~r
2ooo! iaPo, a~, REoM so P------+--9-r~- ----i-----~--1 M, 0 , . ! & & ,
I ASU, SG, SB,SC,SP : 0 NOTE: SUBSCRIPT "T" i A® 0 &r
I GOO INDICATES TEXAS HIGHWAYr----=-~-- ----~ ___ ----+-----[ DEPT COMPACTION ... I v (
"00 I. , -t---ot"-- , --· _I;-~ _, ---, :Ar 0 e® r
eoo\ ' 4
- t- --~x-_ _._~~_A _x__l_ ----+-----1
II .'f'l ~
400r __ +~ --·+~._~~--- -()-~-- __ _ _ -----+------~
• • L____ I
0 50 100 150 200 250 350 300
COHESIOMETER, COHESION GRAMS PER IN.CH CORRECTED TO 3 INCH HEIGHT
Figure 23. Relationship between cohesion and ultimate strength in
direct compression.
0 50 100 150 200 250 COHESIOMETER, COHESION GRAMS PER INCH
CORRECTED TO 3 INCH HEIGHT
Figure 24. Relationship between cohesion and modulus of elasticity
in direct compression.
Vl 6000 0 z ::> 0 n. 5000
TESTING ASPHALTIC CONCRETE
e SHEET ASPHALT 0 AD, 80, CD,DD 0 CD, co2 , co3 , co4 ® FD, GO, HD, 10 X KD, LD, MD NO i!> LD, LD2 , L03 , LD4 -()-PO, 00, RD, SO .BM,DM,EM I &SU,SG,SB,SC,SP O 0.,- ,
NOTE: SUBSCRIPT "T" .A.,. 1 1 , g 4000
1
11NDICATES TEXAS .., ~ r ,0 :: +~~~~:d'T ~gr t' -~ .•.. -or---- --- ~--+--"' "" ~ ! J(r ~ Ar A,
UJ 300 -- 11- 0 - -- ~-'~-t- ~f' ' ~ i , w. , ... • ®, X- r- -i
.... I ... -o-! I
~zoot i • IT~ r~-i---1-- 1--.
51
~ ooor -t ··t-"·1 I -\---: -0 50 100 150 200 250 300 350
Figure 25. bility.
COHESIOMETER, COHESION GRAMS PER INCH CORRECTED TO 3 INCH HEIGHT
Relationship between cohesion and Asphalt Institute sta-
600r----r----r--~----~~~----~----Ar 0 I
Vl ~00 -i--~ ~ •oo r----+---+~L:t.~-~-L-0----~·T-t---~~--H ~ Is: ~0,~ I I' I Vl 300 r---t----if'f----------..1"'1:,.-.j__D __ 'iA_•_<:O::__o.r. T -t I I ~ I X • J( Xr• ~~ -- I I ~ f-o- 6.® x ~® A J l I
~ 200 r------:---1, ~~ •. -OonA--- t-----:®~~~ t2---l-~-- I --- i I .... 1 o o 1--.llt:- • 1 •,. ·
• , 0 --+-----•• I. I
0 500 1000 1500 2000 2500 3000 3500 MARSHALL STABILITY, POUNDS
wa. FDig-ur·et26. tRelatit~nship between :\larshall stahilitv and Texas Hirrh ) epar men punchmg shear. · · "' ·
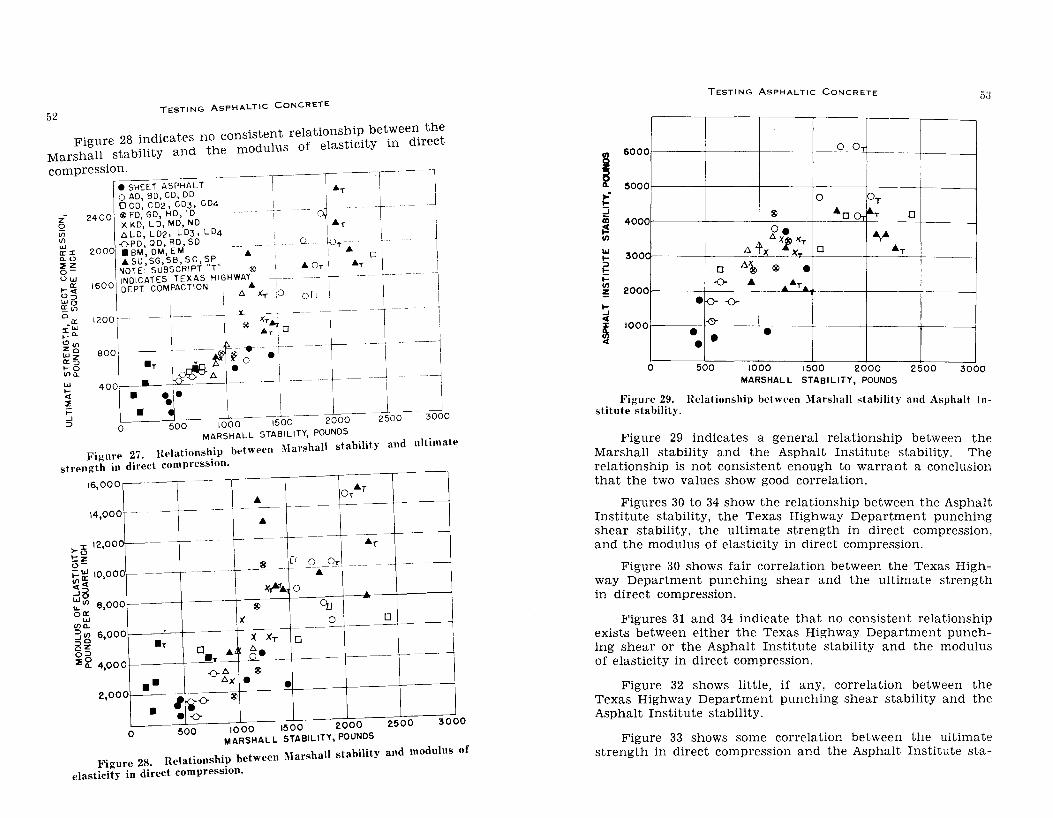
52 TESTING AsPHALTIC CoNCRETE
. 1 t· ship between the Figure 28 indicates no consls~e~~/eo~ l~l~sticity in direct
Marshall stability and the mo u compression. ----l
8 SHEET ASPHALT I -"'r I I
2400
0 AD, BD, CD, DO i I 1 0 CD, C02, CD3, CD4 -+-- +, ________ _ ®FD,GD,HD,ID Cl,\
XKD,LD,MD,ND 1-"'r 0 \~- -- 1 A L D, L 02, L D3 , L D4 I _ -0-PD, QD, RD, SO __ 1 Q -10-t··--.BM,DM,EM -"' i -"' I &SU,SG,SB,SC,SP -"'-r l NOTE SUBSCRIPT "T" ® I -"' OT J __ INDICATES TEXAS HIGHWAY -L--- -- - --DEPT COMPACTION • -"' 1
0
1
200
1600
\ ,_. x..- I OIJ II -- j -- -- -r~® ~~~ -----:--- li 1200
1-----:------ .... -r----- +------ --~ BOO -t! it9 0 • I I I I
~A Ou t t_- t _ _j 2000--2500 3000
400
• 0
1000 1500 MARSHALL STABILITY, POUNDS
:\larshall stability and ultimate Figure 27. Rdations~ip between
strength in direct compresswn.
16,000 ~- -----,--- -------r·
4 14,000 --
-+---------c--·---
• ------------ -------------
4r :x: 12 ooo~----,----~o ' Q~ ® CJ 0 OT ---.- -j:WIQOOO-----r-------------1/la: • :3~ x,.-r._ o ~<I) e,ooo ® CfJ
------
o 5 l( OJ .Ji------D-+---1 Ill~ I --~-~----t-~~~t=---3<1) 6,000f-- l( Xr o i3~ .T o=> D • ~. --r-----o .T ~--~~----~---~ ~ 4,00 0 ~-----t----"=---r-
-o-A ®
•• 2,000!--- lr.o
• •I -o-0 500
Ax • • 1000 1500 2.000
MARSHALL STABILITY, POUNDS
2500 3000
bTt d modulus of F
. 28 Relationship between Marshall sta 1 1 y an 1gure . . elasticity in direct compresswn.
TESTING ASPHALTIC CONCRETE 53
600 0 Q__Q! r-------
!SOO 0 0 PT
® 4o o, i&T 0 0 400
oe ..,. A Xf J(T
.c. r-K--~T 0 4T
0 A~ ® • 300
-o- 4 ............... ---2000 •o- -o-
-0-
• • • • 1000
0 500 1000 1500 2000 2500 3000 MARSHALL STABILITY, POUNDS
Figure 29. Relationship between :\larshall stability and Asphalt Institute stability.
Figure 29 indicates a general relationship between the Marshall stability and the Asphalt Institute stability. The relationship is not consistent enough to warrant a conclusion that the two values show good correlation.
Figures 30 to 34 show the relationship between the Asphalt Institute stability, the Texas Highway Department punching shear stability, the ultimate strength in direct compression, and the modulus of elasticity in direct compression.
Figure 30 shows fair correlation between the Texas Highway Department punching shear and the ultimate strength in direct compression.
Figures 31 and 34 indicate that no consistent relationship exists between either the Texas Highway Department punching shear or the Asphalt Institute stability and the modulus of elasticity in direct compression.
Figure 32 shows little, if any, correlation between the Texas Highway Department punching shear stability and the Asphalt Institute stability.
Figure 33 shows some correlation between the ultimate strength in direct compression and the Asphalt Institute sta-
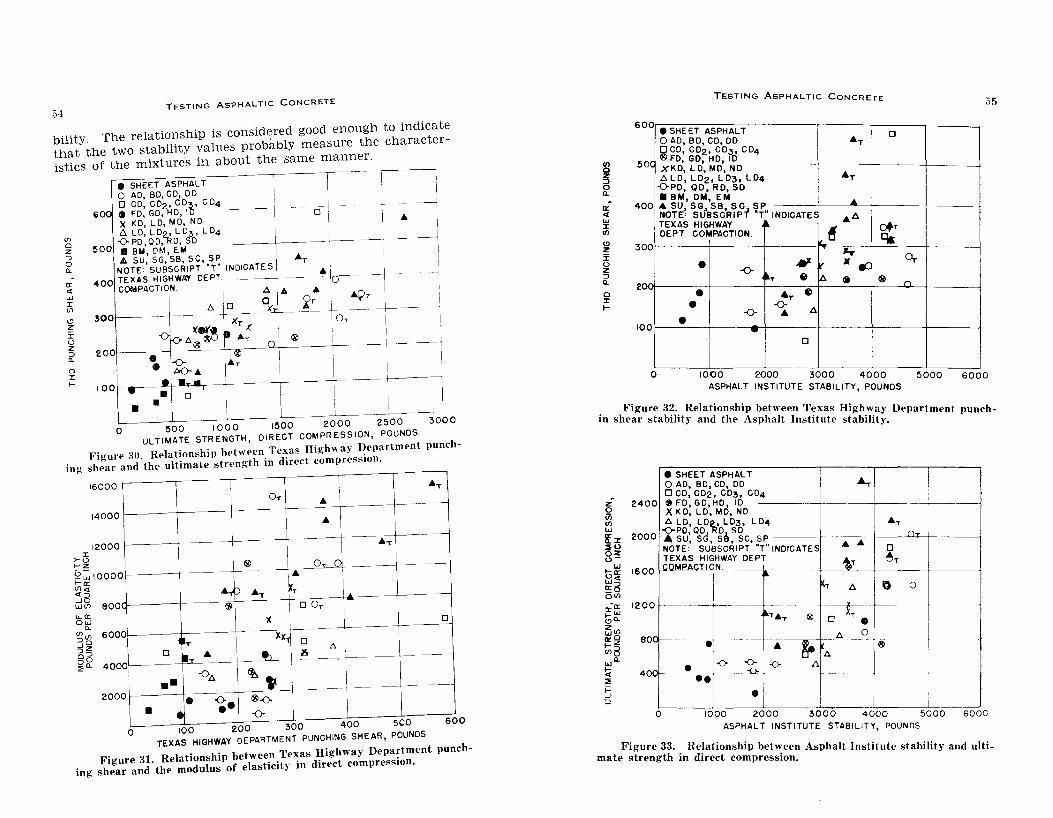
54 TESTING ASPHALTIC CONCRETE
bility. The relationship is considered good enough to indicate that the two stability values probably measure the characteristics of the mixtures in about the same manner.
0 500 I 000 1500 2000 2500 3000 ULTIMATE STRENGTH, DIRECT COMPRESSION, POUNDS
Figure 30. Relationship between Texas Highway Department punching shear and the ultimate strength in direct compression.
16000 o.,.
14000~----+----~-----+---~-~---+-
12000~---+----~------+-----~--~+-----:r ~o I
f-Z ® I ~~I OOOOI------+-----1-------+~--,_a:: ,. rn<( L ~~ eoort-----1-----·~·~~P ___ •~T~--~~T------~~-----~----~ u..a:: ~ I 0 OT I ow x I
Q. \ i 0 ~~ 60001---------+~--,-----1-----~x-x+-------1-----+----~ ~3 o i...... • II .._ ~ t;. i._ -~ Q. 4000L, --------+·=-T---1-----=-- I -·- --------1
2ooo ~~---' __ •_•-+-.-o-A __ ~+-1 -~-®-o--!-~ l\\ ----~----- ~---. ~· • 600 500 400 300 200 100 0 TEXAS HIGHWAY DEPARTMENT PUNCHING SHEAR, POUNDS
Figure 31. Relationship between Texas Highway Department punching shear and the modulus of elasticity in direct compression.
fJ) 0
~ 0 Q.
a:: <( w :J: V)
(!) z :r 0 z :J Q.
0 r 1-
TESTING ASPHALTIC CONCRETE
60 0 e SHEET ASPHALT 0 AD, BD, CD, DO •T 0
~CD, C02, co3 , co4 )( FD, GO, HD, 10
XKD, LD, MD, NO ~LD, LD2, LD3, LD4 •T OPD, QD, RD, SO
50
• BM, OM, EM 0 • SU, SG. SB, SC SP
... NOTE: SUBSCRIPl' "T" INDICATES TEXAS HIGHWAY ~
.. ~ DEPT. COMPACTION. 1£..~
o+T 0
C!& JLr
40
30
• ,.X ~ • -= -o-~ ... e ~ I» ~
• .&.,. e 200
• -o--o- .& A
100 • .. 0
0 IOQO 2 000 3000 4000 ASPHALT INSTITUTE STABILITY, POUNDS
35
0,.
r.
5000 6000
. Figure 32. Relationship between Texas H" h m shear stability and the Asphalt Institute s::bi';i~;. Department punch-
• SHEET ASPHALT I 0 AD, BD, CD, DO .,. I 0 CD, C02, C03, co4 ,
2400 SFD,GD,HD, 10 t-XKD,LD,MD,ND I - -~ A LD, LD2, LD3, LD4 .,.
"<>PO, QD tlD SO 2000 • su, sd, s~. sc, sP "-NOTE: SUBSCRIPT "T" -IN-0-IC_A_T_E_St--.~--;.;--f-0--~U-+-----j
!~.XA~_.HIGHWAY DEPT. ~ 1600 ~MPA\JTION -- ~T T
1 r--- r---~"----+----------
, ~... ~ 0 0
1200 ----t------- 1---- --- ----
• i
0 1000 2000 3000 4000 5000 6000 ASPHALT INSTITUTE STABILITY, POUNO<;
Figure 33. Relationship betw As h It I . mate strength in direct compressi~~~ P a nshtute stability and ulti-
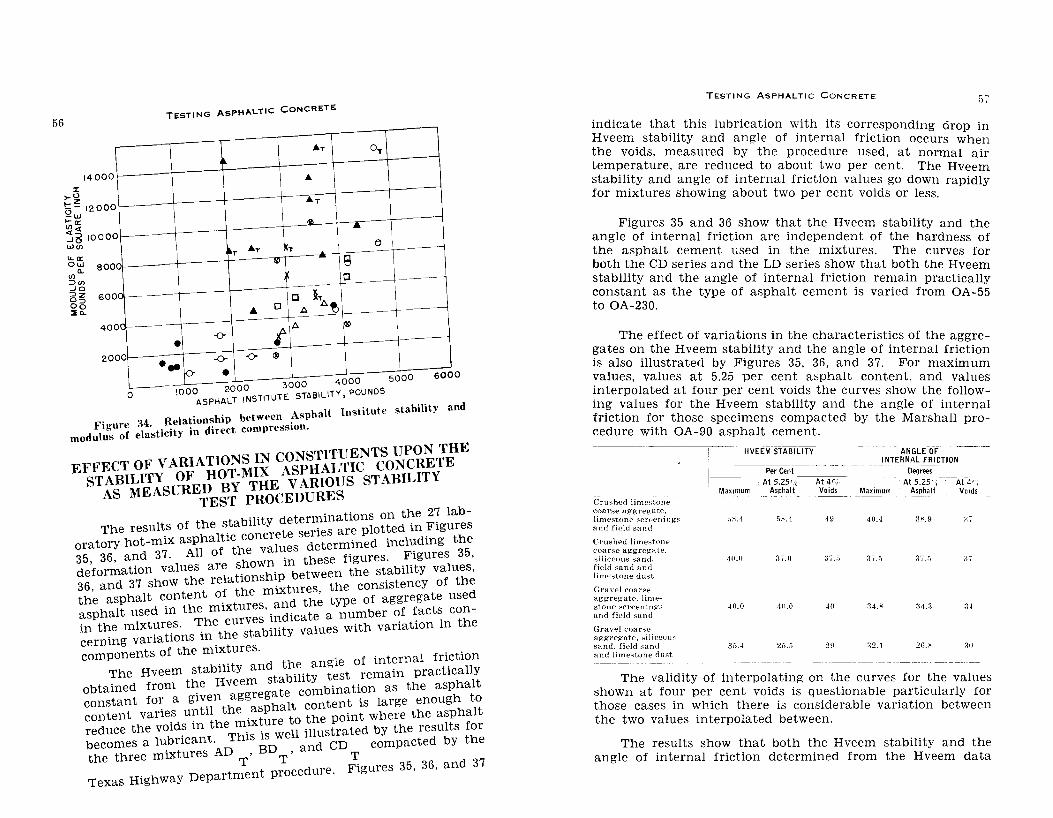
56
14000 :I:
,_o ._.z -- 1200 ~w
0
.... a:: ~<t _J5 1000 Wt/l
0
u.a:: ow t/)0..
::>til _lQ ::::>z 0::::> oo :Eo..
800 0
.r 600
400
200 0
0
TESTING ASPHALTIC CONCRETE
AT o.,. t-
A
I
A-r
"" -a
~T AT ~T 0
QP --- 8 0 .--
0 *,. A 0 A At
\---
-o fiA ®
• -o ® ... -o-
fo • 6000 !000 2000 3000 4000 5000
ASPHALT INSTITUTE STABILITY, POUNDS
Figure 34. Relationship between Asphalt Institute stability and
modulus of elasticity in direct compression.
EFFECT OF VARIATIONS IN CONSTITUENTS UPON THE STABILITY OF HOT-MIX ASPHALTIC CONCRETE
AS MEASURED BY THE V ARlO US STABILITY TEST PROCEDURES
The results of the stability determinations on the 27 laboratory hot-mix asphaltic concrete series are plotted in Figures 35, 36, and 37. All of the values determined including the deformation values are shown in these figures. Figures 35, 36, and 37 show the relationship between the stability values, the asphalt content of the mixtures, the consistency of the asphalt used in the mixtures, and the type of aggregate used in the mixtures. The curves indicate a number of facts concerning variations in the stability values with variation in the
components of the mixtures. The Hveem stability and the angle of internal friction
obtained from the Hveem stability test remain practically constant for a given aggregate combination as the asphalt content varies until the asphalt content is large enough to reduce the voids in the mixture to the point where the asphalt becomes a lubricant. This is well illustrated by the results for the three mixtures AD , BD , and CD compacted by the
T T T Texas Highway Department procedure. Figures 35, 36, and 37
TESTING ASPHALTIC C ONCRETE 51
indicate that this lubrication . . Hveem stability and angle f "_'Ith Its corresponding drop the ·d 0 mternal frict· in VOl s, measured by the wn occurs when temr:~rature, are reduced to ab~~~e~ure used, at normal air stability and angle of internal fr· . wo per cent. The Hveem for mixtures showing about tw Ictwn valu~s go down rapidly o per cent voids or less.
Figures 35 and 36 show that h angle of internal friction are . d t e Hveem stability and the the asphalt cement used in l~h epei~dent of the hardness of both the CD series and the LD ~ mixtures. The curves for stability and the angle of int senes s~o':" that both the Hveem constant as the type of asph:ftal fncti~n remain practically to OA-230. cement Is varied from OA- 55
The effect of variations in the char . . ~ates on the Hveem stabTt, actenstics of the aggre-Is also illustrated by Fi~~}esa~~ t~~ angle of internal friction ~alues, values at 5.25 er c , ' and 37. For maximum ~nterpolated at four pe/cent ~~id a~halt content, and values mg values for the Hveem st .. s e curves show the followfriction for those specimens acblllty and the angle of internal cedure with OA-90 asphalt ompacted by the Marshall pro _ __ ' cement. -
I ---~'Cent-_-_-_--__ , At 5.25'\ At 4•;
Cru:-.hnl lim~-~tone --- I __ Maximum Asphalt Voids
e_oarse aggrt-gate, hmes~one 8Crt'eningR and fwld sand
Crushed limestone coarse aggregate sHicPous ~and · field sand and' limEstone dust
Gravel coarse aggregate, limestone screening-s and fit>ld ~and
Gravel coarse aggregate, ~iliceous !::\and. field .sand and limestone dust
5~.4
4(1.0
40.0
35.4
!ll'-.4 49
3"i.O
'10.0 .j()
25.!) 29
ANGLE OF INTERNAL fRICTION
De<l""'' At5.25•; - Af4• '-
Maximum Asphalt Voids
40.4
31.!) 31.;')
~4.~ 34.3 :H
32.1 2li.:-o: :JIJ
The validity of interpolating on th --shown at four per cent void . _e curves for the values those cases in which ther _s Is qu_estwnable particularly for the two values interpolate~ l~e~~~:~erable variation between
The results show that both th angle of internal friction determinee:~~~~
stability and the the Hveem data
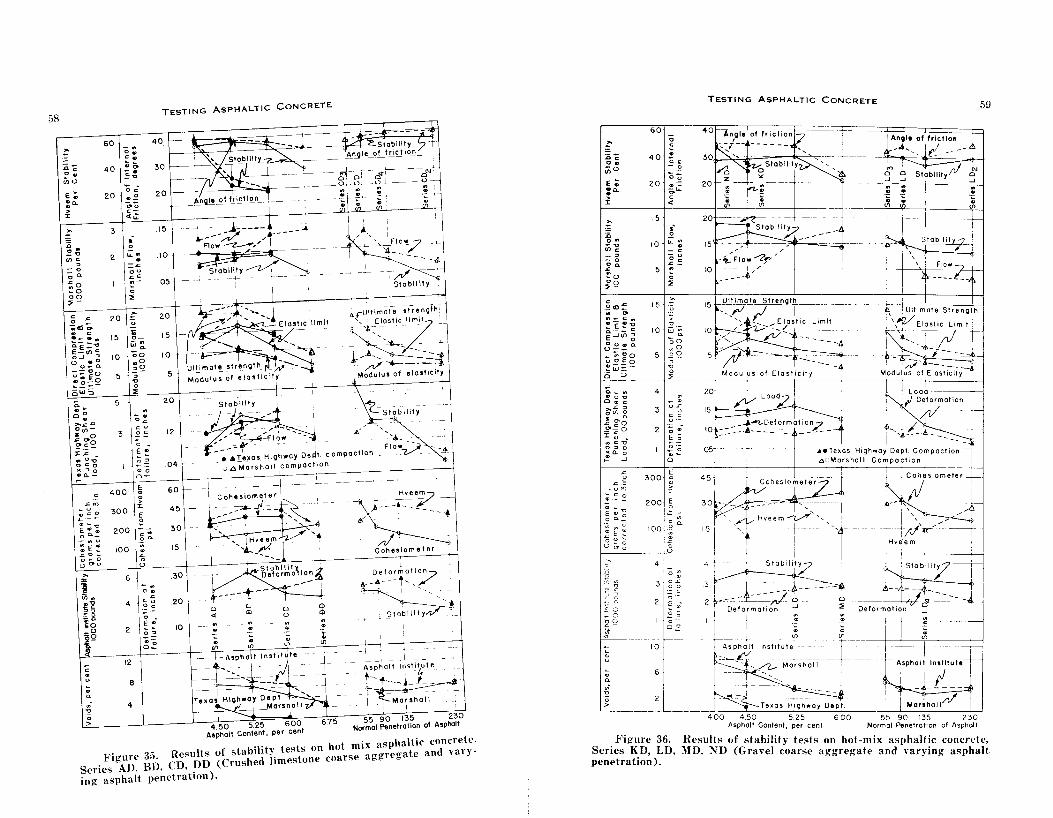
,., :;:; 0 .. _.., (/); -o t;<> -"o ~0 co ::!'-
c
"""' ~ u "c 0 .... ·-.,~.., E.,., 0 "-- Cl'l (,)
:e~ .co~ 0 ~ 0
c ., 0
., 0.
>
40
20
3
2
20
15
10
5
5
3
400
300
200
100
6
4
2
12
.15
.10
" - .. ".c co E.= 0 "
E" ~ ~
0 ~
-== "" o-
~ .. >
I
E e c .. .9 c. ~ ., .c 0
-., 0 ..
.c c u
-~ ·= 0 "
E" ~;
;;~
05 -
20
15
10
5
.20
12
Slobll\ty ~
.30 --1~-. Defor~otlo_:~ +-- . -- I
.20 - ---- <--
.10
0 c Cl q, <I Ill 0 ctl
~ .. " .'!' t
8
4
-I-- _l- -'-- -
Asphalt lnst!tute_ __
+--~---! _t~ t -~;a': shall-- -- :_ 1 I I
55 90 135 230 Normal Penetrolion of Asphalt
. . - hot mix asphaltic concrete. . Figure 35. Results (~:~=~:~tri~:\~~; coarse aggregate and vary
Senes AD, BD. CD, ~:>D ing asphalt penetratwn).
,., :;:; "" -.., (/)c
- ~ -o
"" .c ~0 oo ::!'-
.c u
.c = - u ~ ~ c 0 Cl>---
., 0.
i 0 >
60
40
20
15
10
5
15
10
4
3
300
200
100
4
TESTING AsPHALTIC CoNCRETE 59
0
" .. E~
0
0~ .. ~ ~L.I.. .. .. ~ "- ~ .. -.c - 0 0 c .c ·-" 10 0 ::!'
~
0
0 w·v; 0.
c;o ~0 oO 0 .., 0 :;,
~ - ~ ":i c c 0 - .,-0 ~ E o o= 'Q;.!:' 05 0
E ., 45 ~
> I
E 0
~ c 0. g .,
L 0 0
55 90 135 230 Normal Penetrotron of Asphol t
Figure 36. Series KD, LD, penetration).
Results of stability tt>sts on hot-mix asphaltic concrt'tt', MD, ND (Gravel coarst' aggregatt' and varying asphalt
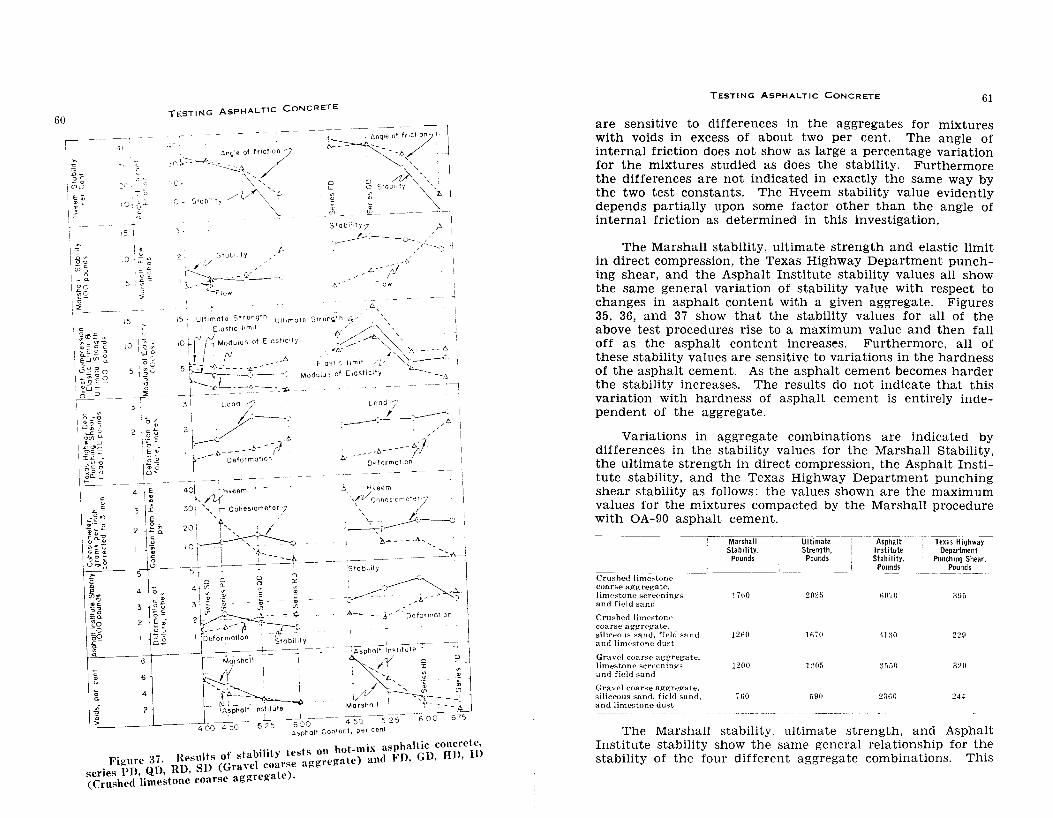
60
~<
I C ~ -;;,~
"' e -<5 :
TESTING AsPHALTIC CoNCRETE
~ _J:/ ~ ~L--y
t_- ..... Flew
TESTING ASPHALTIC CONCRETE 61
are sensitive to differences in the aggregates for mixtures with voids in excess of about two per cent. The angle of internal friction does not show as large a percentage variation for the mixtures studied as does the stability. Furthermore the differences are not indicated in exactly the same way by the two test constants. The Hveem stability value evidently depends partially upon some factor other than the angle of internal friction as determined in this investigation.
The Marshall stability, ultimate strength and elastic limit in direct compression, the Texas Highway Department punching shear, and the Asphalt Institute stability values all show the same general variation of stability value with respect to changes in asphalt content with a given aggregate. Figures 35, 36, and 37 show that the stability values for all of the above test procedures rise to a maximum value and then fall off as the asphalt content increases. Furthermore, all of these stability values are sensitive to variations in the hardness of the asphalt cement. As the asphalt cement becomes harder the stability increases. The results do not indicate that this variation with hardness of asphalt cement is entirely independent of the aggregate.
Variations in aggregate combinations are indicated by differences in the stability values for the Marshall Stability, the ultimate strength in direct compression, the Asphalt Institute stability, and the Texas Highway Department punching shear stability as follows: the values shown are the maximum values for the mixtures compacted by the Marshall procedure with OA-90 asphalt cement.
Marshall Stability,
Pounds
---~-~--~-'------Crush(;>d limestone coarse aggregate, lime~tone scret>nings and field sand
Crushed limestone coarse aggrf:'gate, silicf-'OUs sand, field sand and lim(:'stone dust
Gravel coarse aggregate. limestone screenings and field sand -
Gravel coarse aggregatt>, siliceous sand, field sand, and lime-stone dust
!760
!260
!200
760
Ultimate Strenyth,
Pounds
20ifi
lfi7(1
1205
590
Asphalt Institute Stability,
Pounds
607(1
4!:JO
:J550
28~i0
Texas H iyhway Department
Punching Shear. Pounds
395
2:?9
320
244
----------·-···--
The Marshall stability, ultimate strength. and Asphalt Institute stability show the same general relationship for the stability of the four different aggregate combinations. This
62 TESTING ASPHALTIC CoNCRETE
indicates that, for the mixtures te~te~, ~he vdar~ati~~e i~a~: th gregates IS mdicate m
characteristics of e ag_ tability tests. The Texas High-general way by these t~ree shear values are influenced in a way Department punchmg s i tions in the aggregates. The different manner by the var t be primarily dependent upon punching shear values seet? 0 t the characteristics of the fme aggrega e.
rnP ""rPd by the cohesiometer are The coh~sion values as a~da37· to be primarily dependent
shown by Figures 35, 36, I the case of all the series except upon the asphalt content.. n the cohesion increased with an the PD, QD, RD, SD, senes The single exception, the drop increase in asphalt content. 'd red to be due to the fact
. f ries RD is consi e It . in coheswn or se ' . . halt (low voids). IS that this mixture was very nch m ~~~nts were used for the probable that if higher asphal~ co ohesion would be had for other mixtures the same dr?P m. ~ure was so rich in asphalt these mixtures. The RD senes mix that it was difficult to mold.
. . ate are not reflected by a~w variatwns m type of agg~g . alues from the cohesw-
consistent variation in the co eswdn v of the asphalt cement V . t'ons in the har ness . meter test. ana I meed changes in coheswn
used are indicat~d by rather pr~~~l for the CD series and ~D values. Companson of the res h er that the variatwn
. 35 nd 36 show, owev , . t series, Figures a , . d s of the asphalt IS no in cohesion with changes m har nes entirely independent of the aggregate. . -
. . stued by the different sta The maximum sta~)llltY as me~alt contents for the various
bility tests occ~rs at different a:pvariation is indicated by the tests. No consistent manner o test results. . _
h w the variations m the deforn:-a Figures 35, 36, and 37 .s o t bility tests. The deformatwn
tion measured fo~ the vano':s s :n increase in asphalt ~ontent values generallY mc~ease Wit~ th plasticity of the mixtures. thus indicating the mcrease m t' e values the flow for the Examination of these deforma doFormatio~ at maximum load Marshall stabilit~ test, and th:tm~nt punching shear and for for the Texas Highway Dep~ test reveals nothing of value the Asphalt Institute stabilltly t· between the deformation
general corre a wn except a very . ed by the cohesiometer. values and coheswn as measur .
37 also shoW the coheswn values Figures 35, 36, and Tt test These values do not
obtained from the Hvee~ ~tab~~J do n~t show any consistent show any consistent vana~wn l s determined with the relationship to the coheswn va ues a
TESTING ASPHALTIC CONCRETE 63
cohesiometer. The values of the cohesion obtained by reducing the Hveem stability test data were quite erratic for all of the mixtures tested; they showed large variations between individual specimens of the same mixture. On the basis of the poor results obtained the cohesion value determined from the Hveem stability data is considered to be of very little value.
EFFECT OF MOLDING PROCEDURE ON DENSITY OF LABORATORY SPECIMENS
Figures 35, 36, and 37 show the variations in percentage of voids obtained by compacting specimens of hot-mix asphaltic concrete by the Marshall compaction procedure, the Asphalt Institute compaction procedure and the Texas Highway Department compaction procedure. Additional information is also shown in Table 13 for the cut-back asphaltic concrete mixtures and in Tables 14 and 15 for the hot-mix asphaltic concrete mixtures which were obtained from the Texas Highway Department and reheated and compacted by the three procedures.
The Asphalt Institute compaction procedure produced the highest percentage of voids for most of the mixtures with the Marshall compaction procedure being second and the Texas Highway Department compaction procedure showing the smallest voids. There were some cases, however, for which the voids by the Asphalt Institute compaction procedure were less than those for the Marshall procedure.
The differences between the voids obtained by the Asphalt Institute and Marshall compaction procedures seem to be closely connected with the internal friction of the aggregates and the possible lubrication of the mixtures by the asphalt cement. The greatest differences occur for the mixtures with high internal friction for example, AD, BD, CD, SP, SC, SB, SG, and SU. For these mixtures the voids obtained for the Asphalt Institute procedure average about three per cent greater than those for the Marshall compaction procedure. When the asphalt content is high and is producing lubrication in the mixtures, as for mixtures DD, RD, and ID, the differences in voids for the two methods of compaction are small and either procedure may produce the smallest voids. Note also that for the CD and LD series which were molded with OA-230 that the differences in the voids are small and neither procedure produced minimum voids in both cases. For the mixtures with the lowest internal friction, series SD, PD, QD. and RD, the Marshall compaction procedure gave the highest
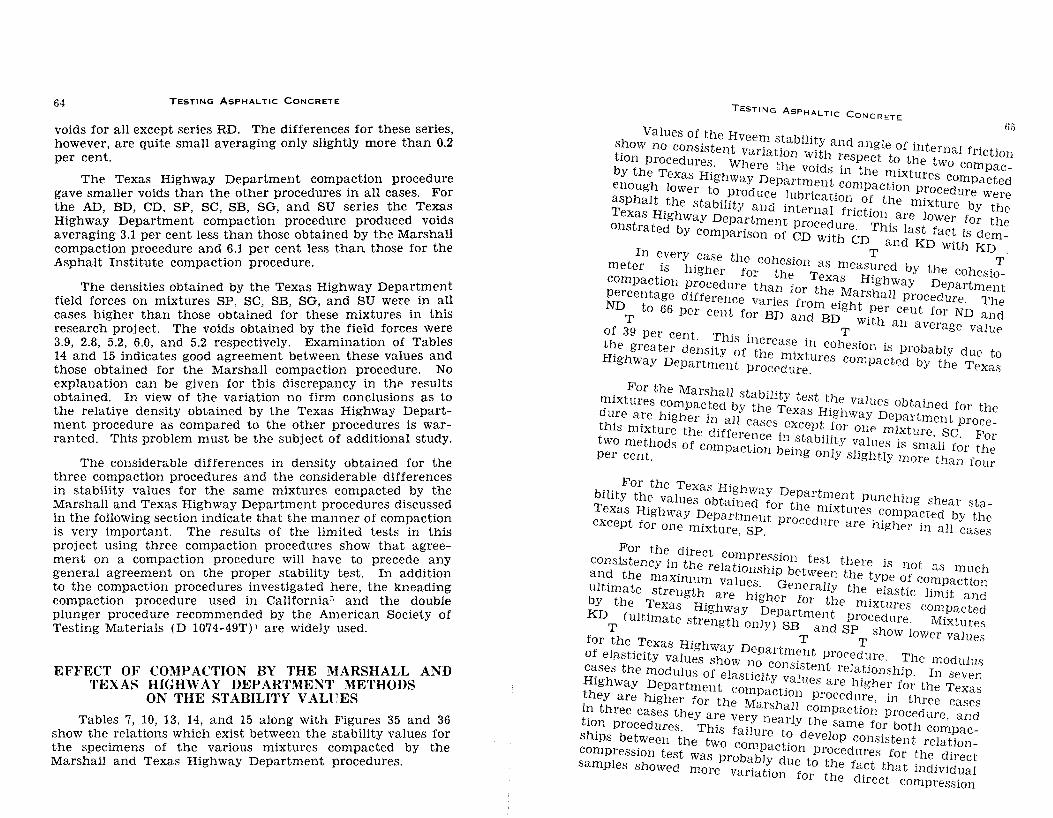
64 TESTING ASP HAL TIC CONCRETE
voids for all except series RD. The differences for these series, however, are quite small averaging only slightly more than 0.2 per cent.
The Texas Highway Department compaction procedure gave smaller voids than the other procedures in all cases. For the AD, BD, CD, SP, SC, SB, SG, and SU series the Texas Highway Department compaction procedure produced voids averaging 3.1 per cent less than those obtained by the Marshall compaction procedure and 6.1 per cent less than those for the Asphalt Institute compaction procedure.
The densities obtained by the Texas Highway Department field forces on mixtures SP, SC, SB, SG, and SU were in all cases higher than those obtained for these mixtures in this research project. The voids obtained by the field forces were 3.9, 2.8, 5.2, 6.0, and 5.2 respectively. Examination of Tables 14 and 15 indicates good agreement between these values and those obtained for the Marshall compaction procedure. No explanation can be given for this discrepancy in the results obtained. In view of the variation no firm conclusions as to the relative density obtained by the Texas Highway Department procedure as compared to the other procedures is warranted. This problem must be the subject of additional study.
The considerable differences in density obtained for the three compaction procedures and the considerable differences in stability values for the same mixtures compacted by the Marshall and Texas Highway Department procedures discussed in the following section indicate that the manner of compaction is very important. The results of the limited tests in this project using three compaction procedures show that agreement on a compaction procedure will have to precede any general agreement on the proper stability test. In addition to the compaction procedures investigated here, the kneading compaction procedure used in California~· and the double plunger procedure recommended by the American Society of Testing Materials (D 1074-49T) 1 are widely used.
EFFECT OF COMPACTION BY THE MARSHALL AND TEXAS HIGHWAY DEPARTMENT METHODS
ON THE STABILITY VALUES
Tables 7, 10, 13, 14, and 15 along with Figures 35 and 36 show the relations which exist between the stability values for the specimens of the various mixtures compacted by the Marshall and Texas Highway Department procedures.
TESTING ASPHALTIC C ONCRETE
Val f IHi ues o the Hveem stabilit ·' .
~~ow no consistent variation wi[ha~d an~1e of mternal friction ron procedures. Where the 'd .espec. to the two compac
by the Texas Highway Depart;::~n~ ll1 the n:ixtures compacte~ enough lower to produce lubric . compactwn procedure were asphalt the stability and . t atwn of the mixture by th Texas Highwa De ll1 erna1 friction are lower f e onstrated by :Omp~~;st~e~; ~~~~t~r~ This last fact iso~e~=
D and KD With KD In every case the h . T
meter is high,er f co tesron as measured by the coh . T com t· or he Texas H' h esro-
pac wn procedure than f Jg way Department percentage difference v. . or the Marshall procedure Th ND t 66 anes from eight P . e
T o per cent for BD and BD . er cent for ND and of 39 T wrth an average value
per cent. This increas . . t~e greater density of the : ,~~1 cohesron is probably due to Hrghway Department proce~:e,_ures compacted by the Texas
. For the Marshall stabilit t mrxtures compacted by th / est the values obtained for th du.re a:·e higher in all cas~s ::as Highway Department proce= thrs mrxture the difference ii cep~ ~or one mixture, SC. For two methods of comnaction b l. stabrllty v.alues is small for the per cent. - emg only slightly more than four
.. For the Texas Highway De brlrty the values obtained ~or tfartn:ent punching shear staTexas Highway Departmen~ le mrxtures compacted by the except for one mixture, SP. procedure are higher in all cases
For the direct com . consistency in the relatio~~~~~o~t test there is not as much an? the maximum values G ween the type of compaction ~ltrmate strength are higher e~~~a11y the. elastic limit and Y the Texas Highway D . the mrxtures compacted
KD (ultimate strength only~P~~tment procedure. Mixtures T and SP show lower 1
for the Texas High T T va ues f 1 . . way Department
o e astrcrty values show no . . procedure. The modulus ~":ses the modulus of elasticit~o~!~stent rela_tionship. In sever;
rghway Department com c • ues are hrgher for the Texas ~hey are higher for the M~;sc~~~~ procedu_re, in three cases ~~ three cases they are very nea~l compactiOn procedure, and tl(~n procedures. This failure Y the same for both compacshrps between the two comp ~? develop consistent relationcompression test was probabl acd ron procedures for the direct samples showed more var· tY. ue to the fact that individual
ra ron for the direct compression
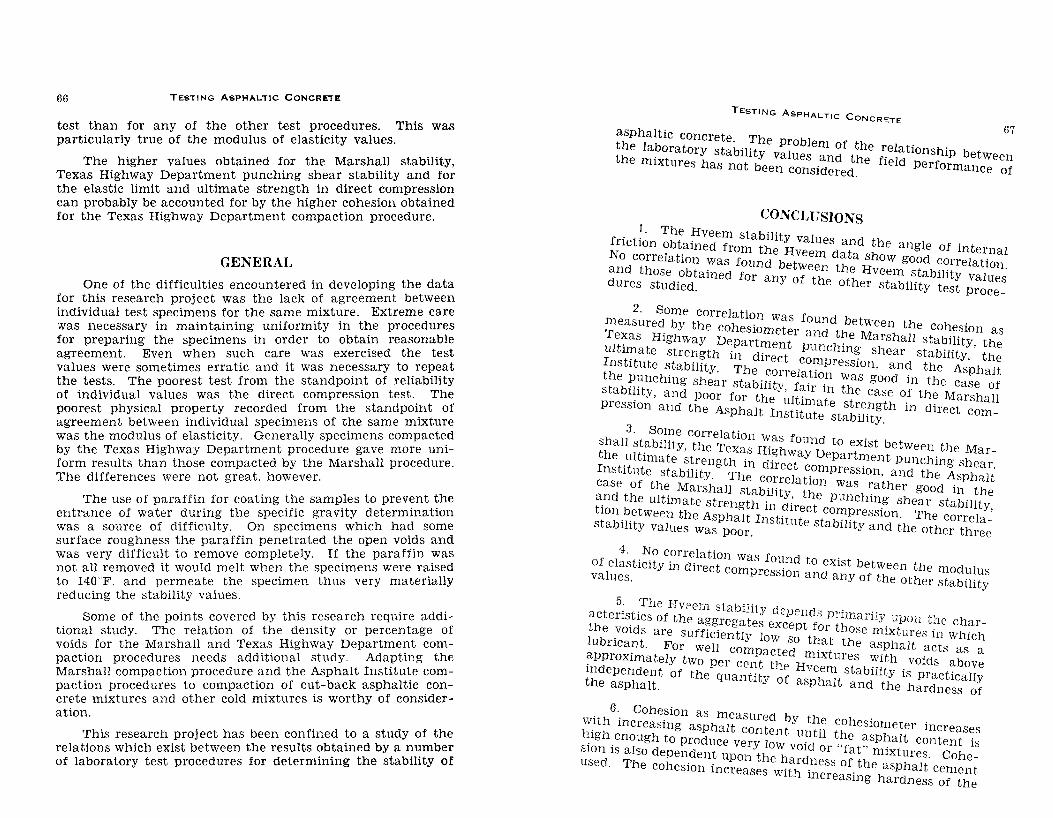
66 TESTING ASPHALTIC CONCRETE
test than for any of the other test procedures. This was particularly true of the modulus of elasticity values.
The higher values obtained for the Marshall stability, Texas Highway Department punching shear stability and for the elastic limit and ultimate strength in direct compression can probably be accounted for by the higher cohesion obtained for the Texas Highway Department compaction procedure.
GENERAL
One of the difficulties encountered in developing the data for this research project was the lack of agreement between individual test specimens for the same mixture. Extreme care was necessary in maintaining uniformity in the procedures for preparing the specimens in order to obtain reasonable agreement. Even when such care was exercised the test values were sometimes erratic and it was necessary to repeat the tests. The poorest test from the standpoint of reliability of individual values was the direct compression test. The poorest physical property recorded from the standpoint of agreement between individual specimens of the same mixture was the modulus of elasticity. Generally specimens compacted by the Texas Highway Department procedure gave more uniform results than those compacted by the Marshall procedure. The differences were not great. however.
The use of paraffin for coating the samples to prevent the entrance of water during the specific gravity determination was a source of difficulty. On specimens which had some surface roughness the paraffin penetrated the open voids and was very difficult to remove completely. If the paraffin was not all removed it would melt when the specimens were raised to 140°F. and permeate the specimen thus very materially reducing the stability values.
Some of the points covered by this research require additional study. The relation of the density or percentage of voids for the Marshall and Texas Highway Department compaction procedures needs additional study. Adapting the Marshall compaction procedure and the Asphalt Institute compaction procedures to compaction of cut-back asphaltic concrete mixtures and other cold mixtures is worthy of consideration.
This research project has been confined to a study of the relations which exist between the results obtained by a number of laboratory test procedures for determining the stability of
TESTING ASPHALTIC C ON CRETE
asphaltic concrete Th 67 the laboratory stability e v~~~blem of the relationship betw the mixtures has not been co~si~~~ed~e field performance e~~
CONCLUSIONS 1. The Hveem stabilit
friction obt_ained from the ~;:~~s and the angle of internal No correlatwn was found between ~~ta show good correlation. ~nd those obtained for any of th t~ Hveem stability Values
ures studied. e 0 er stability test proce-
2· Some correlation w measured by the cohesiome~=r found between the cohesion as Te~as Highway Department and t~e Marshall stability, the ultimate strength in d. t punchmg shear stability th Institute stability Th Irec. coi?pression, and the Asp' h let the P' h. . e conelatwn was d . a
. ~nc mg shear stability f . . goo ll1 the case of stabi~Ity, and poor for the , lt~Ir ll1 the case of the Marshall pression and the Asphalt In ut·timtate st~e.ngth in direct corn
s I u e stability. 3. Some correlation was f .
shall stability, the Texas Hi hwound to exist between the Marthe _ultimate strength in di~e ty Departi?ent punching shear Institute stability The corr c1 ~_ompresswn, and the Asphalt case of the Marshall stabilit e \ wn was ~ather good in the a_nd the ultimate strength in %ir ~e punchmg shear stability twn between th A h ec compression Th ' stability values :a~Ppoa~;. Institute stability and the ot~~~rt~I~:;
4. No correlation was f . of elasticity in direct compre~~~~ to ~XIst between the modulus values. an any of the other stability
5· The Hvcern stabTt . acteristics of the aggreg~t~~ e~~~~m~s Pnmarily upon the charJhbe _voids are sufficiently low s~\hort thtose mixtures in Which u ncant. For well co _a he asphalt acts as ~pproximately two Per c~a~J;~d H mixtures with voids abov: IDdependent of the- quantity - f veem stability is practically the asphalt. o asphalt and the hardness of
. 6.. Cohesion as measured b . ~ii;~ mcreasing asphalt content Yu~~~ ~~heswmeter increases . enough to produce very low . e asphalt content is
swn is also dependent upon the h vmd or "fat" mixtures. Coheused. The cohesion increases wi:~d_ness of_ the asphalt cement
mcreasmg hardness of the
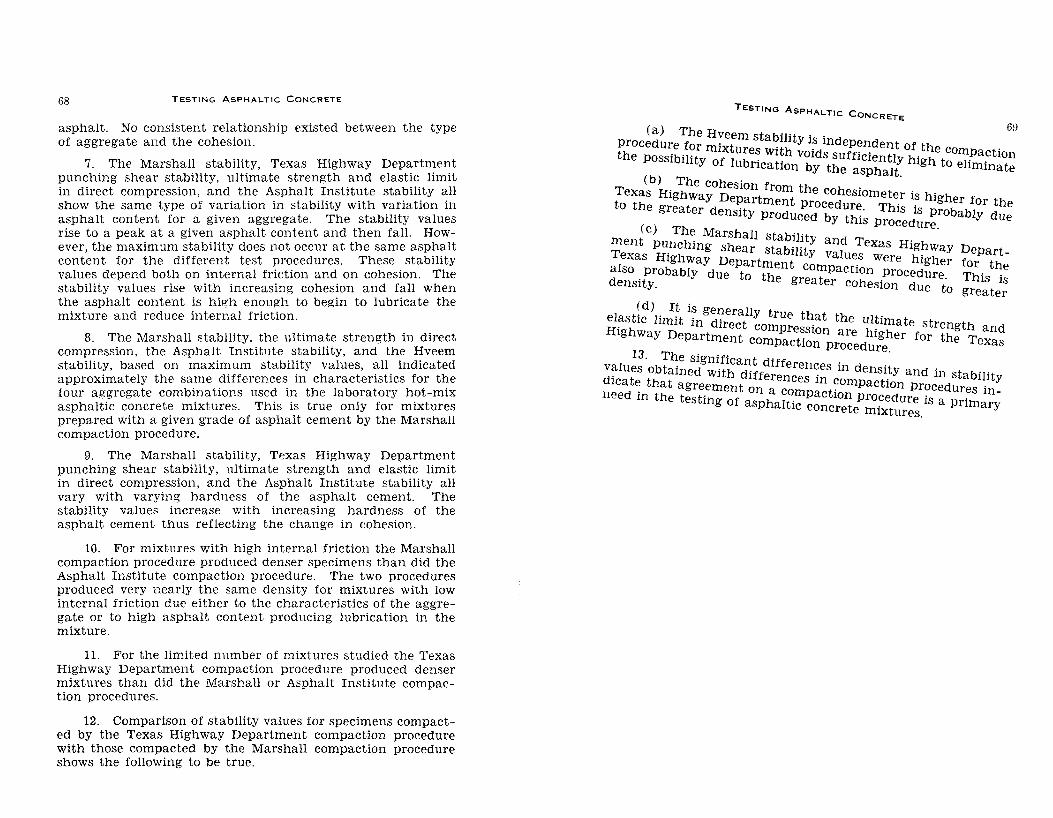
68 TESTING ASPHALTIC CONCRETE
asphalt. No consistent relationship existed between the type of aggregate and the cohesion.
7. The Marshall stability, Texas Highway Department punching shear stability, ultimate strength and elastic limit in direct compression, and the Asphalt Institute stability all show the same type of variation in stability with variation in asphalt content for a given aggregate. The stability values rise to a peak at a given asphalt content and then fall. However, the maximum stability does not occur at the same asphalt content for the different test procedures. These stability values depend both on internal friction and on cohesion. The stability values rise with increasing cohesion and fall when the asphalt content is high enough to begin to lubricate the mixture and reduce internal friction.
8. The Marshall stability, the ultimate strength in direct compression, the Asphalt Institute stability, and the Hveem stability, based on maximum stability values, all indicated approximately the same differences in characteristics for the four aggregate combinations used in the laboratory hot-mix asphaltic concrete mixtures. This is true only for mixtures prepared with a given grade of asphalt cement by the Marshall compaction procedure.
9. The Marshall stability, Texas Highway Department punching shear stability, ultimate strength and elastic limit in direct compression, and the Asphalt Institute stability all vary with varying hardness of the asphalt cement. The stability values increase with increasing hardness of the asphalt cement thus reflecting the change in cohesion.
10. For mixtures with high internal friction the Marshall compaction procedure produced denser specimens than did the Asphalt Institute compaction procedure. The two procedures produced very nearly the same density for mixtures with low internal friction due either to the characteristics of the aggregate or to high asphalt content producing lubrication in the mixture.
11. For the limited number of mixtures studied the Texas Highway Department compaction procedure produced denser mixtures than did the Marshall or Asphalt Institute compaction procedures.
12. Comparison of stability values for specimens compacted by the Texas Highway Department compaction procedure with those compacted by the Marshall compaction procedure shows the following to be true.
TESTING ASPHALTIC C ONCRETE
69 (a) The Hveem st bTt · ·
procedure for mixture a _II Y 1~ independent of the co . the possibility of lubr~c:tl~h vobrds sufficiently high to ~Pma?tron
ron Y the asphalt. mate (b) The cohesion fro th .
Texas Highway Departme~ e coheswmeter is higher for to the greater density proct~!~o~Ydutrh~· This is probably ~~=
1s procedure (c) The Marshall stabilit ·
ment punching shear sta .. Y and Texas Highway Texas Highway Departme:~llty value_s were higher also probably due to th compactwn procedure density. e greater cohesion due t.o
Departfor the This is greater
~d) It is generally true th el~stiC limit in direct compre _at the ultimate strength and Hrghway Department compact~soron are higher for the Texas
n procedure. 13. The significant differ .
~~lues obtained with differenc!~~es ll1 density and in stability rcat~ that agreement on a co m ?ompaction procedures in
need m the testing of asphalti~pactwn pro?edure is a primary concrete mixtures.
TESTING ASPHALTIC CONCRETE II
REFERENCES
1. "Tentative Method of Test for Compressive Strength of' Bituminous Mixtures." American Society of Testing Materials Standards, 1949. Page 1026.
2. ''Manual on Hot-Mix Asphaltic Concrete Paving, Methods of Testing Mixtures, Stability." Asphalt Institute. Pages 30-39.
3. "Investigation of the Design and Control of Asphalt Paving Mixtures, Vol. 1, Inclosure II, La bora tory Test for Design of Asphalt Paving Mixtures." Corps of Engineers. Waterways Experiment Station, Technical Memorandnm No. 3-254, 1948. Pages II-1. II-10.
4. "Care and Operation of the Hveem Stabilometer." Hogentogler and Co.
5. F. N. Hveem and R. M. Carmany. "Factors Underlying the Rational Design of Pavements." Proceedings Highway Research Board, Vol. 28, 1948. Page 101.
6. L. E. McCarty. "Applications of the Mohr Circle and Stress Triangle Diagrams to Test Data Taken with the Hveem Stabilometer.'' Proceedings Highway Research Board. Vol. 26, 1946. Pages 100-23.
7. "The Marshall Method for the Design and Control of Bituminous Paving Mixtures." Procedures for Design and Testing, Marshall Consulting and Testing Laboratory. Pages 17-23, 27-28.
8. "To Make the Stability or Shear Test." Texas Highway Department, Laboratory Handbook, November 1939. Page 80.
9. "Standard Methods of Test Procedures.'· Texas Highway Department, Construction Bulletin C-14, October 1947. Pages 12-26.
10. "Determining the Stability of a Molded Specimen of Asphaltic Concrete with the Hveem Stabilometer. THD-40." Texas Highway Department. 8 pages.
11. R. Vokac. "Compression Testing of Asphalt Paving Mixtures." Proceedings American Society for Testing Materials. Vol. 36, Part II, 1936. Pages 552-67.
12. R. Vokac. "Compression Testing of Asphalt Paving Mixtures." Proceedings American Society for Testing Materials, Vol. 37, Part II, 1937. Pages 509-18.
TESTING ASPHALTIC CONCRETE
SELECTED BIBLIOGRAPHY
1. D. C. Broome and R. 0. Child. "The Testing of Bituminous Mixtures." New York: Edward Arnold & Company. London: Longmans Green and Company, 1934.
2. W. H. Campen and J. R. Smith. "A Study of the Role of Angular Aggregates in the Development of Stability in Bituminous Mixtures." Proceedings Association of Asphalt Paving Technologists, Vol. 17, 1948. Page 114.
3. W. H. Campen and J. R. Smith. "A Study of the Omaha Testing Laboratories Bearing Index Test for Bituminous Mixtures." Proceedings Association of Asphalt Paving Technologists, Vol. 19, 1950. Page 369.
4. C. A. Carpenter, F. J. Goode, and R. A. Peck. "An Improved Triaxial Compression Cell for Testing Bituminous Paving Mixtures." PUBLIC ROADS, Vol. 26. No. 9. page 173. August 1951.
5. Ting Ye Chu and H. G. Spanf!ler. "Plant Stability Test for Hot-Mix Asphaltic Concrete Mixtures." Proceedings Highway Research Board, Vol. 29, 1949. Page 159.
6. V. A. Endersby. "The Analytic Mechanical Testing of Bituminous Mixes." Proceedings Association of Asphalt Paving Technologists, Vol. 11, 1940. Page 158.
7. W. J. Emmons and B. A. Anderton. "A Stability Test for Bituminous Paving Mixtures." Proceedings A.S.T.M., Vol. 25, Part 2, 1925. Page 346.
8. A. T. Goldbeck, J. E. Gray, and L. L. Ludlow. "Laboratory Service Test for Pavement Materials.'' Proceedings A.S.T.M., Vol. 34, Part 2, 1934. Page 608.
9. W. 0. B. Hillman. "Bending Tests of Bituminous Mixtures." PUBLIC ROADS, Vol. 21, page 69. June 1940.
10. H. T. Horsfield. "Strength of Asphalt Mixtures." JOURNAL SOCIETY CHEMICAL INDUSTRIES, Vol. 53, No. 16, page 107. April 1934.
11. P. Hubbard and F. C. Field. "A Practical Method of Determining the Relative Stability of Fine Aggregate Asphalt Paving Mix." Proceedings A.S.T.M., Vol. 25, Part 2, 1925. Page 335.
12. P. Hubbard and F. C. Field. "Correlation of Stability Test with Behavior of Pavement Under Traffic." ROADS AND STREETS, Vol. 67, page 52. January 1927.
7-l TESTING ASPHALTIC CONCRETE
13 .. P. Hubbard and F. C. Field. "Adaption of Stability Test to Include Coarse Aggregate Asphalt Paving Mixtures." ENGINEERING AND CONTRACTING, Vol. 71, No. 6, page 160. June 1932.
14. A. R Lee and A. H. D. Markwick. "The Mechanical Properties of Bituminous Surfacing Materials Under Constant Stress.'' JOURNAL SOCIETY CHEMICAL INDUSTRIES, Vol. 56, page 146 T. May 1937.
15. A. R Lee and P. J. Rigden. "Use of Mechanical Tests in Design of Bituminous Road Surfacing Mixtures-Dense Tar Surfacings." JOURNAL SOCIETY CHEMICAL INDUSTRIES, Vol. 64, No. 6, page 153 T. June 1945.
16. C. Mack. "Study of Bituminous Mixtures on Road Testing Machine." JOURNAL SOCIETY CHEMICAL INDUSTRIES, Vol. 60, page 111 T. May 194L
17. B. C. Manton and W. G. Wren. ''Mechanical Testing of Plastic Road Materials." JOURNAL SOCIETY CHEMICAL INDUSTRIES, Vol. 53, No. 20, page 141 T. May 1934.
H' .. Gayle McFadden and W. C. Ricketts. "Design and Field Control of Asphalt Paving Mixtures for Military Installations." Proceedings Association of Asphalt Paving Technologists, Vol. 17, 1948. Page 93.
19. N. W. McLeod. "The Stability of Granular and Cohesive Materials in Triaxial Compression." Association of Asphalt Paving Technologists, Vol. 17, 1948. Page 184.
20. L. W. Nijboer. "Mechanical Stability of Bitumen Aggregate Mixtures." JOURNAL SOCIETY CHEMICAL INDUSTRIES, Vol. 67, No. 6, page 244 T. June 1948.
21. J. T. Pauls. "Dimensions of Testing Equipment Affect Hubbard Field Stability Values." PUBLIC ROADS, Vol. 17, page 38. April 1936.
22. J. T. Pauls and H. M. Rex. "A Test for Determining the Effect of Water on Bituminous Mixtures.'' PUBLIC ROADS, Vol. 24, No. 5, page 115. July 1945.
23. J. P. Pfeiffer. "Observations on Mechanical Testing of Bituminous Road Mixtures." JOURNAL SOCIETY CHEMICAL INDUSTRIES, Vol. 57, No. 7, page 213 T. July 1938.
24. H. W. Skidmore. "Practical Application of the Shear Test to Bituminous Mixtures." ROADS AND STREETS, Vol. 69. No. 1, page 5. January 1929.
TESTING ASPHALTIC CONCRETE
25. 75
F. P. Smith "Stabilit f AND STREETS, Vol. 6{ ;o ~sphait Pavements.·• ROADS
. . , page 115. February 1928. 26 · V. R. Smith "Triaxial St b Tt
ment Desig~." Proceedin;s I~ Y ~e~~od for Flexible PaveTechnologists Vol 18 1949 spsocia wn of Asphalt Paving
27. ' · · · . age 63.
!· E. Stanton and F. N. B.veem " m the Preliminary Investigat· . ~ole of the Laboratory for Low Cost Bituminou~ Pav~~e~~ ,co;~rol o~ Materials way Research Board Vol 14 P ·t Isi. roceedmgs High-
, · • ar , 1934. Page 14 28. T. E. ~tanton and F. N. Hveem .. , . . ...
Cohesion of Bituminous P . . M.easunng Stablllty and CALIFORNIA HIGHWAYS ~-;;~g Mixtures by Machines." January 1936. PUBLIC WORKS, page 10.
29. E. L. Tarwater. "Roller Testin . Stability of Bituminous Mixture~ .~achme for Measuring 16, No. 7, page 134. September 1g35.PUBLIC ROADS. VoL
30. N. H. Taylor. "Design and T . Mixtures." JOURNAL SOCIE estmg of Asphalt Paving Vol. 51, No. 53 page 415 T DTY CHEMICAL INDUSTRIES
' · ecember 1932. · 31. R. Vokac. "An Impact Test f .
of Asphalt.'' Proceeding A or. St_udymg Characteristics Technologists Vol 6 1935s pssocmtwn of Asphalt Paving
' · · . age 40. 32. M. C. Warner. ''Wyomin L ,
of Oil Mix." WESTERN C~N aboratory Test for Stability November 1939. STRUCTION NEWS. page 364.
TESTING ASPHALTIC CONCRETE 77
PREVIOUS BULLETINS OF THE TEXAS ENGINEERING EXPERIMENT STATION
Numbers 1 to 4() published 1915 to 19:39. List furnished on request.
No. 46. Rural Water Supply and Sewerage. Part 1. Excreta Disposal and Sewerage. E. W. Steel and P. J. A. Zeller. 1939.
No. 47. Treatment of Settled Sewage in Lakes. F. E. Giesecke and P. J. A. Zeller. 19:19.
*No. 48. Lecture Notes on Practical Petroleum Geophysics. Garrett
*No. 49.
No. 50.
No. 51.
]'\ 0. 52.
No. 53.
No. 54.
No. 55.
No. 56.
No. 57.
Kemp. 1940.
Papers Presented at the First Annual Air Conditioning Short Course. 1939.
A Rational Method of Analyzing \Vater Rate Structures. S. R. Wright. 1940.
Rural Water Supply and Sewerage. Part II, Rural Water Supply. E. W. Steel and P . . 1. A. Zeller. 1940.
The Installation and L"se of Attic Fans. W. H. Badgett. 1940.
Proceedings of thP SixtePnth Annual Short CoursP in Highway Engineering. 1941.
The Willard ChentliPr LPctures. 1940.
The Effect of Voltage Variationo; on the Domestic Consumer. L. M. Haupt, .Jr. 1940.
Proceedings of thP First Annual Conference on SurYeying and Mapping, May Ul40. 1941.
A History of Suspension Bridges in Bibliographical Form. A. A. Jakkula. 1941.
No. 58. Two-Span Continuous Beams with Dead Loads. A. A. Jakkula. 1941.
No. 59. Spacp for Teaching. An Approach to the Design of Elemental'y Schools fol' Texas. W. W. Caudill. 1941.
No. 60. Proceedings of the First and Sec(Jnd Annual Conference of Municipal EnginPers. 1941.
No. Gl. Proceedings of the Conference on Highway Economics. 1941.
No. 62. Heat Requirements of Intermittently Heatt>d Buildings. Elmer G. Smith. 1941.
No. 63. Solwnt Extraction of Cottonseed Oil. W. D. Harris. 1941.
No. 64. Solution of T\\"O-Span Continuous Beams l:nder Li,·e Loads by usp of Nomographs. A. A. Jakkula. Hi41.
No. 6ii. Water Treatment with Limestone. C. H. Connell, P. J. A. Zeller, and J. H. Sonels. 1941.
*No. 66. Sonw Fundamentals of Timber Design. Howard J. Hansen. 1942.
/8 TESTING AsPHALTIC CoNCRETE
No. n7-71A. .\Y AND RCNWAY SOIL MECHA~ICS DATA.
ROADW. . • 194
.) Henry C. Porter. · ~·
No. f)7.
No. liS.
No. 69.
. . f ChY Soil Densification. Part I --Permanenc)' o · '· • .
. d T t'll Moisture Content of Clay SoJI. Part II-Dens1ty an ° ' .
't d Tol'll Densitv Change of Clay SoliS. !'art 11!-Dc·nsJ y an ' •.
·,tJld Total Volumetric Change of Clay Part IY-Density Soils.
d . . M ·stun· Contents of . 't . . d I nterme wtE' " 01 • · No. 70. Pm·t V-D(ons1 j an~ ..
Consolidated Clay ~oJb. . d. t Volumetnc Changes
l'at·t VI-D<'nsity and' 1~1terme HI t'
of Consolidated Clay SoilS. . . . ·,t . Contents and Volumetlc
!'·llt Vll-lntenned1<tte Mol,; m,e. ' Changes of Consolid<lted Clay Smls. . .
. 'l· , s ·1 Specnnens fo1 ~1 1' ·t \Till Method of Prepanng C ,1) ' OJ '
No. ' . aJ - . PhYsical Tests.
• f Cl Soils when P·nt IX-Density and Strength o ay c:msolidated and Saturated.
t and Strength of Pm·t X-Density, M~isturP Conten '
1\o. 71A. ' Cl S l' Consolidateo · ay ' 01 s. . . Cl· , Soils Beneath l'aYE'lllents.
Pm·t X!-MOlsturE's ,m "a~ . ,rh XI. (, 1"11 :;;lm'ni<trY-f arts I ThJoug Tenc ' ..._ ~ ..
T .\griculture FrE'ight Hates Affecting c·xas , . No. 72. A Study of the 4 3
Tom D. Chnry. 19 : ·
No. n. No. '74.
No.
''No. 76.
No. 77.
*No. 7S.
No. 7H.
No. so.
No. 81.
C. L. Williford. 194:~. X-Hay Studies of PaYing Asphalts.
\" d Roof Trusses. Design Loads for "oo en Howard J. Hansen.
194:2. Pat·t III, The Specific
}{ural Water Supply and 8.~wer~lgt'h l{pJ110Yal of Iron and TrE'atnwnt of ''Hed '.VatE'l' f 01
.• t de J. H. Sonels. 194:2. . 'd n J A Zelle1 ,dl Carbon Dwx1 e. r · · · ·
A Lo\1' Cost Home for Texas. C. J. Finney. 194:3.
. . s· l!lC'h Pipe and the w. t · Flowmg m , IX- · Friction Heads of . d et h ,,.. 1d Water Temperatures Effects of Pipe Surface Roug mk~ aJ d J S Hopper. 1948. on Friction Heads. F. E. GJesE'c e an . .
. . . . th, Failure of the Tacoma Rt-print of ~ngma~ ~epol t~ ~n A Lkkula. 1944. Nanows Bndg<~. I•,dJtE'd b;.. " . . . .
t : ProJ·ection and lts Apph-' "' . Appnnch to ,Axonome llC . 1"44 .--. ,,e\1 · · . J G McGmre " ·
cation to Shop Drawmgs. · · · · Wmtime AYiation Planning Con
Proceedings of tht: Thit·d fen•nce. 1944.
. . I Short Course and ConferE'nce Proce('dings of thP Fn·st A 1~1~~~. . lg 1944. --Airport Management ali< ,1nl1ll .
TESTING ASPHALTIC CONCRETE 79
''No. S2. The Effect of the Present Freight Rate Structure on Five Industries in Texas. Tom D. Cheny. 1944.
*No. s:3. Bibliography on the Petroleum Industry. E. DeGolyer and Harold Vance. 1944.
No. S4. A Study of Rose Oil Production in Texas. J. H. Sorrels and J. C. Ratsek. 1944.
No. S5. The Texas School of the Air-Jobs Ahead in Engineering. Sponsored by the School of Engineering. 1944. ·
*No. S6. Postwar Pl::mning Conference for Controlled Surveying and Mapping. 1945 .
No. S7. Disinfection of Mattresses. E. H. Gibbons, W. D. Ranis, and P. J. A. Zeller. 1945.
No. SS. Dimensioning and Shop Processes. J. G. McGuire. 1945.
No. S9. A Surface vVater T1·eatment System for the Rural Home. Joe B. Winston. 1945.
*No. 90. Adobe as A Construction Material in Texas. Edwin Lincoln Hanington. 1945.
No. 91. Steel Columns. A Suney and Appraisal of Past Wo1·ks.
No. 92.
''No. 9:3.
No. 94.
No. 95.
*No. 96.
No. 97.
No. 9S.
No. 99.
No. ] 00.
A. A. J akkula and H. K. Stephenson. 1949.
Analyses in High Frequency Fields. Fred W. Jensen ;md A. J. Parrack. 1945.
Well Logging Methods Confel'l:nce. 1945.
The Competiti\·e Problems of Commodity Freight Rates. W. B. Langford. 1945.
The Effective lJ se of Portable Fans. E. G. Smith. 1945.
Drilling Fluids Conference. 1945.
Geographical Distribution of Some Basic Texas Industries. J. G. McGuire. 1945.
Sewerage Senice Charges. Samuel Robert W1·ight. 1945.
The Willard Chevalier Lectures. Willard CheYalier. 194 5.
First Annual Short Course on Instrumentation for the Process Industrircs. 194G. (Not A vailablc for free distribution.)
No. 101. De\·elopment of a Cold Cathode Ion Source for a M<Jss Spectrometer Type Vacuum Leak Detector. Hamid A. Thomas. 1947.
*No. 102. PreYiew of Engineering. J. G. McGuire. 1947.
No. 10:3. Second Annual Short Course on Inst1·umentation fo1· the Process Industries. 19,17. ( K ot available fo1· free distribution.)
No. 104. Proceedings of the Second ShOJt Conn;'• and ConfcrccJcc•, Ai1·port Management and Planning. 1947.
No. lOG. Proceedings of the Twenty-Second Annual Short CourR(' in Highway Enginc•c1·ing. 1948.
80
No. 106.
No. 107.
No. 108.
No. 109.
No. 110.
No. 111.
TESTING ASPHALTIC CoNCRETE
Proceedings of the First Annual Management Engineering Conference. 1948.
Essential Oil Production in Texas. II. Sweet Goldenrod. Bryant R. Holland, P. R. Johnson, J. H. Sorrels. 1948.
A Comparison of Freight Rates and Estimated Weights on Carrots, Carload. Jean D. Neal and W. B. Langford. 1948.
Proceedings of the Third Short Course and Conference. Airport Management and Planning. 1948.
Proceedings of the Fourth Annual Air Conditioning Conference. 1948.
Third Annual Short Course on Instrumentation for the Process Industries. 1948. (Not available for free distribution.)
No. 112. Proceedings of the Twenty-Third Annual Short Course in Highway Engineering. 1949.
No. 113. Flow Characteristics of Gas Lift in Oil Production. S. F. Shaw. 1949.
No. 114. Phase Relationships in Oil and Gas Reservoirs. Donald M. Katz. 1949.
No. 115. Basic Models for Technical D1·awing. J. G. McGuire, R. L. Barton, P. M. Mason. 1940.
No. 116. Highway Loads and Their Effects on Highway Structures Based on Traffic Data of 1!112. Henson K. Stephenson and A. A. J akkula. 1950.
No. 117. Annotated Bibliography on Channelization and Helated Problems of Highway Traffic Engineering. B. F. K. Mullins. 1950.
No. 118. Some Aspects of the Prob:em 0f Transporting Fresh Vegetables from Texas. W. B. Langford and Jean D. Neal. 1950.
No. 119. Significance of Tests for Asphaltic Materials. Marshall Brown and Fred J. Benson. 1950.
*No. 120. Fourth Annual Short Course on Instrumentation for the Process Industries. 1949. (Not a ntilable for free distribution.)
No. 121. Solvent Extraction of Cottonseed Oil With Isopropanol. W. D. Harris. 1950.
No. 122. Hesearch Activities 1948-49 and 1949-50. Texas Engineering Experiment Station and School of Engineering, A. and M. College of Texas. 1950.
No. 12a. Sewage Purification by Rock Filters. The Performance of Standard-Rate Trickling Filters. J. H. Sorrels and P. J. A. Zeller. 1951.
No. 124. Lime Stabilization of Clay Soil. Bob M. Gallaway and Spencer J. Buchanan. 1951.
TESTING ASPHALTIC CONCRETE 81
No. 125. Solvent Extn;ction of Oil from Cottonseed Prior to Removal of Lmters and Treatment of th R 'd the Sep t' f M 1 < • e esl ue to Effect _ara IOn o ea , Hulls, and Unters. S p Cl ·k . d Cec1l Wamble. 1951. · · aJ an A.
Appraisal of Several Methods of Testing Asphalt' c . Fred J. Benson. 1952. ' < lC one1 ete.
No. 126.
t .~h:h T~xds ~r:gfndeering Experiment Station was established in 1914 •
0 m. e 1.~ us :·~a evel_opment of Texas by investigating engineerin an~ ~nd~.stual PIObl_ems, md:pendently and in cooperation with other: an o 1ssemmate mformabon relating to such problems. '
. Individuals ~nd corpora~ior:s who have problems in which the station m1ght be of ass1stance are mntcd to communicate with the director.
Address inquiries and requests for publications to the TEXAS ENGIKEERI~G EXPERil\IE~T STATION
The Texas A. and M. College System College Station, Texas
*Supply Exhausted