Embed Size (px)
Citation preview
Applying a Maturity Model during a SoftwareEngineering Course - Experiences and
RecommendationsAndreas Bollin, Elisa Reci
Institute of Informatics-DidacticsAlpen-Adria-Universitat Klagenfurt
Klagenfurt, AustriaAndreas.Bollin|[email protected]
Csaba Szabo, Veronika SzaboovaDepartment of Computers and Informatics
Technical University KosiceKosice, Slovakia
Csaba.Szabo|[email protected]
Rudolf SiebenhoferSieITMCi
Siebenhofer. Consulting e.USteyr, Austria
Abstract—In industry, the benefit of maturity models is un-contested, and models like CMMI are normally taught in atleast advanced Software Engineering courses. However, whennot being part of real-world projects, the added values aredifficult to be experienced on first hand by our students. Inthis paper we report on a study and teaching approach where,in three successive semesters and at two different institutions,we started rating the process-maturity of students solving tasksin our software engineering courses and transparently relatedthe maturity levels to the task performances. It turned outthat there is a non-negligible correlation between the individualprocess maturity and performances. Considering this finding,the approach might yield to students’ process-improvement stepsduring our courses, help in fostering the understanding of theterm process maturity, and finally, also might help in improvingthe overall students’ performances.
I. INTRODUCTION
In a special issue of IEEE’s the institute on the state ofengineering worldwide, Kathy Pretz, editor in chief, starts witha quite emotional foreword. She also states that ”today’s high-tech companies can’t find enough skilled engineering gradsand workers, while universities and employers are struggling tokeep up with the advances in technology” [1]. While graduatesand workers are constantly confronted with acquiring newknowledge, keeping up the quality of courses (and the coursecontent) seems to be one of the challenges for educators.
There are a lot of factors contributing to high qualitylectures. One starting point could be the OECD-IMHE projectand the report on the quality of teaching in higher education[2]. Another strategy could be to improve the learning outcomeby dealing with group formation problems [3] or by flippingthe classroom [4] (just to mention two of the many), butone key issue is that teaching can also be seen as a process(or even better: as a set of related processes) involving theeducators, the environment and the learner [5]. However, thenotion of a process is not always seen by educators (evenso by the learners) and key ideas stemming from the fieldof maturity models (e.g. measurement steps, quality improve-ment, or generic/specific practices to be followed) are quiteoften underestimated or neglected. In order to come up with
a maturity model for teaching that is finally accepted by allstakeholders, relevant practices and goals have to be identified... and validated, which is now done in Klagenfurt step by stepfor several practices and goals [6]. This contribution can beseen as part of a larger effort in identifying (and measuring theimpact of) practices and in the presented study we are lookingat task solving best practices in our software engineeringlaboratory classes.
The objectives of this paper are twofold. At first, we wantto show up ways in improving the outcomes of (softwareengineering) lectures. To begin with, we do this by borrowingpractices from CMMI, and by looking at those factors thatcontribute to the students’ performances during our classes.Secondly, we want to foster the idea of treating teachingas a process that can be positively influenced by educatorsand learners. We do this by demonstrating how easy it is tomeasure at least sub-processes and by showing the significanceof process maturity on the final outcome or grades during acourse. For this, in 2016, we defined a maturity frameworkand started a small experiment with 32 students that wasthen repeated with 140 students in Kosice, and lately with22 students again from Klagenfurt.
The paper is structured as follows. Section II summarizesrelated work in the field of maturity models and education.Section III presents the structure, details and results of thestudy. Then, section IV reflects on the findings but also threatsto validity, and section V concludes the paper with a summaryof the findings and future work.
II. RELATED WORK
In the year 1993, members from industry, government andthe Software Engineering Institute (SEI) worked together andcreated an institutionalized and stable model named CMM(Capability Maturity Model) [7]. The model served as a basisfor improving the quality of software processes. Later, SEIpresented the integrated version called CMMI (Capability Ma-turity Model Integration), addressing the quality of a softwareprocess in terms of Capability and Maturity levels.
The CMMI model has already served as a framework forcreating Capability Maturity models in the educational field.Chen et al. [5] present a capability maturity model whichfocuses on improving the teaching process for teachers inhigher education. Their model is called Teaching CapabilityMaturity Model (T-CMM) and it is still under development.In Klagenfurt, we are working on a similar model (borrowingfrom CMMI-Services), called TeaM-Model [6], but we are alsoincluding primary and secondary school teachers. The modelis also work in progress and currently we are identifying andevaluating first specific and generic practices.
Higher education organizations adapt the CMMI modelbased on their needs for the improvement of the organizationor the syllabus [8],[9],[10], too. However, those models alladdress the maturity of the organization or the syllabus inhigher education. Many other examples address the coursedesign in higher education either in a classroom environment[11] or in online courses design (that would be CMMI in e-learning) [12], [13], [14].
There are also some CMMI-like implementation models forprimary and secondary education. Nevertheless, they focuseither on the organizational level or on the syllabus, but theydo not consider the teachers and their teaching process issue[15], [16], [17].
To summarize, apart from the T-CMM and TeaM models,other approaches either address the maturity on the organi-zational or on the curricular level. But, to the best of ourknowledge, none of them takes a closer look at the differenteffects of the necessary practices (that are part of teachingprocesses for teachers and learners).
III. THE STUDY
In order to find out more about the influence of differentteaching practices in software engineering, we decided to makeuse of lecture units that are part of standard software engi-neering courses at both institutions, the Technical UniversityKosice and the Alpen-Adria-Universitat Klagenfurt. The unitsare using the AMEISE framework [18] to address topics likeprocess models, software quality and project management. Asthe AMEISE-related part of the lecture (the lab part) is inuse since 2003 without major changes, there is the advantageof a rich set of data (baseline) concerning the performanceand outcome of the learners, and the teaching skills of theeducators. It also has the advantage that the design of thislecture-part is comparable to other practical classes (or labs)at our universities, and we assume that the five factors (seebelow) that we started to observe in this study are importantfor the other lectures, too.
A. The TeaM Model Context
Even though the TeaM Model is not in the focus of thiswork, we are nevertheless looking at some of its practices. Italso is related to some of our recommendations at the end ofthis work, so that it makes sense to take a closer look at themodel first.
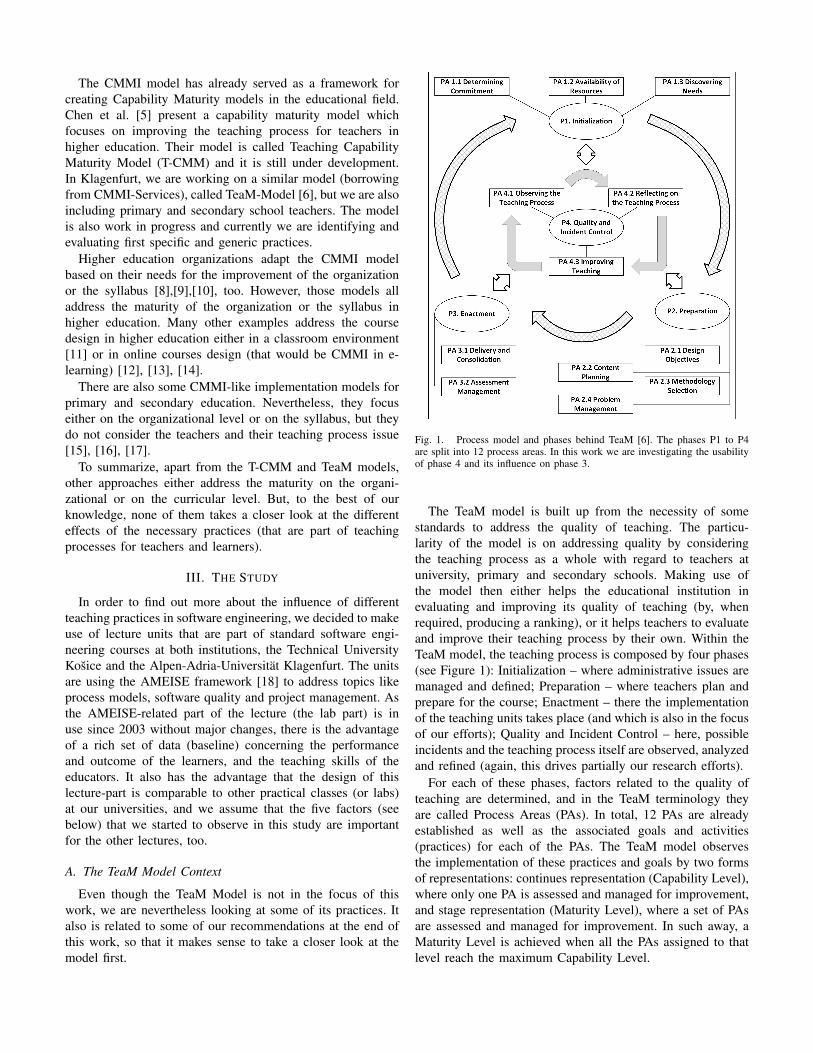
Fig. 1. Process model and phases behind TeaM [6]. The phases P1 to P4are split into 12 process areas. In this work we are investigating the usabilityof phase 4 and its influence on phase 3.
The TeaM model is built up from the necessity of somestandards to address the quality of teaching. The particu-larity of the model is on addressing quality by consideringthe teaching process as a whole with regard to teachers atuniversity, primary and secondary schools. Making use ofthe model then either helps the educational institution inevaluating and improving its quality of teaching (by, whenrequired, producing a ranking), or it helps teachers to evaluateand improve their teaching process by their own. Within theTeaM model, the teaching process is composed by four phases(see Figure 1): Initialization – where administrative issues aremanaged and defined; Preparation – where teachers plan andprepare for the course; Enactment – there the implementationof the teaching units takes place (and which is also in the focusof our efforts); Quality and Incident Control – here, possibleincidents and the teaching process itself are observed, analyzedand refined (again, this drives partially our research efforts).
For each of these phases, factors related to the quality ofteaching are determined, and in the TeaM terminology theyare called Process Areas (PAs). In total, 12 PAs are alreadyestablished as well as the associated goals and activities(practices) for each of the PAs. The TeaM model observesthe implementation of these practices and goals by two formsof representations: continues representation (Capability Level),where only one PA is assessed and managed for improvement,and stage representation (Maturity Level), where a set of PAsare assessed and managed for improvement. In such away, aMaturity Level is achieved when all the PAs assigned to thatlevel reach the maximum Capability Level.

A detail description of the TeaM model can be found atthe website1 of the TeaM project. However, for the scopeof this work it is just important to know that, firstly, weare conducting this study to learn more about the effects ofpractices as defined in phases 3 and 4, and secondly, we arecollecting experience when applying the model to our ownlectures.
B. Simplified Task-solving Maturity Model
Together with an internationally experienced CMMI expert(one of the co-authors), we developed a simple model forestimating the maturity of a task-solving process (in order toadd further evidence to the TeaM model described above).The selection of the different observation factors was drivenby a book from Tom DeMarco et al. about patterns of projectbehavior [19]. And, it was based on some assumptions thatwe wanted to validate for an educational setting. To bemore precise here, our industrial software development projectexperiences show that the environmental setting and teamfactors have high influence on the results of the achievedproject metrics. Also, planning discipline and especially theupdates of the planning are important. The right speed is alsoseen as an important factor, as this implies that the team takesenough time for facts based discussion but does not spendtime in ”endless” discussions. So, to begin with, our modelconsists of the following five dimensions (being mapped tothe educational context):
• Environmental Setup. Here, we assess how well thestudents are customizing their environment (and how wellthey adjust to the environment). We look at the seatingarrangement, the use of technical equipment, the use ofplanning boards, and whether they are largely working inteams or more as individuals.
• Planning. Here, we assess how well the students areprepared for the task. We look at their plans (if any andtheir granularity), if they make notes (how) and whetherthey keep their plans up to date or not.
• Speed. From a baseline of more than thousand tasksolution strategies (within the context of our lectures) weextracted the average time that former (successful) teamsspent on the (same) tasks. This dimension assesses, fortwo measure points during the task, if the working speedseems to be reasonable, meaning comparable to othersuccessful groups, or not.
• Discussion. Here, we assess how intense the students arediscussing their actions. We look for leaders, analysisdiscussions, and on which basis decisions are taken(chaotic, fast, fact-based).
• Mood. This dimension looks at the attitude and sentimentof the students. Are they humorous, do they laugh, arethey engages and active, or are they bored or anxious.
These dimension are assessed separately by making use ofa standardized observation sheet (a small example including
1See the TeaM Model Project page for access to the raw data:http://iid.aau.at/bin/view/Main/Projects.
Fig. 2. Original observation sheet that we used for our simplified task solvingmaturity model (in German). You can see the first dimension (”1) SETUP”)with characteristics (”Merkmale/Beobachtungen”) that we specifically werelooking for, and the points received (”Bewertung/Kommentare”). The group”02” organized their environment as a team, was using several computers, theyhad a common planning board and they also worked together as a team. Theassessor valued that facette with 10 points. You also see part of the planningdimension (”2) PLANUNG”). There, the assessor stated that the group wasonly using a simple AMEISE-Excel sheet for the planning, but it did not useMS Project or Libre-Office – which are also learning goals of the lecture.
a translation to English can be seen in Figure 2) and on theform the observations are mapped to a scale between 1 and10 points (where 10 points means the fulfilment of all positivecharacteristics). Finally, the points are summed up, leading tomaturity points between 5 and 50. It would have been possibleto weight the dimensions, but for reasons of simplicity wedecided to treat every dimension the same.
In this section we now present the setting of the study. Thegenerated statistics are also included, however, for reasons ofspace we have to refer to the TeaM project page (see above)for downloading the raw data used for calculating the statisticsand scatter-plots.
C. Research Objectives
Having the above described maturity model in mind, wedecided to conduct a study in order to answer the question, if amaturity model can also be applied to our software engineeringcourses. For this, the following two questions needed to beanswered:
• Is there a correlation between the maturity points and theoverall performance in the course?
• How strong is the influence of the selected five differentdimensions on each other and on the overall lab-courseperformance?
As a side-effect we also hoped that the findings help inconvincing our students that maturity models are useful. Thus,a follow-up question was
• Is the model perceived useful and did the students makeuse of the findings in their project work?
The simple model introduced above comes with two as-sumptions. Firstly, we assume that the overall performance in
the lab-course is mainly driven by the fulfilment of the tasksduring the lab-course, and the final examination and/or gradingis related to the tasks. Secondly, we are aware of the factthat there are many more factors and dimensions that, whenconsidered, lead to good course results and, additionally, leadto good grades at the end of a course. However, we assume thatthe above mentioned dimensions (borrowed from the field ofCMMI-DEV, Product Development) are, among those that areeasy to observe and to rate by an educator, the most importantones. Dimensions might be added (or removed) later on.
As mentioned above, we tried to improve the learning out-come of our lectures. In fact, in all of our lectures, the learninggoals focus on software engineering and software project man-agement skills. This includes understanding and working withprocess and maturity models, using quality assurance activitiesduring a software project, planning (developers, schedule,costs, quality) and managing software projects (including toolsupport). The advantage of the AMEISE framework [18] isthat it covers nearly all the topics (except the use of planningtools) for the simulated software project, and that it returnsan assessment report containing percentage values for theachievement of the different project goals. At the end ofthe lecture we combine these results with an assessment ofdocuments (project plans) handed in by the students duringthe course.
D. Setting
In order to find out whether our model works or not, wedecided to start a small pre-study involving 36 students (12teams) and one assessor in Klagenfurt in the summer term2016. Then, to avoid a Klagenfurt bias, we repeated the studyin Kosice with 140 students (66 teams) and a different assessorduring the winter term 2016/17. Finally, we looked again at alecture in Klagenfurt with 20 students (8 teams) and ratingsfrom both assessors during the summer term 2017.
We have been choosing lectures making use of the AMEISEenvironment as AMEISE provides the students with resultsof their actions as project manager in form of metrics -especially quality related metrics of their simulated softwaredevelopment. This can be seen as a kind of ”white boxanalysis”.
For the pre-study in Klagenfurt we used two courses thattake place at the beginning and the end of our Mastersprogram in Applied Informatics. In total, 36 students weresplit (randomly) into 12 teams and informed that they aretaking part in a study (without knowing the background. Theywere also asked for permission for being pictured. After someintroduction units, the task of the teams was to plan andprepare for a small-sized (10.000 lines of code) softwaredevelopment project with focus on quality assurance as ahomework. After one week of planning (and handing in amandatory project plan), they had to take over the role of aproject manager and had to conduct the project within theAMEISE simulation environment in our laboratories. Duringthe simulation runs they were observed and assessed accordingto a standard form prepared by our CMMI-expert. After
the simulation runs, the students’ performances were gradedaccording to a fine-granular grading scheme (that is in usenow in Klagenfurt since 2003) yielding points and grades.In a follow-up lecture, the performances of the teams werethoroughly reflected on, and also the background and resultsfrom the study were explained. After that, the teams wereinstructed to repeat the task (planning for a project, conductinga project) and again, at the end, their performances wereassessed and reflected on.
The study in Kosice followed the same course layout, andthe student teams had to fulfil the same tasks as in Klagenfurt.They were also informed about being part of a study and askedfor their permission of being pictured. However, due to thelarge number of teams (and the availability of the lab rooms),the simulation runs took place in Kosice on three successivedays, and in most cases the students worked together in teamsof two. Again, during the lab classes, the teams were observed,assessed according to our standard form, and afterwards theirperformance was evaluated based on the Klagenfurt’s gradingscheme.
The last part of our study took again place in Klagenfurtand followed the same pattern. The same tasks had to befulfilled by the students (randomly assigned to teams of 2to 3 students), but this time two assessors observed the teamsduring their work independently. This was done to find outwhether the assessment form that we were using helps inavoiding an assessor’s bias in the rating.
After that, all the data (group assignments, assessment data,performance data) was collected using Microsoft Excel, andstatistical tests were used to identify potential correlations. Thefollowing section briefly summarizes the tools that we used.
E. Statistics
Within the scope of this contribution four different statisticaltests were used to assess the data: the Shapiro-Wilk parametrichypothesis test, the Pearson’s Correlation Coefficient, theSpearman’s Rank Correlation Coefficient, and Kendall’s TauCorrelation Coefficient.
Assessing the assumption of normality is required by moststatistical procedures, e.g. the linear regression analysis thatwe are using. When the normality assumption is violated,interpretation and inferences may not be reliable or valid.According to Razali and Wah [20], the Shapiro-Wilk test(SW ) belongs to the most powerful normality tests available.
The Pearson’s correlation coefficient Rho (RP ) measuresthe degree of association between the variables, assumingnormal distribution of the values [21, p. 212]. Though this testmight not necessarily fail when the data is not normally dis-tributed, the Pearson’s test only looks for a linear correlation.It might indicate no correlation even if the data is correlatedin a non-linear manner.
As we will see in the remaining section, not all data isnormally distributed. To handle this case the Spearman’s rankcorrelation coefficient Rho (RS) has been chosen [21, p. 219].It is a non-parametric test of correlation and assesses how well
a monotonic function describes the association between thevariables. This is done by ranking the sample data separatelyfor each variable.
Finally, Kendall’s robust correlation coefficient Rho (RK)can be used as an alternative to the Spearman’s test [22,p. 200]. It is also non-parametric and investigates the relation-ship among pairs of data. However, it ranks the data relativelyand is able to identify partial correlations.
When there is no likelihood of confusion, then R will beused to refer to either RP , RS or RK .
In the remainder of this work the correlation R is interpretedas follows:
• When |R| ∈ [0.7, 1.0] it is interpreted to indicate a strongassociation.
• When |R| ∈ [0.4, 0.7) it is interpreted to indicate amedium association.
• When |R| ∈ [0.0, 0.4) it is interpreted to indicate a weakassociation.
In addition to the values of the correlation R, also thesignificance level (p) of the value is provided (checking, withinthe scope of the null hypothesis, that the probability of thevalue of R is bigger or equal to the observed value of R). Thevalues in the following tables are rounded to the third decimalplace (which means that a value of p = 0.0005 would becomep = 0.001).
F. Results
After the course, the assessment reports of the two assessorswere collected and the ratings were checked and verifiedagainst the pictures that were taken during the courses. Finally,the ratings and the performance points/grades were recordedelectronically. Matlab R2007b was used for testing for nor-mality and the correlations.
Looking at the five different dimensions, the normality testsdo not indicate normal distribution. Looking at the maturitypoints, the test indicates that the sample has been drawn froma normal distribution with a mean of 37.702 and a variance of14.573. This confirms that the selection of different correlationtests makes sense. We are looking for linear, non-linear andeven partial correlation in the data.
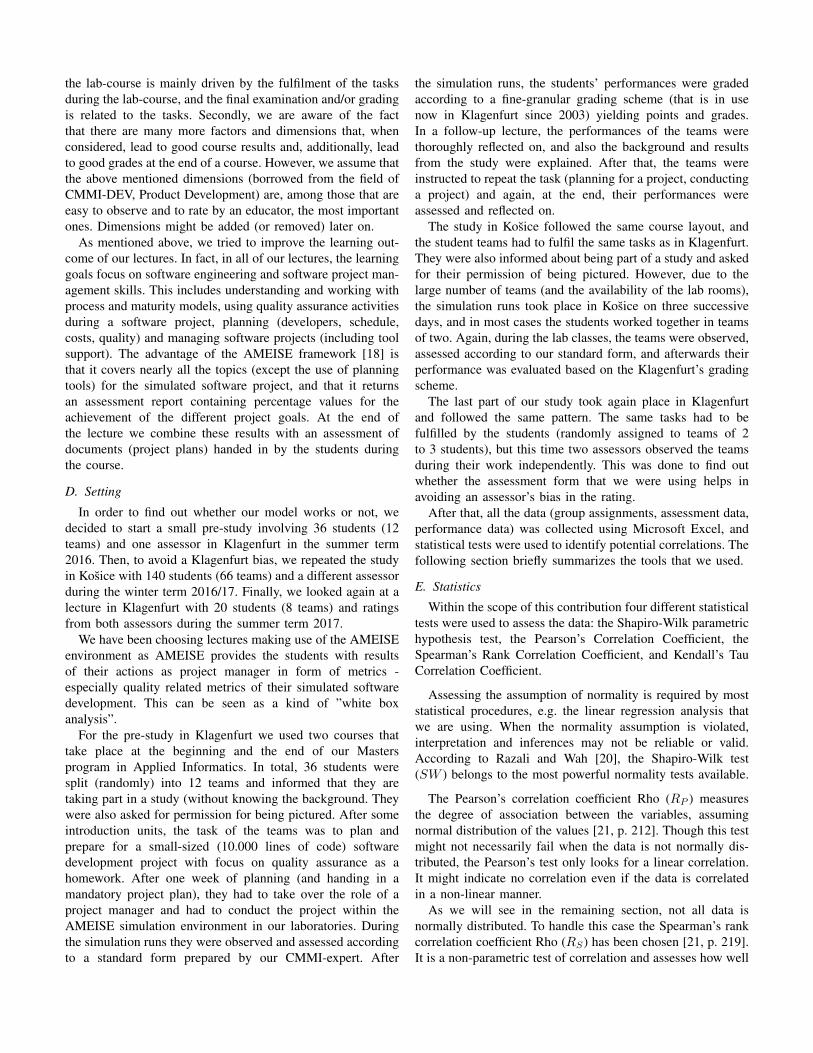
In a first step, scatter plots were produced to visualize pos-sible relations between the different dimensions and to get afeeling about how well the resulting dimensions are associatedto each other. One of our assumptions (and also assumptions inother maturity models) was that the environmental setup hasa major impact on the overall performance. Figure 3 showsa scatter plot where, on the x-axis, we assigned the points(from 1 to 10) for the environmental setup and on the y axiswe assigned the points (on a scale between 0 and 200) forthe students’ overall performances. The plot indicates somepositive relation. When looking at the planning dimension weget a quite similar plot (see Figure 4).
Another assumption was that the working speed (also indi-cating how well students are prepared for a task) has a majorimpact on the overall performance. However, when looking
Fig. 3. Scatter-plot for visualizing the correlation between the environmentalsetup dimension and the course performance/grading. (n = 84)
Fig. 4. Scatter-plot for visualizing the correlation between the planning leveland the course performance/grading. (n = 84)
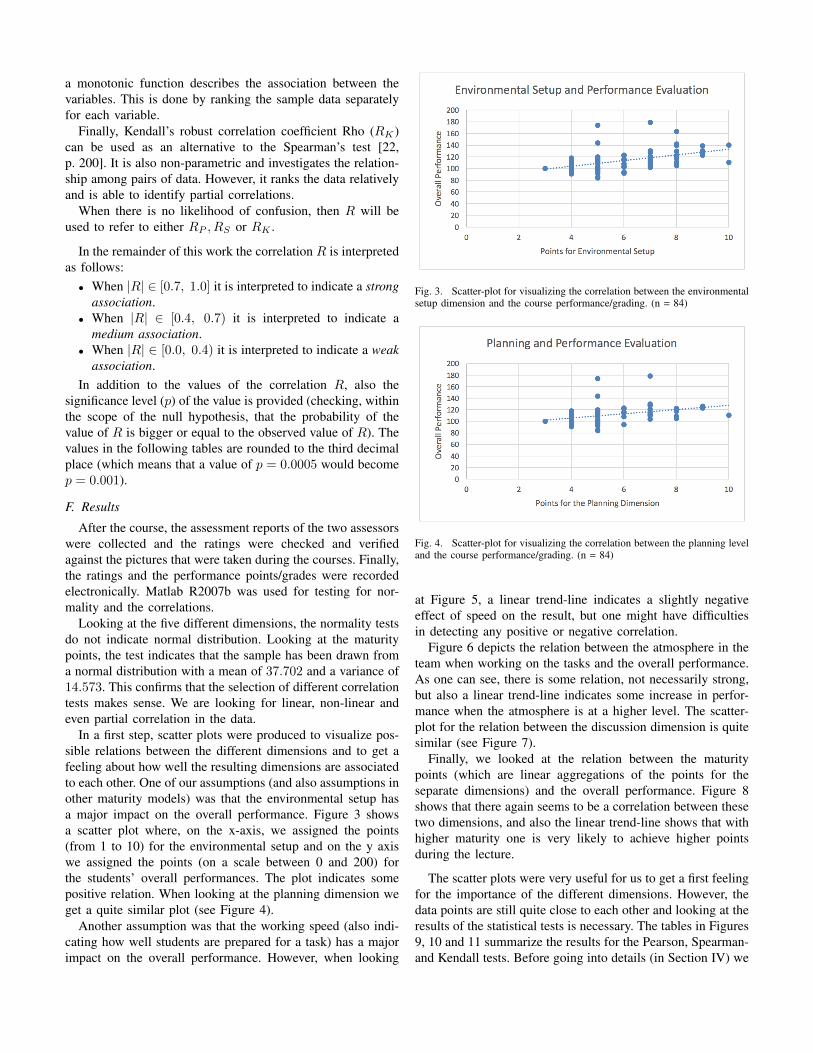
at Figure 5, a linear trend-line indicates a slightly negativeeffect of speed on the result, but one might have difficultiesin detecting any positive or negative correlation.
Figure 6 depicts the relation between the atmosphere in theteam when working on the tasks and the overall performance.As one can see, there is some relation, not necessarily strong,but also a linear trend-line indicates some increase in perfor-mance when the atmosphere is at a higher level. The scatter-plot for the relation between the discussion dimension is quitesimilar (see Figure 7).
Finally, we looked at the relation between the maturitypoints (which are linear aggregations of the points for theseparate dimensions) and the overall performance. Figure 8shows that there again seems to be a correlation between thesetwo dimensions, and also the linear trend-line shows that withhigher maturity one is very likely to achieve higher pointsduring the lecture.
The scatter plots were very useful for us to get a first feelingfor the importance of the different dimensions. However, thedata points are still quite close to each other and looking at theresults of the statistical tests is necessary. The tables in Figures9, 10 and 11 summarize the results for the Pearson, Spearman-and Kendall tests. Before going into details (in Section IV) we
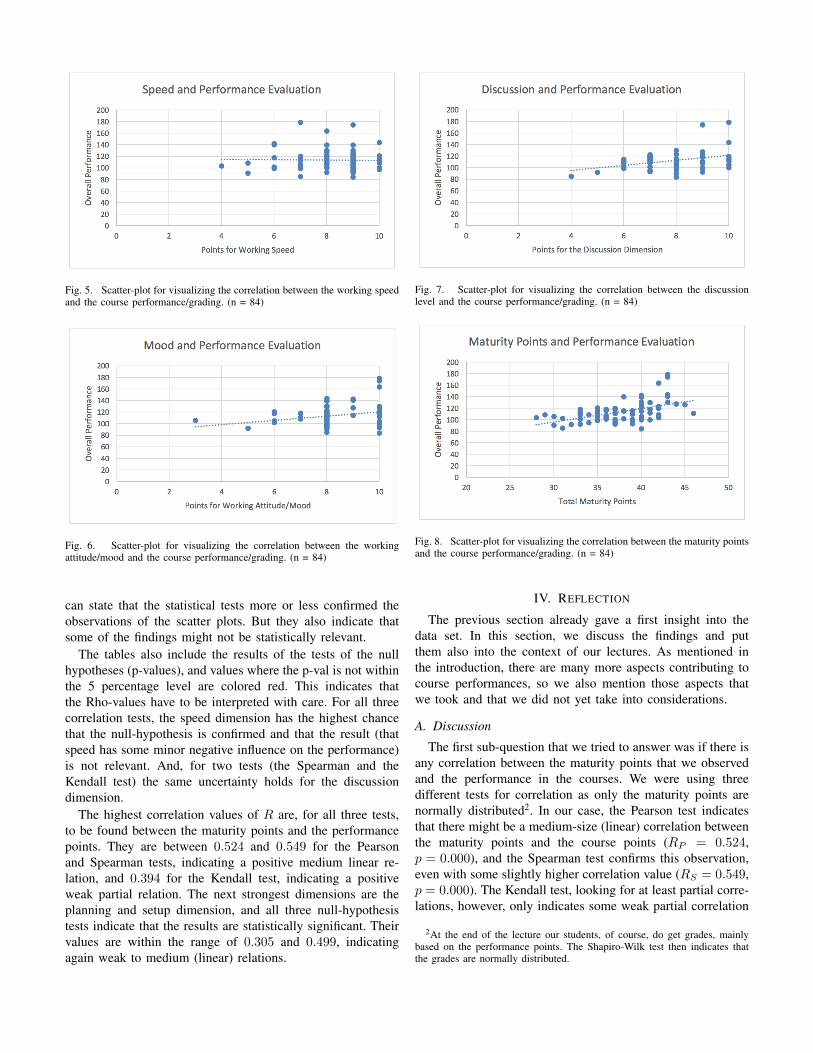
Fig. 5. Scatter-plot for visualizing the correlation between the working speedand the course performance/grading. (n = 84)
Fig. 6. Scatter-plot for visualizing the correlation between the workingattitude/mood and the course performance/grading. (n = 84)
can state that the statistical tests more or less confirmed theobservations of the scatter plots. But they also indicate thatsome of the findings might not be statistically relevant.
The tables also include the results of the tests of the nullhypotheses (p-values), and values where the p-val is not withinthe 5 percentage level are colored red. This indicates thatthe Rho-values have to be interpreted with care. For all threecorrelation tests, the speed dimension has the highest chancethat the null-hypothesis is confirmed and that the result (thatspeed has some minor negative influence on the performance)is not relevant. And, for two tests (the Spearman and theKendall test) the same uncertainty holds for the discussiondimension.
The highest correlation values of R are, for all three tests,to be found between the maturity points and the performancepoints. They are between 0.524 and 0.549 for the Pearsonand Spearman tests, indicating a positive medium linear re-lation, and 0.394 for the Kendall test, indicating a positiveweak partial relation. The next strongest dimensions are theplanning and setup dimension, and all three null-hypothesistests indicate that the results are statistically significant. Theirvalues are within the range of 0.305 and 0.499, indicatingagain weak to medium (linear) relations.
Fig. 7. Scatter-plot for visualizing the correlation between the discussionlevel and the course performance/grading. (n = 84)
Fig. 8. Scatter-plot for visualizing the correlation between the maturity pointsand the course performance/grading. (n = 84)
IV. REFLECTION
The previous section already gave a first insight into thedata set. In this section, we discuss the findings and putthem also into the context of our lectures. As mentioned inthe introduction, there are many more aspects contributing tocourse performances, so we also mention those aspects thatwe took and that we did not yet take into considerations.
A. Discussion
The first sub-question that we tried to answer was if there isany correlation between the maturity points that we observedand the performance in the courses. We were using threedifferent tests for correlation as only the maturity points arenormally distributed2. In our case, the Pearson test indicatesthat there might be a medium-size (linear) correlation betweenthe maturity points and the course points (RP = 0.524,p = 0.000), and the Spearman test confirms this observation,even with some slightly higher correlation value (RS = 0.549,p = 0.000). The Kendall test, looking for at least partial corre-lations, however, only indicates some weak partial correlation
2At the end of the lecture our students, of course, do get grades, mainlybased on the performance points. The Shapiro-Wilk test then indicates thatthe grades are normally distributed.
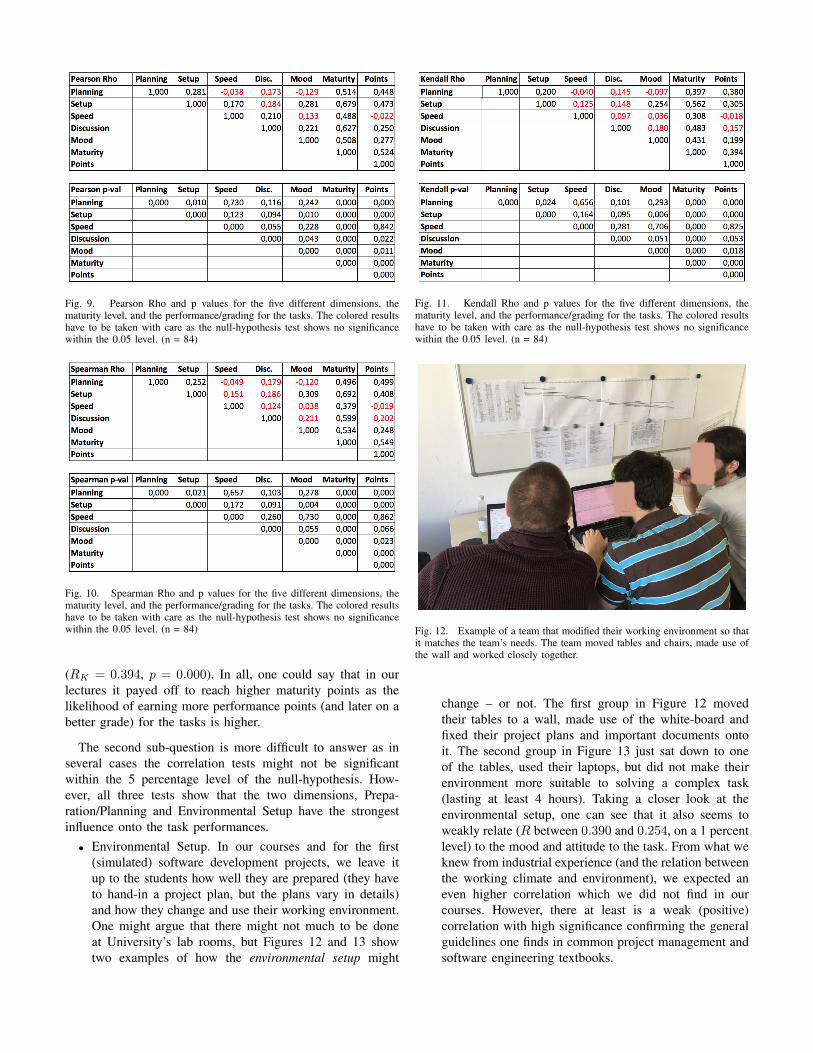
Fig. 9. Pearson Rho and p values for the five different dimensions, thematurity level, and the performance/grading for the tasks. The colored resultshave to be taken with care as the null-hypothesis test shows no significancewithin the 0.05 level. (n = 84)
Fig. 10. Spearman Rho and p values for the five different dimensions, thematurity level, and the performance/grading for the tasks. The colored resultshave to be taken with care as the null-hypothesis test shows no significancewithin the 0.05 level. (n = 84)
(RK = 0.394, p = 0.000). In all, one could say that in ourlectures it payed off to reach higher maturity points as thelikelihood of earning more performance points (and later on abetter grade) for the tasks is higher.
The second sub-question is more difficult to answer as inseveral cases the correlation tests might not be significantwithin the 5 percentage level of the null-hypothesis. How-ever, all three tests show that the two dimensions, Prepa-ration/Planning and Environmental Setup have the strongestinfluence onto the task performances.
• Environmental Setup. In our courses and for the first(simulated) software development projects, we leave itup to the students how well they are prepared (they haveto hand-in a project plan, but the plans vary in details)and how they change and use their working environment.One might argue that there might not much to be doneat University’s lab rooms, but Figures 12 and 13 showtwo examples of how the environmental setup might
Fig. 11. Kendall Rho and p values for the five different dimensions, thematurity level, and the performance/grading for the tasks. The colored resultshave to be taken with care as the null-hypothesis test shows no significancewithin the 0.05 level. (n = 84)
Fig. 12. Example of a team that modified their working environment so thatit matches the team’s needs. The team moved tables and chairs, made use ofthe wall and worked closely together.
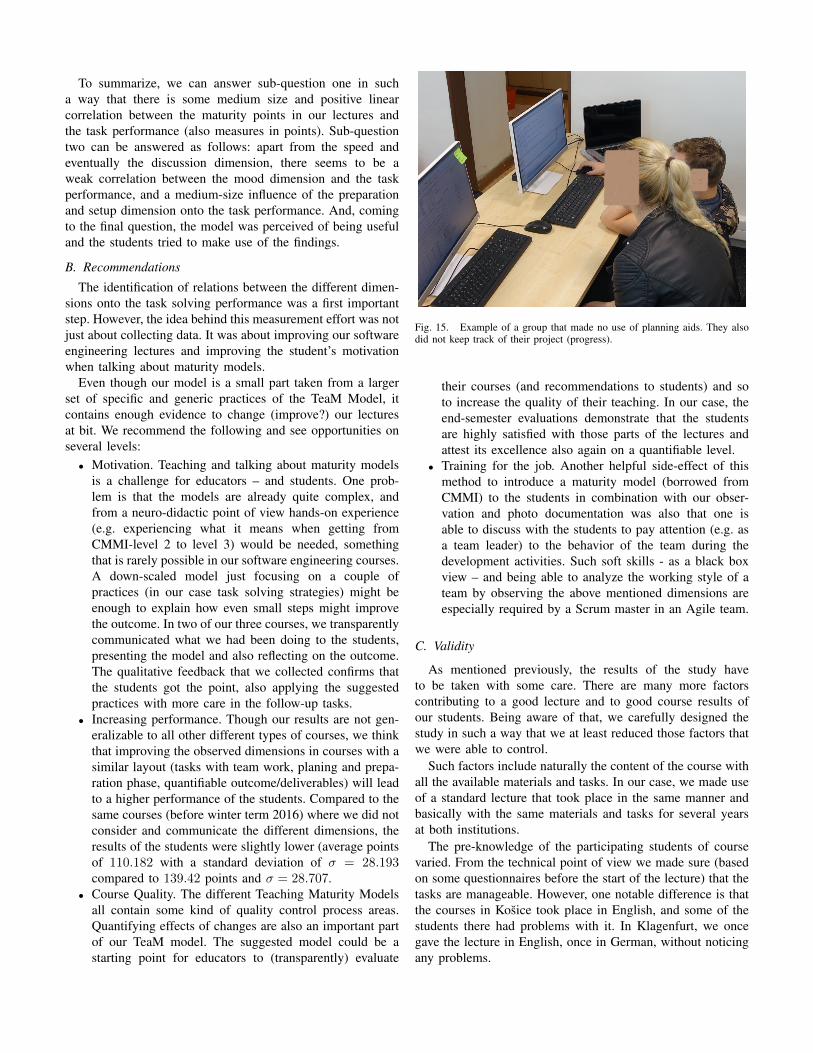
change – or not. The first group in Figure 12 movedtheir tables to a wall, made use of the white-board andfixed their project plans and important documents ontoit. The second group in Figure 13 just sat down to oneof the tables, used their laptops, but did not make theirenvironment more suitable to solving a complex task(lasting at least 4 hours). Taking a closer look at theenvironmental setup, one can see that it also seems toweakly relate (R between 0.390 and 0.254, on a 1 percentlevel) to the mood and attitude to the task. From what weknew from industrial experience (and the relation betweenthe working climate and environment), we expected aneven higher correlation which we did not find in ourcourses. However, there at least is a weak (positive)correlation with high significance confirming the generalguidelines one finds in common project management andsoftware engineering textbooks.
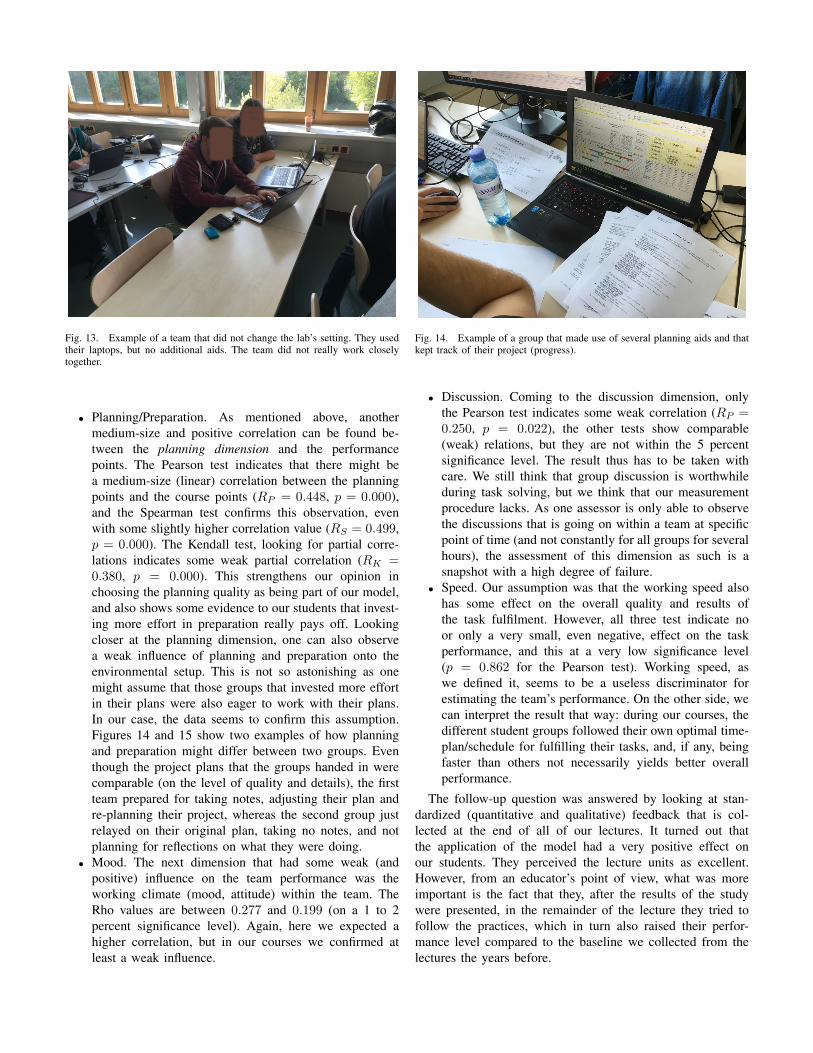
Fig. 13. Example of a team that did not change the lab’s setting. They usedtheir laptops, but no additional aids. The team did not really work closelytogether.
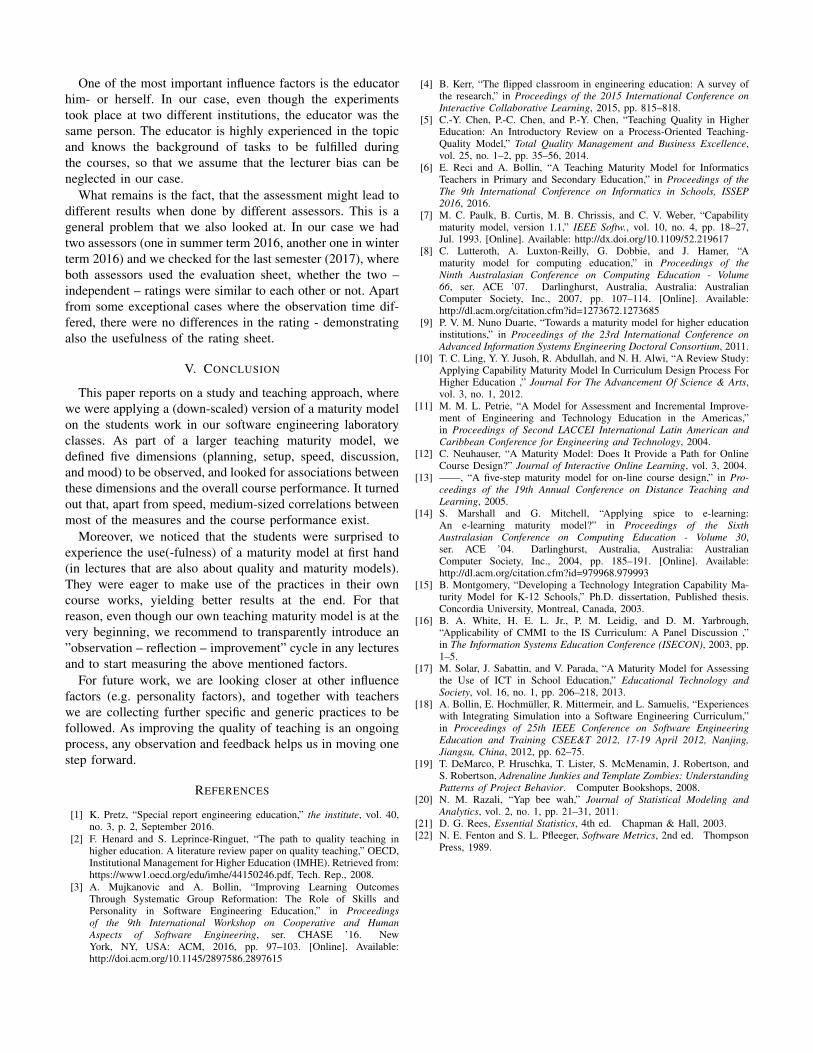
• Planning/Preparation. As mentioned above, anothermedium-size and positive correlation can be found be-tween the planning dimension and the performancepoints. The Pearson test indicates that there might bea medium-size (linear) correlation between the planningpoints and the course points (RP = 0.448, p = 0.000),and the Spearman test confirms this observation, evenwith some slightly higher correlation value (RS = 0.499,p = 0.000). The Kendall test, looking for partial corre-lations indicates some weak partial correlation (RK =0.380, p = 0.000). This strengthens our opinion inchoosing the planning quality as being part of our model,and also shows some evidence to our students that invest-ing more effort in preparation really pays off. Lookingcloser at the planning dimension, one can also observea weak influence of planning and preparation onto theenvironmental setup. This is not so astonishing as onemight assume that those groups that invested more effortin their plans were also eager to work with their plans.In our case, the data seems to confirm this assumption.Figures 14 and 15 show two examples of how planningand preparation might differ between two groups. Eventhough the project plans that the groups handed in werecomparable (on the level of quality and details), the firstteam prepared for taking notes, adjusting their plan andre-planning their project, whereas the second group justrelayed on their original plan, taking no notes, and notplanning for reflections on what they were doing.
• Mood. The next dimension that had some weak (andpositive) influence on the team performance was theworking climate (mood, attitude) within the team. TheRho values are between 0.277 and 0.199 (on a 1 to 2percent significance level). Again, here we expected ahigher correlation, but in our courses we confirmed atleast a weak influence.
Fig. 14. Example of a group that made use of several planning aids and thatkept track of their project (progress).
• Discussion. Coming to the discussion dimension, onlythe Pearson test indicates some weak correlation (RP =0.250, p = 0.022), the other tests show comparable(weak) relations, but they are not within the 5 percentsignificance level. The result thus has to be taken withcare. We still think that group discussion is worthwhileduring task solving, but we think that our measurementprocedure lacks. As one assessor is only able to observethe discussions that is going on within a team at specificpoint of time (and not constantly for all groups for severalhours), the assessment of this dimension as such is asnapshot with a high degree of failure.
• Speed. Our assumption was that the working speed alsohas some effect on the overall quality and results ofthe task fulfilment. However, all three test indicate noor only a very small, even negative, effect on the taskperformance, and this at a very low significance level(p = 0.862 for the Pearson test). Working speed, aswe defined it, seems to be a useless discriminator forestimating the team’s performance. On the other side, wecan interpret the result that way: during our courses, thedifferent student groups followed their own optimal time-plan/schedule for fulfilling their tasks, and, if any, beingfaster than others not necessarily yields better overallperformance.
The follow-up question was answered by looking at stan-dardized (quantitative and qualitative) feedback that is col-lected at the end of all of our lectures. It turned out thatthe application of the model had a very positive effect onour students. They perceived the lecture units as excellent.However, from an educator’s point of view, what was moreimportant is the fact that they, after the results of the studywere presented, in the remainder of the lecture they tried tofollow the practices, which in turn also raised their perfor-mance level compared to the baseline we collected from thelectures the years before.
To summarize, we can answer sub-question one in sucha way that there is some medium size and positive linearcorrelation between the maturity points in our lectures andthe task performance (also measures in points). Sub-questiontwo can be answered as follows: apart from the speed andeventually the discussion dimension, there seems to be aweak correlation between the mood dimension and the taskperformance, and a medium-size influence of the preparationand setup dimension onto the task performance. And, comingto the final question, the model was perceived of being usefuland the students tried to make use of the findings.
B. Recommendations
The identification of relations between the different dimen-sions onto the task solving performance was a first importantstep. However, the idea behind this measurement effort was notjust about collecting data. It was about improving our softwareengineering lectures and improving the student’s motivationwhen talking about maturity models.
Even though our model is a small part taken from a largerset of specific and generic practices of the TeaM Model, itcontains enough evidence to change (improve?) our lecturesat bit. We recommend the following and see opportunities onseveral levels:
• Motivation. Teaching and talking about maturity modelsis a challenge for educators – and students. One prob-lem is that the models are already quite complex, andfrom a neuro-didactic point of view hands-on experience(e.g. experiencing what it means when getting fromCMMI-level 2 to level 3) would be needed, somethingthat is rarely possible in our software engineering courses.A down-scaled model just focusing on a couple ofpractices (in our case task solving strategies) might beenough to explain how even small steps might improvethe outcome. In two of our three courses, we transparentlycommunicated what we had been doing to the students,presenting the model and also reflecting on the outcome.The qualitative feedback that we collected confirms thatthe students got the point, also applying the suggestedpractices with more care in the follow-up tasks.
• Increasing performance. Though our results are not gen-eralizable to all other different types of courses, we thinkthat improving the observed dimensions in courses with asimilar layout (tasks with team work, planing and prepa-ration phase, quantifiable outcome/deliverables) will leadto a higher performance of the students. Compared to thesame courses (before winter term 2016) where we did notconsider and communicate the different dimensions, theresults of the students were slightly lower (average pointsof 110.182 with a standard deviation of σ = 28.193compared to 139.42 points and σ = 28.707.
• Course Quality. The different Teaching Maturity Modelsall contain some kind of quality control process areas.Quantifying effects of changes are also an important partof our TeaM model. The suggested model could be astarting point for educators to (transparently) evaluate
Fig. 15. Example of a group that made no use of planning aids. They alsodid not keep track of their project (progress).
their courses (and recommendations to students) and soto increase the quality of their teaching. In our case, theend-semester evaluations demonstrate that the studentsare highly satisfied with those parts of the lectures andattest its excellence also again on a quantifiable level.
• Training for the job. Another helpful side-effect of thismethod to introduce a maturity model (borrowed fromCMMI) to the students in combination with our obser-vation and photo documentation was also that one isable to discuss with the students to pay attention (e.g. asa team leader) to the behavior of the team during thedevelopment activities. Such soft skills - as a black boxview – and being able to analyze the working style of ateam by observing the above mentioned dimensions areespecially required by a Scrum master in an Agile team.
C. Validity
As mentioned previously, the results of the study haveto be taken with some care. There are many more factorscontributing to a good lecture and to good course results ofour students. Being aware of that, we carefully designed thestudy in such a way that we at least reduced those factors thatwe were able to control.
Such factors include naturally the content of the course withall the available materials and tasks. In our case, we made useof a standard lecture that took place in the same manner andbasically with the same materials and tasks for several yearsat both institutions.
The pre-knowledge of the participating students of coursevaried. From the technical point of view we made sure (basedon some questionnaires before the start of the lecture) that thetasks are manageable. However, one notable difference is thatthe courses in Kosice took place in English, and some of thestudents there had problems with it. In Klagenfurt, we oncegave the lecture in English, once in German, without noticingany problems.
One of the most important influence factors is the educatorhim- or herself. In our case, even though the experimentstook place at two different institutions, the educator was thesame person. The educator is highly experienced in the topicand knows the background of tasks to be fulfilled duringthe courses, so that we assume that the lecturer bias can beneglected in our case.
What remains is the fact, that the assessment might lead todifferent results when done by different assessors. This is ageneral problem that we also looked at. In our case we hadtwo assessors (one in summer term 2016, another one in winterterm 2016) and we checked for the last semester (2017), whereboth assessors used the evaluation sheet, whether the two –independent – ratings were similar to each other or not. Apartfrom some exceptional cases where the observation time dif-fered, there were no differences in the rating - demonstratingalso the usefulness of the rating sheet.
V. CONCLUSION
This paper reports on a study and teaching approach, wherewe were applying a (down-scaled) version of a maturity modelon the students work in our software engineering laboratoryclasses. As part of a larger teaching maturity model, wedefined five dimensions (planning, setup, speed, discussion,and mood) to be observed, and looked for associations betweenthese dimensions and the overall course performance. It turnedout that, apart from speed, medium-sized correlations betweenmost of the measures and the course performance exist.
Moreover, we noticed that the students were surprised toexperience the use(-fulness) of a maturity model at first hand(in lectures that are also about quality and maturity models).They were eager to make use of the practices in their owncourse works, yielding better results at the end. For thatreason, even though our own teaching maturity model is at thevery beginning, we recommend to transparently introduce an”observation – reflection – improvement” cycle in any lecturesand to start measuring the above mentioned factors.
For future work, we are looking closer at other influencefactors (e.g. personality factors), and together with teacherswe are collecting further specific and generic practices to befollowed. As improving the quality of teaching is an ongoingprocess, any observation and feedback helps us in moving onestep forward.
REFERENCES
[1] K. Pretz, “Special report engineering education,” the institute, vol. 40,no. 3, p. 2, September 2016.
[2] F. Henard and S. Leprince-Ringuet, “The path to quality teaching inhigher education. A literature review paper on quality teaching,” OECD,Institutional Management for Higher Education (IMHE). Retrieved from:https://www1.oecd.org/edu/imhe/44150246.pdf, Tech. Rep., 2008.
[3] A. Mujkanovic and A. Bollin, “Improving Learning OutcomesThrough Systematic Group Reformation: The Role of Skills andPersonality in Software Engineering Education,” in Proceedingsof the 9th International Workshop on Cooperative and HumanAspects of Software Engineering, ser. CHASE ’16. NewYork, NY, USA: ACM, 2016, pp. 97–103. [Online]. Available:http://doi.acm.org/10.1145/2897586.2897615
[4] B. Kerr, “The flipped classroom in engineering education: A survey ofthe research,” in Proceedings of the 2015 International Conference onInteractive Collaborative Learning, 2015, pp. 815–818.
[5] C.-Y. Chen, P.-C. Chen, and P.-Y. Chen, “Teaching Quality in HigherEducation: An Introductory Review on a Process-Oriented Teaching-Quality Model,” Total Quality Management and Business Excellence,vol. 25, no. 1–2, pp. 35–56, 2014.
[6] E. Reci and A. Bollin, “A Teaching Maturity Model for InformaticsTeachers in Primary and Secondary Education,” in Proceedings of theThe 9th International Conference on Informatics in Schools, ISSEP2016, 2016.
[7] M. C. Paulk, B. Curtis, M. B. Chrissis, and C. V. Weber, “Capabilitymaturity model, version 1.1,” IEEE Softw., vol. 10, no. 4, pp. 18–27,Jul. 1993. [Online]. Available: http://dx.doi.org/10.1109/52.219617
[8] C. Lutteroth, A. Luxton-Reilly, G. Dobbie, and J. Hamer, “Amaturity model for computing education,” in Proceedings of theNinth Australasian Conference on Computing Education - Volume66, ser. ACE ’07. Darlinghurst, Australia, Australia: AustralianComputer Society, Inc., 2007, pp. 107–114. [Online]. Available:http://dl.acm.org/citation.cfm?id=1273672.1273685
[9] P. V. M. Nuno Duarte, “Towards a maturity model for higher educationinstitutions,” in Proceedings of the 23rd International Conference onAdvanced Information Systems Engineering Doctoral Consortium, 2011.
[10] T. C. Ling, Y. Y. Jusoh, R. Abdullah, and N. H. Alwi, “A Review Study:Applying Capability Maturity Model In Curriculum Design Process ForHigher Education ,” Journal For The Advancement Of Science & Arts,vol. 3, no. 1, 2012.
[11] M. M. L. Petrie, “A Model for Assessment and Incremental Improve-ment of Engineering and Technology Education in the Americas,”in Proceedings of Second LACCEI International Latin American andCaribbean Conference for Engineering and Technology, 2004.
[12] C. Neuhauser, “A Maturity Model: Does It Provide a Path for OnlineCourse Design?” Journal of Interactive Online Learning, vol. 3, 2004.
[13] ——, “A five-step maturity model for on-line course design,” in Pro-ceedings of the 19th Annual Conference on Distance Teaching andLearning, 2005.
[14] S. Marshall and G. Mitchell, “Applying spice to e-learning:An e-learning maturity model?” in Proceedings of the SixthAustralasian Conference on Computing Education - Volume 30,ser. ACE ’04. Darlinghurst, Australia, Australia: AustralianComputer Society, Inc., 2004, pp. 185–191. [Online]. Available:http://dl.acm.org/citation.cfm?id=979968.979993
[15] B. Montgomery, “Developing a Technology Integration Capability Ma-turity Model for K-12 Schools,” Ph.D. dissertation, Published thesis.Concordia University, Montreal, Canada, 2003.
[16] B. A. White, H. E. L. Jr., P. M. Leidig, and D. M. Yarbrough,“Applicability of CMMI to the IS Curriculum: A Panel Discussion ,”in The Information Systems Education Conference (ISECON), 2003, pp.1–5.
[17] M. Solar, J. Sabattin, and V. Parada, “A Maturity Model for Assessingthe Use of ICT in School Education,” Educational Technology andSociety, vol. 16, no. 1, pp. 206–218, 2013.
[18] A. Bollin, E. Hochmuller, R. Mittermeir, and L. Samuelis, “Experienceswith Integrating Simulation into a Software Engineering Curriculum,”in Proceedings of 25th IEEE Conference on Software EngineeringEducation and Training CSEE&T 2012, 17-19 April 2012, Nanjing,Jiangsu, China, 2012, pp. 62–75.
[19] T. DeMarco, P. Hruschka, T. Lister, S. McMenamin, J. Robertson, andS. Robertson, Adrenaline Junkies and Template Zombies: UnderstandingPatterns of Project Behavior. Computer Bookshops, 2008.
[20] N. M. Razali, “Yap bee wah,” Journal of Statistical Modeling andAnalytics, vol. 2, no. 1, pp. 21–31, 2011.
[21] D. G. Rees, Essential Statistics, 4th ed. Chapman & Hall, 2003.[22] N. E. Fenton and S. L. Pfleeger, Software Metrics, 2nd ed. Thompson
Press, 1989.