Embed Size (px)
Citation preview

1
Applied Thermodynamics for Marine Systems
Prof. P. K. Das
Department of Mechanical Engineering
Indian Institute of Technology, Kharagpur
Lecture No. - 06 Property of Pure Substance, Steam Table
Good afternoon. Today, we will start a new topic that is, the properties of pure
substances.
(Refer Slide Time: 01:03)
A pure substance can remain at a particular phase or can remain as a mixture of different
phases. By phase, we mean the state of the substance; it can be solid, it can be a liquid
phase and it can be either in vapour or in gas phase. There is a subtle different between
vapour and gas phase which we will know when we discuss further. Out of this
particularly when we will see the different engineering systems of our interest, we will
find that the working medium could be either in the liquid phase or in the vapour phase or
gas phase, or it could be a mixture of liquid and vapour phase. In engineering
thermodynamics or the branch of engineering thermodynamics which we are studying,
there we will be concerned with the determination of thermodynamic properties of

2
liquids, vapours and gasses and the mixture of liquid and vapour. There could be some
properties of a solid material which are also thermodynamic properties but we are not
interested in that. Generally, a metallurgist or physicist will discuss those properties and
that is not within the discussion of the present course. Let us take one example.
(Refer Slide Time: 03:08)
Let us say, we take a certain vapour in a piston cylinder arrangement and the piston is
loaded by a constant load like W. Inside this piston cylinder arrangement some vapour is
there and we are transferring heat to this vapour at a slow rate, so that at any instant the
temperature of the vapour mass anywhere inside this piston cylinder arrangement is
uniform and constant. But, it is changing with time. That means as we are giving or
supplying more and more heat the temperature of the vapour mass as a whole is changing
but it is not changing from point to point. If we do this experiment and then if we try to
measure its different properties then what will we find? If we transfer heat and there is an
expansion of this vapour mass, there will be a change in volume. But, we are applying a
constant weight on the piston so the pressure remains constant. It is a constant pressure
process. The volume changes and there could be change in temperature. If we note down
the change of volume then, one can find out the change in volume with the application of
heat. Similarly one can think of a process in which we are plotting the change of volume.

3
(Refer Slide Time: 05:21)
Either we can think of specific volume or we can think of total volume and this side we
have got pressure. We can think of the change of pressure and volume while the
temperature is kept constant; so the process will be something like this. Let us say, we are
going for a cooling process. The process will be something like this. Here, what we have
done is, we have kept the temperature constant. At this point let us say we are coming to
the saturated state of the vapour. We have started at any arbitrary pressure, volume and
temperature of a vapour. Then we are cooling it. That means, we are extracting heat from
the vapour mass, keeping the temperature constant.
We are plotting the pressure and volume at different stages. At one stage we will reach
the saturated vapour condition. After that, if we extract more heat what will we find? We
find that temperature will remain constant and pressure will also remain constant till this
saturated vapour completely gets converted into saturated liquid. At this point we are
getting a saturated liquid. After this if we extract more heat then, we will find that there is
a rise in pressure but during this process there is very less change in volume. Here we are
having a liquid state and in the liquid state it is almost incompressible, so the change in
volume will be small. Let us say this is at temperature T1. We can repeat this process for
another temperature. Let us repeat this process for another temperature and we will get
something like this. We are getting basically three regions of the curve. In this region, we

4
are getting super heated vapour, in this region this is the saturated vapour point, here we
are getting vapour liquid mixture, this is the saturated liquid point and here we call it sub-
cooled liquid. This is liquid, this is vapour and in between we have a zone where mixture
of liquid and vapour exists. If we do this experiment for different temperatures, we will
have different points for saturated vapour. Similarly, we will have different points for
saturated liquid. If we combine all these points by some sort of a smooth curve, then you
will get some sort of a dome like this.
Let us say, this is the line which passes through points of all the saturated vapour and this
is the line which passes through all the points of saturated liquid. If they are extended
they will join at a particular point which is known as critical point. Let me denote this
point as C or critical point. If somebody does the same experiment or same type of curves
are plotted then, through the critical point one will get a curve like this. Beyond critical
point the nature of the curve will be something like this. Let me write down. This side we
are having liquid which is denoted by L. Inside the dome we are having liquid plus
vapour and this side we are having vapour. L denotes liquid and v denotes vapour. If we
have the dome, on the left hand side of the dome and on the right hand side of the dome
we have got single phase regions, while inside the dome we have got a two phase region
or mixture of two phases.
For a pure substance if it is in single phase, then if we have know two independent
thermodynamic properties, then any third property can be determined. In this region or in
the vapour region if we have know two independent thermodynamic properties, let us
say, if we know pressure and temperature we can determine volume, we can determine
enthalpy, we can determine entropy or any other properties for that matter. Similarly, in
the liquid region, if, say pressure and temperature are known, other thermodynamic
properties can be determined. In the two phase region we need any three independent
properties for determining another thermodynamic property. We will see how to
determine the thermodynamic properties and what the important thermodynamic
properties are. Mainly our working substance will be either in the gaseous phase or
vapour phase or it will be in the liquid phase or it will be a mixture of liquid and vapour.
Common working medium with which our engineering cycles run are like steam; it can

5
be a refrigerant. Basically, steam is used in number of engineering cycles and it is a
medium which is extensively used for the production of power. We will study the
properties of pure substance with reference to properties of steam.
(Refer Slide Time: 13:08)
For steam, the diagram which I have shown you is known as pV diagram. For steam this
is the pV diagram. Here, these are constant temperature lines. This is a constant
temperature heating line. Earlier I have shown a constant temperature cooling line. This
point is known as the critical point. This line is known as saturated vapour line and this
line is known as saturated liquid line.

6
(Refer Slide Time: 14:37)
Similarly, one can have another thermodynamic plane for representing the pure
substance. This is a TS plane or temperature entropy plane. In this temperature entropy
plane we can have constant pressure lines like this. This is a constant pressure line, so we
can call it p is equal to constant. Another line we can have; let us say, this P1 is constant
where P1 is greater than P. Here also we are having the critical point here at the top of the
dome. C is the critical point. Then, if I have these two lines A to C or line AC, this is the
saturated liquid line and BC is saturated vapour line. Here, we can see a dome type
structure within which there is both liquid plus vapour. On the left hand side of the dome
we have the liquid and on the right hand side of the dome we have got vapour. At the
critical point one cannot make any demarcation between the liquid phase and the vapour
phase and at the top of the critical point we have got gaseous phase of the matter.
This holds good for both pV diagram and for the TS diagram. That means, at the critical
point we do not have any demarcation between liquid phase and vapour phase and above
the critical point or at the top of the critical point we have got gaseous phase. I have
mentioned that for any pure substance if it is in single phase, we need two independent
properties for determining the third property or for determining any other thermodynamic
property. Inside this dome we have got a mixture. Though it is a pure substance here two
different phases are existing together; liquid and vapour. Here, we need one additional

7
information for determining the property values. That information is known as quality or
dryness fraction.
(Refer Slide Time: 18:02)
Let us say, we take a sample of a two phase mixture. The mass of the sample is M. As it
is a mixture of two phases, it is made up partly with liquid and partly with vapour.
Conventionally, liquid is expressed with a subscript f and vapour is denoted with a
subscript g. M total will be Mf plus Mg. The quality or dryness fraction is denoted as x.
So, x is mass of vapour divided by the mass of the sample. In this case it will be Mf by M
or it will be Mf by Mf plus Mg. This quality or dryness fraction will be used as another
property inside the two phase dome.

8
(Refer Slide Time: 20:20)
If we go back to our earlier diagram we can write at the saturated vapour line, x is equal
to 1; saturated liquid line x is equal to zero and in between values of x that will lie
between these two lines. In other words we will have different curves for different values
of x inside the dome. These are constant x values or constant x lines; so we can write x is
equal to constant.
(Refer Slide Time: 21:10)

9
A similar thing is there in this TS diagram; x is equal to 1, here x is equal to zero and in
between there are number of lines. Let us say, this is one typical line where x is equal to
constant. As I have mentioned in the beginning, we are not much concerned with the
property of solids. Let us see the total scenario on a PT diagram, pressure temperature
diagram.
(Refer Slide Time: 22:00)
This is a PT plane for any thermodynamic substance. Here, the transformation of phases
can be denoted by lines like this. This side we will have solid, this is liquid, this is vapour
and this is gas; this is extended. If we give different names, this point is C and this is TP.
S denotes solid, L denotes liquid, V denotes vapor and G denotes gas. C denotes critical
point and TP denotes triple point. This is a very important diagram. It shows depending
on the values of pressure and temperature, what will be the phase of a particular
substance? Whether it will be in solid phase or it will be in liquid phase or it will be in
vapour or gaseous phase?
This line indicates the transformation between solid and liquid; so this line indicates
either melting process or solidification process. This line indicates the transformation
between solid and vapour. So, this is indicative of sublimation and de-sublimation
process and this line indicates transformation between liquid and vapour, so it is boiling
10
and condensation. Here we can see the critical point beyond which or at which there is no
physical demarcation between the liquid phase and the vapour phase. If we compare
between this PV diagram and the PT diagram of a substance where all the three phases
are shown, this is the saturated liquid line and this is the saturated vapour line. These two
lines are coincident in this line where there is a transformation between vapour and liquid
phase. In between there is a point which is known as triple point. This point is a very
important one and at this pressure and temperature, all the three phases can coexist. These
lines show the coexistence of two phases but this point shows the coexistence of three
phases; all the three phases can coexist at triple point. This is for the general information,
but for the branch of engineering thermodynamics in which we are interested, we are
interested in this line only where transformation between vapour phase and liquid phase
is taking place.
Let us recapitulate once again what we have learnt so far and then we will go for
determination of different properties. What we have seen so far is that, a pure substance
can remain in different phases like solid, liquid and gas or vapour. As far as engineering
thermodynamics is concerned, we are interested in liquid phase and vapour phase and
sometimes in gaseous phase. In a pure substance when there is transformation between
liquid to vapour phase and vapour to liquid phase, we are interested in those processes
and those processes can be expressed on different thermodynamic plane. Two
thermodynamic planes I have shown. One is a pV plane and another is a TS plane. In all
these planes we can see that there are three regions; one is a liquid region another is a
mixture of vapour and liquid region and third one is the vapour region. The mixture of
liquid and vapour region is bounded by two lines.
In any diagram like this one, on one side we have got saturated liquid line and on the
other side we have got saturated vapour line.
11
(Refer Slide Time: 28:06)
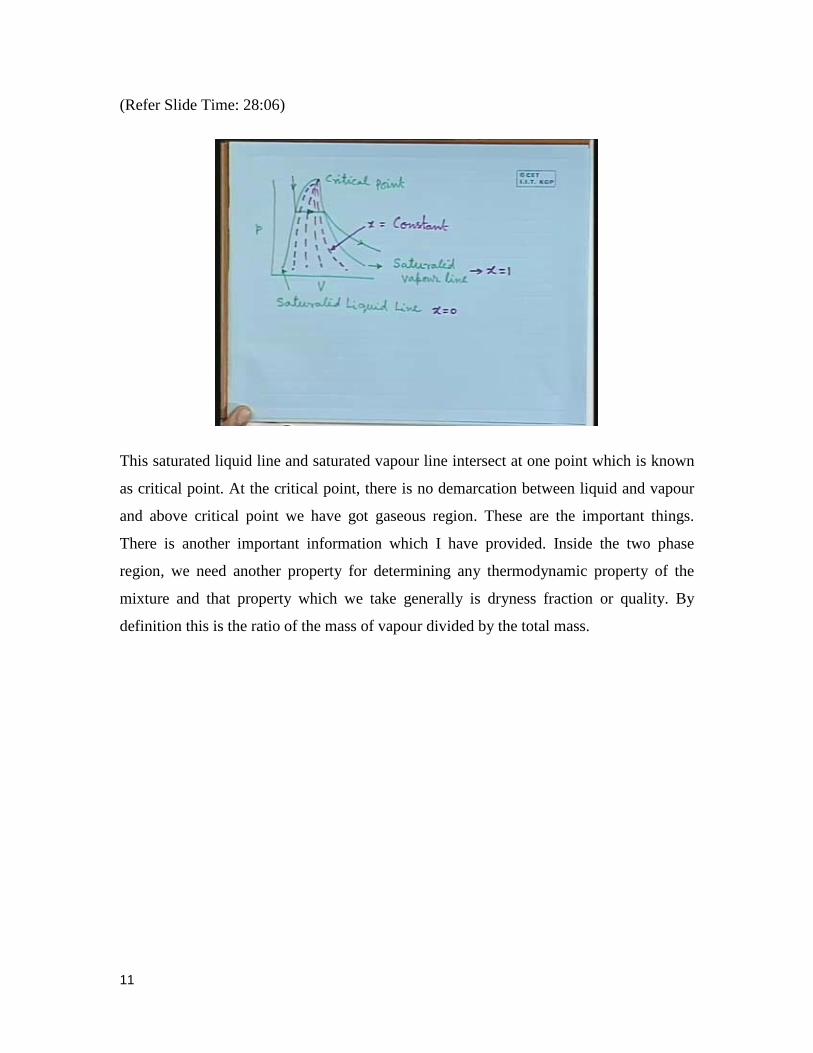
This saturated liquid line and saturated vapour line intersect at one point which is known
as critical point. At the critical point, there is no demarcation between liquid and vapour
and above critical point we have got gaseous region. These are the important things.
There is another important information which I have provided. Inside the two phase
region, we need another property for determining any thermodynamic property of the
mixture and that property which we take generally is dryness fraction or quality. By
definition this is the ratio of the mass of vapour divided by the total mass.

12
(Refer Slide Time: 29:06)
Let me draw the thermodynamic plane which we generally use for discussing the change
between the liquid phase and vapour phase. One is a pv plane, as I have shown; this is the
pv plane. Another is a TS plane. The third one is hs plane. The hs plane looks like this. In
the hs plane also we have got the critical point. This is critical point c and you will have
different values of x like this. This is x and it is equal to constant and this line is your
saturated vapour line. This hs diagram, where enthalpy and entropy are taken as the
coordinates, has got another name that is known as Mallier diagram or sometimes it is
called Mallier chart. This diagram is very useful in solving problems because directly one
can get the enthalpy values and changes in entropy in different processes, from this chart.
As in different steady state steady flow processes, changes of enthalpy is a very important
quantity and it has to be computed number of times. This Mallier chart is very handy in
calculating problems and representing different thermodynamic cycles. Other planes are
also possible; like in the refrigeration cycle we can use a different thermodynamic plane
but those we will discuss later on. Mainly for steam properties or for the processes
involving steam, to represent the process we will use either a pv diagram or a TS diagram
or an hs diagram.
Which are the properties we are interested in? Let us say that we will be interested in the
specific volume. So what is the specific volume?

13
(Refer Slide Time: 32:46)
If we think of any thermodynamic plane, let us say we are interested in the TS plane and
in this TS plane we want to represent a process. The end points of the process can be
anywhere, either it can be in the liquid region or it can be in the two phase region or it
can be in the vapour region. Accordingly, we have to determine the properties in those
regions. Let us say, we are interested in one property which is the specific volume, v. If it
is in the super heated vapour region then we can determine it knowing other two
properties like pressure and temperature. Similarly, if it is in the liquid region we can
determine it knowing two independent properties. Let us say, again we take pressure and
temperature; these two properties are easily measurable properties. From there we can
determine what the specific volume is. But inside the two phase dome what should we
do? We can proceed like this. The mass balance if we make, m sample could be m liquid
plus m vapour. V sample, total volume of the sample, that could be V liquid plus V
vapour. Then one can write m into v. What is this quantity? This quantity is the specific
volume multiplied by mass that means it will give the total volume. That could be written
as mf into vf plus mg into vg and then we can divide both side by m; so it will be mf by m
into vf plus mg by m into vg.

14
(Refer Slide Time: 35:41)
Basically, we are getting the specific volume of the mixture is equal to mf by m
multiplied by vf plus mg by m multiplied by vg. By definition, the first term in this
particular quantity is the dryness fraction or x. Similarly here, what is mf? m minus mg
that is your mf divided by m into vf plus mg by m into vg. This will be 1 minus x into vf
plus x into vg. One can simplify it slightly. So, one can write vf plus x into vg minus vf.
Here, either of these two expressions can be used for denoting the specific volume of the
mixture. Either the first expression or the second expression can be used for determining
or denoting the specific volume of the mixture. What do we need for determining the
specific volume of the mixture? We need the specific volume of the fluid and we need the
specific volume of the gas or vapour and at the same time we need the mass fraction of
any of this component or we need the quality or dryness fraction.

15
(Refer Slide Time: 38:20)
If we go back to this diagram, this is a constant pressure line and we are interested in this
pressure. This is a constant dryness fraction line. Let us say, this dryness fraction is 0.75.
We are interested in determining, at p bar and at dryness fraction is equal to 0.75, what is
the specific volume of the mixture. What we have to determine? First, we have to know
what vf is. That vf corresponds to this value of the saturated liquid. We have to know vg.
vg corresponds to the specific volume of the saturated vapour at p bar and already it it
specified that we have to determine it at x is equal to 0.75. We know the magnitude of
this quantity vf here. We know the value of vg here; we know the value of x here. So, that
can be plugged in this equation and ultimately we can find out the specific volume of the
mixture. This holds good for any other property.

16
(Refer Slide Time: 40:32)
If we want to determine enthalpy, we can use similar type of additive formula. If we are
interested in determining entropy, we can use similar type of expressions. Sometimes,
instead of using vg minus vf their difference is used and then this expression is like this v
is equal to vf plus x vfg. That means, this is the difference between vg and vf. So this
expression is also used in some of the occasions.
(Refer Slide Time: 41:49)
17
For determining the steam properties, we use steam table. This is a very useful tool for
thermodynamic calculations where steam is the working substance or steam and water are
the working substances. There are different steam tables available in the market; we can
use them and the only thing is that, we need to know how to read this steam table. Mainly
it has got different parts. In the first part of this steam table, we will see that property of
saturated steam or saturated vapour and saturated liquid will be given. The property of
saturated liquid will be given in the first part of the steam table; saturated liquid and
vapour. Basically, we can say that property of saturated fluid will be given in the first part
of the steam table. Which are the properties that will be given? Here properties like
pressure, temperature, specific volume, enthalpy and entropy will be given. In the steam
table either the properties can be tabulated based on pressure or it can be tabulated based
on temperature. In most of these steam tables, both we will find. Tables based on pressure
or pressure based table and table based on temperature or temperature based table, both
we can find in most of the steam tables.
If there is a table which is temperature based, their property values will be given at
regular intervals of temperature. Temperature in the steam table denotes the saturation
temperature. We give the saturation temperature from any of these diagrams, either the
pv diagram or the TS diagram. In this pv diagram I have shown a constant temperature
curve.

18
(Refer Slide Time: 44:59)
Let us say, T is constant here for this green curve. If T is constant within this two phase
zone, for this portion of the curve p is also a constant. If I specify the temperature and call
it the saturation temperature, automatically the saturation pressure becomes fixed. Once I
give the temperature value then the pressure value is also fixed because I am determining
the property at the saturated state, either for the saturated vapour or for the saturated
liquid. Similar thing in this curve also; this p is equal to constant.
(Refer Slide Time: 45:54)
19
But we can see in the two phase zone also T is a constant. The same thing holds good.
That means if I specify the pressure, the temperature remains a constant because we are
determining properties at a saturated condition. A pressure based table or a temperature
based table, let us think of a temperature based table. A temperature based table will be
something like this. We will have temperature and then we will have pressure. Then we
can have vf, that is the specific volume of the liquid. We can have vg, we can have vfg also
in some tables. Then we can have hf, hg, hfg, sf and sg. This is temperature, this is
pressure, this is specific volume for a saturated liquid, this is the specific volume for
saturated vapour, this is the difference of specific volumes for saturated vapour and
liquid, this is enthalpy of the liquid at saturated condition, this is enthalpy of the vapour at
saturated condition and this is the difference between these two quantities. Then this is
the entropy of the saturated liquid and this is the entropy of the saturated vapour.
The units which are used are SI units. So one can have degree Celsius here; for pressure
we can have kilo Pascal. All these three quantities they can have a unit of meter cube per
kg that is for specific volume. All these three quantities, three enthalpies, they can have a
unit of kilo Joule per kg. This is a specific quantity per unit mass and these two entropies
will have kilo Joule per kg Kelvin. These are the units which will be used in the steam
table. Here, it is interesting to note in this context that we are getting or determining the
quantity hfg. This quantity hfg has got a physical meaning. Also from the physics point of
view, this is one quantity which is of interest. What is this quantity?
20
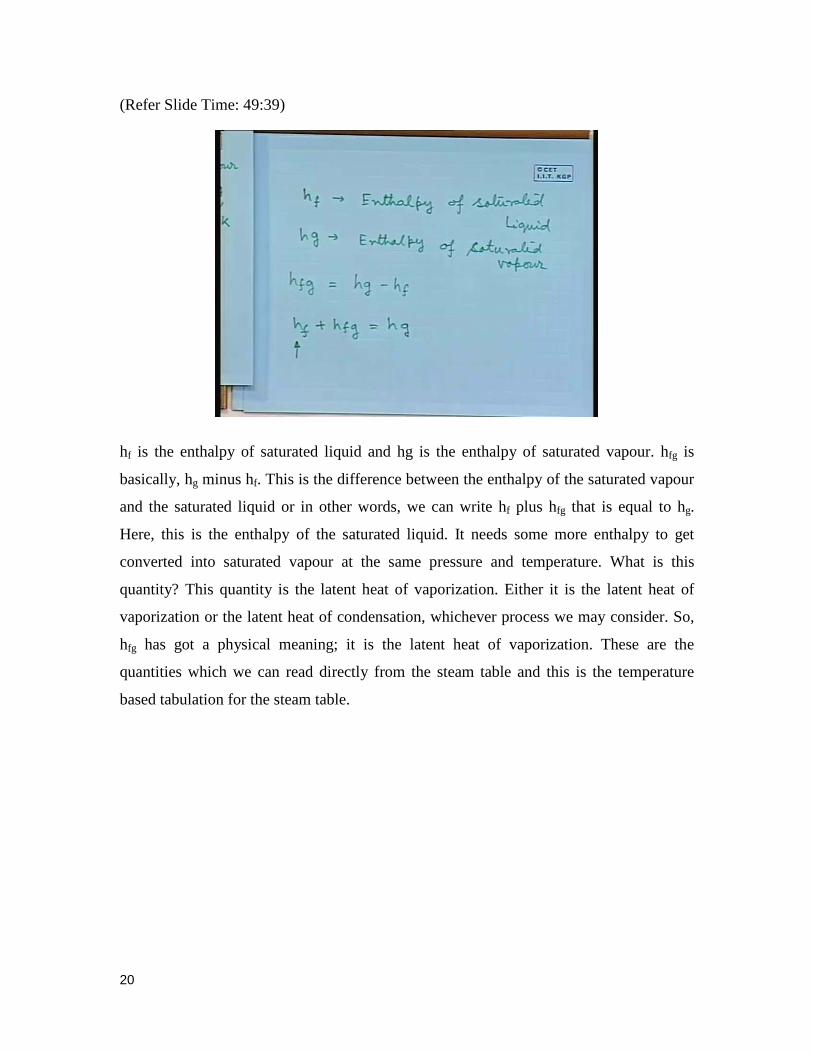
(Refer Slide Time: 49:39)
hf is the enthalpy of saturated liquid and hg is the enthalpy of saturated vapour. hfg is
basically, hg minus hf. This is the difference between the enthalpy of the saturated vapour
and the saturated liquid or in other words, we can write hf plus hfg that is equal to hg.
Here, this is the enthalpy of the saturated liquid. It needs some more enthalpy to get
converted into saturated vapour at the same pressure and temperature. What is this
quantity? This quantity is the latent heat of vaporization. Either it is the latent heat of
vaporization or the latent heat of condensation, whichever process we may consider. So,
hfg has got a physical meaning; it is the latent heat of vaporization. These are the
quantities which we can read directly from the steam table and this is the temperature
based tabulation for the steam table.

21
(Refer Slide Time: 51:30)
Similarly, one can have a pressure based tabulation of the steam table. In that case, what
will happen? We will have p to start with and property values will be tabulated at regular
intervals of p and then it will be followed by t; corresponding to this pressure, the
saturation temperature will be tabulated here. What is the difference between these two
tables? Here, we will see a regular interval of temperature but pressure intervals will not
be regular. Whereas in the second case here we will have a regular interval of pressure
and corresponding saturation temperatures will be tabulated in the next column but the
temperature intervals may not be regular. In fact, it will not be a regular. So, that is the
only difference between these two tabulations of the steam table. Next, I will take some
examples and explain how the data are tabulated and what can we do with the help of this
table? We will continue in our next class.