Embed Size (px)
Citation preview

Applied Surface Science 255 (2009) 6515–6524
m.co
m.cn
Effects of N2 content and thickness on CrNx coatings on Mg alloy by theplanar DC reactive magnetron sputtering
Yongjing Shi a,*, Siyuan Long a, Liang Fang b, Fusheng Pan a, Huimin Liao a
a College of Materials Science and Engineering, Chongqing University, Shazheng Street 174#, Shapingba District, Chongqing 400044, PR Chinab Department of Applied Physics, Chongqing University, Chongqing 400044, PR China
A R T I C L E I N F O
Article history:
Received 1 August 2008
Received in revised form 3 February 2009
Accepted 13 February 2009
Available online 23 February 2009
Keywords:
CrNx coatings
Planar DC reactive magnetron sputtering
Structure evolution
N2 content
Grain growth
Grain size distribution
A B S T R A C T
The CrNx (0 < x = N/Cr < 1) coatings on Mg alloy were prepared by DC reactive planar magnetron
sputtering at a mixed atmosphere containing Ar and N2. The effects of N2 content and thickness on the
CrNx coatings were characterized by the X-ray photoelectron spectrometry (XPS), X-ray diffraction (XRD)
and field emission scanning electron microscope (FESEM). The experimental results show that the N
atomic concentration increases exponentially and N1s spectrum shifts downward with the increase in
N2 content (w(N2)), and the deposition rate decreases exponentially. The morphologies evolution of CrNx
coatings shows that the growth structure changes from fibre growth to columnar growth with the
increase in w(N2). Based on evolution of phase and structure, a SZM model is summarized, indicating that
the change of structure and phase is consistent; ZT and sub-ZT correspond to Cr2N + Cr and CrN + Cr2N,
respectively. The in-plane mean grain size linearly increases and the Root Mean Square roughness WRMS
increases exponentially with coating thickening, and grain size obeys Gaussian distribution.
� 2009 Elsevier B.V. All rights reserved.
Contents lists available at ScienceDirect
Applied Surface Science
journa l homepage: www.e lsev ier .com/ locate /apsusc
www.sp1. Introduction
The Mg alloy is one of the potential materials due to lighterweight and excellent absorption of vibration in areas of aviationand automobile. Several different techniques have been developedfor the surface treatment of Mg alloy, but the coatings deposited byphysical vapour deposition are of distinct predominance due to thebetter adhesive and mechanical property. The binary and ternaryCr-based coatings have successfully been prepared on the Mg alloyby magnetron sputtering, such as AlN, CrN, TiN and AlN/TiN [1,2],to improve the corrosion-resistant and mechanical properties. Thequaternary nitride coatings on the Mg alloy were researched bymagnetron sputtering, and the carbide occurred as an unstablephase in the CrNxOyCz coatings; furthermore, the CrTiAlN coatingson the Mg alloy exhibited excellent mechanical and tribologicalproperties [3,4].
Nitride coatings of transition metal can provide betterprotection as an important functional material for the protectionof key tools and parts of automotive vehicle due to bettermechanical properties and corrosion resistance. Chromium nitridecoatings have been prepared on high speed steel and stainless steelby different technologies in a mixed atmosphere, such as reactive
* Corresponding author. Tel.: +86 23 65111279; fax: +86 23 65111279.
E-mail addresses: [email protected] (Y. Shi), [email protected]
(S. Long).
0169-4332/$ – see front matter � 2009 Elsevier B.V. All rights reserved.
doi:10.1016/j.apsusc.2009.02.044
magnetron sputtering [5], cathodic arc and electron beamevaporation [6,7], etc. Since the 1980s, mechanical properties ofCrNx coatings had been studied, and Cr2N demonstrated pre-dominant higher hardness and CrN were provided with betteroxidation resistance and lower friction coefficient [8]. Thecomposition and structure of CrNx coatings depended on N atomicrelative concentration, the structure of CrNx coatings changed fromthe Cr2N + Cr to the CrN structure, the coating density graduallyincreased [9].
Coating growth is a complex process controlled by the interplayof both thermodynamic and kinetic driving forces, and thefundamental factors of the deposition process governing growthand microstructure involve deposition process parameters, andsurface crystallographic structure and surface roughness of thesubstrate. The deposition temperature and sputtering gas pressurecompose basic technique parameters, and the incidence angle ofdeposition flux has an important effect on the coating structure,too. For the metal thicker coating growth, the structure zone modelwas proposed by Thornton [10,11], which characterized threezones as a function of T/Tm and total pressure for conventionalplanar magnetron sputtering, where T is the deposition tempera-ture and Tm is the melting pointing of coating materials. Based onpulsed magnetron sputtering, Kelly proposed a novel structuremodel which expressed the effect of O relative concentration onaluminum oxide coatings [12]. Moreover, abundant ion fluximpingement can increase adatom diffusion and reduce theparticle contamination. In the case of unbalanced magnetron

m
Y. Shi et al. / Applied Surface Science 255 (2009) 6515–65246516
www.sp
sputtering, Kelly and Arneli proposed a novel structure zone model[13].
In recent years, the growth of sputtering coatings has been thefocus of many theoretical and experimental works. For the stablegrowth of thin coating, three basic modes have been proposed,including the layer-by-layer mode, island growth mode and layer-plus-island mode on the monocrystal substrate. The columnargrowth is an ordinary model for polycrystalline and amorphouscoatings, and the theory of ballistic aggregation represented theevolution progress of columnar microstructure [14]. The processgoverning morphological evolution of thin coating can bedeveloped via research of the surface dynamics at the atomicscale. Most of sputtering deposition on a polycrystalline substrateand the deposition process was an unstable growth due to therapid deposition rate [15]. During the growth of coatings, the self-shadow, the local curvature, interfacial temperature, diffusion andrevised tangent rule played an important role through depositionprocess [16–19]. The scaling theory depicted the ordinary interfacemotion property of thin coating [20,21], and the grass modelemphasized the effect of shadowing and diffusion on thin coatinggrowth [22]. For thicker coating growth, abundant ion impinge-ment can affect the coating deposition and evolution of surfaceprofile, so surface diffusion must be affected by the ion-to-atomarrival ratio and pulsed flux [23,24].
In the present work, the CrNx (0 < x = N/Cr < 1, atomic ratio)coatings of different composition and thickness were prepared byDC reactive planar magnetron sputtering, and the effect of N2
content and thickness on the CrNx coatings on Mg alloy wascharacterized by XPS, XRD, FESEM and Scanning Probe Microscope(CSPM). The effects of N2 content and thickness on morphologiesevolution were discussed, and the detailed research results aredescribed below.
2. Experiment details
A series of CrNx coatings were prepared on AZ31 Mg alloy by theplanar DC reactive magnetron sputtering system. The vacuumsystem with internal size F450 mm � H300 mm is a single wall ofstainless steel cylinder, and the cape hood can be elevated by liftingarm. A 2XZ-8 type backing vacuum sliding vane rotary pump and aFB600 type turbo molecular pump composes vacuum pumpingsystem. A 2 kW direct current power and 2 kW direct current biasvoltage power compose supplies system. A FP93 type heatingpower was used to control workpiece temperature, which rangedfrom room temperature to 300 8C and the heating source was aheating wire fixed at the background of a sample holder. A roundplanner magnetron with a size of F60 mm was water cooled andused to create the deposition gas phase. The sample holder fixed oncape hood faces magnetron, and the distance of substrate-to-targetcan be adjusted from 30 mm to 100 mm.
The nummular substrates were machined and polished by6 mm diamond abrasive paper, and then the sample was fixed insample holder after being ultrasonically cleaned in acetone for
Table 1Deposition parameters of CrNx films by planner magnetron sputtering.
Sample no.
1# 2# 3# 4# 5#
N2 content 0 5% 10% 12.5% 15%
Target power (W) 84 93 99 115 120
Bias voltage (V) �100 �100 �100 �100 �100
Total pressure (Pa) 0.5 2.6 2.6 2.6 2.6
Substrate temperature (8C)a 47 45 55
Thickness (nm) 2000 1300 1600 1500 2400
a The substrate temperature is not interface temperature but back temperature of s
.com
.cn
30 min. The CrNx coatings were deposited in an atmosphericmixture of Ar and N2 using a metal Cr target with a purity99.95 at.%. Before depositing, the chamber base pressure waspumped to 7.4 � 10�4 Pa, and then the interface of Mg alloysubstrate was pre-sputtered cleaning around 10 min at minimumcurrent after inputting the Ar. Subsequently, N2 was inputted withdifferent flow rates (standard cubic centimeter per minute). Duringthe deposition step, the distance between substrate and target was70 mm. To improve the adhesion force, a metallic Cr adhesive layerof about 150–200 nm thick was deposited prior to the deposition ofthe normal CrNx coatings. In order to discuss the effect of nitrogencontent w(N2) and thickness on the CrNx coatings, the CrNx coatingshave been prepared under various N2 content and deposition timeconditions. The main technological parameters are shown inTable 1.
A Nova400 type FESEM was used to observe the surface andcross-section morphologies of CrNx coatings. The chemical state ofCrNx coatings was checked by an ESCALAB 250 type XPS. Theanalyzer was operated by a monochromator in the constantanalyzer energy (CAE), Al Ka source (1486.84 eV) radiation andlarge area XL lens mode, the energy step size at 0.1 eV and the passenergy at 50 eV. The calibration of the binding energy scale wasperformed according to a standard procedure and the followingstandards: Au4f7/2 (84.0 eV), Ag3d5/2 (368.3 eV) and Cu2p3/2
(932.7 eV). The thickness of CrNx coatings was measured by aball crater and a measuring scale of FESEM. The evaluation of thephase of CrNx coatings was analyzed by a high resolution Rigaku D/Max-2500 type XRD instrument with a thin coating attachment (aglancing angle mode), Cu Ka radiation and generator settings of40 kV and 30 mA. The composition of CrNx coatings was analyzedby XPS and X-ray energy dispersive spectrum (XEDS). The X-rayspectrums were acquired in a continuous mode with 2u singlescanning, a step size at 0.028, scanning speed at 68/min, and thegrazing incident angle at 28. The surface roughness and grain sizedistribution were analyzed by a CSPM5000 type, which wasoperated at atomic force microscope (AFM) mode. The grain sizedistributions were taken from different regions at contact mode bya monocrystalline silicon probe with 7 nm radius of curvature.
3. Results
3.1. The effect of N2 content on CrNx coatings
The CrNx coatings on AZ31 Mg alloy were prepared at differentw(N2) and deposition time that were used to control coatingcomposition and thickness. The measured substrate temperaturegiven in Table 1 indicates that substrate temperature increaseswith the increase in w(N2). At the same time sputtering powerincrease conformably resulting in temperature increase. The effectof w(N2) on the composition is given in Fig. 1, which indicates thatthe relative concentration of N atom in CrNx coatings presentsexponential growth with the increase in w(N2). During magnetronsputtering, combination reaction is present on growing interface,
6# 7# 8# 9# 10# 11# 12#
20% 25% 31% 28.6% 28.6% 28.6% 28.6%
126 144 156 105 105 105 105
�100 �100 �100 �100 �100 �100 �100
2.5 2.6 2.6 2.6 2.6 2.6 2.6
60.5 65.8 66 38 47 54.5 87
1600 1450 1400 300 600 1300 2900
ample.

m.co
m.cn
Fig. 1. Effect of N2 content w(N2) on N atomic content, binding energy of C–C and
deposition rate of CrNx coatings.
Fig. 2. XPS spectrums of C1s (A) and O1s (B) on surface of CrN coatings, at
w(N2) = 31%.
Y. Shi et al. / Applied Surface Science 255 (2009) 6515–6524 6517
www.spand the reaction should affect the adatom diffusion and growthstructure. The relative atomic concentration is subject to relativeatom ratio of reaction materials co-arriving to reaction interface;the increasing N2 content results in the increase of N atomicadsorptive ratio and interfacial reaction; and as a result the relativeconcentration of N atom increases. The N concentration analyzedby XPS is lower than XEDS about 5–10%, but the change tendency isconsistent.
According to the measured thickness of coatings and depositiontime, the corresponding mean deposition rates have beenevaluated for different N2 content. Ball crater and SEM measuringscale were used to check thickness of the group CrNx coatings,indicating similar results. The effect of N2 content on thedeposition rate is given in Fig. 1, which reveals that depositionrate decreases with the increase in w(N2); the fitting curve suggeststhat the deposition rate presents exponential decay. The increasein N2 content w(N2) resulted in the increase of coverage area ofcompound because the sputter yield of compound is lower thanthat of metal, and as a result the particle flux decreased [25–27]. Asa function of N2 content, the deposition rate demonstrates theexponential decay for most of nitride coatings, such as Zr–N andTi–N [28,29]. The sticking coefficient is a significant factor on thedeposition rate, which decreased with the increase in N2 content[30]. The sputtering voltage increases with N2 content, and followsthe increase of bombardment ion flux, so the resputtering effectcan result in the decrease of sticking coefficient. The interfacialtemperature and impinging ion flux of thickening coatingincreased isochronously and at a certain extent contributed tothe decrease of deposition rate.
The chemical state of CrNx coatings was analyzed by XPS, andthe analysis of survey scanning shows the presence of the peaks Cr,N, O and C. In the C1s spectrum, adsorptive carbon and a littlecarbide (282.6 eV) occur, as given in Fig. 2 (A). The C1s spectrumdisappears after the samples have been etched for some minutes,indicating that adsorptive carbon is present on the top of thecoatings. The Shirley background subtraction method was used tocorrect narrow scanning spectrum of various elements, whichwere fitted by using the Lorentzian–Gaussian function, and the chi-square value has been minimized. The O1s spectrums indicateseveral oxides are present including Cr2O3 (530.35 � 0.4 eV [31–33]), Cr(OH)3 (531.4 � 0.4 eV [31,33]), as well as adsorptive oxygenand adsorbed water (532.53 eV and 533.54 eV [34,35]), the peaksituated at 529.12 eV may belong to CrO3 (529.7 eV [35]), as shown inFig. 2(B). Deconvolution spectrums of N1s reveal that Cr2N (397.6 eV[36]) and CrN (396.7 eV [37]) are present in CrNx coatings, as given inFig. 3. The nitride in coatings is gradually changed into CrN from Cr2Nwith the increase in w(N2), and relevant binding energy gradually
shifting downward about 1.2 eV. It is rather remarkable that thereference binding energy of C1s (C–C or C–H) presents an exponentialdecay with the increase in w(N2), as given in Fig. 1.
The structure evolution of CrNx coatings is shown in Fig. 4,which reveals the close-packed hexagonal structure when w(N2) isbetween 5% and 15%, and the peak intensity increases with theincrease in w(N2); the structure belongs to FCC when the w(N2) isincreased from 20% to 31%. Combined with the composition andchemical state of coatings, the coating phase includes Cr and Cr2Nat w(N2) = 5%, and the microcrystallite of body-centered cubic(BCC) and HCP structure is intermixed. The Cr2N phase demon-strates the obvious preferred (1 1 2 1) out-plane orientation whenw(N2) increased to 12.5%. The face-centered cubic (FCC) structureoccurs at w(N2) = 20%, and the (1 1 2 1) out-plane orientation ischanged into (2 0 0) out-plane orientation of FCC structure. For theCrN phase, the (1 1 1) and (2 2 0) orientation intensity graduallyincrease with the increase in w(N2), while the (2 0 0) peak intensitygradually decreases. The diffraction peaks of Mg alloy substrate canbe found at XRD spectrums, and the diffraction intensity of Mgalloy gradually decreases with the increase in w(N2), indicating thecoatings density increases isochronously with the increase inw(N2).
The effect of w(N2) on the growth structure of CrNx coatings wasdepicted by fractured cross-section, and surface morphologieswere observed by FESEM. Fractured cross-section morphologies ofCrNx coatings are given in Fig. 5, which clearly presents thecoatings’ growth affected by the w(N2). For metal Cr coating,

www.spm
.com
.cnFig. 3. N1s spectrums of CrNx coatings with different N2 contents: (A) w(N2) = 5%, (B) w(N2) = 10%, (C) w(N2) = 15%, (D) w(N2) = 20%, (E) w(N2) = 25% and (F) w(N2) = 31%.
Fig. 4. XRD spectrum of CrNx with different N2 contents w(N2).
Y. Shi et al. / Applied Surface Science 255 (2009) 6515–65246518
morphology reveals that fibre growth belongs to Z1 structure. Inw(N2) = 5%, the growth structure shows that porous appearance ispresent in fractured cross-section, and the corresponding surfacemorphology reveals that flocculent structure is made of abundantfibre crystal, as given in Fig. 6. When the w(N2) increases to 15%,abundant porosity disappears and the density clearly increases,and the leafy surface structure with grooved boundaries occurs.Subsequently, the clear columnar growth can be seen, and thecorresponding surface morphology reveals that some biggergranular crystals with cone dome are present. The open boundarybetween columnar crystals is present when the w(N2) increases to31%. The results reveal that the decrease in abundant boundarypromotes adatom diffusion. So, an elevated w(N2) causes intergrainboundaries to become more open, a dense columnar competitivegrowth is more and more clearly with the increase in w(N2),although bombardment ion flux increases due to elevated targetvoltage.
The surface roughness of the CrNx coatings can be depicted byrandom three-dimensional thicker profiles, which were analyzedby the CSPM5000, as given in Fig. 7. The Root Mean Square (RMS)roughness of surface profile is defined as [22]
WRMSðLÞ ¼
ffiffiffiffiffiffiffiffiffiffiffiffiffiffiffiffiffiffiffiffiffiffiffiffiffiffiffiffiffiffiffiffiffiffiffiffiffiffiffiffiffiffiffiffiffiffiffiffiffiffiffiffiffiffiffiffiffiffiffi1
MN
XM�1
j¼0
XN�1
k¼0
hðx j; ykÞ � hM
� �2vuut ; (1)
hM ¼1
MN
XM�1
j¼0
XN�1
k¼0
hðx j; ykÞ: (2)
In this formula, the h(xj, yk) presents coordinates point of three-dimensional profiles, and hM presents the mean roughness value.The surface roughness WRMS increases exponentially with theincrease in w(N2). For the results, the basic understanding indicates

.spm
.com
.cnFig. 5. Fractured cross-section morphologies of CrNx coatings with different N2 contents: (A) w(N2) = 0, (B) w(N2) = 5%, (C) w(N2) = 10%, (D) w(N2) = 12.5%, (E) w(N2) = 15%, (F)
w(N2) = 20%, (G) w(N2) = 25% and (H) w(N2) = 31%.
Y. Shi et al. / Applied Surface Science 255 (2009) 6515–6524 6519
wwwin-plane grain grows with w(N2) increasing, and the maximumheight h* increases synchronously, so WRMS increases. In three-dimensional profiles, the higher peaks present columnar crystalwith predominance and the lower peaks present columnar crystalin inferior position.
3.2. The effect of thickness on properties of CrN coatings
The CrN coatings with different thickness deposited at differentdeposition times, and corresponding parameters are shown inTable 1, composition and chemical state of the group samples aregiven in Figs. 1 and 3. The measuring substrate temperatureincreases from 35 8C to 87 8C with the increase in coatings’thickness. The deposition process of CrN coatings can be picturedas occurring in three steps followed by deposition of Cr adhesivelayer, transition layer and normal chemical compound layer. Theeffect of coatings’ thickness on grain-orientation evolution of CrNcoatings deposited at low sputtering power is given in Fig. 8. Theout-plane Cr(1 1 0) is present at h = 300 nm, as well as out-plane(1 1 1) and (2 2 0) of FCC structure, while the Cr(1 1 0) peakdisappears when the coatings’ thickness increases to 600 nm. Thediffraction intensity of FCC structure increases with the increase incoatings’ thickness h. In comparison with powder diffraction ofsimilar composition, an obvious (2 2 0) and (1 1 1) are present atXRD spectrums. The texture orientation of thick coatings should be
affected by initial growth orientation, and the grain growth showsthat the texture orientation develops with the thickening ofcoating.
The in-plane mean grain size of CrN coatings can be definedas At/N, where the At and N present in-plane total area and totalgrain number, respectively. The in-plane grain size dia can bedefined as (4A/p)1/2, where the A presents in-plane grain area.The fractured cross-section morphologies and surface morphol-ogies of CrN coatings with different thickness are shown inFigs. 9 and 10, which present the in-plane diameter dia andheight of columnar crystal h through thickness increase. The topof CrN coatings presents trigone cone dome, which suggestslower ion impingement to the growing interface. The columnarcrystal acquires a bigger development through the depositedthickness during adhesive layer step depositing, and the growthmode continues with h thickening. The density of coatings’bottom increases with the increase in thickness due tosecondary growth of grain. Elevated deposition temperatureand compressive stress are responsible for the secondary growth[38].
The dia is direct ratio to the h, as shown in Fig. 11. The in-planemean grain size dia increases with the thickening of coatings thatcan be depicted by the following formula [39]:
dia ¼ atDn þ d0 � d01 þ k0h; (3)

spm
.com
.cnFig. 6. Surface morphologies of CrNx coatings with different N2 contents: (A) w(N2) = 5%, (B) w(N2) = 10%, (C) w(N2) = 12.5%, (D) w(N2) = 15%, (E) w(N2) = 20%, (F) w(N2) = 25% and
(G) w(N2) = 31%.
Y. Shi et al. / Applied Surface Science 255 (2009) 6515–65246520
w.
where a and k0 are thermally activated kinetic rate constants, tD isthe deposition time, d0 and d01 are the average initial in-planediameter, and n expresses the exponent related with grain growthactivation energy. In this formula, n is 1, indicating the mean value.Actually, n values for the different cones are assumed to have a
ww
Fig. 7. The effect of N2 content on surface roughness WRMS.
Gaussian distribution centered about value n0 with a standarddeviation s. Lita et al. researched the growth property of metal Alcoating [42], indicating that the n is 0.9. The out-plane grain size ofcoatings doa is larger than in-plane grain size (dia). The distributionof in-plane grain size belongs to normal distribution, whichsuggests the presence of competitive growth. Under annealingconditions, the in-plane average grain growth governed by timeand temperature should obey the revised parabolic kinetics in thincoating [40].
Correspondingly, it is found that WRMS increases monotonicallywith the increase in h and demonstrates property of powerfunction, as shown in Fig. 11. The WRMS values which wereacquired by the CSPM5000 have similar change tendency withdigitized SEM images. The results indicate that the amplitude ofvibration gradually increases and the surface roughness WRMS
presents growth of exponential function with the increase in h, andthe formula can be expressed as follows:
RRMS � P1ha: (4)
In this formula, a value is 0.7589 and P1 is 0.0801, and thecorrelation coefficient of regression line R2 = 0.99948 and variancex2/DoF = 0.0969. The thickness h is a function of time t, so WRMS
can be expressed as WRMS (L, t) � tb
(for t/Lz� 1), where b presentsthe temporal growth exponent [41]. This is the result of anisotropyof grain growth during coating thickening. Actually, the enlarged

Fig. 8. XRD spectrums of CrN coatings with different thicknesses ht.
Y. Shi et al. / Applied Surface Science 255 (2009) 6515–6524 6521
in-plane diameter accounts for the increase in maximum height, sothe surface roughness increases.
The in-plane grain size distributions were determined by theCSPM5000 which was operated at AFM mode, as shown in Fig. 12.The different region was scanned until the recorded grain was no
www.spm
Fig. 9. Fractured cross-section morphologies of CrN coatings with different thickn
.com
.cn
less than 400. In comparison with average equivalent diameter bySEM images, the calculated diameter is consistent. The normaldistribution curve was acquired from average value of original dataand sample standard deviation, and the counts intensity occursduring statistics and corresponds to the percentage of grain sizedistribution. The normal distribution curve is expressed as follows:
f ðdÞ ¼ 1
sffiffiffiffiffiffiffi2pp eðd�diaÞ
2=s2: (5)
The s presents standard deviation of d – dia. In this formula, s anddia are independent of each other. The distribution space of grainsize increases with the increase in h, and the corresponding samplevariance s2 increases synchronously. The dia increases withthickening of coating, and a significant shift in the distributionalso can be seen. The Gaussian distribution curve of in-planediameters characters growth property of grain coating, anisotropicproperty and competitive growth are the intrinsic reasons. Thegrains with competitive predominance continue to grow up, andthe grains which are in inferior position are shadowed andcoalesced, which suggests that coarsening mechanism of textureevolution contains shadow and coalescence during thickening.
The statistic variance s2 of CrN coatings is given in Fig. 13,which reveals that variance increases linearly with the increase inthickness. The fitted regression line is as follows:
s2 ¼ �183:05þ 1:2708h: (6)
For the fit formula, related coefficient R = 0.99738 and standarddifference SD = 131.21. On the assumption that s2 = 0, a criticalthickness value can be acquired at h = 144 nm. The result showsthat a critical thickness may occur during the thickening of CrNcoatings, and competitive columnar growth occurs after h exceeds
esses: (A) h = 300 nm, (B) h = 600 nm, (C) h = 1300 nm and (D) h = 2900 nm.
m.co
m.cn
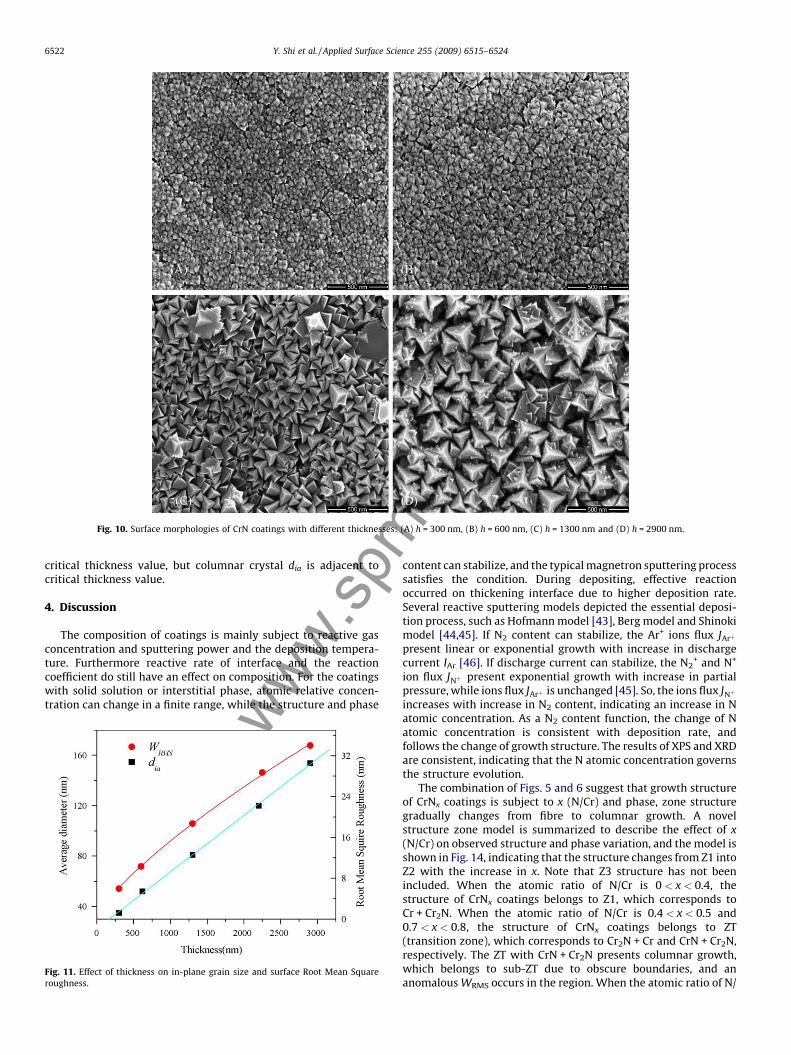
Fig. 10. Surface morphologies of CrN coatings with different thicknesses: (A) h = 300 nm, (B) h = 600 nm, (C) h = 1300 nm and (D) h = 2900 nm.
Y. Shi et al. / Applied Surface Science 255 (2009) 6515–65246522
ww.sp
critical thickness value, but columnar crystal dia is adjacent tocritical thickness value.
4. Discussion
The composition of coatings is mainly subject to reactive gasconcentration and sputtering power and the deposition tempera-ture. Furthermore reactive rate of interface and the reactioncoefficient do still have an effect on composition. For the coatingswith solid solution or interstitial phase, atomic relative concen-tration can change in a finite range, while the structure and phase
wFig. 11. Effect of thickness on in-plane grain size and surface Root Mean Square
roughness.
content can stabilize, and the typical magnetron sputtering processsatisfies the condition. During depositing, effective reactionoccurred on thickening interface due to higher deposition rate.Several reactive sputtering models depicted the essential deposi-tion process, such as Hofmann model [43], Berg model and Shinokimodel [44,45]. If N2 content can stabilize, the Ar+ ions flux JArþ
present linear or exponential growth with increase in dischargecurrent IAr [46]. If discharge current can stabilize, the N2
+ and N+
ion flux JNþ present exponential growth with increase in partialpressure, while ions flux JArþ is unchanged [45]. So, the ions flux JNþ
increases with increase in N2 content, indicating an increase in Natomic concentration. As a N2 content function, the change of Natomic concentration is consistent with deposition rate, andfollows the change of growth structure. The results of XPS and XRDare consistent, indicating that the N atomic concentration governsthe structure evolution.
The combination of Figs. 5 and 6 suggest that growth structureof CrNx coatings is subject to x (N/Cr) and phase, zone structuregradually changes from fibre to columnar growth. A novelstructure zone model is summarized to describe the effect of x
(N/Cr) on observed structure and phase variation, and the model isshown in Fig. 14, indicating that the structure changes from Z1 intoZ2 with the increase in x. Note that Z3 structure has not beenincluded. When the atomic ratio of N/Cr is 0 < x < 0.4, thestructure of CrNx coatings belongs to Z1, which corresponds toCr + Cr2N. When the atomic ratio of N/Cr is 0.4 < x < 0.5 and0.7 < x < 0.8, the structure of CrNx coatings belongs to ZT(transition zone), which corresponds to Cr2N + Cr and CrN + Cr2N,respectively. The ZT with CrN + Cr2N presents columnar growth,which belongs to sub-ZT due to obscure boundaries, and ananomalous WRMS occurs in the region. When the atomic ratio of N/
m.co
m.cn
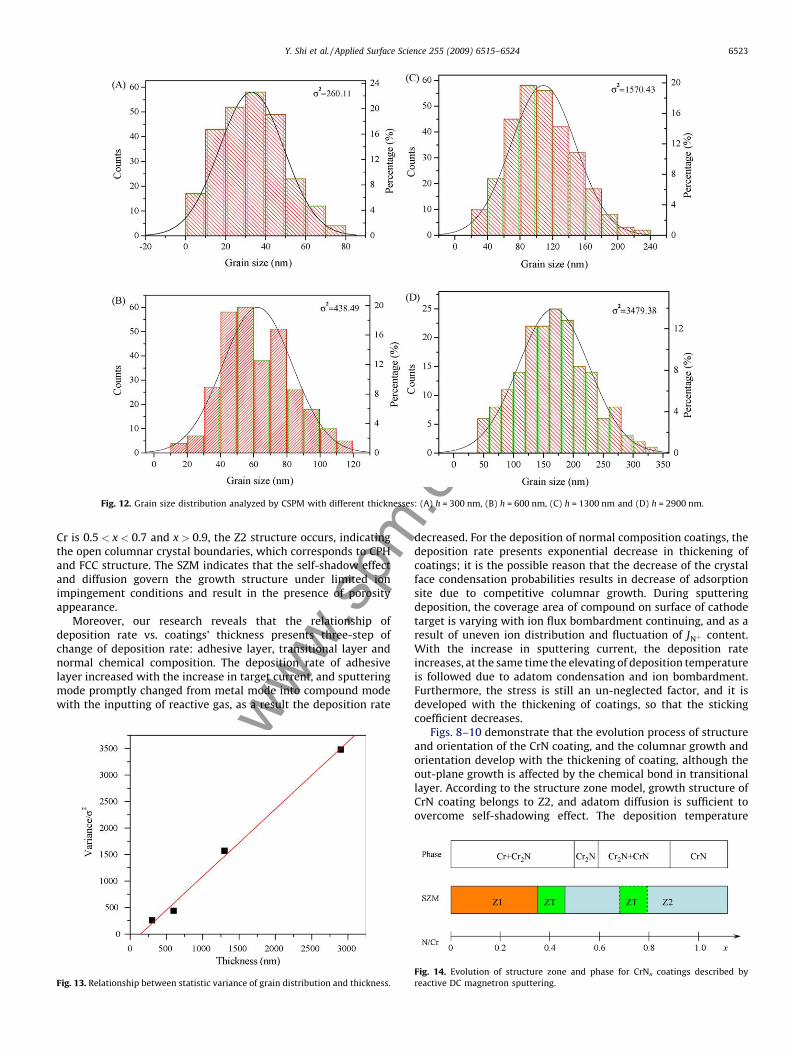
Fig. 12. Grain size distribution analyzed by CSPM with different thicknesses: (A) h = 300 nm, (B) h = 600 nm, (C) h = 1300 nm and (D) h = 2900 nm.
Y. Shi et al. / Applied Surface Science 255 (2009) 6515–6524 6523
ww.sp
Cr is 0.5 < x < 0.7 and x > 0.9, the Z2 structure occurs, indicatingthe open columnar crystal boundaries, which corresponds to CPHand FCC structure. The SZM indicates that the self-shadow effectand diffusion govern the growth structure under limited ionimpingement conditions and result in the presence of porosityappearance.
Moreover, our research reveals that the relationship ofdeposition rate vs. coatings’ thickness presents three-step ofchange of deposition rate: adhesive layer, transitional layer andnormal chemical composition. The deposition rate of adhesivelayer increased with the increase in target current, and sputteringmode promptly changed from metal mode into compound modewith the inputting of reactive gas, as a result the deposition rate
wFig. 13. Relationship between statistic variance of grain distribution and thickness.
decreased. For the deposition of normal composition coatings, thedeposition rate presents exponential decrease in thickening ofcoatings; it is the possible reason that the decrease of the crystalface condensation probabilities results in decrease of adsorptionsite due to competitive columnar growth. During sputteringdeposition, the coverage area of compound on surface of cathodetarget is varying with ion flux bombardment continuing, and as aresult of uneven ion distribution and fluctuation of JNþ content.With the increase in sputtering current, the deposition rateincreases, at the same time the elevating of deposition temperatureis followed due to adatom condensation and ion bombardment.Furthermore, the stress is still an un-neglected factor, and it isdeveloped with the thickening of coatings, so that the stickingcoefficient decreases.
Figs. 8–10 demonstrate that the evolution process of structureand orientation of the CrN coating, and the columnar growth andorientation develop with the thickening of coating, although theout-plane growth is affected by the chemical bond in transitionallayer. According to the structure zone model, growth structure ofCrN coating belongs to Z2, and adatom diffusion is sufficient toovercome self-shadowing effect. The deposition temperature
Fig. 14. Evolution of structure zone and phase for CrNx coatings described by
reactive DC magnetron sputtering.

m
Y. Shi et al. / Applied Surface Science 255 (2009) 6515–65246524
www.sp
increases with the thickening of coating, and provides driving forcefor secondary growth on bottom of thickening coating. In this case,the adhesive property should change with coating thickening. Theevolution of surface profile and WRMS presents the critical height atlocal region obeys the distribution of power function, surface freeenergy and deposition rate account for the result. The variancegrain size distribution s2 increases with the increase in thickness,and indicates that the columnar crystal with competitiveadvantage develops synchronously.
During the thickening of coating, the columns’ number andcrystal boundaries’ number unit area are significant factors. Theabundant boundaries between columns with different structureconstrict the adatom diffusion and hold back the in-plane grainsgrowing. In general, columns’ number unit area decrease with theincrease in w(N2), as a result the diffusion constant D increases.Moreover, deposition rate R decreases with the increase in N2
content, and the D/R presents exponential growth. It is possible thatKBR model can provide an explanation of the above-mentionedstructure evolution [16]. In this growth case, the growth isterminated or the deposition rate R is sharply reduced, once the h
reaches the critical height, which increases with the increase inw(N2); so the resulting increase in WRMS occurs. The self-shadoweffect and anisotropic property govern the adatom diffusion; in-plane grain grows with the thickening of coating, following that theboundaries and columns decrease. The adatom diffusion is limitedby the surface tension and anisotropic surface energy with thethickening of coating; the lattice mismatch and minimization ofcrystal face energy may have an effect on adatom diffusion [47,48].
5. Conclusion
The CrNx coatings on Mg alloy substrates were prepared by DCreactive planar magnetron sputtering at a mixed atmospherecontaining Ar and N2. The effects of N2 content and thickness onthe CrNx coatings were characterized by the XPS, XRD, FESEM andCSPM, respectively. The N atomic concentration increased with theincrease in N2 content, and the corresponding binding energy of N1sshifts downward about 1.2 eV. At the same time the structurechanges from HCP structure into FCC structure. The growth structureof CrNx coatings develops from fibre growth to columnar growth, andgradually forms open boundary; the deposition rate decreasesexponentially with the increase in N2 content. Based on the evolutionof phase and structure, a SZM model is summarized, indicating thatthe change of structure and phase is consistent; ZT and sub-ZTcorrespond to Cr2N + Cr and CrN + Cr2N, respectively. The surfaceRoot Mean Square roughness WRMS increases exponentially with thethickening of coating, and grain size obeys normal distribution.
Acknowledgments
In the present work, some helpful advice was acquired from Dr.Weiqing Wang, Dr. Liping Peng, Jianxin Dong and Yong Chen forsample preparation, and sample analysis was supported by Dr.Jianwei Chen, Tianlin Huang, and Chunhua Wang, the authorsincerely thanks them for assistance of the present work.
.com
.cn
References
[1] H. Altun, S. Sen, Surface & Coatings Technology 197 (2005) 193–200.[2] F. Hollstein, R. Wiedemann, J. Scholz, Surface & Coatings Technology 162 (2003)
261–268.[3] Y. Shi, S. Long, L. Fang, S. Yang, F. Pan, Applied Surface Science 254 (2008) 5861–
5867.[4] Y. Shi, S. Long, S. Yang, F. Pan, Applied Surface Science 254 (2008) 7342–7350.[5] K.H. Nam, M.J. Jung, J.G. Han, Surface & Coatings Technology 131 (2000) 222–227.[6] J.A. Sue, T.P. Chang, Surface & Coatings Technology 76–77 (1995) 61.[7] C. Liu, A. Leyland, S. Lyon, A. Mathews, Surface & Coatings Technology 77 (1995)
623.[8] P. Hones, R. Sanjines, F. Levy, Surface & Coatings Technology 94/95 (1997) 398–
402.[9] C. Rebholz, H. Ziegele, A. Leyland, A. Matthews, Surface & coatings Technology 115
(1999) 222–229.[10] J.A. Thornton, Journal of Vacuum Science & Technology 11 (1974) 666–670.[11] J.A. Thornton, Annual Review of Materials Science 7 (1977) 239–260.[12] P.J. Kelly, R.D. Arneli, Journal of Vacuum Science & Technology: A 19 (1999) 945–
953.[13] P.J. Kelly, R.D. Arneli, Journal of Vacuum Science & Technology: A 16 (1998) 2858–
2869.[14] P. Ramanlal, L.M. Sander, Physical Review Letters 54 (1985) 1828–1831.[15] R. Bruinsma, G. Aeppli, Physical Review Letters 52 (1984) 1547–1550.[16] R.P.U. Karunasiri, R. Bruinsma, J. Rudnick, Physical Review Letters 62 (1989) 788–
790.[17] P. Keblinski, A. Maritan, F. Toigo, R. Messier, J. Banavar, Physical Review: E 53
(1996) 759–778.[18] J.L. Zubimendi, M.E. Vela, R.C. Salvarezza, L. Vazquez, J.M. Vara, A.J. Arvia, Physical
Review: E 50 (1994) 1367–1371.[19] M. Kardar, G. Parisi, Y. Zhang, Physical Review Letters 56 (1986) 889–892.[20] G.S. Bales, A. Zangwill, Physical Review Letters 63 (1989) 692.[21] C. Tang, S. Alexander, R. Bruisma, Physical Review Letters 64 (1990) 772–775.[22] G.S. Bales, R. Bruinsma, E.A. Eklund, R.P.U. Karunasiri, J. Rudnick, A. Zangwill,
Science 249 (1990) 264–268.[23] P.J. Kelly, R.D. Arneli, Journal of Vacuum Science & Technology: A 16 (1998) 2858–
2868.[24] E. Kelesoglu, C. Mitterer, M.K. Kazmanli, M. Urgen, Surface & Coatings Technology
116–119 (1999) 133–140.[25] G.A. Zhang, P.X. Yan, P. Wang, Y.M. Chen, J.Y. Zhang, Materials Science and
Engineering: A 460–461 (2007) 301–305.[26] J.-E. Sundgren, B.-O. Johansson, S.-E. Karlsson, Surface Science 128 (1983) 265–
280.[27] Z. Han, J. Tian, Q. Lai, X. Yu, G. Li., Surface & Coatings Technology 162 (2003) 189–
193.[28] R. Mientus, K. Ellmer, Surface & Coatings Technology 116–119 (1999) 1093–1101.[29] H.A. Jehn, J. Kim, S. Hofmann, Surface & Coatings Technology 36 (1988) 715–727.[30] D. Mao, J. Hopwood, Journal of Applied Physics 96 (2004) 820–828.[31] I. Milosev, H.-H. Strehblow, B. Navinsek, M. Metikos-Hukovic, Surface and Inter-
face Analysis 23 (1995) 529–539.[32] M.J. Goldberg, J.G. Clabes, C.A. Kovac, Journal of Vacuum Science & Technology: A
6 (1988) 991–996.[33] B. Stypula, J. Stoch, Corrosion Science 36 (1994) 2159–2167.[34] P.-Y. Jouan, M.-C. Peignon, Ch. Cardinaud, G. Lemperiere, Applied Surface Science
68 (1993) 595–603.[35] A. Lippitz, Th. Hubert, Surface & Coatings Technology 200 (2005) 250–253.[36] P. Marcus, M.E. Bussell, Applied Surface Science 59 (1992) 7–21.[37] I.L. Singer, J.S. Murday, Journal of Vacuum Science & Technology 17 (1980) 1.[38] F. Lai, L. Lin, Z. Huang, R. Gai, Y. Qu., Applied Surface Science 253 (2006) 1801–
1805.[39] A. Mazor, D.J. Srolovitz, P.S. Hagan, B.G. Bukiet, Physical Review Letters 60 (1988)
424–427.[40] J.E. Palmer, C.V. Thompson, H.I. Smith, Journal of Applied Physics 62 (1987) 2492–
2497.[41] A.E. Lita, E. John, Sanchez Jr., Physical Review: B 61 (2000) 7692–7699.[42] A.E. Lita, E. John, Sanchez Jr., Journal of Applied Physics 85 (1999) 876–882.[43] S. Hofmann, Thin Solid Films 476 (1990) 335–348.[44] S. Berg, T. Nyberg, Thin Solid Films 476 (2005) 215–230.[45] F. Shinoki, A. Itoh, Journal of Applied Physics 46 (1975) 3381–3384.[46] V.Yu. Kulikovsky, Surface & Coatings Technology 94–95 (1997) 428–432.[47] C.V. Thompson, Annual Review of Materials Science 20 (1990) 239–268.[48] C.V. Thompson, Journal of Materials Research 14 (1999) 3164–3168.