Embed Size (px)
Citation preview
International Conference on Engineering Education and Research "Progress Through Partnership" © 2004 VSB-TUO, Ostrava, ISSN 1562-3580
1075
Applications of Virtual Instruments in Electrical Engineering Education
Denise CONSONNI Departamento de Engenharia de Sistemas Eletrônicos, Escola Politécnica, Universidade de São
Paulo, C.P. 61548, CEP 05424-970, São Paulo, SP, Brazil, ([email protected]) ;
Márcio F. AZEVEDO Escola Politécnica, Universidade de São Paulo;
Osvaldo BERNARDO NETO Escola Politécnica, Universidade de São Paulo;
Ronaldo C. ROGERI Escola Politécnica, Universidade de São Paulo.
KEYWORDS: Virtual Instruments, Electrical Engineering, LabVIEW, Distance Learning.
ABSTRACT: This paper describes the application of virtual instruments implemented using the National Instruments LabVIEW software, with various objectives in Electrical Engineering Education. The front panel as well as the main resources and functions of some instruments (a digital oscilloscope, a function generator, a power supply, a digital and an analog multimeter, an analog ammeter, resistance and capacitance decades) have been reproduced on the computer screen. Therefore, in the context of this work, the virtual instruments (VIs), rather than playing the role of interfacing real modules with the computer, are in fact mimic images of traditional equipment. The front panels with accessories and cables are interconnected in comprehensive virtual workbenches, so that these virtual instruments can be operated by using the computer mouse and keyboard, and the measurement procedures can be simulated as they are performed in a real world laboratory bench. Several routines, associated to Basic Electricity experiments have been developed, and the applications of these virtual workbenches in Electrical Engineering Education, at Escola Politécnica, University of São Paulo, Brazil, have been demonstrated (Understanding the frequency response of Multimeters; Designing resistance and inductance bridge circuits with high sensitivity; Getting acquainted with digital oscilloscopes; RC and RLC circuit responses in sinusoidal steady-state; and Dependence of transient response on the natural complex frequencies of RLC circuits). One objective of this work is to provide third year Electrical Engineering students (in a five-year career) with complementary tools for: a) preparing the experiments in advance, by using the virtual workbenches and getting acquainted with the instrument resources and measuring procedures; b) repeating the experiments after the Laboratory sessions, as a means of assimilating and reinforcing steps and concepts that could have remained unclear. In order to achieve this objective, the program codes have been compiled with LabVIEW Application Builder, and the executable files have been installed in the discipline internet site, so that the students can easily download the routines and run them in any computer. The developed programs are also being used as supporting teaching tools for second year students at electric circuit courses, in providing easy and immediate visualization of circuit responses at chosen parameter conditions. Although the procedure proposed in this work is not meant for replacing real laboratory experiments, a by-product of the executables is their application in complementing distance learning, where hardware availability may be limited. Apart from its educational usefulness, some other applications are envisaged for vendors and manufacturers, as the developed VIs provide a very handy tool for demonstrating equipment functionality and utilities.
1076
1 INTRODUCTION The concept of virtual instruments has been increasingly used, though not always presenting
the same meaning. Its early times started with the development of the microprocessor, allowing the combination of instrumentation and computational capacity for specific operations, like calibration, signal conditioning and digitalization, measurement control and display of results [GOLDBERG]. As computer technology advanced and so did the software interface, rather than using specific-usage developed multiprocessors, it became more economical to use a general-purpose computer, associated with an appropriate software, to shape the instruments for the tasks they were meant to perform in measurement and control processes. This combination resulted in the so-called programmable instruments [CRISTALDI], making possible the implementation and consequent automation of measurement algorithms on a programmable architecture, so that procedures could be changed by simply modifying the algorithm, but not the associated hardware. In order to ease the interface between measurement and computer programming professionals, the graphical language LabVIEW [LABVIEW] was introduced in the early 90s, initiating the concept of Virtual Instruments [JOHNSON]. In this language, graphic interfaces based on windowing and iconic interactions are used to issue commands and observe the operation of the measurement systems. The front panel presented on the computer screen (VI – virtual instrument) mimics the controls and indicators of the real instruments and the measurement procedure is neatly edited in a block diagram, which is then compiled for being executed by the measurement system, now comprised by the controlling computer, the real equipment and the graphical software. An evolution of this idea points towards the implementation of networked and distributed measurement systems [CRISTALDI], aiming at interconnecting different instruments and data processing sites, which can also include multi-computer processing systems, and remote controlling of equipment. Here it appears another concept of Virtual Instrument, as a module composed of specialized sub-units, general-purpose computers and a controlling software. Its various parts can be separated anywhere in the world, and connected for example, by internet. Applications of such scheme have been flourishing in distance learning education [FERRERO], [THIRIET], [SHEN], [BENETAZZO], [LATCHMAN]. Another extension of virtual instrumentation relies on interfaces for VXI (VMEbus Extensions for Instrumentation) system: a VXI instrument is a card that does not have a front panel user interface [JOHNSON]. Therefore, all the control of various VXI instruments, normally placed together into a single chassis, must be accomplished by the computer, preferentially through virtual instruments edited on its screen.
In a previous paper [CONSONNI], the development of various routines based on the concept of programmable and virtual instrument interfaces and their application in teaching basic electricity and electronics to Electrical Engineering students was presented. In this paper we describe tools that employ the concept of virtual instruments as reproductions of conventional measurement equipment, by using the graphical software language LabVIEW. Here, virtual instruments are not playing the role of interfacing real modules with the computer. In fact, the front panels with accessories and cables are interconnected in comprehensive virtual workbenches, so that these virtual instruments can be operated by using the computer mouse and keyboard, and the measurement procedures can be simulated as they are performed in a real world laboratory bench.
The objective of this work was to create complementary laboratory tools for helping third year Electrical Engineering students in becoming familiar with basic measurement instrumentation and methods, and also to provide supporting teaching tools for second year students at electric circuit courses, allowing easy and immediate visualization of RC and RLC circuit responses at chosen parameter conditions.
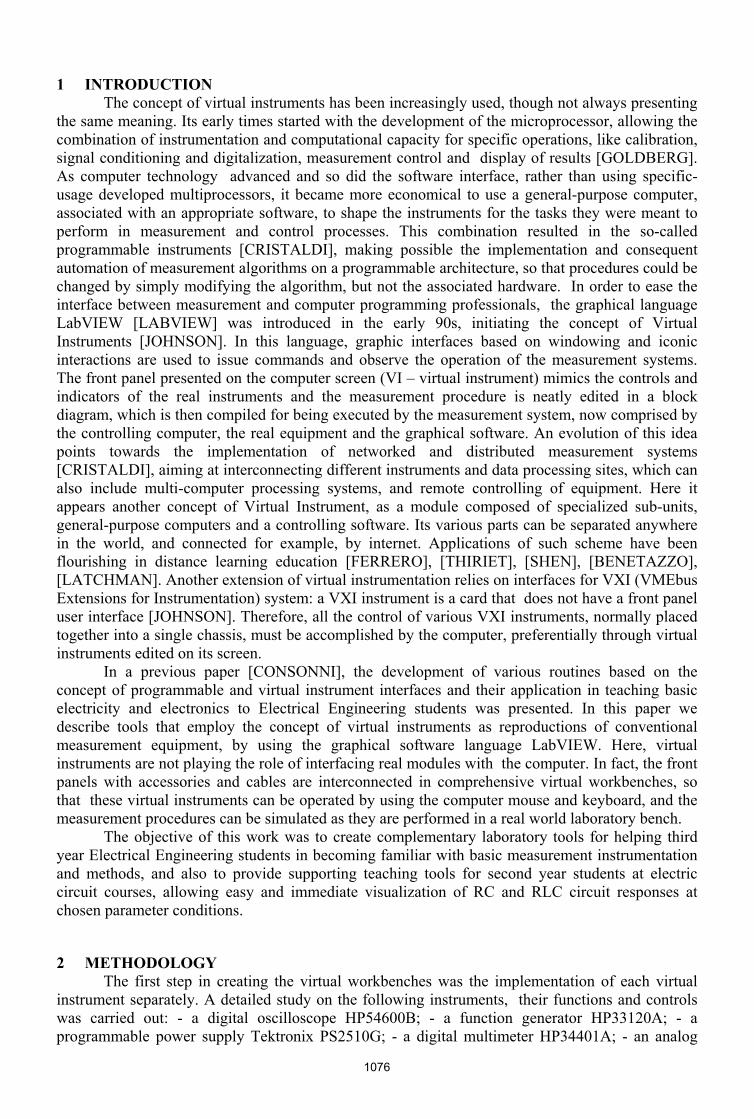
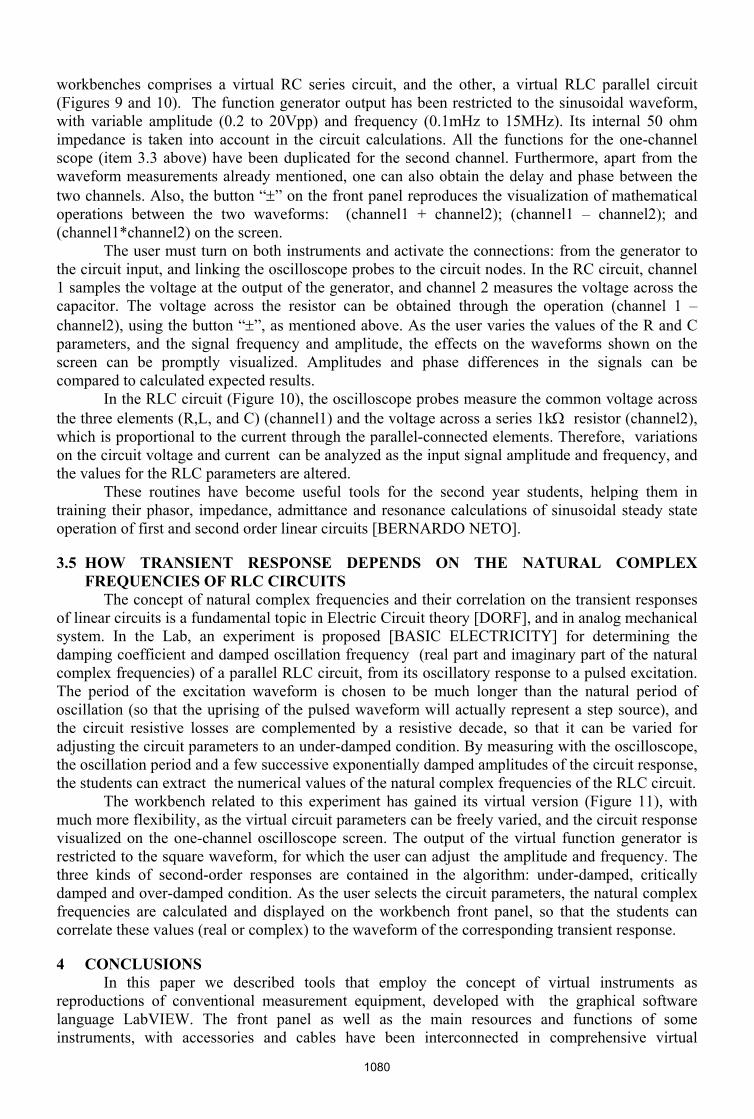
2 METHODOLOGY The first step in creating the virtual workbenches was the implementation of each virtual instrument separately. A detailed study on the following instruments, their functions and controls was carried out: - a digital oscilloscope HP54600B; - a function generator HP33120A; - a programmable power supply Tektronix PS2510G; - a digital multimeter HP34401A; - an analog
1077
multimeter ICEL MA-10E; -a microammeter ENGRO [AGILENT], [TEKTRONIX]. Their front panels have then been reproduced, by using control knobs, dials, text boxes and displays available in the LabVIEW libraries [USER MANUAL] and adapted from some instrument emulation softwares [EDUCATORS CORNER], [NI]. The LabVIEW Student Edition has been used in the development of all routines described in this work [BISHOP]. Once the front panels were designed, appropriate functional blocks were associated to buttons, selectors, potentiometers, oscillograms, displays and digital indicators, so that the main desired resources of each instrument could be operated as in its real counterpart. An example of this implementation is shown in Figure1, which represents the virtual digital oscilloscope connected to the virtual function generator. The developed routines are associated to experiments proposed to the third year students of the Electrical Engineering five-year course at Escola Politécnica, University of São Paulo (EPUSP), Brazil, in two Basic Electricity Laboratory disciplines (240 new students each year). Therefore, one of the objectives of this work was to provide them with complementary tools for : -preparing the experiments in advance, by using the virtual workbenches and getting acquainted with the instrument resources and measuring procedures; -repeating the experiments after the Laboratory sessions, as a means of assimilating and reinforcing steps and concepts that could have remained unclear. In order to achieve these objectives, the program codes have been compiled with LabVIEW Application Builder [APPLICATION BUILDER], and the executable files have been installed in the discipline internet site, so that the students can easily download the routines and run them in any computer. Some of the developed routines are related to the operation of RC and RLC linear circuits, illustrating the circuit responses at any desired parameter conditions, and are used as teaching tools for the second year students, in their Electric Circuit disciplines (240 new students each year). In the next section, the routines will be described in the context they are being used in the Electrical Engineering course at EPUSP.
3 EXAMPLES OF APPLICATIONS
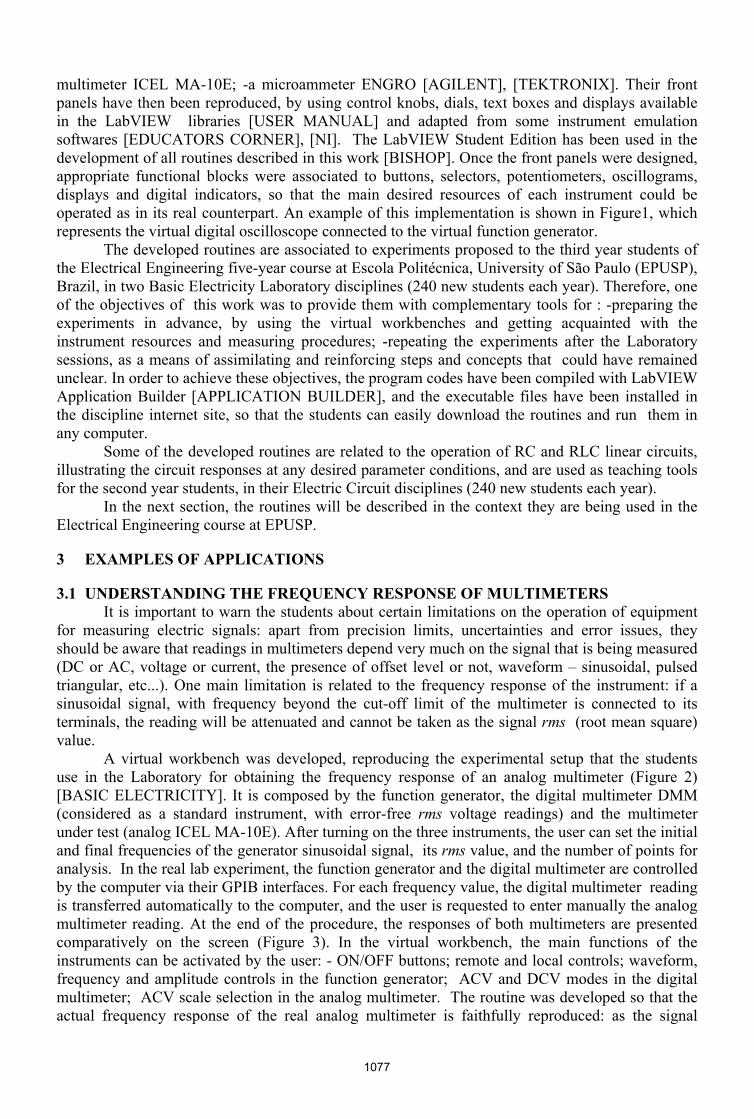
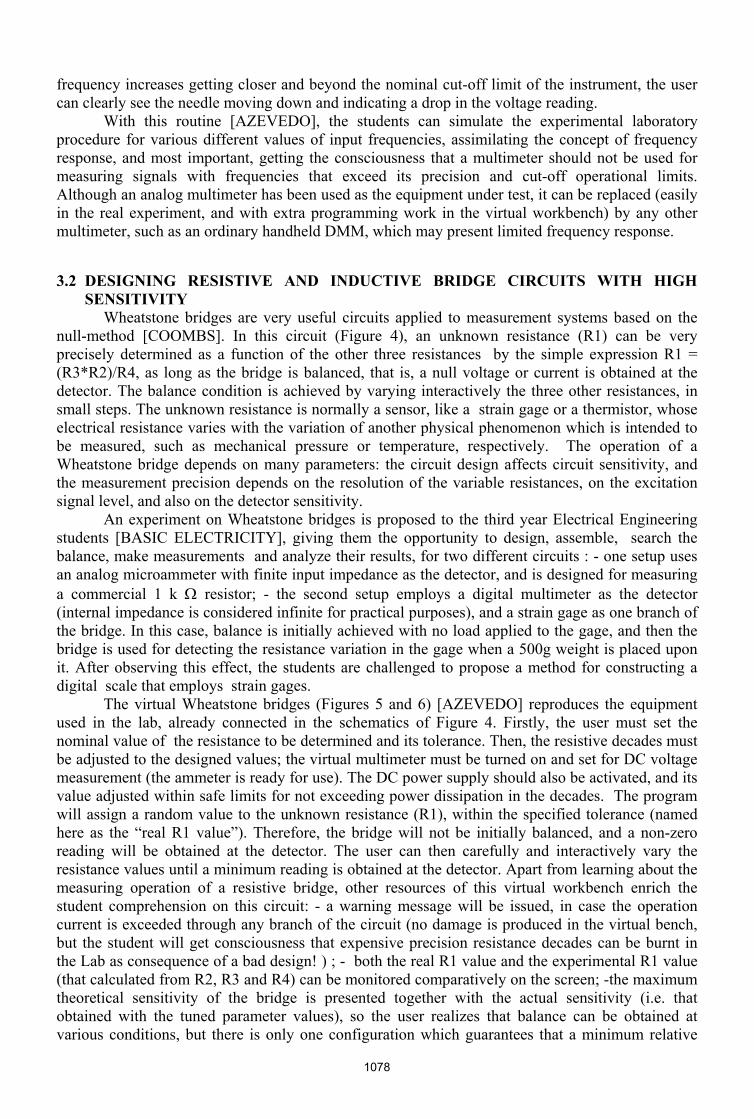
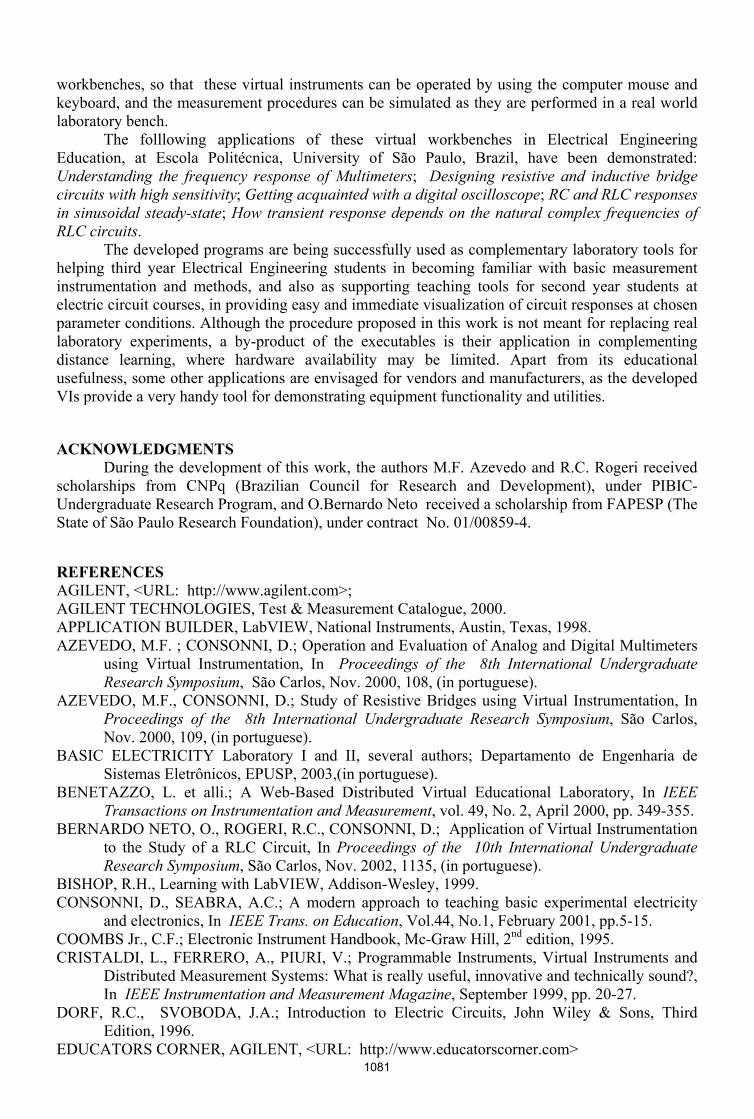
3.1 UNDERSTANDING THE FREQUENCY RESPONSE OF MULTIMETERS It is important to warn the students about certain limitations on the operation of equipment for measuring electric signals: apart from precision limits, uncertainties and error issues, they should be aware that readings in multimeters depend very much on the signal that is being measured (DC or AC, voltage or current, the presence of offset level or not, waveform – sinusoidal, pulsed triangular, etc...). One main limitation is related to the frequency response of the instrument: if a sinusoidal signal, with frequency beyond the cut-off limit of the multimeter is connected to its terminals, the reading will be attenuated and cannot be taken as the signal rms (root mean square) value. A virtual workbench was developed, reproducing the experimental setup that the students use in the Laboratory for obtaining the frequency response of an analog multimeter (Figure 2) [BASIC ELECTRICITY]. It is composed by the function generator, the digital multimeter DMM (considered as a standard instrument, with error-free rms voltage readings) and the multimeter under test (analog ICEL MA-10E). After turning on the three instruments, the user can set the initial and final frequencies of the generator sinusoidal signal, its rms value, and the number of points for analysis. In the real lab experiment, the function generator and the digital multimeter are controlled by the computer via their GPIB interfaces. For each frequency value, the digital multimeter reading is transferred automatically to the computer, and the user is requested to enter manually the analog multimeter reading. At the end of the procedure, the responses of both multimeters are presented comparatively on the screen (Figure 3). In the virtual workbench, the main functions of the instruments can be activated by the user: - ON/OFF buttons; remote and local controls; waveform, frequency and amplitude controls in the function generator; ACV and DCV modes in the digital multimeter; ACV scale selection in the analog multimeter. The routine was developed so that the actual frequency response of the real analog multimeter is faithfully reproduced: as the signal
1078
frequency increases getting closer and beyond the nominal cut-off limit of the instrument, the user can clearly see the needle moving down and indicating a drop in the voltage reading. With this routine [AZEVEDO], the students can simulate the experimental laboratory procedure for various different values of input frequencies, assimilating the concept of frequency response, and most important, getting the consciousness that a multimeter should not be used for measuring signals with frequencies that exceed its precision and cut-off operational limits. Although an analog multimeter has been used as the equipment under test, it can be replaced (easily in the real experiment, and with extra programming work in the virtual workbench) by any other multimeter, such as an ordinary handheld DMM, which may present limited frequency response.
3.2 DESIGNING RESISTIVE AND INDUCTIVE BRIDGE CIRCUITS WITH HIGH SENSITIVITY
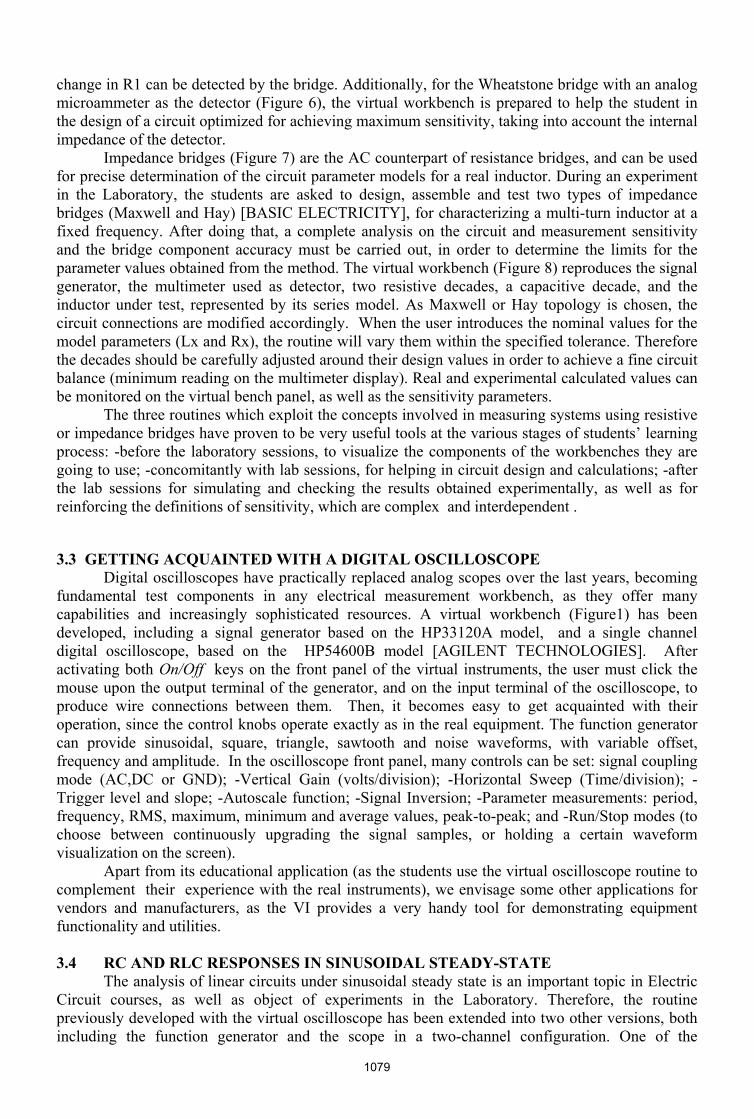
Wheatstone bridges are very useful circuits applied to measurement systems based on the null-method [COOMBS]. In this circuit (Figure 4), an unknown resistance (R1) can be very precisely determined as a function of the other three resistances by the simple expression R1 = (R3*R2)/R4, as long as the bridge is balanced, that is, a null voltage or current is obtained at the detector. The balance condition is achieved by varying interactively the three other resistances, in small steps. The unknown resistance is normally a sensor, like a strain gage or a thermistor, whose electrical resistance varies with the variation of another physical phenomenon which is intended to be measured, such as mechanical pressure or temperature, respectively. The operation of a Wheatstone bridge depends on many parameters: the circuit design affects circuit sensitivity, and the measurement precision depends on the resolution of the variable resistances, on the excitation signal level, and also on the detector sensitivity. An experiment on Wheatstone bridges is proposed to the third year Electrical Engineering students [BASIC ELECTRICITY], giving them the opportunity to design, assemble, search the balance, make measurements and analyze their results, for two different circuits : - one setup uses an analog microammeter with finite input impedance as the detector, and is designed for measuring a commercial 1 k Ω resistor; - the second setup employs a digital multimeter as the detector (internal impedance is considered infinite for practical purposes), and a strain gage as one branch of the bridge. In this case, balance is initially achieved with no load applied to the gage, and then the bridge is used for detecting the resistance variation in the gage when a 500g weight is placed upon it. After observing this effect, the students are challenged to propose a method for constructing a digital scale that employs strain gages. The virtual Wheatstone bridges (Figures 5 and 6) [AZEVEDO] reproduces the equipment used in the lab, already connected in the schematics of Figure 4. Firstly, the user must set the nominal value of the resistance to be determined and its tolerance. Then, the resistive decades must be adjusted to the designed values; the virtual multimeter must be turned on and set for DC voltage measurement (the ammeter is ready for use). The DC power supply should also be activated, and its value adjusted within safe limits for not exceeding power dissipation in the decades. The program will assign a random value to the unknown resistance (R1), within the specified tolerance (named here as the “real R1 value”). Therefore, the bridge will not be initially balanced, and a non-zero reading will be obtained at the detector. The user can then carefully and interactively vary the resistance values until a minimum reading is obtained at the detector. Apart from learning about the measuring operation of a resistive bridge, other resources of this virtual workbench enrich the student comprehension on this circuit: - a warning message will be issued, in case the operation current is exceeded through any branch of the circuit (no damage is produced in the virtual bench, but the student will get consciousness that expensive precision resistance decades can be burnt in the Lab as consequence of a bad design! ) ; - both the real R1 value and the experimental R1 value (that calculated from R2, R3 and R4) can be monitored comparatively on the screen; -the maximum theoretical sensitivity of the bridge is presented together with the actual sensitivity (i.e. that obtained with the tuned parameter values), so the user realizes that balance can be obtained at various conditions, but there is only one configuration which guarantees that a minimum relative
1079
change in R1 can be detected by the bridge. Additionally, for the Wheatstone bridge with an analog microammeter as the detector (Figure 6), the virtual workbench is prepared to help the student in the design of a circuit optimized for achieving maximum sensitivity, taking into account the internal impedance of the detector. Impedance bridges (Figure 7) are the AC counterpart of resistance bridges, and can be used for precise determination of the circuit parameter models for a real inductor. During an experiment in the Laboratory, the students are asked to design, assemble and test two types of impedance bridges (Maxwell and Hay) [BASIC ELECTRICITY], for characterizing a multi-turn inductor at a fixed frequency. After doing that, a complete analysis on the circuit and measurement sensitivity and the bridge component accuracy must be carried out, in order to determine the limits for the parameter values obtained from the method. The virtual workbench (Figure 8) reproduces the signal generator, the multimeter used as detector, two resistive decades, a capacitive decade, and the inductor under test, represented by its series model. As Maxwell or Hay topology is chosen, the circuit connections are modified accordingly. When the user introduces the nominal values for the model parameters (Lx and Rx), the routine will vary them within the specified tolerance. Therefore the decades should be carefully adjusted around their design values in order to achieve a fine circuit balance (minimum reading on the multimeter display). Real and experimental calculated values can be monitored on the virtual bench panel, as well as the sensitivity parameters. The three routines which exploit the concepts involved in measuring systems using resistive or impedance bridges have proven to be very useful tools at the various stages of students’ learning process: -before the laboratory sessions, to visualize the components of the workbenches they are going to use; -concomitantly with lab sessions, for helping in circuit design and calculations; -after the lab sessions for simulating and checking the results obtained experimentally, as well as for reinforcing the definitions of sensitivity, which are complex and interdependent .
3.3 GETTING ACQUAINTED WITH A DIGITAL OSCILLOSCOPE Digital oscilloscopes have practically replaced analog scopes over the last years, becoming fundamental test components in any electrical measurement workbench, as they offer many capabilities and increasingly sophisticated resources. A virtual workbench (Figure1) has been developed, including a signal generator based on the HP33120A model, and a single channel digital oscilloscope, based on the HP54600B model [AGILENT TECHNOLOGIES]. After activating both On/Off keys on the front panel of the virtual instruments, the user must click the mouse upon the output terminal of the generator, and on the input terminal of the oscilloscope, to produce wire connections between them. Then, it becomes easy to get acquainted with their operation, since the control knobs operate exactly as in the real equipment. The function generator can provide sinusoidal, square, triangle, sawtooth and noise waveforms, with variable offset, frequency and amplitude. In the oscilloscope front panel, many controls can be set: signal coupling mode (AC,DC or GND); -Vertical Gain (volts/division); -Horizontal Sweep (Time/division); -Trigger level and slope; -Autoscale function; -Signal Inversion; -Parameter measurements: period, frequency, RMS, maximum, minimum and average values, peak-to-peak; and -Run/Stop modes (to choose between continuously upgrading the signal samples, or holding a certain waveform visualization on the screen). Apart from its educational application (as the students use the virtual oscilloscope routine to complement their experience with the real instruments), we envisage some other applications for vendors and manufacturers, as the VI provides a very handy tool for demonstrating equipment functionality and utilities. 3.4 RC AND RLC RESPONSES IN SINUSOIDAL STEADY-STATE The analysis of linear circuits under sinusoidal steady state is an important topic in Electric Circuit courses, as well as object of experiments in the Laboratory. Therefore, the routine previously developed with the virtual oscilloscope has been extended into two other versions, both including the function generator and the scope in a two-channel configuration. One of the
1080
workbenches comprises a virtual RC series circuit, and the other, a virtual RLC parallel circuit (Figures 9 and 10). The function generator output has been restricted to the sinusoidal waveform, with variable amplitude (0.2 to 20Vpp) and frequency (0.1mHz to 15MHz). Its internal 50 ohm impedance is taken into account in the circuit calculations. All the functions for the one-channel scope (item 3.3 above) have been duplicated for the second channel. Furthermore, apart from the waveform measurements already mentioned, one can also obtain the delay and phase between the two channels. Also, the button “±” on the front panel reproduces the visualization of mathematical operations between the two waveforms: (channel1 + channel2); (channel1 – channel2); and (channel1*channel2) on the screen. The user must turn on both instruments and activate the connections: from the generator to the circuit input, and linking the oscilloscope probes to the circuit nodes. In the RC circuit, channel 1 samples the voltage at the output of the generator, and channel 2 measures the voltage across the capacitor. The voltage across the resistor can be obtained through the operation (channel 1 – channel2), using the button “±”, as mentioned above. As the user varies the values of the R and C parameters, and the signal frequency and amplitude, the effects on the waveforms shown on the screen can be promptly visualized. Amplitudes and phase differences in the signals can be compared to calculated expected results. In the RLC circuit (Figure 10), the oscilloscope probes measure the common voltage across the three elements (R,L, and C) (channel1) and the voltage across a series 1kΩ resistor (channel2), which is proportional to the current through the parallel-connected elements. Therefore, variations on the circuit voltage and current can be analyzed as the input signal amplitude and frequency, and the values for the RLC parameters are altered. These routines have become useful tools for the second year students, helping them in training their phasor, impedance, admittance and resonance calculations of sinusoidal steady state operation of first and second order linear circuits [BERNARDO NETO].
3.5 HOW TRANSIENT RESPONSE DEPENDS ON THE NATURAL COMPLEX FREQUENCIES OF RLC CIRCUITS
The concept of natural complex frequencies and their correlation on the transient responses of linear circuits is a fundamental topic in Electric Circuit theory [DORF], and in analog mechanical system. In the Lab, an experiment is proposed [BASIC ELECTRICITY] for determining the damping coefficient and damped oscillation frequency (real part and imaginary part of the natural complex frequencies) of a parallel RLC circuit, from its oscillatory response to a pulsed excitation. The period of the excitation waveform is chosen to be much longer than the natural period of oscillation (so that the uprising of the pulsed waveform will actually represent a step source), and the circuit resistive losses are complemented by a resistive decade, so that it can be varied for adjusting the circuit parameters to an under-damped condition. By measuring with the oscilloscope, the oscillation period and a few successive exponentially damped amplitudes of the circuit response, the students can extract the numerical values of the natural complex frequencies of the RLC circuit. The workbench related to this experiment has gained its virtual version (Figure 11), with much more flexibility, as the virtual circuit parameters can be freely varied, and the circuit response visualized on the one-channel oscilloscope screen. The output of the virtual function generator is restricted to the square waveform, for which the user can adjust the amplitude and frequency. The three kinds of second-order responses are contained in the algorithm: under-damped, critically damped and over-damped condition. As the user selects the circuit parameters, the natural complex frequencies are calculated and displayed on the workbench front panel, so that the students can correlate these values (real or complex) to the waveform of the corresponding transient response.
4 CONCLUSIONS In this paper we described tools that employ the concept of virtual instruments as
reproductions of conventional measurement equipment, developed with the graphical software language LabVIEW. The front panel as well as the main resources and functions of some instruments, with accessories and cables have been interconnected in comprehensive virtual
1081
workbenches, so that these virtual instruments can be operated by using the computer mouse and keyboard, and the measurement procedures can be simulated as they are performed in a real world laboratory bench. The folllowing applications of these virtual workbenches in Electrical Engineering Education, at Escola Politécnica, University of São Paulo, Brazil, have been demonstrated: Understanding the frequency response of Multimeters; Designing resistive and inductive bridge circuits with high sensitivity; Getting acquainted with a digital oscilloscope; RC and RLC responses in sinusoidal steady-state; How transient response depends on the natural complex frequencies of RLC circuits. The developed programs are being successfully used as complementary laboratory tools for helping third year Electrical Engineering students in becoming familiar with basic measurement instrumentation and methods, and also as supporting teaching tools for second year students at electric circuit courses, in providing easy and immediate visualization of circuit responses at chosen parameter conditions. Although the procedure proposed in this work is not meant for replacing real laboratory experiments, a by-product of the executables is their application in complementing distance learning, where hardware availability may be limited. Apart from its educational usefulness, some other applications are envisaged for vendors and manufacturers, as the developed VIs provide a very handy tool for demonstrating equipment functionality and utilities.
ACKNOWLEDGMENTS During the development of this work, the authors M.F. Azevedo and R.C. Rogeri received scholarships from CNPq (Brazilian Council for Research and Development), under PIBIC-Undergraduate Research Program, and O.Bernardo Neto received a scholarship from FAPESP (The State of São Paulo Research Foundation), under contract No. 01/00859-4.
REFERENCES AGILENT, <URL: http://www.agilent.com>; AGILENT TECHNOLOGIES, Test & Measurement Catalogue, 2000. APPLICATION BUILDER, LabVIEW, National Instruments, Austin, Texas, 1998. AZEVEDO, M.F. ; CONSONNI, D.; Operation and Evaluation of Analog and Digital Multimeters
using Virtual Instrumentation, In Proceedings of the 8th International Undergraduate Research Symposium, São Carlos, Nov. 2000, 108, (in portuguese).
AZEVEDO, M.F., CONSONNI, D.; Study of Resistive Bridges using Virtual Instrumentation, In Proceedings of the 8th International Undergraduate Research Symposium, São Carlos, Nov. 2000, 109, (in portuguese).
BASIC ELECTRICITY Laboratory I and II, several authors; Departamento de Engenharia de Sistemas Eletrônicos, EPUSP, 2003,(in portuguese).
BENETAZZO, L. et alli.; A Web-Based Distributed Virtual Educational Laboratory, In IEEE Transactions on Instrumentation and Measurement, vol. 49, No. 2, April 2000, pp. 349-355.
BERNARDO NETO, O., ROGERI, R.C., CONSONNI, D.; Application of Virtual Instrumentation to the Study of a RLC Circuit, In Proceedings of the 10th International Undergraduate Research Symposium, São Carlos, Nov. 2002, 1135, (in portuguese).
BISHOP, R.H., Learning with LabVIEW, Addison-Wesley, 1999. CONSONNI, D., SEABRA, A.C.; A modern approach to teaching basic experimental electricity
and electronics, In IEEE Trans. on Education, Vol.44, No.1, February 2001, pp.5-15. COOMBS Jr., C.F.; Electronic Instrument Handbook, Mc-Graw Hill, 2nd edition, 1995. CRISTALDI, L., FERRERO, A., PIURI, V.; Programmable Instruments, Virtual Instruments and
Distributed Measurement Systems: What is really useful, innovative and technically sound?, In IEEE Instrumentation and Measurement Magazine, September 1999, pp. 20-27.
DORF, R.C., SVOBODA, J.A.; Introduction to Electric Circuits, John Wiley & Sons, Third Edition, 1996.
EDUCATORS CORNER, AGILENT, <URL: http://www.educatorscorner.com>
1082
FERRERO, A., PIURI, V.; A Simulation Tool for Virtual Laboratory Experiments in a WWW Environment, In IEEE Transactions on Instrumentation and Measurement, vol. 48, No. 3, June 1999, pp. 741-746.
GOLDBERG, H.; What is Virtual Instrumentation?, In IEEE Instrumentation and Measurement Magazine, December 2000, pp. 10-13.
JOHNSON, G. W.; LabVIEW Graphical programming: Practical applications in instrumentation and control, McGraw-Hill, 1994.
LABVIEW Graphical Programming for Instrumentation, National Instruments, Austin, TX, Version 5.0, 1998 <URL: http://www.ni.com> LATCHMAN, H.A., SALZMANN, C., GILLET, D., BOUZEKRI,
H.; Information Technology Enhanced Learning in Distance and Conventional Education, In IEEE Transactions on Education, Vol.42, No.4, Nov. 1999, pp.247-254.
NI, National Instruments, <URL: http://www.ni.com> SHEN, H. et alli.; Conducting Laboratory Experiments over the Internet, In IEEE Transactions on
Education, vol.42, No. 3, August 1999, pp. 180-185. TEKTRONIX, <URL: http://www.tektronix.com>; THIRIET, J.M. et alli.; Toward a Pan-European Virtual University in Electrical and Information
Engineering, In IEEE Transactions on Education, vol.45, No.2, May 2002, pp. 152-160. USER MANUAL, LabVIEW , National Instruments, Austin, Texas, 1998.
FIGURES
Figure 1 Front panel of virtual digital oscilloscope connected to virtual function generator.
Figure 2 Front panel of virtual workbench for measuring the frequency response of an analog
multimeter.
1083
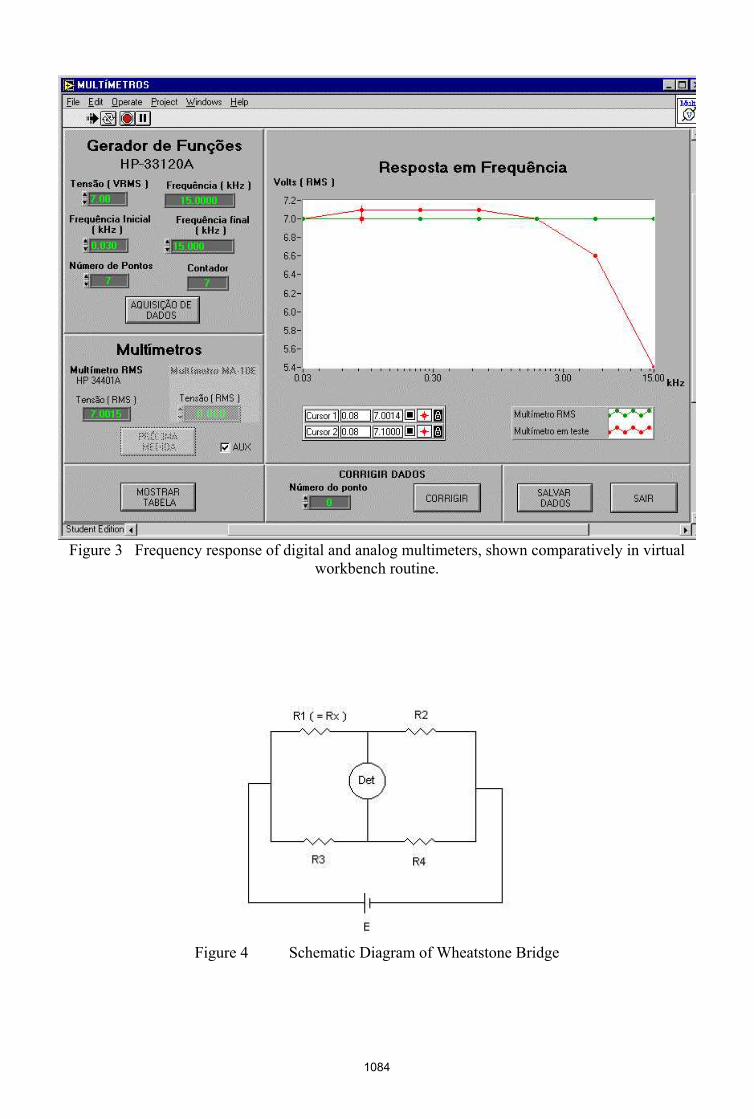
Figure 3 Frequency response of digital and analog multimeters, shown comparatively in virtual
workbench routine.
Figure 4 Schematic Diagram of Wheatstone Bridge
1084
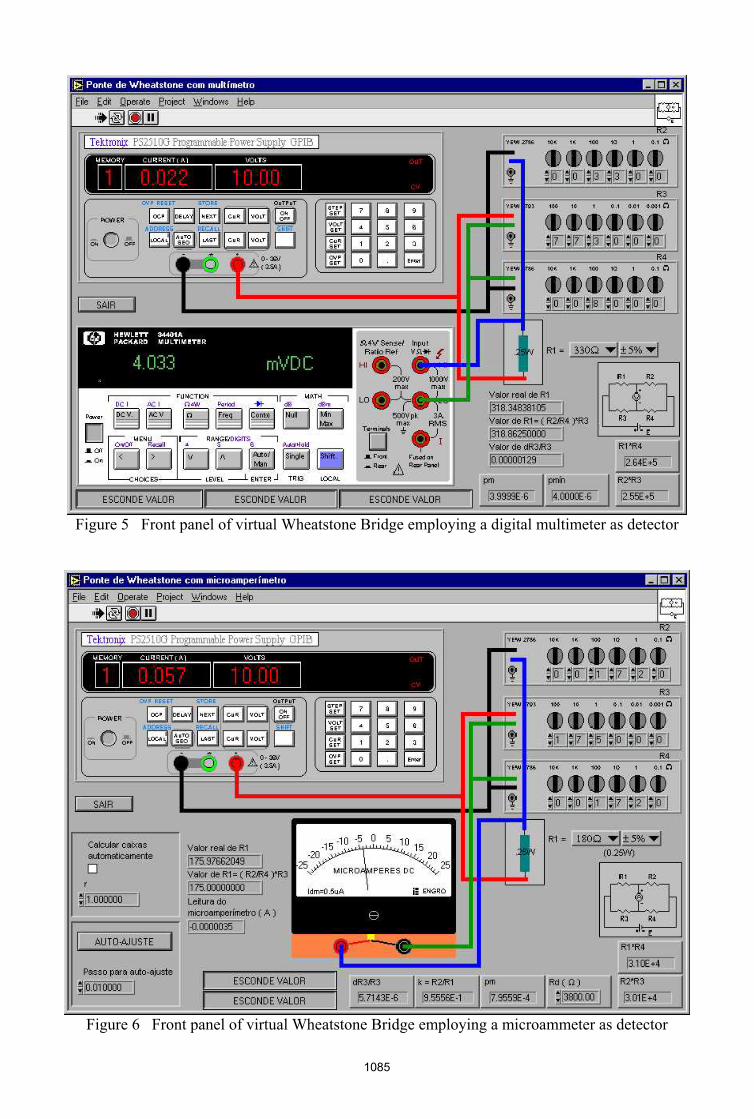
Figure 5 Front panel of virtual Wheatstone Bridge employing a digital multimeter as detector
Figure 6 Front panel of virtual Wheatstone Bridge employing a microammeter as detector
1085
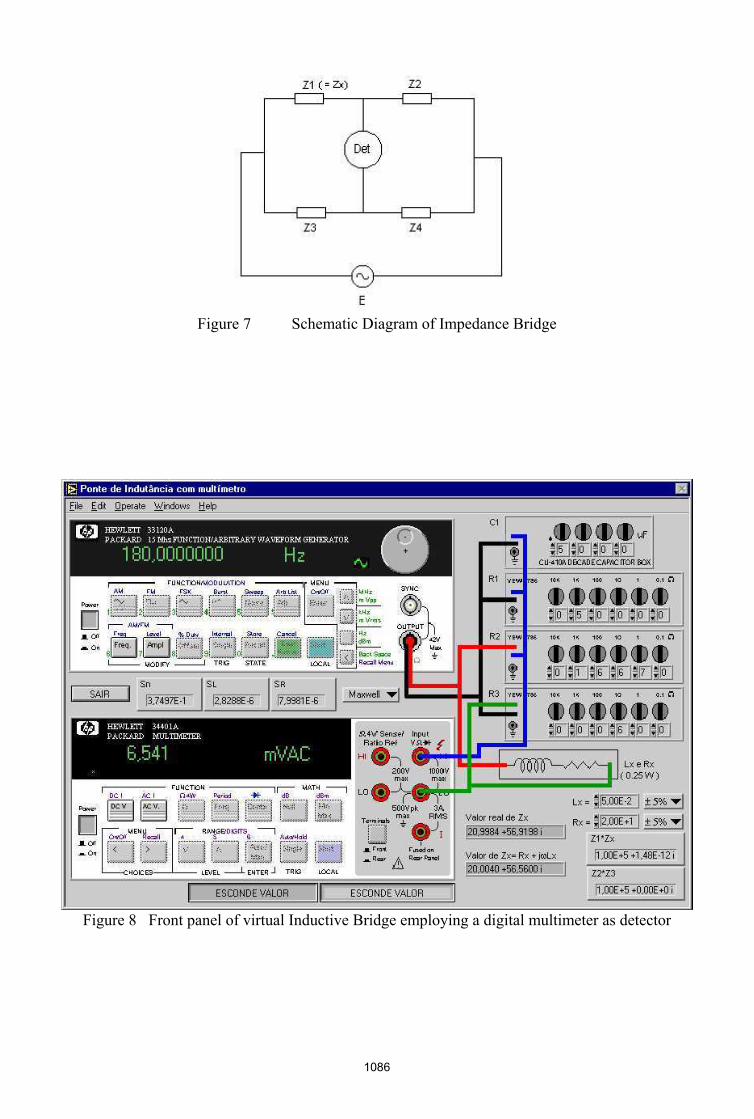
Figure 7 Schematic Diagram of Impedance Bridge
Figure 8 Front panel of virtual Inductive Bridge employing a digital multimeter as detector
1086
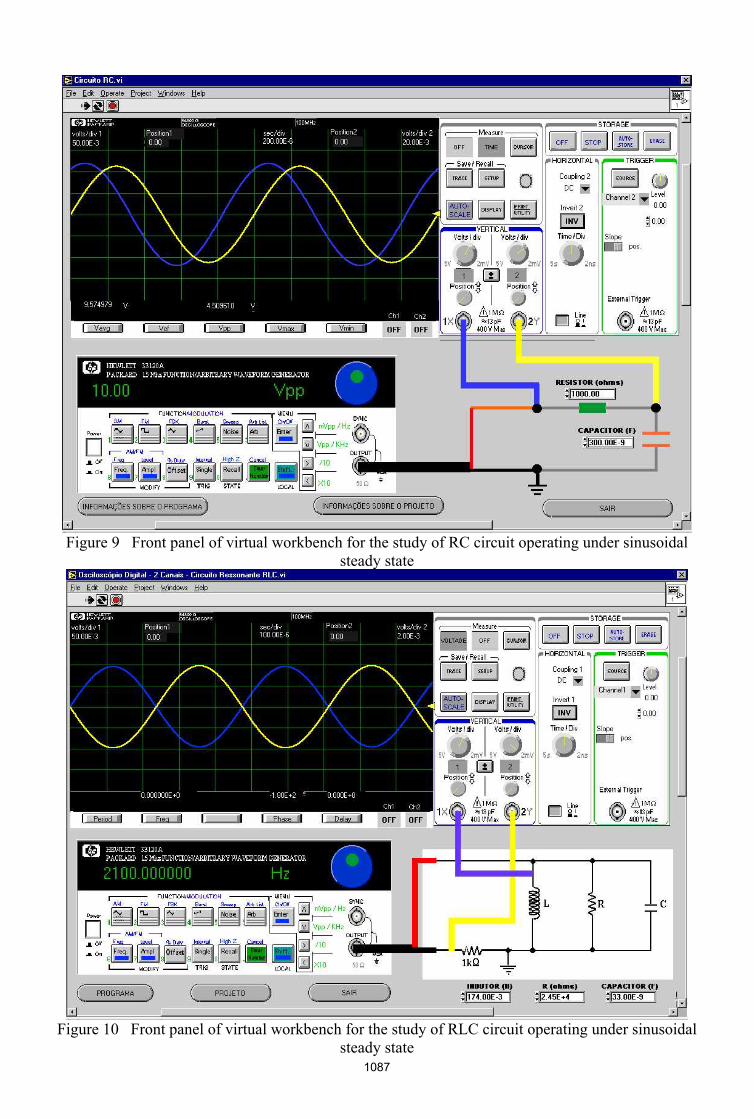
Figure 9 Front panel of virtual workbench for the study of RC circuit operating under sinusoidal
steady state
Figure 10 Front panel of virtual workbench for the study of RLC circuit operating under sinusoidal
steady state 1087
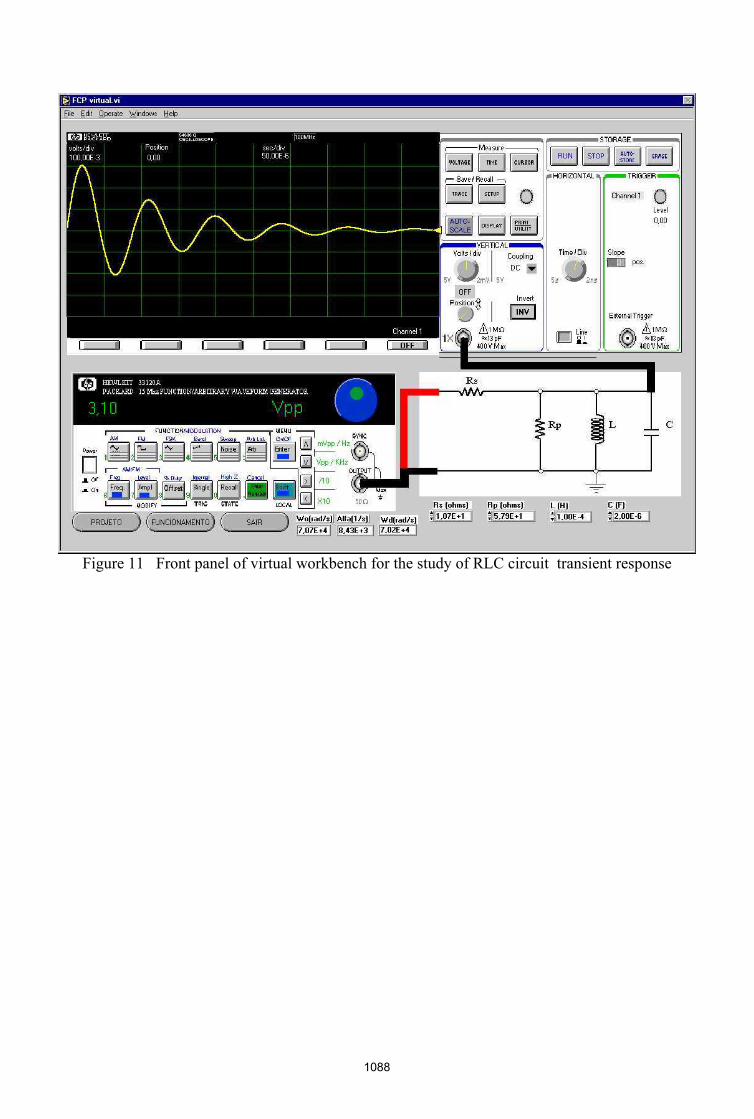
Figure 11 Front panel of virtual workbench for the study of RLC circuit transient response
1088