Embed Size (px)
Citation preview

APPLICATIONS OF IONIC LIQUIDS IN ELECTROCHEMICAL AND CATALYTIC STUDIES
Robbe Vervecken
Thesis to obtain the Master of Science Degree in
Chemical Engineering
Supervisor: Prof. Luísa Margarida Dias Ribeiro de Sousa Martins
Prof. Tom Breugelmans
Jury
Chairperson: Prof. Benilde de Jesus Vieira Saramago
Supervisor: Prof. Luísa Margarida Dias Ribeiro de Sousa Martins
Members of the comittee: Prof. Maria Matilde Soares Duarte Marques
Dr. Ana Paula da Costa Ribeiro
June 2015


I
Acknowledgements
First and foremost I would like to thank my supervisor, Professor Luísa Margarida Martins for
introducing me to the topic of electrochemistry, the production of a poster for iFEQB and the support
along the way. A special thank you for the corrections and alteration at the end, when the challenging
deadline was approaching is in place. These fast adjustment made it possible to finish on time.
Professor Armando J.L. Pombeiro is to be thanked for accepting me in the research group and the
interest shown in my work. The help and support of professor Tom Breugelmans on both the search
for a topic as the support throughout the internship are greatly appreciated.
Professor Ângela Santos is to be thanked for the tutoring, when it comes to the usage of the density
meter. Dmytro Nesterov and Rogério Chay deserve an acknowledgement for the brief explanation of
some techniques used.
I would like to thank all my colleagues for their contribution in making this an interesting yet amusing
learning process. Herein my gratefulness goes out to Ana Paula Ribeiro, Marta Mendes, Jiawei Wang,
Elisa Spada, Anbu Sellamuthu, Anup Paul and Gonçalo Tiago.
Last but not least I would like to thank Romy Beaucage, Hilde Kemland and Dean Dudha for the
mental support.
II
Abstract
Since the foundation of ‘green chemistry’ new ways are being searched to reduce waste generation
and minimize the hazards in manufacturing processes. Ionic liquids fit perfectly in this ideology,
making them a big field of interest. Their high thermal stability, absence of vapor pressure, relatively
undemanding manufacture etc. makes them an excellent replacement for molecular solvents in many
cases.
In this work, several ionic liquids were investigated regarding their electrochemical and catalytic
properties as well as their ability to extract and oxidize different pigments.
Seven room-temperature ionic liquids formed from a combination of cations 1-alkyl-3-
methylimidazolium (alkyl = butyl, hexyl or octyl, [Cnmim]+, n = 4, 6 or 8),
trihexyl(tetradecyl)phosphonium ([P6.6.6.14]+) or N-methyl-N,N,N-trioctyloctan-1-ammonium, and anions
bis(trifluoromethylsulfonyl)imide ([(CF3SO2)2N]-), [NTf2]-), dicyanamide ([DCA]-) or chloride, were
investigated by cyclic voltammetry. The usable potential range of the said ionic liquids as well as the
effect of their water content and the behavior of ferrocene in those media were investigated.
The applicability of trihexyl(tetredecyl)phosphonium dicyanimide, [P6,6,6,14][DCA], to the selective
oxidation of cyclohexane to the cyclohexanol and cyclohexanone mixture catalysed by ferrocene,
under mild conditions, was explored for the first time.
Moreover, liquid-liquid extraction of eight pigments by [P6,6,6,14][DCA] and the effectiveness of the
extraction was examined in several conditions, such as exposure to the sun and in the presence of
30% hydrogen peroxide.
Keywords: Ionic liquids, electrochemistry, catalytic oxidation, cyclohexane, pigments, liquid-liquid
extraction
III
Resumo
Desde o aparecimento da "química verde" estão a ser investigadas novas metedologias para reduzir
a geração de resíduos e minimizar os riscos nos processos de fabrico. Os líquidos iónicos encaixam-
se perfeitamente nesta ideologia, tendo-se tornado numa área de grande interesse. A sua elevada
estabilidade térmica, ausência de pressão de vapor, fabrico relativamente pouco exigente, etc., torna-
os frequentemente excelentes substitutos de solventes moleculares.
No presente trabalho foram investigadas as propriedades electroquímicas e catalíticas de vários
líquidos iónicos bem como a sus capacidade para extrair e oxidar diferentes pigmentos.
O comportamento electroquímico de sete líquidos iónicos à temperatura ambiente, formados pela
combinação dos catiões 1-alquil-3-metlimidazólio (alquil = butil, hexil ou octil, [Cnmim]+, n = 4, 6 ou 8),
trihexil(tetradecil)fosfónio ([P6.6.6.14]+) ou N-metil-N,N,N-trioctiloctan-1-amónio, e aniões
bis(trifluorometilsulfonil)imida (([CF3SO2)2N]-, [NTf2]-), dicianamida ([DCA]-) ou cloreto, foi investigado
por voltametria cíclica. Foi determinada a gama de potential útil dos referidos líquidos iónicos, bem
como o efeito do teor de água nessa gama de potencial e o comportamento electroquímico do
ferroceno nesses meios.
Foi também explorada, pela primeira vez, a aplicabilidade da dicianamida de
trihexil(tetradecil)fosfónio, [P6,6,6,14][DCA], na oxidação seletiva de ciclohexano à mistura de
ciclohexanol e ciclohexanona catalisada pelo ferrocene, sob condições moderadas.
Foi ainda examinada a eficiência da dicianamida de trihexil(tetradecil)fosfónio, [P6,6,6,14][DCA], para a
extração líquido-líquido de oito pigmentos em diferentes condições operatórias, tais como a exposição
ao sol e na presença de peróxido de hidrogénio.
IV
Table of contents
INTRODUCTION ......................................................................................................... 1
Ionic liquids .............................................................................................................................. 1
Structure .................................................................................................................................. 1 Physicochemical properties .................................................................................................... 4 Electrochemical behavior ........................................................................................................ 7 Catalytic application for the oxidation of cycloalkanes .......................................................... 11
1.1.5 Possible ecological effects ........................................................................................................... 12
Pigments ................................................................................................................................ 13
Hazards ................................................................................................................................. 13 Treatment of wastewater ....................................................................................................... 14 Characterization of dyes ....................................................................................................... 15 Extraction of dyes from aqueous solution with ionic liquids .................................................. 17 Effect of physical properties on the LLE of dyes ................................................................... 18
EXPERIMENTAL PROCEDURE ............................................................................... 19
Material .................................................................................................................................. 19
Equipment .............................................................................................................................. 19
Procedure .............................................................................................................................. 22
Density .................................................................................................................................. 22 Cyclic voltammetry ................................................................................................................ 22 Peroxidative oxidation of cyclohexane .................................................................................. 23 Pigments ............................................................................................................................... 24 Synthesis C6mimBF4 ............................................................................................................. 26
RESULTS AND DISCUSSION .................................................................................. 28
Density ................................................................................................................................... 28
Electrochemical behaviour of ionic liquids ............................................................................. 29
Peroxidative oxidation of cyclohexane .................................................................................. 38
Pigments ................................................................................................................................ 41
Amaranth C.I. 16185 ............................................................................................................. 45 Rhodamine 6G C.I. 45160 .................................................................................................... 48 Chrysoidine C.I. 11270 .......................................................................................................... 51 Indigo C.I. 73015 A................................................................................................................ 53 Tartrazine C.I. 19140............................................................................................................. 56 Malachite green C.I. 42000 ................................................................................................... 59 Methyl violet C.I. 42535 ......................................................................................................... 62 Methylene blue C.I. 52015 .................................................................................................... 65
Rate of reaction ..................................................................................................................... 68
Discussion ............................................................................................................................. 69
Density .................................................................................................................................. 69 Electrochemical behaviour of ionic liquids ............................................................................ 69 Peroxidative oxidation of cyclohexane .................................................................................. 70 Pigments ............................................................................................................................... 70

V
CONCLUSIONS AND FUTURE WORK .................................................................... 72
REFERENCE......................................................................................................................................... 74
ANNEX ............................................................................................................................................... 83
Annex 1 .................................................................................................................................................. 83
Annex 2 .................................................................................................................................................. 84

VI
Glossary
Alliquat 336 N-methyl-N,N,N-trioctyloctan-1-ammonium chloride
AOP advanced oxidation processes
BOD biochemical oxygen demand
[C2mim] 1-ethyl-3-methylimidazolium
[C3mpyr] 1-methyl-1-propyl-pyrrolidinium
[C4mim] 1-butyl-3-methylimidazolium
[C4mpyr] 1-methyl-1-butyl-pyrrolidinium
[C6mim] 1-hexyl-3-methylimidazolium
[C8mim] 1-octyl-3-methylimidazolium
[Cnmim] 1-alkyl-3-methylimidazolium
C.I. color index
CNT carbon nanotubes
COD chemical oxygen demand
CV cyclic voltammetry
D distribution ratio
[DCA] dicyanamide
[DPyAM]BR2.2HBr N,N′-bis-2-aminoethyl-4,4′-bipyridinium dibromide dihydrobromide
Fc° ferrocene
Fc+ ferrocenium
GC gas chromatograph
[Gmim][Cl] 1-glycyl-3-methyl imidazolium chloride
IL ionic liquid
IL105 trihexyl(tetradecyl)phosphonium
LLE liquid-liquid extraction
MV methyl violet
[OMA] trioctyl(methyl)ammonium
[PCA] pyrazine carboxylic acid
[NTf2] bis(trifluoromethylsulfonyl)imide
[N4.1.1.1] butyltrimethylammonium
[N8.8.8.1] N-methyl-N,N,N-trioctyloctan-1-ammonium
[P6,6,6,14] trihexyl(tetradecyl)phosphonium
QRE quasi-reference electrode
SS suspended solids
TBHP tert-butyl hydroperoxide
TOC total organic carbon
TOF turnover frequency

VII
TON turnover number
TS-1 titanium containing zeolite
VOC volatile organic compounds
VTF Vogel-Tamman-Fulcher

VIII
List of figures
Figure 1.1 A comparison of electrical conductivity versus temperature for ionic liquids with 1-butyl-3-methylimidazolium ([C4mim]+) as the cation and several anions, namely bis[(trifluormethyl)sulfonyl]imide ([NTf2]-), hexafluorophosphate ([PF6]-) and tetrafluoroborate ([BF4]-) ..................................................................................... 4
Figure 1.2 A comparison of density versus temperature for ionic liquids with [P6.6.6.14]+ as the cation and several anions with a mentioning of the water content in percentages; [DCA]- (0.01 %), [Cl]- (0.03 %), [NTf2]- (0.04 %) and [Br]- (0.02 %) .................................................................................................................................................... 5
Figure 1.3 A comparison of density versus time for ionic liquids with [DCA]- as the anion and several cations with a mentioning of the water content in percentages; [C4mim]+ (0.00 %), [C4mpyr]+ (<0.15 %), [P6.6.6.14]+ (0.01 %) and [C2mim]+ (0.17 %) .................................................................................................................................................... 6
Figure 1.4 Viscosity versus time for ionic liquids with a mentioning of the water content in percentages; [P6.6.6.14][DCA] (0.01 %), [N4.1.1.1][NTf2] (0.01 %), [OMA][NTf2] (0.05 %), [C2mim][NTf2] (0.05 %), [C2mim][DCA] (0.19 %) and [C2mim][EtSO4] (0.01 %-0.04 %) ........................................................................................................ 7
Figure 1.5 Absorption of water from atmospheric air at ambient temperature and moisture, with constant stirring as a function of exposure. (∆) corresponds to [C8mim][NO3], (*) to [C8mim]Cl, (0) to [C4mim][BF4] and (□) to [C4mim][PF6]. [51] .................................................................................................................................................... 9
Figure 1.6 Peroxidative oxidation of cyclohexane to cyclohexanol and cyclohexanone. ....................................... 11
Figure 1.7 The structure of Indigo and the presence of auxochromes (blue) and chromophores (red). ................ 13
Figure 1.8 Structure and designation of the considered dyes. .............................................................................. 16
Figure 2.1 The DSA 5000 M Anthon Paar densitymeter ........................................................................................ 19
Figure 2.2 Nitrogen bottle, with a valve connected to a three electrode electrolyses cell, connected to the Potentiostat/galvanostat Model 273 A by EG&G Princeton Apllied Research ...................................................... 20
Figure 2.3 A three electrode system with a Silver pseudo-reference electrode and a Platinum auxiliary- and working electrode. ................................................................................................................................................. 20
Figure 2.4 Oil bath on a heating plate .................................................................................................................... 21
Figure 2.5 Vacuum line .......................................................................................................................................... 21
Figure 2.6 Karl Fischer 831 Coulometer ................................................................................................................ 22
Figure 2.7 Biphasic mixture of IL105 and H2O ....................................................................................................... 24
Figure 2.8 The byphasic solution generated at the synthesis of [C6mim][BF4] ...................................................... 26
Figure 3.1 Density plotted against the temperature; a comparison between literature results by Klomfar et al. [139], Diogo et al. [140], Tariq et al. [141], Neves et al. [142] and measurements using the DSA 5000M Anthon
Paar density meter. ............................................................................................................................................... 28
Figure 3.2 Cyclic voltammograms of [C4mim][NTf2] (blue) and [C8mim][NTf2] (red), at a platinum disk working electrode; v, 200 mVs-1. Potentials are vs. an Ag quasi-reference electrode (QRE). ........................................... 32
Figure 3.3 Cyclic voltammogram of [P6.6.6.14][DCA] (0.19 % water) at a platinum disk working electrode; v, 200 mVs-1. Potentials are vs. an Ag quasi-reference electrode (QRE). ....................................................................... 33
Figure 3.4 Cyclic voltammograms of [C4mim][NTf2] for different water contents; 1.00 % (red), 1.50 % (green), 3.12 % (purple), 4.95 % (light-blue) and 6.34 % (dark-blue) at a platinum disk working electrode; v, 200 mVs-1. Potentials are vs. an Ag quasi-reference electrode. .............................................................................................. 33
Figure 3.5 Potential window available in [C4mim][NTf2], [C6mim][NTf2] and [C8mim][NTf2] for different water contents at a platinum disk working electrode; v, 200 mVs-1. Potentials are vs. an Ag quasi-reference electrode (QRE). ................................................................................................................................................................... 34
Figure 3.6 Potential window available in ILs consisting of [Cl] as an anion and [P6.6.6.14], [N1.8.8.8] (in Aliquat 336) and [C6mim] as a cation for different water contents at a platinum disk working electrode; v, 200 mVs-1. Potentials are vs. an Ag quasi-reference electrode ............................................................................................... 35
Figure 3.7 Potential window available in ILs consisting of [P6.6.6.14]+ as a cation and [Cl]- and [DCA]- as an anion for different water contents at a platinum disk working electrode; v, 200 mVs-1. Potentials are vs. an Ag quasi-reference electrode (QRE). .......................................................................................................................... 35

IX
Figure 3.8 Potential window available in ILs consisting of [C6mim]+ as a cation and [Cl]- and [NTf2]- as an anion for different water contents at a platinum disk working electrode; v, 200 mVs-1. Potentials are vs. an Ag quasi-reference electrode (QRE). .................................................................................................................................... 36
Figure 3.9 Cyclic voltammograms of ferrocene in [C6mim][NTf2] at a platinum disk working electrode; v, 200 mVs-1. Potentials are vs. an Ag quasi-reference electrode (QRE). ............................................................................... 37
Figure 3.10 Proposed mechanism for cyclohexane oxidation via free-radical reaction pathway over ferrocene as catalyst, making use of TBHP as oxidant. [104] .................................................................................................... 40
Figure 3.11 The evolution of the liquid-liquid extraction of amaranth by IL105 in time at pH’s of 2, 7 and 12 ....... 46
Figure 3.12 The evolution of the absorbance of Amaranth in time when influenced by 30 % H2O2 at pH=7, Right corner: The Napierian logarithm of the ratio of absorbance and the initial absorbance of Amaranth vs. time ....... 47
Figure 3.13 The evolution of the liquid-liquid extraction of Rhodamine 6G by IL105 in time and pH. .................... 49
Figure 3.14 The evolution of the absorbance of Rhodamine 6G in time when influenced by 30 % H2O2 at pH=7, Right corner: The Napierian logarithm of the ratio of absorbance and the initial absorbance of Rhodamine 6G vs. time ........................................................................................................................................................................ 50
Figure 3.15 The evolution of the liquid-liquid extraction of chrysoidine by IL105 in time ....................................... 51
Figure 3.16 The evolution of the absorbance of Chrysoidine in time when influenced by 30 % H2O2 at pH=7, Right corner: The Napierian logarithm of the ratio of absorbance and the initial absorbance of Chrysoidine vs. time .... 53
Figure 3.17 The evolution of the liquid-liquid extraction of indigo by IL105 in time and pH. .................................. 54
Figure 3.18 The evolution of the absorbance of Indigo in time when influenced by 30 % H2O2 at pH=7, Right corner: The Napierian logarithm of the ratio of absorbance and the initial absorbance of Indigo vs. time ............. 56
Figure 3.19 The evolution of the liquid-liquid extraction of tartrazine by IL105 in time and pH. ............................. 57
Figure 3.20 The evolution of the absorbance of Tartrazine in time when influenced by 30 % H2O2 at pH=7, Right corner: The Napierian logarithm of the ratio of absorbance and the initial absorbance of Tartrazine vs. time. ...... 59
Figure 3.21 The evolution of the liquid-liquid extraction of malachite green by IL105 in time ................................ 60
Figure 3.22 The evolution of the absorbance of Malachite green in time when influenced by 30 % H2O2 at pH=7, Right corner: The Napierian logarithm of the ratio of absorbance and the initial absorbance of Malachite green vs.
time. ....................................................................................................................................................................... 61
Figure 3.23 The evolution of the liquid-liquid extraction of methyl violet by IL105 in time and pH. ........................ 63
Figure 3.24 The evolution of the absorbance of Methyl violet in time when influenced by 30 % H2O2 at pH=7, Right corner: The Napierian logarithm of the ratio of absorbance and the initial absorbance of Methyl violet vs.
time. ....................................................................................................................................................................... 64
Figure 3.25 The evolution of the liquid-liquid extraction of methylene blue by IL105 in time ................................. 65
Figure 3.26 The evolution of the absorbance of Methylene blue in time when influenced by 30 % H2O2 at pH=7, Right corner: The Napierian logarithm of the ratio of absorbance and the initial absorbance of Methylene blue vs.
time. ....................................................................................................................................................................... 67
Figure 3.27 First order reaction rate vs. time for the oxidation of pigments with 30% hydrogen peroxide with respectively Amaranth ........................................................................................................................................... 68

X
List of Tables
Table 1.1 Common cations and anions of ionic liquids. ........................................................................................... 2
Table 1.2 Cyclic voltammetric data for ferrocene at a Pt electrode, in different ionic liquids................................. 10
Table 3.1 Structures and common designations of ionic liquids used for electrochemical stability window studies. .............................................................................................................................................................................. 29
Table 3.2 The oxidation potential, the reduction potential and the electrochemical window available in [P6.6.6.14][DCA], [P6,6,6,14][Cl], Alliquat 336, [C4mim][NTf2], [C6mim][NTf2], [C8mim][NTf2] and [C6mim][Cl] at a platinum disk working electrode; v, 200 mVs-1 ................................................................................................... 31
Table 3.3 Half-wave potential values for the[Fe(C5H5)2]+/0 redox process in different ionic liquids..................... 37
Table 3.4 Selected data for the catalytic oxidation of cyclohexane to cyclohexanol and cyclohexanone catalyzed by ferrocene in [P6.6.6.14][DCA]. .......................................................................................................................... 38
Table 3.5 Wavelength of Maximum Absorbance for the pigments at the studied pH values ................................. 41
Table 3.6 Visual comparison of respectively Amaranth, Rhodamine 6G Chrysoidine, Indigo, Tartrazine, Malachite green, Methyl violet and Methylene blue at a pH of 2, 7 and 12 after 5 minutes and 2.5 hours............................. 44
Table 3.7 Sun exposure of Amaranth with and without IL105 at pH=7 .................................................................. 45
Table 3.8 Oxidation of Amaranth by 30% H2O2 with and without IL105 at pH=7 .................................................. 47
Table 3.9 Sun exposure of Rhodamine 6G with and without IL105 ....................................................................... 48
Table 3.10 Oxidation of Rhodamine 6G by 30% H2O2 with and without IL105 ..................................................... 49
Table 3.11 Sun exposure of Chrysoidine with and without IL105 .......................................................................... 51
Table 3.12 Oxidation of Chrysoidine by 30% H2O2 with and without IL105 .......................................................... 52
Table 3.13 Sun exposure of Indigo with and without IL105 ................................................................................... 53
Table 3.14 Oxidation of indigo by 30% H2O2 with and without IL105 ................................................................... 55
Table 3.15 Sun exposure of Tartrazine with and without IL105 ............................................................................. 56
Table 3.16 Oxidation of Tartrazine by 30% H2O2 with and without IL105 ............................................................. 58
Table 3.17 Sun exposure of Malachite green with and without IL105 .................................................................... 59
Table 3.18 Oxidation of Malachite green by 30% H2O2 with and without IL105 ................................................... 61
Table 3.19 Sun exposure of Methyl violet with and without IL105 ......................................................................... 62
Table 3.20 Oxidation of Methyl violet by 30% H2O2 with and without IL105 ......................................................... 64
Table 3.21 Sun exposure of methylene blue with and without IL105 ..................................................................... 65
Table 3.22 Oxidation of Methylene blue by 30% H2O2 with and without IL105 ..................................................... 66
1
INTRODUCTION
Ionic liquids
To meet the demands of a growing population, the chemical processing industry has used yield
oriented procedures, without including in the process design a way of minimizing the waste production.
One of the major sources of waste is solvent losses that end up in the atmosphere or in ground water
[1-6]. Solvent use has been reported to account for about 60% of the overall energy in pharmaceutical
production, and it has been responsible for 50% of post-treatment greenhouse gas emissions [7,8].
The use of these materials has a detrimental effect on human health, safety and the environment. This
combined with their volatility and flammability led to increasing pressure for minimizing their use.
Therefore, solvent selection should be considered systematically to improve synthesis conditions
within the framework of green chemistry principles, [9] and there are a number of solvent selection
guides available in the literature [1-8]. Chemically, the solvent would have a high capacity to dissolve
the solute, in a little amount of volume. It would need to be inexpensive to produce, recyclable and
robust, to face various processing environments [9-11]. In fact, a large quantity of organic solvents is
used as liquid media for chemical reaction, extraction and formulation. Various methods and tools
have been developed for the identification and selection of appropriate solvents for synthesis.[1-8]
Recently, however, a new class of solvent has emerged that fit perfect in the idea of green chemistry,
namely ionic liquids. These solvents are often fluid at room temperature, and consist entirely of ionic
species. They’re non-flammable, have high thermal stability and are relatively undemanding and
inexpensive to manufacture. Another big advantage is the absence of a measurable vapor pressure,
with no emission of toxic, volatile organic compounds (VOC). Their special properties make them a
field of interest for chemists. Although ILs display many advantages, they have a high viscosity
compared with molecular solvents. This will have to be taken into account during experiments and
further use. [9,12,13]
Structure
Ionic liquids exist in two main categories, simple salts that consist of a single anion and cation, and
binary ionic liquids, where more than one cation or anion is present. [9,12,13]
The cation is an organic species, such as 1-butyl-3-methylimidazolium ([C4mim]+), 1-methyl-1-propyl-
pyrrolidinium ([C3mpyr]+), trihexyl(tetradecyl)phosphonium ([P6,6,6,14]+), 1-methyl-1-butyl-pyrrolidinium
([C4mpyr]+) and trioctyl(methyl)ammonium ([OMA]+) as shown in. The anion can be organic or
inorganic. Examples are bis(trifluoromethylsulfonyl)imide ([NTf2]-), hexafluorophosphate ([PF6]-),
dicyanimide ([DCA]-), tetrafluoroborate ([BF4]-) and ethyl sulfate ([C2SO4]-), Table 1.1. [1]
2
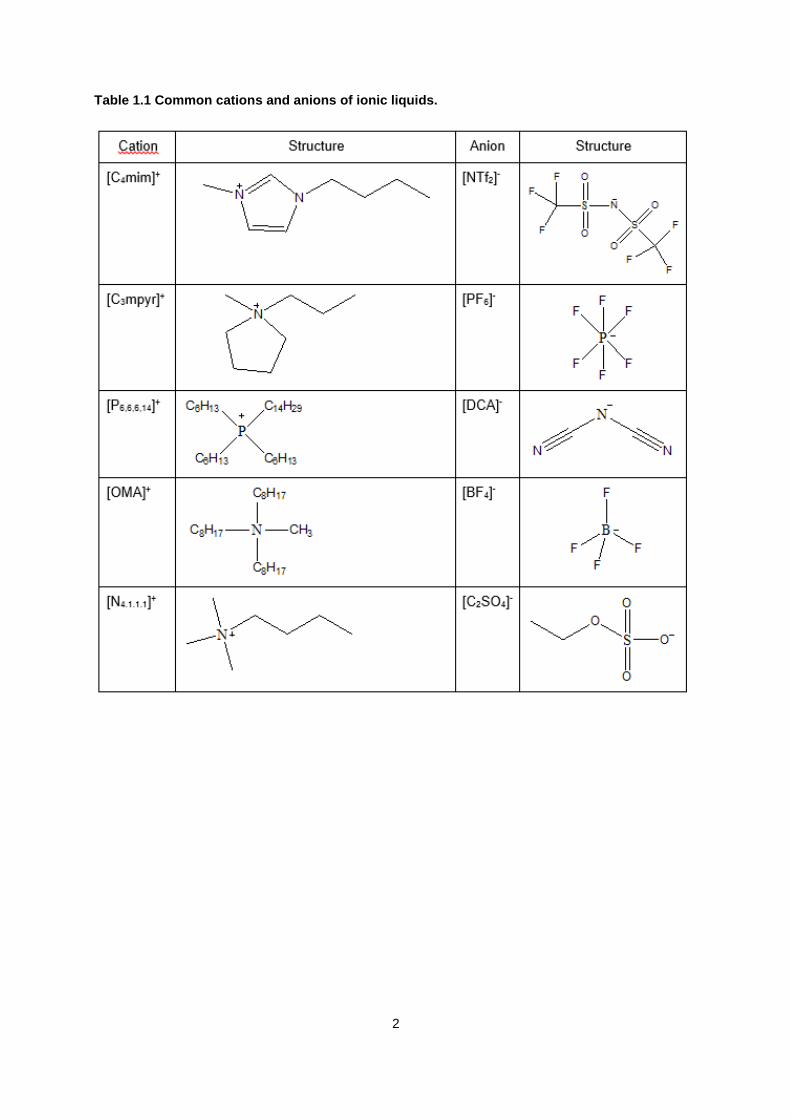
Table 1.1 Common cations and anions of ionic liquids.
3
ILs are called “designer solvents” because it is possible to tune the properties of the IL by changing
one of the components. In this way, the solvents can be designed with a particular end use in mind.
Melting point, density, hydrophobicity and also miscibility of water in ionic liquids can be changed
dependent on the structure. Preferentially ILs which are liquid at ambient temperature are used; they
are referred to as room temperature ionic liquids RTILs. [9,12,13] The reason why these salts are
liquid bellow 100 ºC, is the low symmetry and bulkiness of the cation. This lack of symmetry promotes
a reduction of the lattice energy of the crystalline form of the salt, lowering their melting points. The
anion on the other hand, mostly controls water miscibility, but the cation can also influence the
hydrophobicity or hydrogen bonding ability.
Since ILs are ionic, they will bear a charge. This charge is not localized on an atom, but it is distributed
all over the molecular structure. There is one exception on this matter and that is IL’s with a halogen
anion. The charge is worn by the halogen function itself. [14]
Supposedly ILs demonstrate a structural heterogeneity, where the aspects of chemical physics of ILs
can be ascribed to; this includes solvation, dynamics and transport. [15]
Phosphonium-based ILs are more recent than the imidazolium- and pyridinium-based ILs, and
cheaper to produce. They are more thermally stable (in some cases up to nearly 400˚C!) [16] in
comparison with ammonium and imidazolium salts, and this remarkable property makes them suitable
for reactions that are carried out at temperatures greater than 100˚C. Phosphonium- based ILs are
used as the catalyst and solvent for hydroformylation [17], palladium-catalyzed Heck reactions [17]
and palladium-mediated Suzuki cross-coupling reactions. [17] In addition, they are also powerful
phase-transfer catalysts for the Halex reaction [18]. Recently, phosphonium-based ILs have been
used for CO2 capture. [19].Along with their application in the synthesis of the styrenic derivatives of
phosphonium-based ILs, they are used as monomers in the synthesis of phosphonium-containing
random copolymers. [20]

4
Physicochemical properties
The nature and size of both anion and cation are determinative for the physicochemical properties of
IL’s.
Electrical Conductivity
ILs are molten salts at room temperature, which means they are conductive liquids. As published
previously [21] the electrical conductivity of pure ILs is relatively low, which is an impediment to
progress in numerous fields of the proposed electrochemical applications. In Figure 1.1 the trend of
imidazolium based ionic liquids is present.
The electrical conductivity dramatically increases with temperature, changing 1 order in magnitude in
the liquid state in a temperature increase of about 200 K. The theoretical analysis of the temperature
dependence of the electrical conductivity in liquid state indicates that most of the imidazolium and
phosphonium based ILs follows Vogel-Tamman-Fulcher (VTF) equation. The increase in the
conductivity with temperature also depends on the size of the anion and cation. The ratio in size of
both species and their interaction with one another seems to be the base for this behavior.
Unfortunately, there is still an unfilled gap in this area, giving space for new studies in this field.
Figure 1.1 A comparison of electrical conductivity versus temperature for ionic liquids with 1-
butyl-3-methylimidazolium ([C4mim]+) as the cation and several anions, namely
bis[(trifluormethyl)sulfonyl]imide ([NTf2]-), hexafluorophosphate ([PF6]-) and tetrafluoroborate
([BF4]-) [21]
5
Density
Density is an important factor in defining the nature of an ionic liquid. Usually ILs show a linearly
decrease in density with an increase in temperature. This is common in both phosphonium and
imidazolium based ionic liquids, over a wide range of temperature. As is determined in previous
studies on different ILs over a wide range of temperatures. [22-23] This is a logical consequence,
since an increase in temperature makes the molecules more mobile, resulting in a thermal expansion.
The differences in density, for very similar structures of ionic liquids are attributed to the presence of
additional hydrogen bonds. [22-23]
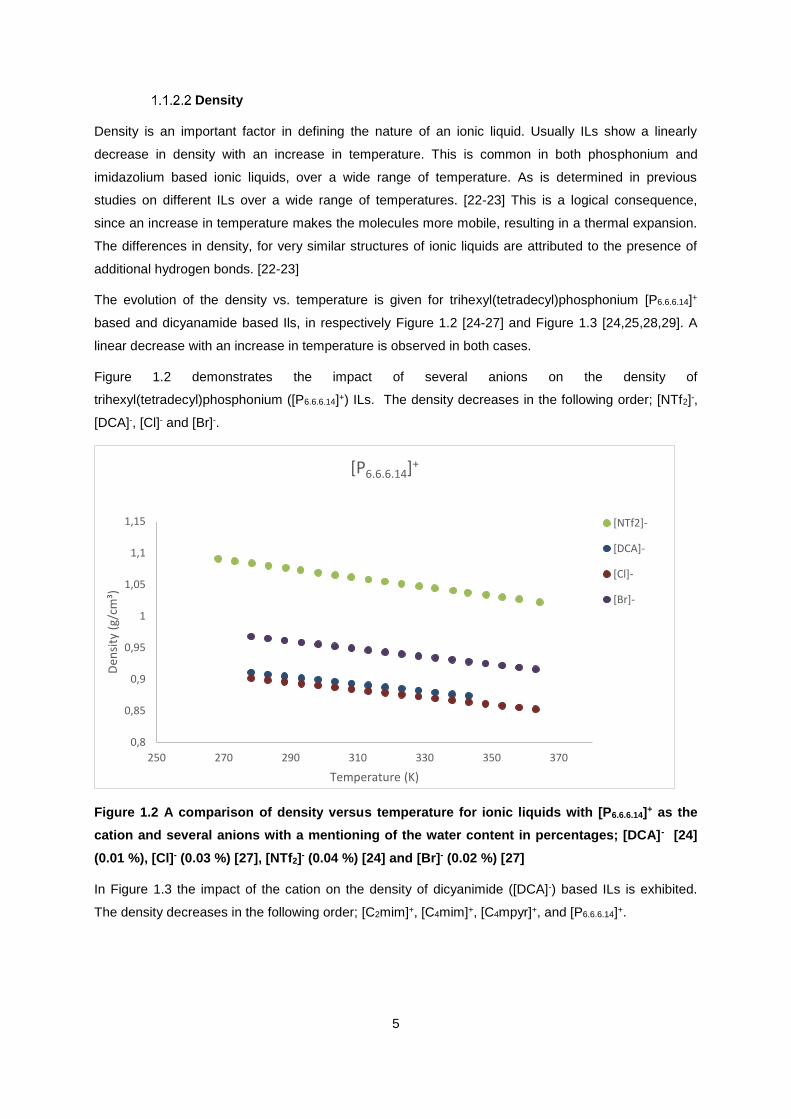
The evolution of the density vs. temperature is given for trihexyl(tetradecyl)phosphonium [P6.6.6.14]+
based and dicyanamide based Ils, in respectively Figure 1.2 [24-27] and Figure 1.3 [24,25,28,29]. A
linear decrease with an increase in temperature is observed in both cases.
Figure 1.2 demonstrates the impact of several anions on the density of
trihexyl(tetradecyl)phosphonium ([P6.6.6.14]+) ILs. The density decreases in the following order; [NTf2]-,
[DCA]-, [Cl]- and [Br]-.
Figure 1.2 A comparison of density versus temperature for ionic liquids with [P6.6.6.14]+ as the
cation and several anions with a mentioning of the water content in percentages; [DCA]- [24]
(0.01 %), [Cl]- (0.03 %) [27], [NTf2]- (0.04 %) [24] and [Br]- (0.02 %) [27]
In Figure 1.3 the impact of the cation on the density of dicyanimide ([DCA]-) based ILs is exhibited.
The density decreases in the following order; [C2mim]+, [C4mim]+, [C4mpyr]+, and [P6.6.6.14]+.
0,8
0,85
0,9
0,95
1
1,05
1,1
1,15
250 270 290 310 330 350 370
Den
sity
(g/
cm³)
Temperature (K)
[P6.6.6.14]+
[NTf2]-
[DCA]-
[Cl]-
[Br]-

6
Figure 1.3 A comparison of density versus time for ionic liquids with [DCA]- as the anion and
several cations with a mentioning of the water content in percentages; [C4mim]+ (0.00 %) [29],
[C4mpyr]+ (<0.15 %) [29], [P6.6.6.14]+ (0.01 %) [24] and [C2mim]+ (0.17 %) [28]
Both the anions as the cations have a considerable impact on the denisty of the ionic liquids, which
can be attributed to the presence of additional hydrogen bonds. [21,22]
Viscosity
Viscosity is an important macroscopic property of ionic liquids. This property is of considerable
importance for fluid flow calculations and equipment design. It determines the possibility of using fluids
as reaction media or solvents for transportation purposes. Mapping these values precisely, can reduce
the energy requirements for processing these fluids drastically. [21] It results from several microscopic
interactions such as van der Waals, columbic, hydrogen bonding and is considerably dependent upon
the size and shape of the ions. IL’s have a relatively high viscosity, which can be explained by IL
structure. [21,23]
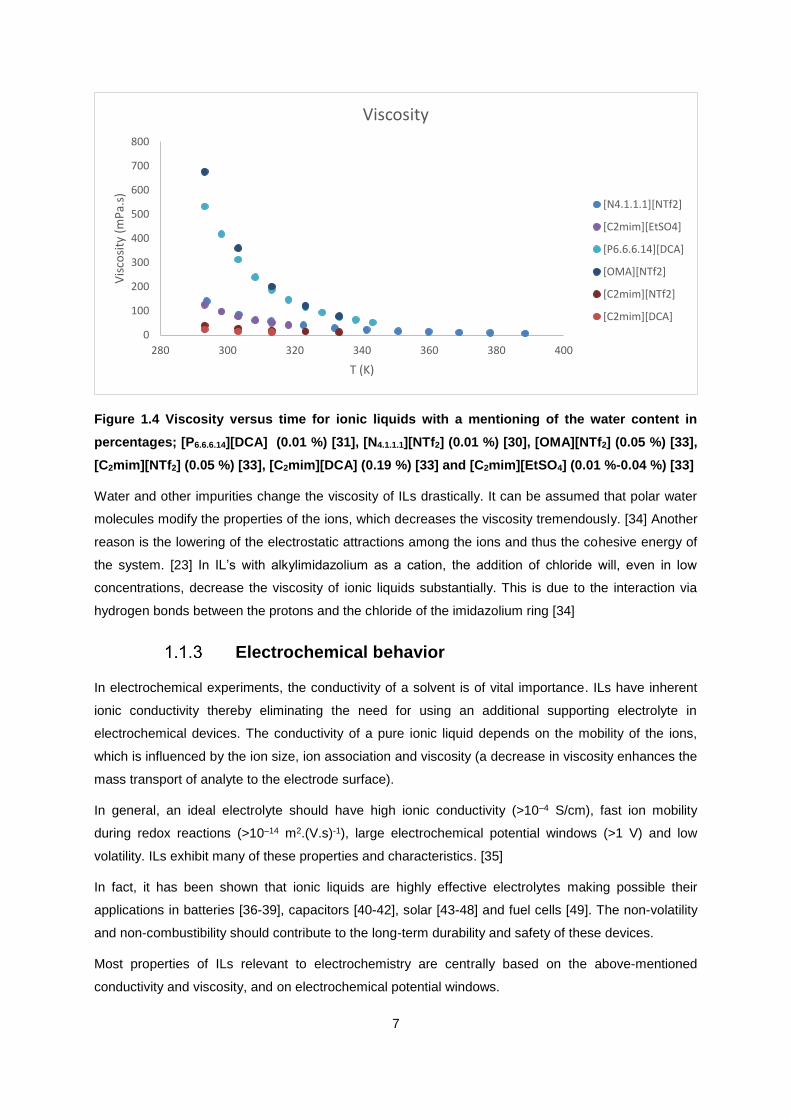
The effect of both the anion as the cation on the viscosity is analyzed in Figure 1.4, using several ionic
liquids; [P6.6.6.14][DCA], [N4.1.1.1][NTf2], [OMA][NTf2], [C2mim][NTf2], [C2mim][DCA] and [C2mim][C2SO4].
[30-33] The structure of the anion has a tremendous impact on the viscosity of an ionic liquid. When
[NTf2]- is taken as the anion, and only the cation is differed a considerable difference is seen. The
viscosity of the IL decreases in the order of [OMA]+, [N4.1.1.1]+ and [C2mim]+ with values, respectively
676.3, 140,7 and 38.6 mPa.s at 293.15 K. Considering [DCA]- as the anion, the same phenomenon is
seen with [P6.6.6.14]+ and [C2mim]+, giving viscosities of 532.45 and 140.7 mPa.s at 293.15 K.
In order to determine the effect of the anion on the viscosity of ionic liquids, [C2mim]+ is considered as
the cation, and the anion is altered. If [NTf2]-, [DCA]- and [C2SO4]- are compared a smaller change is
observed, with viscosities, being respectively 22.8, 38.6 and 125.6 mPa.s at 293.15K.
0,85
0,90
0,95
1,00
1,05
1,10
1,15
280 290 300 310 320 330 340 350 360 370
Den
sity
(g/
cm³)
Temperature (K)
[DCA]-
[C4mim]+
[C4mpyr]+
[P6.6.6.14]+
[C2mim]+
7
Figure 1.4 Viscosity versus time for ionic liquids with a mentioning of the water content in
percentages; [P6.6.6.14][DCA] (0.01 %) [31], [N4.1.1.1][NTf2] (0.01 %) [30], [OMA][NTf2] (0.05 %) [33],
[C2mim][NTf2] (0.05 %) [33], [C2mim][DCA] (0.19 %) [33] and [C2mim][EtSO4] (0.01 %-0.04 %) [33]
Water and other impurities change the viscosity of ILs drastically. It can be assumed that polar water
molecules modify the properties of the ions, which decreases the viscosity tremendously. [34] Another
reason is the lowering of the electrostatic attractions among the ions and thus the cohesive energy of
the system. [23] In IL’s with alkylimidazolium as a cation, the addition of chloride will, even in low
concentrations, decrease the viscosity of ionic liquids substantially. This is due to the interaction via
hydrogen bonds between the protons and the chloride of the imidazolium ring [34]
Electrochemical behavior
In electrochemical experiments, the conductivity of a solvent is of vital importance. ILs have inherent
ionic conductivity thereby eliminating the need for using an additional supporting electrolyte in
electrochemical devices. The conductivity of a pure ionic liquid depends on the mobility of the ions,
which is influenced by the ion size, ion association and viscosity (a decrease in viscosity enhances the
mass transport of analyte to the electrode surface).
In general, an ideal electrolyte should have high ionic conductivity (>10–4 S/cm), fast ion mobility
during redox reactions (>10–14 m2.(V.s)-1), large electrochemical potential windows (>1 V) and low
volatility. ILs exhibit many of these properties and characteristics. [35]
In fact, it has been shown that ionic liquids are highly effective electrolytes making possible their
applications in batteries [36-39], capacitors [40-42], solar [43-48] and fuel cells [49]. The non-volatility
and non-combustibility should contribute to the long-term durability and safety of these devices.
Most properties of ILs relevant to electrochemistry are centrally based on the above-mentioned
conductivity and viscosity, and on electrochemical potential windows.
0
100
200
300
400
500
600
700
800
280 300 320 340 360 380 400
Vis
cosi
ty (
mP
a.s)
T (K)
Viscosity
[N4.1.1.1][NTf2]
[C2mim][EtSO4]
[P6.6.6.14][DCA]
[OMA][NTf2]
[C2mim][NTf2]
[C2mim][DCA]

8
The electrochemical potential window of stability of an ionic liquid is generally characterized by the
reduction potential of its cation and the oxidation potential of its anion.
Potential window = Eanodic limiting potential - Ecathodic limiting potential (1)
These limits are tunable based on the cation and anion selection, and the electrochemical window can
be widened or narrowed to include or exclude certain potential window ranges, an indication of the
versatility of ionic liquids in different applications. [9]
It is currently known that some electrodepositions, that are not possible to be studied in aqueous or
inorganic electrolyte solutions, are possible in IL’s, due to their wide electrochemical window. [9,12,13]
The major impurities contained in ILs are water and oxygen, even in highly pure samples, since these
molecules are dissolved easily into the ILs from the atmosphere. Their electrochemical activity makes
the removal of these molecules essential before any voltammetric measurement. [9]
The water miscibility and hydrophobicity is influenced by the identity of the anion of the IL. This needs
to be taken into account when drying an IL and it also determines the difficulty that comes with
reaching very low moisture contents. Certain precautions will have to be taken, to get the water
content to a very low level. An example is the use of an imidazolium-based IL with a hydrophilic anion.
When it is mixed with water a micelle is formed. If the cation contains a long side chain, it is more likely
for the cation to get included in a micelle, because of the hydrophobicity of the alkyl side chain. By
exchanging the anion for a hydrophobic one, the structure becomes non-micellar, thus excluding water
out of the IL. [9,50]
The effect of water on the electrochemical window of trihexyl(tetradecyl)phosphonium dicyanamide
[P6.6.6.14][DCA] has not yet been reported while has been thoroughly studied [51] at room temperature,
for 1-alkyl-3-methylimidazolium based ILs [Cnmim][X], with the n being 4 or 6, making it a 1-butyl- or 1-
hexyl-3methylimidazolium salt with the [X]- being [NTf2]- or [PF6]-.
More hydrophobic IL’s such as [Cnmim][PF6] will form a biphasic system with water, when saturation is
reached. The concentration in which this happens depends again on the alkyl chain length of the
cation and on the anion type. [51]
It should be kept in mind that ionic liquids are in fact hygroscopic. An experiment wherein IL’s got
exposed to the atmosphere at ambient temperature showed the water uptake in function of time,
Figure 1.5. The hydrophobicity of the anions decreases in the following order; [PF6]- > [BF4]- > [NO3]- >
Cl-. It turned out that even the considered ‘hydrophobic’ ones such as [Cnmim][PF6] extract 1w/w%
over a 3 h period of exposition. In the water-soluble IL’s, the water uptake will be even more severe.
[51] It should also be noted that the presence of water in [PF6]- can lead to decomposition reactions,
producing e.g., HF. [52]

9
Figure 1.5 Absorption of water from atmospheric air at ambient temperature and moisture, with
constant stirring as a function of exposure. (∆) corresponds to [C8mim][NO3], (*) to [C8mim]Cl,
(0) to [C4mim][BF4] and (□) to [C4mim][PF6]. [51]
The presence of water may have a rather dramatic effect on the reactivity of ILs. The influence of
water on hydrogen bonds between ionic liquids and cellulose was investigated. [9] It was found that
water gets included in the hydrogen bond-accepting sites of the anions. In other words, if a hydrogen-
bond between an anion and cellulose breaks, the chance that it will be replaced by a water molecule
increases. Therefore, to make results comparable it is very important to take note of the water content
in the ILs used. [53]
The ferrocene/ferrocenium [Fe(C5H5)2 / Fe(C5H5)2+, Fc°/Fc+] couple is widely used as an internal
standard in voltammetric studies in conventional non-aqueous media containing electrolytes. In order
to make a comparison in RTIL’s, the IUPAC recommends the use of the same couple as an internal
potential reference. [54] However, in many ionic liquids the solubility of ferrocene is rather low.
Heterogeneities in the ionic liquids can cause the measured current to differ from the normal situation
due to, for example, the accumulation of ferrocene on the electrode surface. [54] Moreover, since the
oxidation potential of Fc° is very close to the anodic potential limit of some IL’s, the reversibility of the
Fc°/+process can be negatively influenced. Some irreversible voltammetric behavior was observed,
probably due to the reaction of Fc+ with the IL itself or the oxidation products of the IL. [54]
To date, the electrochemical behaviour of ferrocene in trihexyl(tetradecyl)phosphonium dicyanamide,
[P6.6.6.14][DCA] (IL105), has not been reported. The behavior of ferrocene in other ionic liquids, on the
other hand, is already tested [55-56]. As an example, the cyclic voltammogram of the common ionic
liquid [C4mim][BF4] is shown in Figure 1.4.
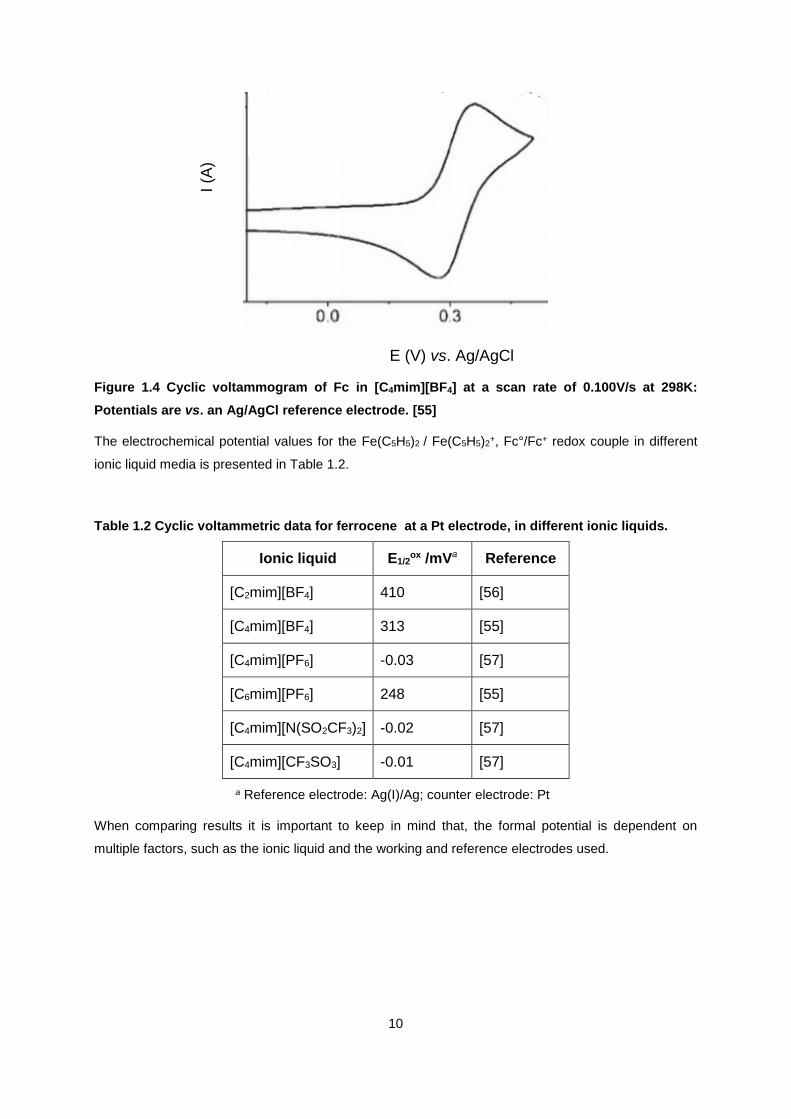
10
I (A
)
E (V) vs. Ag/AgCl
Figure 1.4 Cyclic voltammogram of Fc in [C4mim][BF4] at a scan rate of 0.100V/s at 298K:
Potentials are vs. an Ag/AgCl reference electrode. [55]
The electrochemical potential values for the Fe(C5H5)2 / Fe(C5H5)2+, Fc°/Fc+ redox couple in different
ionic liquid media is presented in Table 1.2.
Table 1.2 Cyclic voltammetric data for ferrocene at a Pt electrode, in different ionic liquids.
Ionic liquid E1/2ox /mVa Reference
[C2mim][BF4] 410 [56]
[C4mim][BF4] 313 [55]
[C4mim][PF6] -0.03 [57]
[C6mim][PF6] 248 [55]
[C4mim][N(SO2CF3)2] -0.02 [57]
[C4mim][CF3SO3] -0.01 [57]
a Reference electrode: Ag(I)/Ag; counter electrode: Pt
When comparing results it is important to keep in mind that, the formal potential is dependent on
multiple factors, such as the ionic liquid and the working and reference electrodes used.

11
Catalytic application for the oxidation of cycloalkanes
Selective partial oxidation of alkanes is an important topic with potential in terms of economic and
ecological perspectives of sustainable chemistry [21,58-67]. However, efficient catalytic oxidation of
alkanes [68-69] still remains a challenging topic. The development of more active catalysts, under mild
conditions, at room temperature and using low toxicity media and oxidizing agents is needed.
Hydrogen peroxide is one of the best options in this regard since H2O is the sole by-product. Thus,
peroxidative alkane oxidations were the selected reactions for the present study.
Cyclohexane was the chosen substrate in view of the significance of the oxidized products
(cyclohexanol and cyclohexanone, Figure 1.6) for the manufacturing of adipic acid, Nylon-6,6’ and
polyamide-6 [58-66]. Moreover, the industrial process of cyclohexane oxidation needs to be improved,
since it requires considerably harsh conditions (150 ºC) and leads to low yields (ca. 4%) to assure a
good selectivity (ca. 85%)[67]. The difficulty finds its origin in the activation of the C(sp³)-H bond in
such unreactive saturated hydrocarbons, thus inhibiting their wider use for the direct use of added-
value chemical products. [70]
OOH OH O
aq. H2O2, RT
Catalyst
Figure 1.6 Peroxidative oxidation of cyclohexane to cyclohexanol and cyclohexanone.
It has been a pursuit for many years now, to replace the classical process by other systems that can
catalyze the selective oxidation of alkanes at ambient temperature. [71-73]
The oxidation reaction of cyclohexane to cyclohexanol and cyclohexanone was investigated in
[C2mim][BF4] with titanium silicate 1 (TS-1), which is a titanium-containing molecular sieve, as a
catalyst and tert-butyl-hydroperoxide (tBuOOH, TBHP) as oxidant. The maximum conversion and yield
was found at a mole ratio of 2:1 of TBHP to cyclohexane at 90 °C, with a conversion of 13.20 %, a
yield of 12.88 % and 97.6 % selectivity for the oxidation of cyclohexane to cyclohexanol and
cyclohexanone. It was found that the yield and conversion increased with an increasing temperature,
while the selectivity lowered slightly at high temperatures (between 70 °C and 100 °C). No significant
increase in oxidation was found between 90 °C and 100 °C, conceivably due to the decomposition of
TBHP. [72]

12
1-Glycyl-3-methyl imidazolium chloride was used as a complex with Cu(II) ([Gmim]Cl–Cu(II) complex),
for the C-H oxidation reaction on several alkyl-arenes. A 70% yield was obtained for the oxidation of
cyclohexane to cyclohexanone, when the reaction oxidation reaction was performed for 12 hours with
0.1 mmol of catalyst at ambient temperature. The recyclability of the catalyst was tested for the
oxidation of ethylbenzene to acetobenzene. A decrease from 85% to 82% yield was observed after 6
reaction cycles for the oxidation of ethylbenzene to acetobenzene specifically, when extracted and
dried under vacuum. [71]
Only a few studies on ferrocene for the cyclohexane oxidation have been done. [75,76]
The combination of ferrocene as a catalyst with potassium persulfate (K2S2O8) as a co-catalyst
dissolved in acetonitrile when exposed to 20 atm of CO was tested. A yield of 18.3, 0.8 and 0.3 for
respectively cyclohexylperoxide, cyclohexanol and cyclohexanone at 60 °C with a reaction time of 4
hours, was obtained. [75]
Ferrocene, in combination with pyrazine carboxylic acid ([PCA])in a 1:2 molar ratio catalyzes the
homogeneous oxidation of cyclohexane and benzene with H2O2 as an oxidant in an acetonitrile
medium. [76]
The combination of ferrocene derivatives and ionic liquids are being used for several catalytic
purposes, such as the oxygen reduction reaction [77], Suzuki Miyaura reaction [78] and the
isomerization of allylic alcohol [79].
To the best of our knowledge, no research on the catalytic oxidation of cyclohexane in ionic liquid
media is found. In this work, the oxidation of cyclohexane in trihexyl(tetradecyl)phosphonium
dicyanamide ([P6.6.6.14][DCA], IL105) with ferrocene as a catalyst will be studied.
1.1.5 Possible ecological effects
The major concern in the use of ILs related to the fact that some anions are not so green, and the risk
of hydrolysis stability of the anion with the formation of an acid can occur. Lower homologues of
alkylsulfate anions for example, namely methanesulfate and ethanesulfate may be sensitive to
hydrolysis, with the formation of the corresponding alcohol and hydrogensulfate as a consequence.
[3,21]. The antimicrobial activity increased as the alkyl chain length of pyridinium, imidazolium, and
quaternary ammonium salts increased, thus increasing the toxicity for bacteria. [80-85]
Cho et al. showed that the toxicity of ILs increased with an increase in alkyl chain length, when
investigation series of imidazolium based ionic liquids. [86] In the investigation for the toxicity of 1-
butyl-3-methylimidazolium, 1-butyl-3methylpyridinium, tetrabutylammonium, 1-butyl-1-
methylpyrrolidium and tetrabutylphosphonium bromides a toxicity between two and four orders of
magnitude greater than those of organic solvents was found. [87] Varying the anion has a minimal
effect on the toxicity of imidazolium and pyridinium salts, which suggests that toxicity is largely driven
by the cation. [81,88-90]
13
Pigments
Hazards
Dyes are an important class of synthetic organic compounds used in many industries, especially
textiles. Consequently, they have become common industrial environmental pollutants during their
synthesis and later, during fiber dyeing. Textile industries are facing a challenge in the field of quality
and productivity due to the globalization of the world market. The textile industry utilizes about 90% of
all dyes, while the remaining 10% are used in food, printing, and plastics. The greatest amounts come
from Asia, with China as the largest producer. This big release of major quantities of dyes has a
significant detrimental effect on the environment, due to the high chemical oxygen demand (COD) and
toxicity of these effluent streams. [88]
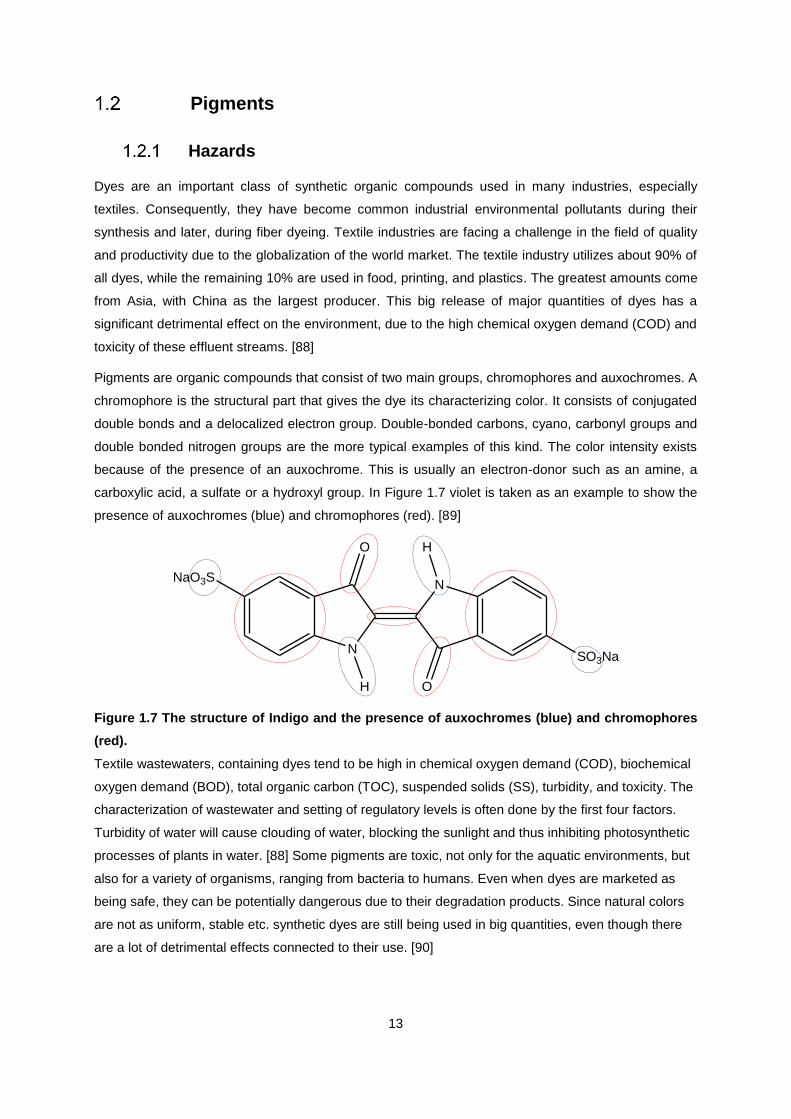
Pigments are organic compounds that consist of two main groups, chromophores and auxochromes. A
chromophore is the structural part that gives the dye its characterizing color. It consists of conjugated
double bonds and a delocalized electron group. Double-bonded carbons, cyano, carbonyl groups and
double bonded nitrogen groups are the more typical examples of this kind. The color intensity exists
because of the presence of an auxochrome. This is usually an electron-donor such as an amine, a
carboxylic acid, a sulfate or a hydroxyl group. In Figure 1.7 violet is taken as an example to show the
presence of auxochromes (blue) and chromophores (red). [89]
N
N
O
O
NaO3S
SO3Na
H
H
Figure 1.7 The structure of Indigo and the presence of auxochromes (blue) and chromophores
(red).
Textile wastewaters, containing dyes tend to be high in chemical oxygen demand (COD), biochemical
oxygen demand (BOD), total organic carbon (TOC), suspended solids (SS), turbidity, and toxicity. The
characterization of wastewater and setting of regulatory levels is often done by the first four factors.
Turbidity of water will cause clouding of water, blocking the sunlight and thus inhibiting photosynthetic
processes of plants in water. [88] Some pigments are toxic, not only for the aquatic environments, but
also for a variety of organisms, ranging from bacteria to humans. Even when dyes are marketed as
being safe, they can be potentially dangerous due to their degradation products. Since natural colors
are not as uniform, stable etc. synthetic dyes are still being used in big quantities, even though there
are a lot of detrimental effects connected to their use. [90]

14
Treatment of wastewater
The development of techniques for the removal of dyes from aqueous waste streams has become a
big field of interest for researchers, for the reasons mentioned in 1.2.1. Most of the removal methods
consist of a physical, biological and chemical step. The used approaches are found to be expensive
and ineffective.
The parameters of wastewater can vary significantly, depending on the different dyeing and washing
processes used. Consequently the characteristics and treatment of wastewater will be altered, when a
change of these factors is present. With pH being a very important factor, this needs to be taken into
account
Pang et al. found that a combination of a chemical treatment, coupled with a physical treatment,
followed by a biological treatment, ending with another physical treatment to be ideal. Physical
treatments usually separate the different components in the wastewater, with adsorption, ion
exchange and filtration being the main ones. Micro-organisms such as bacteria, plants or fungi are the
basis of the biological treatment. They will breakdown the organic compounds in wastewater and
convert them to water and carbon dioxide under aerobic and/or anaerobic conditions. In most cases
pretreatment is required, because most dyes aren’t biodegradable. [88] Another problem occurring in
this method is the toxicity of the dyes, causing the extinction of most plant types. [91]
The chemical processes embody a wide range of techniques. The generic way includes coagulation or
flocculation process as well as an oxidation. Alternatives have been investigated as a replacement for
oxidations reactions. This is due to the increased toxicity of the products in comparison to the
reactants used. Therefore it needs to be used in combination with other techniques. Coagulation or
flocculation is mostly used in co-operation with physical methods as it is the purpose to remove
suspended particles. [88]
One of the techniques being researched is the liquid-liquid extraction (LLE). Here in dye-containing
wastewaters are brought in contact with an immiscible organic solvent, into which the dyes dissolves.
In 2007, Mahmoud et al. [92] examined a variety of more environmentally-friendly solvents for liquid-
liquid extraction. Specifically, various plant oils were used in an attempt to extract the dye Remazol
Brilliant Blue (an anionic dye). These authors concluded that the increase in the extraction efficiency
observed is directly proportional to the viscosity of the liquids.
This new method, employing ionic liquids has already been tested in several dyes. [92-98] Being a
topic of interest, LLE will be further investigated in this work.
15
Characterization of dyes
Amaranth (C.I. 16185) is a dark red to purple azo dye, that’s used as a food and cosmetics dye. It is
anionic and can be applied to natural and synthetic fibers, leather, paper and phenol-formaldehyde
resins. Since 1976 Amaranth has been banned in the USA, due to carcinogen effects, but it is still
used in some countries. Another dye that belongs to the anionic ones is indigo (C.I. 73015 A). It is
commonly used as a pH indicator, because of the dependence of the color on the pH. This pigment is
found to be blue below the first pKa (11.4) and yellow above its second pKa (13.0). When used as a
redox indicator indigo turns yellow upon reduction.
Tartrazine (C.I. 19140) is a synthetic anionic lemon yellow azo dye, mostly used as a food coloring,
but can also be used in cosmetics and medication.
Malachite green (C.I. 42000) is an organic compound which owes its color to the presence of a cation.
It find its use as a pH indicator with a yellow color below pH is 0.2 and green between a pH of 1.8 and
11.5. A loss in color will appear above a pH of 13.2.
Methyl violet (C.I. 42535) is a cationic dye that is mostly used as a purple dye for textiles and also, to
give deep violet colors to paint. It is mutagen and mitotic poison, therefore concerns exist when it
comes to the impact it has on the environment.
Methylene blue (C.I. 52015) is a heterocyclic aromatic chemical compound, used as a cationic dye in a
big range of fields, such as biology and chemistry. It is frequently found in biological stains and
occasionally as a redox indicator. In the health care industry methylene blue can battle certain
cancers, when combined with other drugs.
Rhodamine 6G (C.I. 45160) is highly fluorescent, thus is often used as a cationic tracer dye within
water to determine the rate and direction of flow and transport in water. The fluorescent behavior make
them usable in an extensive range of biotechnology applications such as fluorescence microscopy,
flow cytometry and fluorescence correlation spectroscopy.
Chrysoidine (C.I. 11270) also named basic orange 2, is a cationic azo dye that changes color
depending on the pH. It will shift from orange at pH 4.0 or bellow to yellow at pH 7.0 or above.
Photographic material, inks, toners and detergents are some of the application.
The structures of the dyes used in this work can be found in Figure 1.8.

16
NaO3S N N
HO SO3Na
SO3Na
N
N
O
O
NaO3S
SO3Na
H
H
Amaranth Indigo
SO3NaN
N
HO
NNNaO3S
COONa
Tartrazine
O
CH3
NH+C2H5
H3C
C2H5HN
COOC2H5
Cl-
NH+(CH3)2
(H3C)2N
Cl-
N(CH3)2
Rhodamine 6G Methyl violet
S
N
N(CH3)2(H3C)2N
Cl-
N N
H2N
NH2
N
Methylene blue Chrysoidine
N(CH3)2
(H3C)2N Cl-
Figure 1.8 Structure and designation of the considered dyes.
Cationic dyes
Malachite green
Anionic dyes
N+(CH3)2

17
Extraction of dyes from aqueous solution with ionic liquids
Several works have been conducted on the use of ionic liquids in the extraction of dyes. [93-100] For
these extraction to be feasible, the dye components need to dissolve into the ionic liquid, withdrawing
it from the wastewater. It is very important for the ionic liquid not to dissolve into the aqueous layer in
significant amounts, as it would have an even more detrimental effect on the environment.
To quantify the extracted amount, the distribution ratio (D), defined in 2 is used. Therein the dye
concentration in the IL is divided by the dye concentration in the aqueous layer.
𝐷 =[𝑑𝑦𝑒]𝑜𝑟𝑔
[𝑑𝑦𝑒]𝑎𝑞
(2)
If the D value is greater than 10 it is considered efficient and inefficient when it is less than 1. [99]
Pei et al. found that when cationic dyes and [PF6]- based ionic liquids were brought in contact,
associates were formed between the cationic dye and the anion of the IL in a ratio that came close to
1:1. Aqueous solutions of malachite green and methylene blue formed precipitates, when a [PF6]-
based ionic liquid was added. After agitation, these precipitates dissolved into the ionic liquids. A
strong enough interaction between ionic liquids and cationic dyes is thus implied. [100]
The dye-IL associates were investigated, and association constants were calculated utilizing
theoretical models established by the determination of the deviation from linear behavior. It was found
that the association reached values as high as 106 (L.mol-1)², which is a sign of a strong
interconnection. An exothermic nature was ascribed to the formation process of the association, which
was implied by the thermodynamic results found by Y. Pei et al. [100]
No actual research was done on the use of IL105 in the liquid-liquid extraction of pigment out of
aqueous media. More commonly used IL’s are those, containing a 1-alky-3-methylimidazolium cation.
Ali et al. attempted to extract several dyes into [C4mim][PF6], [C4mim][BF4], [C4mim][NTf2], and
[C6mim][Br]. The cationic dyes studied included Methylene blue among others. The extraction
efficiencies were as high as 99%. No mechanism was determined, but the researchers concluded that
hydrophobicity of an ionic liquid has no effect on extraction efficiency. [95]
18
Effect of physical properties on the LLE of dyes
A work by Mahmoud et al. suggested that the more viscous a solvent, the higher Ddye got. In other
words, the more viscous an IL, the more efficient it would extract dyes. [92,101] As already mentioned
in 1.1.2.3 the viscosity is influenced by several factors. An increase in cation size is normally
accompanied by an increase in viscosity. In addition the choice of anion can significantly influence
viscosity as well.
Zhang et al. on the other hand, found that the least viscous IL’s extracted the cationic dyes the most
efficiently, with Ddye being slightly higher for [C6mim][NTf2] than for [C6mim][PF6]. For anionic dyes the
opposite is true, the most viscous IL’s extracted the anionic dyes the most efficiently. The relationship
between viscosity and extraction efficiency appears to be strong but is possibly coincidental. A more
precise way to approach the difference in extraction ability is the hydrophobicity of its constituent
cation and anion. [101]
In this work, several anionic and cationic dyes will be tested, using an ionic liquid. Most of these
pigments have not been reported previously in a LLE experiment.

19
EXPERIMENTAL PROCEDURE
Material
Different ionic liquids are used, including [P6.6.6.14][Cl], IL105 ([P6.6.6.14][DCA which were kindly donated
by cytec industries inc. Alliquat336 was acquired at Alfa Aesar and [C6mim]Cl, [C6mim][NTf2],
[C4mim][NTf2] and [C6mim][NTf2] were homemade using the synthesis procedure as described in 2.53.
The ionic liquids are being dried for 12 h, using the vacuum line, with Edwards RV3 pump. When this
is done they need to be put under nitrogen, using the vacuum line. Ferrocene, 99 % dichloromethane,
sodiumtetrafluoroborate, acetone and acetonitrile were purchased at Sigma- Aldrich. The ultra-pure
water, used for calibration, was purified at Faculdade de Ciências da Universidade de Lisboa. The
distilled water, used for extraction, was purified in Centro de Quimica Estrutural I.S.T. University of
Lisbon.
The dyes; Amaranth, Rhodamine 6G, Chrysoidine, Indigo, Tartrazine, Malachite green, methyl violet
and Methylene blue were purchased at Sigma-Aldrich as well as hydrogen peroxide solution (30%
H2O2). 100mL of a 40mg/L basic solution of all the pigments was made, dissolving 4mg of pigment in
100mL of distilled water. When altering the pH a 1.0M solution of sodium hydroxide was used to obtain
a pH of 12 and 0.1M of hydrochloric acid was used to obtain a pH of 2. Both the granulated NaOH as
the 37% HCL solution, used to make the diluted solutions, were acquired at Sigma-Aldrich. pH-papers
were used to test measure the pH of the pigment solutions and the pH adjusted by adding either acid
or base.
Equipment
The DSA 5000M Anthon Paar densitymeter was used for the density measurements. The accuracy of
the apparatus needs to be checked every day, before being used. Here for ulta-pure degassed water
is used.
Figure 2.1 The DSA 5000 M Anthon Paar densitymeter
20
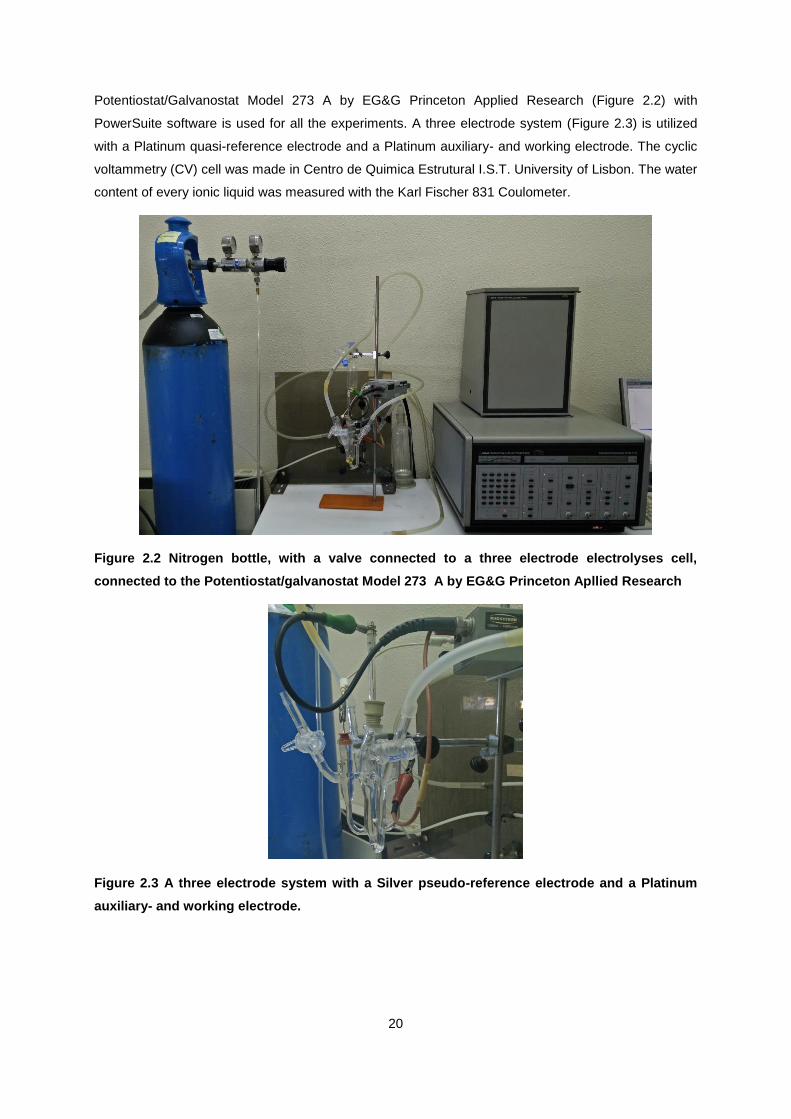
Potentiostat/Galvanostat Model 273 A by EG&G Princeton Applied Research (Figure 2.2) with
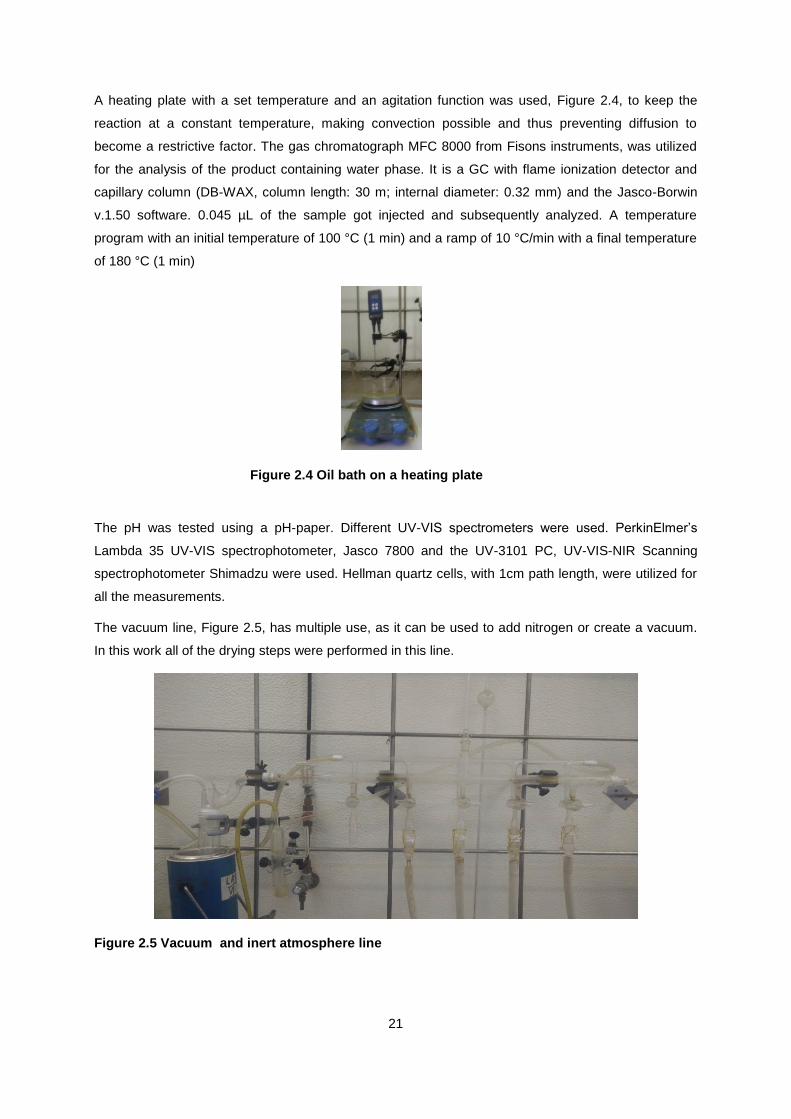
PowerSuite software is used for all the experiments. A three electrode system (Figure 2.3) is utilized
with a Platinum quasi-reference electrode and a Platinum auxiliary- and working electrode. The cyclic
voltammetry (CV) cell was made in Centro de Quimica Estrutural I.S.T. University of Lisbon. The water
content of every ionic liquid was measured with the Karl Fischer 831 Coulometer.
Figure 2.2 Nitrogen bottle, with a valve connected to a three electrode electrolyses cell,
connected to the Potentiostat/galvanostat Model 273 A by EG&G Princeton Apllied Research
Figure 2.3 A three electrode system with a Silver pseudo-reference electrode and a Platinum
auxiliary- and working electrode.
21
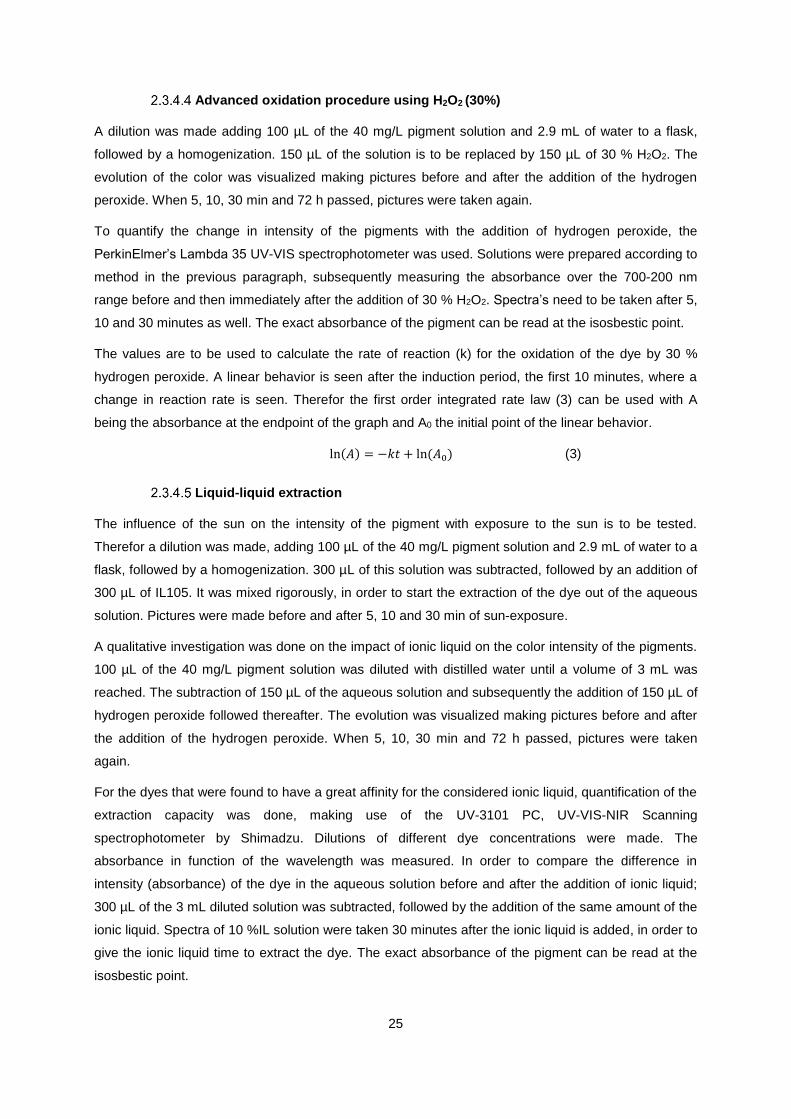
A heating plate with a set temperature and an agitation function was used, Figure 2.4, to keep the
reaction at a constant temperature, making convection possible and thus preventing diffusion to
become a restrictive factor. The gas chromatograph MFC 8000 from Fisons instruments, was utilized
for the analysis of the product containing water phase. It is a GC with flame ionization detector and
capillary column (DB-WAX, column length: 30 m; internal diameter: 0.32 mm) and the Jasco-Borwin
v.1.50 software. 0.045 µL of the sample got injected and subsequently analyzed. A temperature
program with an initial temperature of 100 °C (1 min) and a ramp of 10 °C/min with a final temperature
of 180 °C (1 min)
The pH was tested using a pH-paper. Different UV-VIS spectrometers were used. PerkinElmer’s
Lambda 35 UV-VIS spectrophotometer, Jasco 7800 and the UV-3101 PC, UV-VIS-NIR Scanning
spectrophotometer Shimadzu were used. Hellman quartz cells, with 1cm path length, were utilized for
all the measurements.
The vacuum line, Figure 2.5, has multiple use, as it can be used to add nitrogen or create a vacuum.
In this work all of the drying steps were performed in this line.
Figure 2.5 Vacuum and inert atmosphere line
Figure 2.4 Oil bath on a heating plate

22
Figure 2.6 Karl Fischer 831 Coulometer
The 831 Karl Fischer Coulometer, as shown in Figure 2.6 is used to measure the water content of the
ionic liquids, when doing electrochemistry experiments
Procedure
Density
To get reproducible results IL105 is to be degassed and preheated to the starting temperature of the
measurements, being 50°C. The measuring cell is to be filled carefully to prevent the appearance of
bubbles in the cell.
Several measurements have to be done in order to have a reproducible result. If the density starts to
stagnate, the temperature can be adjusted. The final value is the average of all the results, excluding
the extremely aberrant ones. In order to get a clear view of the evolution of density versus
temperature, values are taken between 50 °C and 15 °C; starting at 50 °C decreasing the temperature
in steps of 5°C.
The results are to be compared with data found in the literature.
Cyclic voltammetry
The cyclic voltammetric experiments were performed using an EG&G PAR 273A
potentiostat/galvanostat connected to a personal computer through a GPIB interface.
The studies were conducted at a platinum disc working electrode (d = 0.5 mm) and at room
temperature, in a three-electrode-type cell with a Luggin capillary connected to a silver wire pseudo-
reference electrode (to control the working electrode potential) and a Pt wire as the counter electrode
for the CV cell. The solutions were saturated by bubbling N2 before each run. The redox potentials of
the complexes were measured by CV in the presence of ferrocene as the internal standard.

23
Room - temperature ionic liquids are usually prepared from a variety of organic and inorganic salts.
Because both ionic liquids and halide salts are hygroscopic in most cases, they must be dried under
vacuum at elevated temperatures and handled in a dry atmosphere.
Cyclic voltammetry is a very sensitive technique, so when the setup is done, one needs to make sure
that every piece of equipment that is involved in the measurement is properly cleaned. All experiments
were carried out at ambient temperature in a N2-atmosphere, saturating the ionic liquid with N2 before
every measurement.
5 mL of dried ionic liquid is added to the electrochemical cell withdrawing the IL from a schlenk, using
a syringe. Both the cyclic voltammetry cell as the schlenk are to be under a N2-atmosphere. Cyclic
voltammetry is applied as a technique to measure the electrochemical window, which ranges from the
potential of the catodic peak to the potential of the anodic peak of the ionic liquid.
The water content of the ionic liquid will be studied as an influential factor. Therefor a CV-scan will be
taken of the dried IL and subsequently after the addition of 100 mg of water. This process will be
repeated until the electrochemical window remains the same. A sample needs to be taken after every
measurement, followed by the determination of the water content of every sample by Karl Fischer
titration.
The same procedure as mentioned above will be used, for the addition of ferrocene to the IL. The
characteristic peak potential will be caluculated out of the potential of both the catodic as the anodic
peak of the reversible ferrocene oxidation. Ferrocene will be added to several ILs and the peak
potential is to be compared.
Peroxidative oxidation of cyclohexane
IL105 is being used in combination with ferrocene as catalyst for the oxidation of cyclohexane to
cyclohexanol and cyclohexanone. A solution of ferrocene in ionic liquid will be made with a differing
concentration, given in Table 3.4.
Making use of a magnetic stirrer, the solution will be stirred until homogeneity is reached. The reagent,
cyclohexane namely, is added to the homogeneous solution at a concentration of 129.68 g/L.
Afterwards an addition of 486.2 g/L of the oxidant TBHP takes place after homogenizing the solution.
The flask was placed in an oil bath and kept at 50°C. A reaction time of 2 hours was used, combined
with stirring. After two hours the flask is taken out of the oil bath and cooled down by rinsing it with tap
water.

24
The ionic liquid has a very small vapor pressure, therefore cannot be evaporated. 3mL of water was
added to extract the products. Since water and IL105 are immiscible, a biphasic solution will get
formed, Figure 2.5. It will be stirred thoroughly, by a magnetic stirrer, to make all the products migrate
to the aqueous phase. The water phase is separated from the ionic liquid, making use of a glass pipet.
IL105 is then dried under vacuum overnight and stored in a N2 atmosphere.
Pigments
Calibration curves
Dye solution of different concentration where made, by adding different quantities of the stock-solution
and supplementing it to create a 3 mL solution. The quantity of this addition depends on the
absorbance of the dyes at that certain concentration. Absorbance values were kept bellow one. Three
solutions for each pH (2, 7 and 12) were measured. The volumes were converted to concentration via
molar mass and density. Subsequently first order graphs of absorbance versus concentration were
made.
Sun exposure
A dilution was made adding 100µL of the 40mg/L pigment solution and 2.9mL of water to a flask,
followed by a homogenization. Pictures were taken before and after 5, 10 and 30min of sun-exposion.
pH
The difference in color of all the dyes at different pH’s (2, 7 and 12) was investigated. Making a
solution of different volumes of pigment solution 40 mg/L, depending on the absorbance of the
pigment and diluting it to 3 mL with distilled water. The addition of 1 M NaOH brought the pH to 12 and
0.1 M HCl to 2. The pH was analysed using a pH-paper. Photos were taken and the color/intensity
between the different samples were compared.
Figure 2.7 Biphasic mixture of IL105 and H2O
25
Advanced oxidation procedure using H2O2 (30%)
A dilution was made adding 100 µL of the 40 mg/L pigment solution and 2.9 mL of water to a flask,
followed by a homogenization. 150 µL of the solution is to be replaced by 150 µL of 30 % H2O2. The
evolution of the color was visualized making pictures before and after the addition of the hydrogen
peroxide. When 5, 10, 30 min and 72 h passed, pictures were taken again.
To quantify the change in intensity of the pigments with the addition of hydrogen peroxide, the
PerkinElmer’s Lambda 35 UV-VIS spectrophotometer was used. Solutions were prepared according to
method in the previous paragraph, subsequently measuring the absorbance over the 700-200 nm
range before and then immediately after the addition of 30 % H2O2. Spectra’s need to be taken after 5,
10 and 30 minutes as well. The exact absorbance of the pigment can be read at the isosbestic point.
The values are to be used to calculate the rate of reaction (k) for the oxidation of the dye by 30 %
hydrogen peroxide. A linear behavior is seen after the induction period, the first 10 minutes, where a
change in reaction rate is seen. Therefor the first order integrated rate law (3) can be used with A
being the absorbance at the endpoint of the graph and A0 the initial point of the linear behavior.
ln(𝐴) = −𝑘𝑡 + ln(𝐴0) (3)
Liquid-liquid extraction
The influence of the sun on the intensity of the pigment with exposure to the sun is to be tested.
Therefor a dilution was made, adding 100 µL of the 40 mg/L pigment solution and 2.9 mL of water to a
flask, followed by a homogenization. 300 µL of this solution was subtracted, followed by an addition of
300 µL of IL105. It was mixed rigorously, in order to start the extraction of the dye out of the aqueous
solution. Pictures were made before and after 5, 10 and 30 min of sun-exposure.
A qualitative investigation was done on the impact of ionic liquid on the color intensity of the pigments.
100 µL of the 40 mg/L pigment solution was diluted with distilled water until a volume of 3 mL was
reached. The subtraction of 150 µL of the aqueous solution and subsequently the addition of 150 µL of
hydrogen peroxide followed thereafter. The evolution was visualized making pictures before and after
the addition of the hydrogen peroxide. When 5, 10, 30 min and 72 h passed, pictures were taken
again.
For the dyes that were found to have a great affinity for the considered ionic liquid, quantification of the
extraction capacity was done, making use of the UV-3101 PC, UV-VIS-NIR Scanning
spectrophotometer by Shimadzu. Dilutions of different dye concentrations were made. The
absorbance in function of the wavelength was measured. In order to compare the difference in
intensity (absorbance) of the dye in the aqueous solution before and after the addition of ionic liquid;
300 µL of the 3 mL diluted solution was subtracted, followed by the addition of the same amount of the
ionic liquid. Spectra of 10 %IL solution were taken 30 minutes after the ionic liquid is added, in order to
give the ionic liquid time to extract the dye. The exact absorbance of the pigment can be read at the
isosbestic point.

26
The distribution coefficient (D) can be calculated by converting the absorbance at the isosbestic points
to concentration determined via the calibration curve. Subsequently equation 4 will be used by filling in
the initial- and final concentration with the liquid-liquid extraction. Since a solution of 3 mL was used,
containing 2.7 mL of dye solution and 0.300 mL of IL105 (9:1 phase-to-volume ratio), a factor nine
needs to be added to the equation.
𝐷 =[𝐼𝑛𝑖𝑡𝑖𝑎𝑙𝑐𝑜𝑛𝑐𝑒𝑛𝑡𝑟𝑎𝑡𝑖𝑜𝑛𝑖𝑛𝑎𝑞𝑢𝑒𝑜𝑢𝑠𝑙𝑎𝑦𝑒𝑟]−[𝐹𝑖𝑛𝑎𝑙𝑐𝑜𝑛𝑐𝑒𝑛𝑡𝑟𝑎𝑡𝑖𝑜𝑛𝑖𝑛𝑎𝑞𝑢𝑒𝑜𝑢𝑠𝑙𝑎𝑦𝑒𝑟]
[𝐹𝑖𝑛𝑎𝑙𝑐𝑜𝑛𝑐𝑒𝑛𝑡𝑟𝑎𝑡𝑖𝑜𝑛𝑜𝑓𝑎𝑞𝑢𝑒𝑜𝑢𝑠𝑙𝑎𝑦𝑒𝑟]x9 (4)
Different volumes of dye-solution were added to the cell, depending on the intensity of the dye at that
certain concentration. The absorbance can’t be greater than 1. All the solutions were diluted to a
volume of 2.7 mL with distilled water. A measurement is done without the addition of the ionic liquid
and there after 300 µL of IL105 will get added to the solution. Spectra are taken immediately after the
addition and at 5, 10, 30 and 60 minutes, with the Jasco 7800 UV-VIS spectrophotometer.
The percentage of extraction (E) was calculated by the following equation (4) where [dye]aq0 the initial
dye concentration of aqueous phase (mg.L-1), and [dye]aq the dye concentration of aqueous phase
after extraction (mg.L-1).
𝐸 = 100 ∗[𝑑𝑦𝑒]𝑎𝑞𝑜−[𝑑𝑦𝑒]𝑎𝑞
[𝑑𝑦𝑒]𝑎𝑞0 (5)
Synthesis C6mimBF4
The [C6mim][BF4] was synthesized using the procedure published by Dupont et al. [71]
Before the actual synthesis starts, the ionic liquid needs to be dried. Therefore 30 mL (0.0513 mol) of
[C6mim][Cl] is added to a round bottom flask, which needs to get dried under vacuum at 60 °C.
The actual reaction consists of the reaction of 1-Hexyl-3-methylimidazolium chloride with an aqueous
sodiumtetrafluoroborate solution. Since it is a 1:1 reaction, both of the reagents need to be present in
the same molar quantity. These reagents are stirred for 20 hours, with a magnetic stirrer.
Figure 2.8 The byphasic solution generated at the synthesis of [C6mim][BF4]

27
99,9% dichloromethane (30 mL) is used to extract the ionic liquid from the aqueous biphasic solution.
Afterwards the two layers are separated by decantation. The upper layer is clear and needs no further
removal of solid compounds, while as the bottom, [C6mim][BF4] containing, layer will need to be
filtrated, making use of a Büchner funnel under vacuum. Both of the solutions are to be purified by
evaporation, so the solvents are removed out of the solution.
.
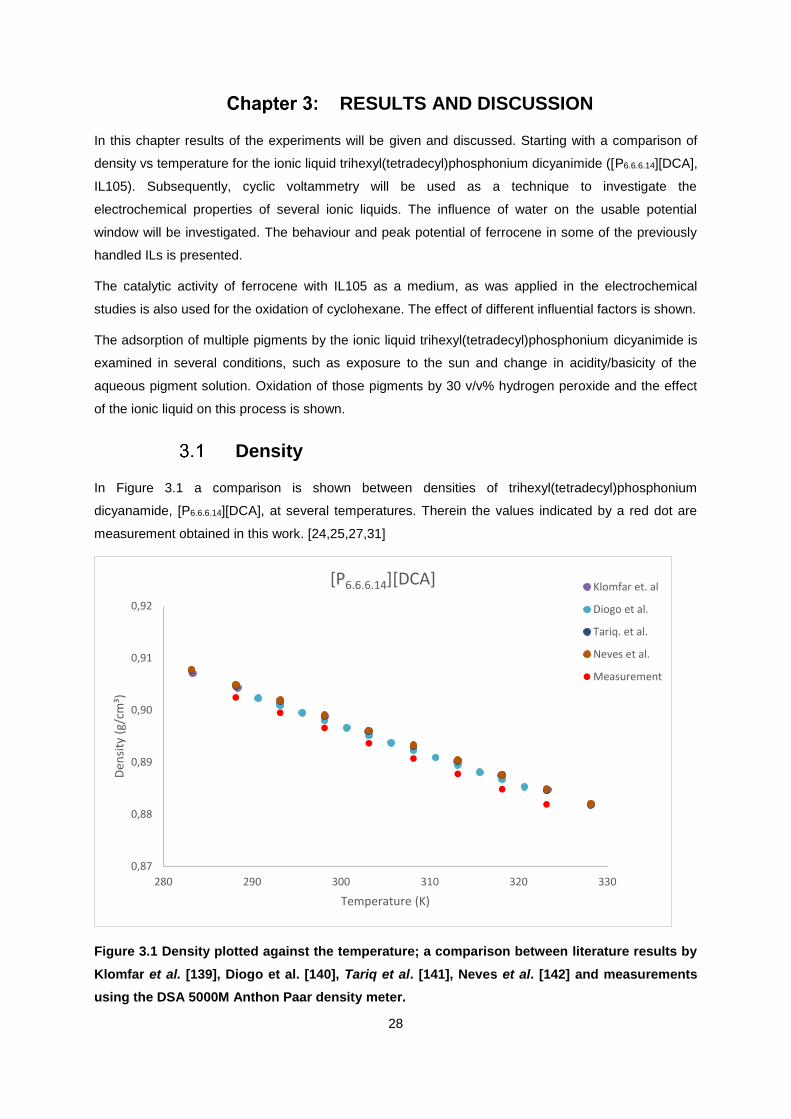
28
RESULTS AND DISCUSSION
In this chapter results of the experiments will be given and discussed. Starting with a comparison of
density vs temperature for the ionic liquid trihexyl(tetradecyl)phosphonium dicyanimide ([P6.6.6.14][DCA],
IL105). Subsequently, cyclic voltammetry will be used as a technique to investigate the
electrochemical properties of several ionic liquids. The influence of water on the usable potential
window will be investigated. The behaviour and peak potential of ferrocene in some of the previously
handled ILs is presented.
The catalytic activity of ferrocene with IL105 as a medium, as was applied in the electrochemical
studies is also used for the oxidation of cyclohexane. The effect of different influential factors is shown.
The adsorption of multiple pigments by the ionic liquid trihexyl(tetradecyl)phosphonium dicyanimide is
examined in several conditions, such as exposure to the sun and change in acidity/basicity of the
aqueous pigment solution. Oxidation of those pigments by 30 v/v% hydrogen peroxide and the effect
of the ionic liquid on this process is shown.
Density
In Figure 3.1 a comparison is shown between densities of trihexyl(tetradecyl)phosphonium
dicyanamide, [P6.6.6.14][DCA], at several temperatures. Therein the values indicated by a red dot are
measurement obtained in this work. [24,25,27,31]
Figure 3.1 Density plotted against the temperature; a comparison between literature results by
Klomfar et al. [139], Diogo et al. [140], Tariq et al. [141], Neves et al. [142] and measurements
using the DSA 5000M Anthon Paar density meter.
0,87
0,88
0,89
0,90
0,91
0,92
280 290 300 310 320 330
Den
sity
(g/
cm³)
Temperature (K)
[P6.6.6.14][DCA]Klomfar et. al
Diogo et al.
Tariq. et al.
Neves et al.
Measurement

29
Density measurements for [P6.6.6.14][DCA] were done in trifold or more in order to get reproducible
results, thus diminishing the chance of errors occurring. The result obtained is situated in the
uncertainty range of the literature results. [24,25,27,31]
Electrochemical behaviour of ionic liquids
The use of ionic liquids as electrolytes for electrochemical applications has been investigated in this
study.
An initial carried out to establish the electrochemical window and stability against oxidation and
reduction processes of selected ILs characterisation was (Table 3.1). The cathodic and anodic
potential limits, that is, the electrochemical stability window, of seven room-temperature ionic liquids
formed from a combination of cations 1-alkyl-3-methylimidazolium (alkyl = butyl, hexyl or octyl,
[Cnmim]+, n = 4, 6 or 8), trihexyl(tetradecyl)phosphonium ([P6.6.6.14]+) or N-methyl-N,N,N-trioctyloctan-1-
ammonium ([N8.8.8.1]+), and anions bis(trifluoromethylsulfonyl)imide (([CF3SO2)2N]-, [NTf2]-),
dicyanamide ([DCA]-) or chloride, were investigated by cyclic voltammetry (CV, scan rate 200 mV s-1)
at a platinum working electrode, under dinitrogen and at room temperature.
Table 3.1 Structures and common designations of ionic liquids used for electrochemical
stability window studies.

30
The limits of the useful potential range are indicated by a sharp and steady rise in the current (see
Figure 3.2) due to the electrochemical decomposition of the IL ions. These limits and the width of the
stable potential windows determined under the experimental conditions used (see 2.3.2) are listed in
Table 3.2.

31
Table 3.2 The oxidation potential, the reduction potential and the electrochemical window
available in [P6.6.6.14][DCA], [P6.6.6.14][Cl], Alliquat 336, [C4mim][NTf2], [C6mim][NTf2],
[C8mim][NTf2] and [C6mim][Cl] at a platinum disk working electrode; v, 200 mVs-1. Potentials
are vs. an Ag quasi-reference electrode (QRE).
IL Eox / V vs. Ag QRE Ered / V vs. Ag QRE ΔE /V
[P6.6.6.14][DCA] 1.7 -1.8 3.5
[P6,6,6,14]Cl 1.0 -3.0 4.0
Alliquat 336 1.0 -2.1 3.1
[C4mim][NTf2] 1.0 -1.7 2.7
[C6mim][NTf2] 1.8 -1.5 3.3
[C8mim][NTf2] 1.5 -2.0 3.5
[C6mim]Cl 0.9 -1.5 2.4
The range of potentials available for the electrochemical processes not affecting the solvent potential
window covers in each case a somewhat different region of the potential spectrum.
As an example, cyclic voltammograms presented in Figure 3.2, shows the differences on the
electrochemical stability range existing between [C4mim][NTf2] and [C8mim][NTf2], two ILs with a
common anion, where the cations present different length of methylimidazolium alkyl chains. Also, the
flatness of the imidazolium ring seems to allow a higher conductivity than in commonly used cations,
such as, the ammonium salts.
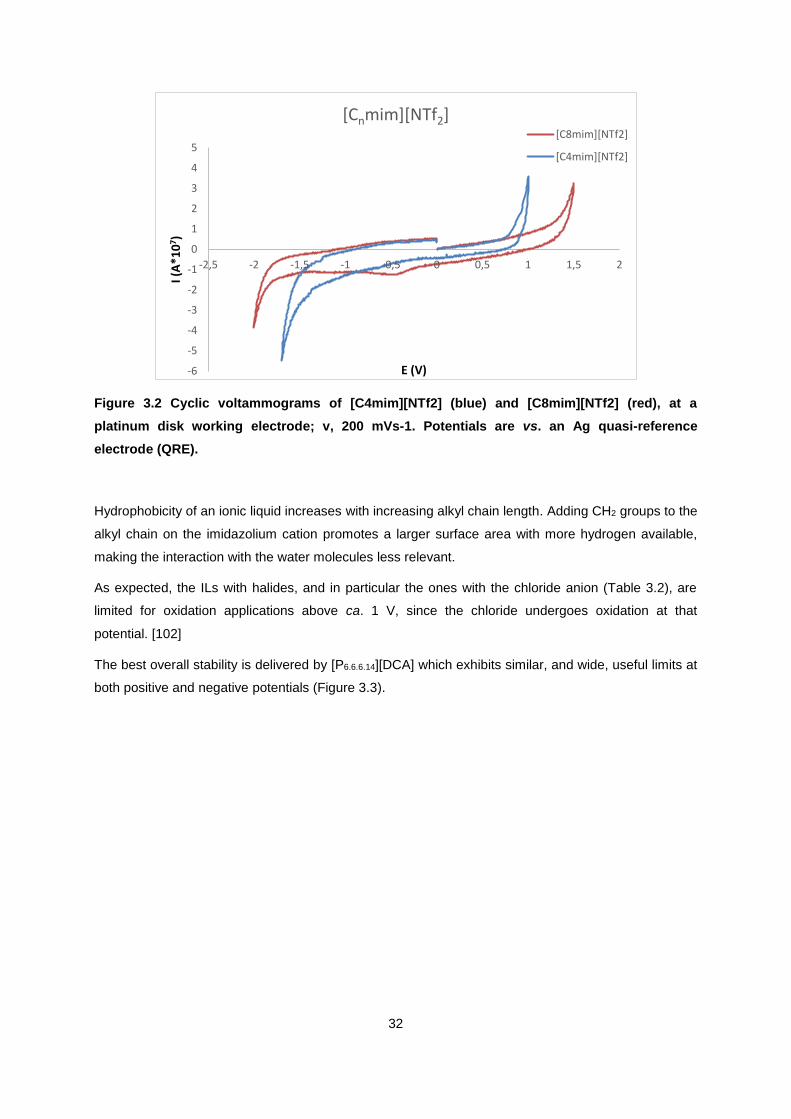
32
Figure 3.2 Cyclic voltammograms of [C4mim][NTf2] (blue) and [C8mim][NTf2] (red), at a
platinum disk working electrode; v, 200 mVs-1. Potentials are vs. an Ag quasi-reference
electrode (QRE).
Hydrophobicity of an ionic liquid increases with increasing alkyl chain length. Adding CH2 groups to the
alkyl chain on the imidazolium cation promotes a larger surface area with more hydrogen available,
making the interaction with the water molecules less relevant.
As expected, the ILs with halides, and in particular the ones with the chloride anion (Table 3.2), are
limited for oxidation applications above ca. 1 V, since the chloride undergoes oxidation at that
potential. [102]
The best overall stability is delivered by [P6.6.6.14][DCA] which exhibits similar, and wide, useful limits at
both positive and negative potentials (Figure 3.3).
-6
-5
-4
-3
-2
-1
0
1
2
3
4
5
-2,5 -2 -1,5 -1 -0,5 0 0,5 1 1,5 2
I (A
*10
7 )
E (V)
[Cnmim][NTf2][C8mim][NTf2]
[C4mim][NTf2]
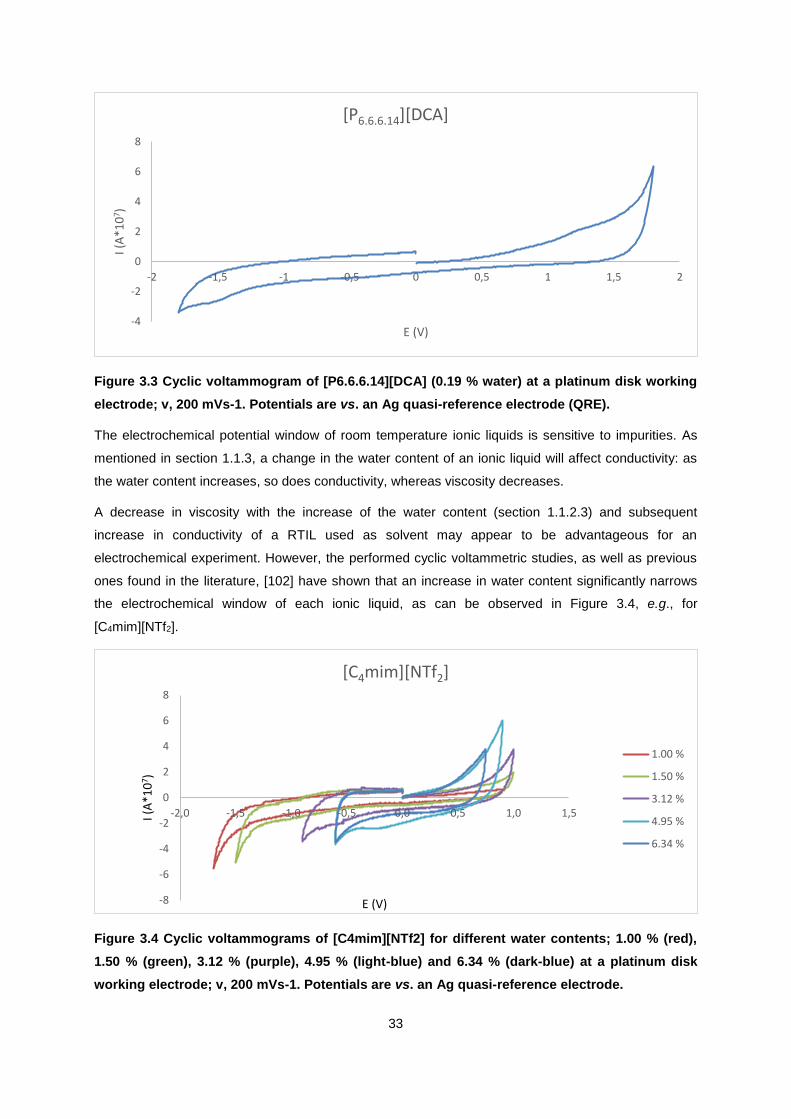
33
Figure 3.3 Cyclic voltammogram of [P6.6.6.14][DCA] (0.19 % water) at a platinum disk working
electrode; v, 200 mVs-1. Potentials are vs. an Ag quasi-reference electrode (QRE).
The electrochemical potential window of room temperature ionic liquids is sensitive to impurities. As
mentioned in section 1.1.3, a change in the water content of an ionic liquid will affect conductivity: as
the water content increases, so does conductivity, whereas viscosity decreases.
A decrease in viscosity with the increase of the water content (section 1.1.2.3) and subsequent
increase in conductivity of a RTIL used as solvent may appear to be advantageous for an
electrochemical experiment. However, the performed cyclic voltammetric studies, as well as previous
ones found in the literature, [102] have shown that an increase in water content significantly narrows
the electrochemical window of each ionic liquid, as can be observed in Figure 3.4, e.g., for
[C4mim][NTf2].
Figure 3.4 Cyclic voltammograms of [C4mim][NTf2] for different water contents; 1.00 % (red),
1.50 % (green), 3.12 % (purple), 4.95 % (light-blue) and 6.34 % (dark-blue) at a platinum disk
working electrode; v, 200 mVs-1. Potentials are vs. an Ag quasi-reference electrode.
-4
-2
0
2
4
6
8
-2 -1,5 -1 -0,5 0 0,5 1 1,5 2
I (A
*10
7 )
E (V)
[P6.6.6.14][DCA]
-8
-6
-4
-2
0
2
4
6
8
-2,0 -1,5 -1,0 -0,5 0,0 0,5 1,0 1,5I (A
*10
7 )
E (V)
[C4mim][NTf2]
1.00 %
1.50 %
3.12 %
4.95 %
6.34 %

34
For the series [Cnmim][NTf2] (n = 4, 6, or 8) a small increase in the water content of the IL leads to a
considerable reduction on the potential range available for electrochemical stability of the IL (Figure
3.5), [C4mim][NTf2] being the most affected. That can be due to the fact that [C4mim] is the smaller and
more symmetric of the three, so it as the less surface area to interact with the water molecules.
Figure 3.5 Potential window available in [C4mim][NTf2], [C6mim][NTf2] and [C8mim][NTf2] for
different water contents at a platinum disk working electrode; v, 200 mVs-1. Potentials are vs.
an Ag quasi-reference electrode (QRE).
1,0
2,0
3,0
4,0
5,0
0,0 1,0 2,0 3,0 4,0 5,0 6,0 7,0 8,0
Elec
tro
chem
ical
win
do
w (
V)
Water content (%)
[Cnmim][NTf2]
[C4mim][NTf2]
[C6mim][NTf2]
[C8mim][NTf2]

35
A similar behaviour was found for the ILs containing [Cl]- as an anion at which the cation was differed.
Trihexyl(tetradecyl)phosphonium ([P6.6.6.14]+), methyl(trioctyl)ammonium ([N1.8.8.8]+) and 1-hexyl-3-
methylimidazolium ([C6mim]+), where ([N1.8.8.8]+) is the cation in Aliquat 336, are being used, Figure
3.6. However, these ILs are not so sensitive to the presence of water as the series [Cnmim][NTf2], what
can be rationalized in terms of the large size of the cationic part, that promotes hydrophobicity, and
therefore, less sensitivity to the presence of water molecules.
Figure 3.6 Potential window available in ILs consisting of [Cl] as an anion and [P6.6.6.14],
[N1.8.8.8] (in Aliquat 336) and [C6mim] as a cation for different water contents at a platinum
disk working electrode; v, 200 mVs-1. Potentials are vs. an Ag quasi-reference electrode
A bigger decrease in electrochemical window is seen at [P6.6.6.14]Cl as is in [P6.6.6.14][DCA], Figure 3.7.
The difference between the two [P6.6.6.14] ILs with changing anion is not comparable to the change that
is seen when the cation is changed.
Figure 3.7 Potential window available in ILs consisting of [P6.6.6.14]+ as a cation and [Cl]- and
[DCA]- as an anion for different water contents at a platinum disk working electrode; v, 200
mVs-1. Potentials are vs. an Ag quasi-reference electrode (QRE).
1,5
2,0
2,5
3,0
3,5
4,0
4,5
0,0 5,0 10,0 15,0 20,0Elec
tro
chem
ical
win
do
w (
V)
Water content (%)
[Cl]-
[P6.6.6.14][Cl]
Aliquat336
[C6mim]Cl
0,0
0,5
1,0
1,5
2,0
2,5
3,0
3,5
4,0
4,5
0,0 2,0 4,0 6,0 8,0 10,0Elec
tro
chem
ical
win
do
w (
V)
Water content (%)
[P6.6.6.14]+
[P6.6.6.14][Cl]
[P.6.6.6.14][DCA]

36
In figure 3.8 the influence of the anion on the potential window is investigated at different water
contents. [C6mim]+ is considered as cation and the anions are respectively [NTf2]- and [Cl]-. A
significant decrease in potential range for an increasing water content is seen in both cases. If the
evolution of the two is compared on the other hand, no significant difference is seen.
O’Mahony et al. did not see a change in the potential window (3.3 V), when increasing the water
content from 0.22 % to 6,10 %, when measuring at a Pt working electrode. This is opposed to the
results that are found in this work, which are showing a considerable decrease in the potential window
when water is added.
Figure 3.8 Potential window available in ILs consisting of [C6mim]+ as a cation and [Cl]- and
[NTf2]- as an anion for different water contents at a platinum disk working electrode; v, 200
mVs-1. Potentials are vs. an Ag quasi-reference electrode (QRE).
The anion, in particular, was found to affect the level of water uptake. The hydrophobicity of the anions
adhered to the following trend: [NTf2]-] > [DCA]- > [Cl]-.
The process [Fe(C5H5)2]+/0 of the traditionally used reference compound ferrocene has been studied at
a platinum disk electrode in the ionic liquids [C6mim][Br], [C6mim][NTf2] and [P6.6.6.14][DCA].
A reversible, one-electron reduction process was observed (a typical cyclic voltammogram is shown
on Figure 3.9), and the measured half wave potential versus a silver quasi-reference electrode are
presented in Table 3.3.
1,8
2,0
2,2
2,4
2,6
2,8
3,0
3,2
3,4
3,6
0,0 5,0 10,0 15,0 20,0 25,0
Elec
tro
chem
ical
win
do
w (
V)
Water content (%)
[C6mim]+
C6mimCl
C6mimNTf2
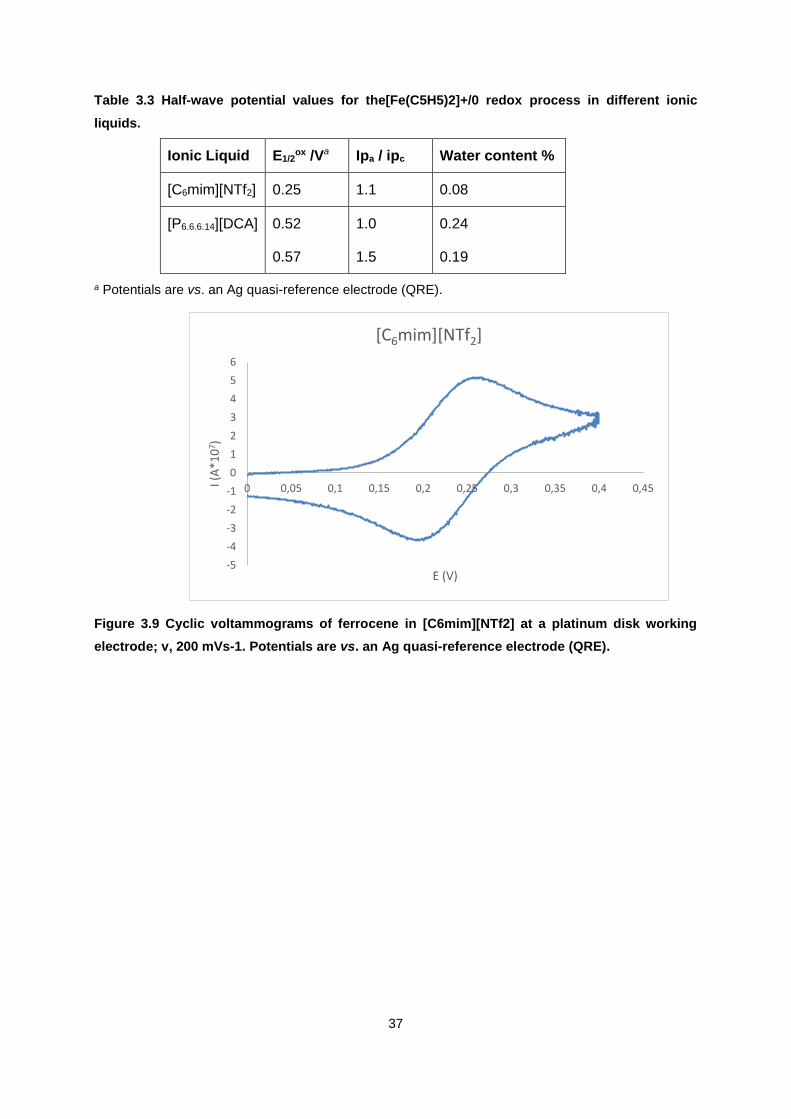
37
Table 3.3 Half-wave potential values for the[Fe(C5H5)2]+/0 redox process in different ionic
liquids.
Ionic Liquid E1/2ox /Va Ipa / ipc Water content %
[C6mim][NTf2] 0.25 1.1 0.08
[P6.6.6.14][DCA] 0.52
0.57
1.0
1.5
0.24
0.19
a Potentials are vs. an Ag quasi-reference electrode (QRE).
Figure 3.9 Cyclic voltammograms of ferrocene in [C6mim][NTf2] at a platinum disk working
electrode; v, 200 mVs-1. Potentials are vs. an Ag quasi-reference electrode (QRE).
-5
-4
-3
-2
-1
0
1
2
3
4
5
6
0 0,05 0,1 0,15 0,2 0,25 0,3 0,35 0,4 0,45I (A
*10
7)
E (V)
[C6mim][NTf2]

38
Peroxidative oxidation of cyclohexane
The catalytic activity of ferrocene in trihexyl(tetradecyl)phosphonium dicyanimide, [P6.6.6.14][DCA], was
tested as catalyst for the oxidation of cyclohexane with aqueous tert-butylhydroperoxide (ButOOH,
TBHP) as oxidizing agent, at 50 °C. Results are given in Table 3.4.
Table 3.4 Selected data for the catalytic oxidation of cyclohexane to cyclohexanol and
cyclohexanone catalyzed by ferrocene in [P6.6.6.14][DCA].
Entry
Catalyst amount
Additive
Yield %b
Total TONc
Total TOFd
(mol L−1) (mol L−1)
Cyclo-hexanone
Cyclo-hexanol
Total (h-1)
1
2.47x10⁻⁴ -
30 1.5 0 1.5 91.1 182.2
2 60 0.7 0 0.7 44.6 44.6
3 120 7.2 0 7.2 448.6 224.3
4 180 10.1 0 10.1 629.9 210.0
5 360 10.2 0 10.2 639.2 106.5
6
2.47x10⁻⁴
Na2CO3
(7.30x10⁻²) 120 14.3 0 14.3 892.9 446.5
7 HNO3
(1.60x10⁻¹) 120 15.7 0 15.7 980.0 490.0
8 1.32x10⁻²
3.70x10⁻²
4.94x10⁻²
-
120 5.8 0 5.8 7.2 3.6
9 120 7.7 0 7.7 3.3 1.7
10 120 6.9 0 6.9 2.2 1.1
aYield and TON determined by GC analysis (upon treatment with PPh3). bMolar yield (%) based on substrate, i.e.
moles of product (alcohol (OL) or ketone (ONE)) per 100 mol of cycloalkane.cTurnover number = number of moles
of products per mol of catalyst. d TOF = TON per hour.
Only cyclohexanone was produced by oxidation of cyclohexane in the above-mentioned conditions
(cyclohexanol was not detected, not even traces). A maximum cyclohexanone yield of 15.7% was
obtained (entry 7, Table 3.4) in the presence of acidic medium. This selectivity is rare, being the
cyclohexanol and cyclohexanone mixture the common products obtained.
Interestingly, both acidic and basic additives led to an enhancement of the amount of cyclohexanone
produced.
Martins et al. also found that the addition of HNO3 promotes the activity of the [FeCl2{η³-
HC(pz)3}]/CNT-Oxi-Na combination for the catalytic conversion of cyclohexane to both cyclohexanol
as cyclohexanone. [70]

39
G.B. Shul’pin et al. showed that the addition of a base can have an accelerating-, retardation- or
inhibiting effect on the decomposition of hydro peroxides. It is dependent on the composition of the
base, oxidant and the catalyst used. Some complexes, heterocyclic N-bases for say, probably play the
role of proton transfer reagent in a lot of oxidations. Thus stimulating the oxidation of alkanes. In other
cases, however, a base can deprotonate a reactive species, which leads to its inactivation. If a base is
added to manganese complex, the H2O2 decomposition will be greatly enhanced, accelerating the
oxidation rapidly. [75]
A reaction pathway for this reaction as is suggested by Nowotny et al. [103] is the direct-oxidation
reaction via the free-radical chain reaction pathway, Figure 3.10. It is the presumed mechanistic
pathway for the one-pot oxidation of cyclohexane with TBHP as an oxidant. This was the proposed
way of reaction with both the use of cobalt carboxylate complexes and vanadium exchanged zeolite Y.
In this case TBHP would be initiated by the combination of ferrocene and IL105, forming a
butylperoxide- and butyloxide radical. The exact change in the structure of both, causing the
radicalization isn’t sure, but the conversion from Fe(II) to Fe(III) seems the most probable. In the
propagation step these radicals would deprotonate cyclohexane, resulting in a cyclohexyl radical
which immediately converts to a cyclohexyl peroxy radical by oxygen dissolved in the reaction
medium. Nowotny et al. proposed a conversion to both cyclohexanone and cyclohexanol, but since
only cyclohexanone is formed the alcohol formation step can be discarded. As a termination step the
cyclohexyl peroxy radical will combine with butylperoxide radical to form cyclohexanone releasing both
oxygen and tert-butanol as byproduct. [103,104]

40
Figure 3.10 Proposed mechanism for cyclohexane oxidation via free-radical reaction pathway
over ferrocene as catalyst, making use of TBHP as oxidant. [104]
FeII(C5H5)2
FeIII(C5H5)2

41
Pigments
For determining the influence of the concentration and pH for each pigment, a calibration curve was
made for the working range of concentration and with the pH values used in the studies. (See section
2.3.4.3 for procedure and Annex 1 for figures). In all the pigments studied, a linear behavior for
absorbance vs concentration was found at all the pH values studied.
Therefor UV- spectra were taken, reading the absorbance’s at the highest point in the absorbance vs
wavelength graph. A linear behavior was observed for all the pigments. Table 3.5 Shows the
absorbance’s at the highest point determined for each pigment at the different pH values.
Table 3.5 Wavelength of Maximum Absorbance for the pigments at the studied pH values
Pigment λ (pH=2) /nm λ (pH=7) /nm λ (pH=12) /nm
Amaranth 521 521 493
Rhodamine 6G 524 524 524
Chrysoidine 455 450 403
Indigo 610 610 610
Tartrazine 421 423 425
Malachite green 616 616 /
Methyl violet 582 582 /
Methylene blue 662 662 662
A qualitative experiment subjecting both pigment, as a mixture of pigment and ionic liquid to the sun is
done to investigate the evolution of the color intensity of the aqueous pigment solution. The ultimate
goal is to see which pigment will migrate from the aqueous phase to the ionic liquid, comparing the
color intensity of the aqueous phase as a function of time. To complement the study, examination of
the change in color of the ionic liquid before and after the addition to the pigment solution by UV
measurements was performed. Only values above 1% are mentioned. This value was chosen
because it represents the minimum average value, in color variation, detected by a human eye.

42
For the liquid-liquid extraction, the pigments that showed a decrease in color intensity of the aqueous
phase and an increase in color intensity of the ionic liquid phase, were subsequently investigated. The
UV-spectra of several concentrations of pigment solution were taken. IL105 was added to the solution
and left untouched for 30 minutes at room temperature for the pigment to migrate from the aqueous
phase to the ionic liquid phase. UV-spectra were taken again and the absorbances were read at the
predefined wavelength showed in Table 3.5. The distribution ratios were calculated, as well as the
percentage of extraction. All the measurements were put in a graph of absorbance versus time. This
was done at a pH of 2, 7 and 12. pH is a measure of acidity (pH< 7) or basicity (pH> 7) of an aqueous
solution. The pH factor is very important in the adsorption process especially for dye adsorption. The
pH of a medium will control the magnitude of electrostatic charges which are imparted by the ionized
dye molecules. As a result the rate of adsorption will vary with the pH of an aqueous medium [106].
The effect of pH solution on the adsorption process can be studied by preparing adsorbent–adsorbate
solution with fixed adsorbent dose and dye concentration but with different pH by adding NaOH (1 M)
or HCl (0.1 M) solutions and then shaken until equilibrium.
The evolution of the color intensity of the aqueous solution and thus the magnitude in which the
pigment gets adsorbed out of the aqueous solution by the ionic liquid is recorded.
Therefore the absorbance of the pigment solution was measured at the maximum absorbance
wavelength point before the addition of IL105 and directly afterwards. Subsequently the mixture was
stored in an ambient environment and after 5, 10 and 30 minutes the absorbance was measured
again. Furthermore, the four aliphatic chains present in phosphonium-based IL (IL105) also confer a
higher hydrophobicity to the IL and a consequent higher capability for phase separation.
Recently, advanced oxidation processes (AOPs) has been developed to oxidize organic pollutants into
carbon dioxide, water and inorganic ions or transform into less complex structures. AOPs are based
on the generation of highly reactive species such as hydroxyl radicals (•OH), which have strong
oxidation potential and oxidise a large number of organic pollutants using hydrogen peroxide. The
influence of 30% H2O2, as oxidant, was explored visually at different times. The color intensity of the
aqueous phase of both the samples with as without IL105 were compared. The change in color of the
ionic liquid before and after the addition to the pigment solution was examined as well.
For the quantification, in the case of the oxidation with hydrogen peroxide (30%, v/v) the absorbances
were determined before and after the addition of the oxidant to the mixture of water and IL105. In
order to examine the evolution of the absorbance in time, measurements at different times are done.
Then the reaction rate was calculated. For amaranth this is given in Figure 3.11.

43
Influence of the pH
A visual comparison of the color at different pH’s is given in Table 3.6. For amaranth only a basic pH
of 12 has an influence on the color of the dye. This can be due to an alteration in the auxochromes of
Amaranth, Figure 1.8, being the hydroxyl group. If this group gets deprotonated a loss in color intensity
can be the consequence.
The influence of the pH on the color of Rhodamine 6G shows no difference between the samples is
seen at respectively pH is 2, 7 and 12.
The color of samples Chrysoidine at respectively pH is 2, 7 and 12 are visually compared. No
difference is seen between the samples at different pH’s, but the intensity of the pigment solution at a
pH of 12 decreased after 2.5 hours. This can be due to the change in the structure of chrysoidine. The
higher pH causes the loss of protons at the amine-functions of chrysoidine, Figure 1.8, thus causing a
loss in color intensity. In 1.2.1 amine-functions are mentioned as an auxochromic group, which
determine the color intensity. A change in their structure can change the color intensity tremendously.
For indigo no difference in color is seen between pH=2 and pH=7. When increasing the pH to a value
of twelve on the other hand, the color becomes yellow instead of blue and the intensity decreases
slightly in time. The change in color is due to Indigo being a pH indicator, which by definition a
halochromic chemical compound added in small amounts to a solution so the pH (acidity or basicity) of
the solution can be determined visually. Hence, a pH indicator is a chemical detector for hydronium
ions (H3O+) or hydrogen ions (H+) in the Arrhenius model. The decrease in color intensity can be
clarified by the amine functions getting deprotonated.
The qualitative investigation on the influence of pH on the color intensity of Tartrazine shows that no
visual difference in color is seen at any of the pH’s (2, 7 and 12).
Table 3.6 shows a visual comparison of Malachite green at several pH’s, being 2, 7 and 12. A change
in color is seen when raising or lowering the pH, to respectively 2 and 12. A complete disappearance
of color at pH 12 is observable. In 1.2.3 it was mentioned that the pigment is green between a pH of
1.8 and 11.5 and loses its color above a pH of 13.2. The early disappearance of color is probably due
to the pH being slightly higher than 12. As the pH decreases the color shifts more to a blue-green as
opposed to blue, when neutral. The change in color is due to Malachite green being a pH indicator.
The influence of the pH on Methyl violet is shown in Table 3.6. The increase in acidity to a pH of 2,
does not have a visual impact on methyl violet. When NaOH is added, the aqueous solution clears out
gradually, with a complete loss of color after 2.5 hours. Since Methyl violet is a protonated amine it is
to be suspected that the color intensity of the pigment would decrease tremendously with an increase
in pH, resulting in the formation of a neutral dye.
For methylene blue, at different pH’s (2, 7 and 12), it can be concluded that the pH does not have an
influence on the color of the dye, Table 3.6.
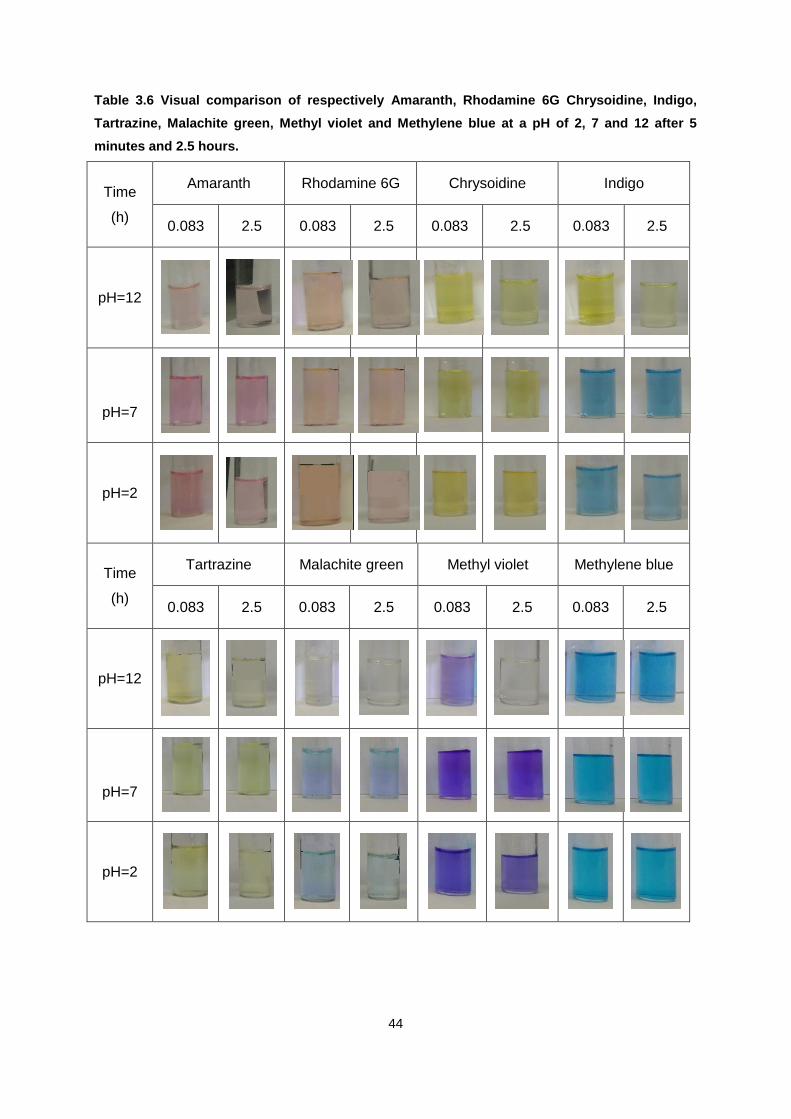
44
Table 3.6 Visual comparison of respectively Amaranth, Rhodamine 6G Chrysoidine, Indigo,
Tartrazine, Malachite green, Methyl violet and Methylene blue at a pH of 2, 7 and 12 after 5
minutes and 2.5 hours.
Time
(h)
Amaranth Rhodamine 6G Chrysoidine Indigo
0.083 2.5 0.083 2.5 0.083 2.5 0.083 2.5
pH=12
pH=7
pH=2
Time
(h)
Tartrazine Malachite green Methyl violet Methylene blue
0.083 2.5 0.083 2.5 0.083 2.5 0.083 2.5
pH=12
pH=7
pH=2
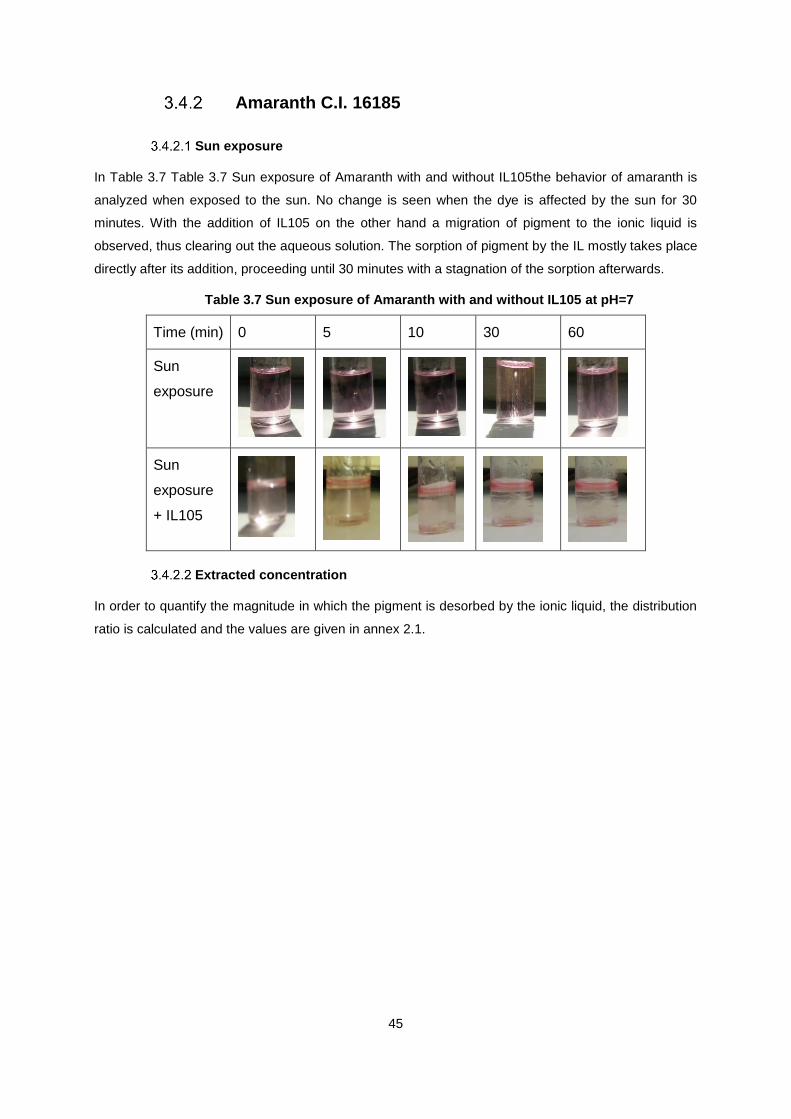
45
Amaranth C.I. 16185
Sun exposure
In Table 3.7 Table 3.7 Sun exposure of Amaranth with and without IL105the behavior of amaranth is
analyzed when exposed to the sun. No change is seen when the dye is affected by the sun for 30
minutes. With the addition of IL105 on the other hand a migration of pigment to the ionic liquid is
observed, thus clearing out the aqueous solution. The sorption of pigment by the IL mostly takes place
directly after its addition, proceeding until 30 minutes with a stagnation of the sorption afterwards.
Table 3.7 Sun exposure of Amaranth with and without IL105 at pH=7
Time (min) 0 5 10 30 60
Sun
exposure
Sun
exposure
+ IL105
Extracted concentration
In order to quantify the magnitude in which the pigment is desorbed by the ionic liquid, the distribution
ratio is calculated and the values are given in annex 2.1.

46
Evolution of the extraction in time
Figure 3.11 shows the magnitude in which Amaranth migrates to the ionic liquid in function of time at
different pH’s. We can see in the figure that the maximum (15%) is achieved by pH=12. Immediately
after the addition of IL105, at pH=2, promotes an 8% extraction while at pH= 7 or 12, the value is
smaller. Until 10 minutes the acid and basic form of the pigment have similar values of extraction, but
at 30minutes the highest values belongs to the basic form of the pigment. This is due to the anionic
form prevailing over the acidic one. As can be seen, higher values of extraction are obtained at higher
pH than at low, consistent with the preferential extraction of the anionic, since pKa is 10.36.
Figure 3.11 The evolution of the liquid-liquid extraction of amaranth by IL105 in time at pH’s of
2, 7 and 12.
Oxidation by 30% H2O2
The influence of IL105 on the intensity of Amaranth is investigated, when influenced by 30% hydro
peroxide. In Table 3.8 Table 3.8 Oxidation of Amaranth by 30% H2O2 with and without IL105the result
is given. It is noticeable that the color intensity of the pigment decreases gradually, with a total
disappearance at the end. In the presence of ionic liquid on the other hand, the change in intensity is
much slower than it is in the absence of IL. The amount of hydrogen peroxide was not sufficient to
cause the disappearance of the coloring effect of the pigment entirely. The ionic liquid ensures a
protection against the oxidative effect of the hydrogen peroxide. This is due to the IL withstanding the
effect of hydrogen peroxide almost completely. A decrease in color intensity is seen, but only in a
small magnitude. The aqueous phase in the same sample undergoes the same effect as the one
without ionic liquid, losing its color completely.

47
Table 3.8 Oxidation of Amaranth by 30% H2O2 with and without IL105 at pH=7
Time (h) 0 0.166 0.5 72
30%H2O2
Time (h) 0 0.166 0.5 72
30%H2O2
+ IL105
Figure 3.12 shows the evolution of the dye intensity after the addition of hydrogen peroxide.
Qualitatively it wasn’t clear that the dye already showed that much of a difference after 30min.
In order to quantify this decrease, UV-VIS was used as a technique. After 30 minutes the
absorbance of the pigment solution already reduced from 0.054 to 0.040, making it a significant
degradation of the pigment.
In the same figure a graph is shown that displays the speed in which the oxidation reaction of
amaranth by 30% hydrogen peroxide occurs. The slope presents the first order reaction rate for the
oxidation of Amaranth.
Figure 3.12 The evolution of the absorbance of Amaranth in time when influenced by 30 % H2O2
at pH=7, Right corner: The Napierian logarithm of the ratio of absorbance and the initial
absorbance of Amaranth vs. time
0
0,01
0,02
0,03
0,04
0,05
0,06
400 450 500 550 600 650 700
Ab
sorb
ance
λ (nm)
Amaranth
Pigment 150uL H2O2 5 min 10 min 30min
-0,4
-0,2
0
0 10 20 30
ln(A
/A0)
Time (min)

48
Rhodamine 6G C.I. 45160
Sun exposure
In Table 3.9 the behavior of Rhodamine 6G is analyzed when exposed to the sun. No change is seen
when the dye is affected by the sun for 1 hour. With the addition of IL105 on the other hand a small
migration of dye from the aqueous solution to the IL is seen. The extraction by the ionic liquid is not as
strong as the one found in 3.4.2.1, but it is considerable.
Table 3.9 Sun exposure of Rhodamine 6G with and without IL105
Time (min) 0 5 10 30
Sun
exposure
Sun
exposure
+ IL105
Evolution of the extraction in time
In Figure 3.13 the extraction of Rhodamine 6G by the ionic liquid, IL105 is displayed. A big increase
extraction occurs, when the basicity is increased to a pH of 12. It shows a big initial increase of 15%
and increases until 30 minutes.
The migration of pigment from the aqueous solution to the IL in a neutral solution has a small
magnitude, with a stagnation of this process after 10 minutes. In acid media, no decrease in
absorbance is seen whatsoever. In other words, acidity is detrimental for the sorption process of
Rhodamine 6G to IL105.
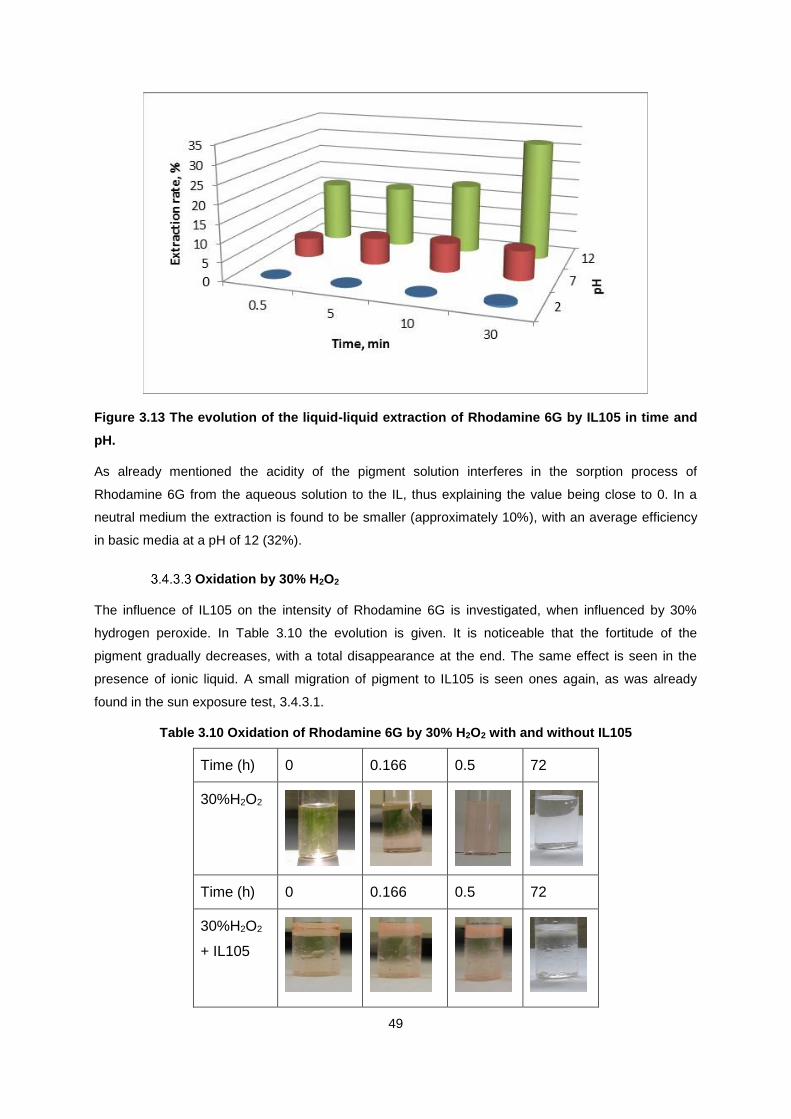
49
Figure 3.13 The evolution of the liquid-liquid extraction of Rhodamine 6G by IL105 in time and
pH.
As already mentioned the acidity of the pigment solution interferes in the sorption process of
Rhodamine 6G from the aqueous solution to the IL, thus explaining the value being close to 0. In a
neutral medium the extraction is found to be smaller (approximately 10%), with an average efficiency
in basic media at a pH of 12 (32%).
Oxidation by 30% H2O2
The influence of IL105 on the intensity of Rhodamine 6G is investigated, when influenced by 30%
hydrogen peroxide. In Table 3.10 the evolution is given. It is noticeable that the fortitude of the
pigment gradually decreases, with a total disappearance at the end. The same effect is seen in the
presence of ionic liquid. A small migration of pigment to IL105 is seen ones again, as was already
found in the sun exposure test, 3.4.3.1.
Table 3.10 Oxidation of Rhodamine 6G by 30% H2O2 with and without IL105
Time (h) 0 0.166 0.5 72
30%H2O2
Time (h) 0 0.166 0.5 72
30%H2O2
+ IL105
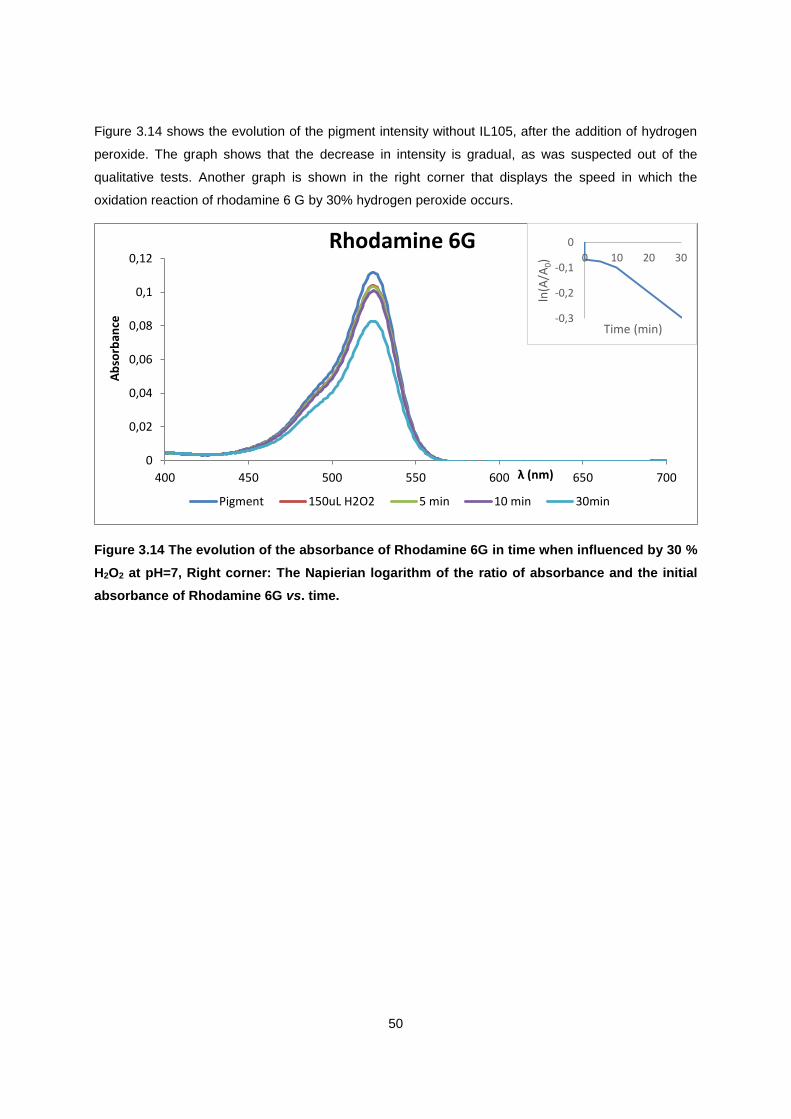
50
Figure 3.14 shows the evolution of the pigment intensity without IL105, after the addition of hydrogen
peroxide. The graph shows that the decrease in intensity is gradual, as was suspected out of the
qualitative tests. Another graph is shown in the right corner that displays the speed in which the
oxidation reaction of rhodamine 6 G by 30% hydrogen peroxide occurs.
Figure 3.14 The evolution of the absorbance of Rhodamine 6G in time when influenced by 30 %
H2O2 at pH=7, Right corner: The Napierian logarithm of the ratio of absorbance and the initial
absorbance of Rhodamine 6G vs. time.
0
0,02
0,04
0,06
0,08
0,1
0,12
400 450 500 550 600 650 700
Ab
sorb
ance
λ (nm)
Rhodamine 6G
Pigment 150uL H2O2 5 min 10 min 30min
-0,3
-0,2
-0,1
0
0 10 20 30
ln(A
/A0)
Time (min)
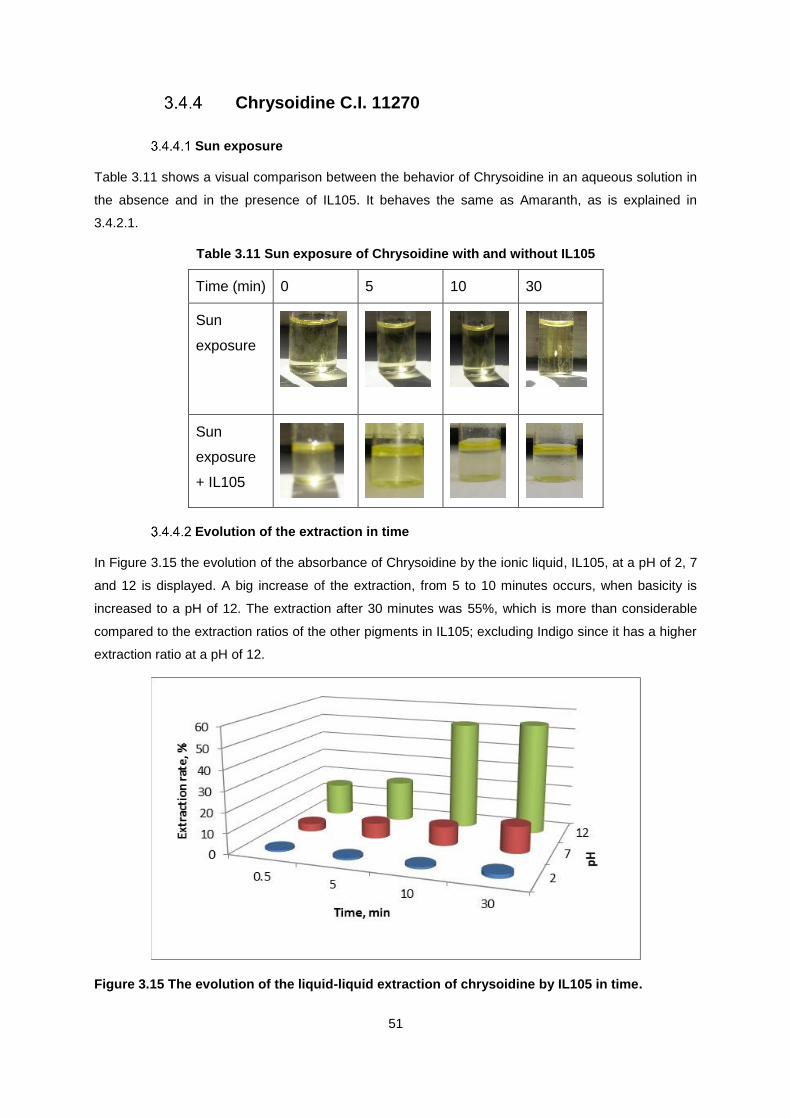
51
Chrysoidine C.I. 11270
Sun exposure
Table 3.11 shows a visual comparison between the behavior of Chrysoidine in an aqueous solution in
the absence and in the presence of IL105. It behaves the same as Amaranth, as is explained in
3.4.2.1.
Table 3.11 Sun exposure of Chrysoidine with and without IL105
Time (min) 0 5 10 30
Sun
exposure
Sun
exposure
+ IL105
Evolution of the extraction in time
In Figure 3.15 the evolution of the absorbance of Chrysoidine by the ionic liquid, IL105, at a pH of 2, 7
and 12 is displayed. A big increase of the extraction, from 5 to 10 minutes occurs, when basicity is
increased to a pH of 12. The extraction after 30 minutes was 55%, which is more than considerable
compared to the extraction ratios of the other pigments in IL105; excluding Indigo since it has a higher
extraction ratio at a pH of 12.
Figure 3.15 The evolution of the liquid-liquid extraction of chrysoidine by IL105 in time.

52
No comparison is possible because the use of ionic liquids with this pigment never been
tested before.
Oxidation by 30% H2O2
The influence of IL105 on the intensity of Chrysoidine is investigated, when influenced by 30%
hydrogen peroxide, in Table 3.12 the evolution is given. Same behavior is seen as with Amaranth,
3.4.2.4, with the only difference that the IL withstands the effect of hydrogen peroxide completely. No
degradation of Chrysoidine in the IL is seen at all. This could be explained by a stronger association
between IL 105 and Chrysoidine.
Table 3.12 Oxidation of Chrysoidine by 30% H2O2 with and without IL105
Time (h) 0 0.166 0.5 72
30%H2O2
Time (h) 0 0.166 0.5 72
30%H2O2
+ IL105
Figure 3.16 shows the evolution of the dye intensity after the addition of hydrogen peroxide. No
measurement directly after the addition of 30% H2O2 was done. Since this addition will dilute the
pigment solution slightly, the initial effect of the hydrogen peroxide can only be estimated. The
comparisons will have to be done for the measurements after 5, 10 and 30 minutes, in order to
decently compare the results.
The graph shows that the decrease in dye intensity is little with an absorbance of 0.1265 after 5 and
0.1108 after 30 minutes, thus only decreasing 12.41%.
In Figure 3.16 a graph is shown on the right, which displays the speed in which the oxidation reaction
of Chrysoidine by 30% hydrogen peroxide occurs, with the slopes being of the first order reaction
rates.

53
Figure 3.16 The evolution of the absorbance of Chrysoidine in time when influenced by 30 %
H2O2 at pH=7, Right corner: The Napierian logarithm of the ratio of absorbance and the initial
absorbance of Chrysoidine vs. time
Indigo C.I. 73015 A
Sun exposure
Table 3.13 shows a visual comparison between the behavior of Indigo in an aqueous solution in the
absence and in the presence of IL105, when exposed to the sun. It behaves the same as Amaranth,
as is explained in 3.4.2.1.
Table 3.13 Sun exposure of Indigo with and without IL105
Time (min) 0 5 10 30
Sun
exposure
Sun
exposure
+ IL105
0
0,02
0,04
0,06
0,08
0,1
0,12
0,14
0,16
0,18
0,2
300 350 400 450 500 550 600 650 700
Aso
rpti
on
λ (nm)
Chrysoidine
Pigment 5min 10 min 30 min
-0,5
0
0 10 20 30
ln(A
/A0)
Time (min)
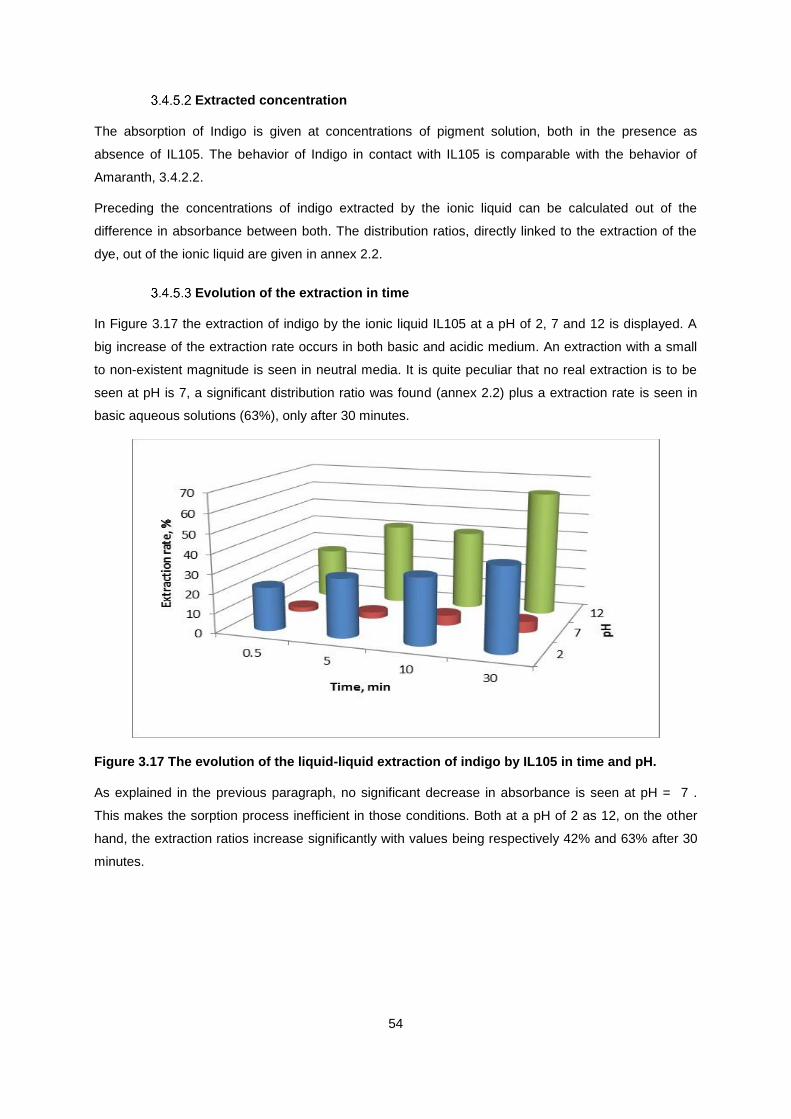
54
Extracted concentration
The absorption of Indigo is given at concentrations of pigment solution, both in the presence as
absence of IL105. The behavior of Indigo in contact with IL105 is comparable with the behavior of
Amaranth, 3.4.2.2.
Preceding the concentrations of indigo extracted by the ionic liquid can be calculated out of the
difference in absorbance between both. The distribution ratios, directly linked to the extraction of the
dye, out of the ionic liquid are given in annex 2.2.
Evolution of the extraction in time
In Figure 3.17 the extraction of indigo by the ionic liquid IL105 at a pH of 2, 7 and 12 is displayed. A
big increase of the extraction rate occurs in both basic and acidic medium. An extraction with a small
to non-existent magnitude is seen in neutral media. It is quite peculiar that no real extraction is to be
seen at pH is 7, a significant distribution ratio was found (annex 2.2) plus a extraction rate is seen in
basic aqueous solutions (63%), only after 30 minutes.
Figure 3.17 The evolution of the liquid-liquid extraction of indigo by IL105 in time and pH.
As explained in the previous paragraph, no significant decrease in absorbance is seen at pH = 7 .
This makes the sorption process inefficient in those conditions. Both at a pH of 2 as 12, on the other
hand, the extraction ratios increase significantly with values being respectively 42% and 63% after 30
minutes.
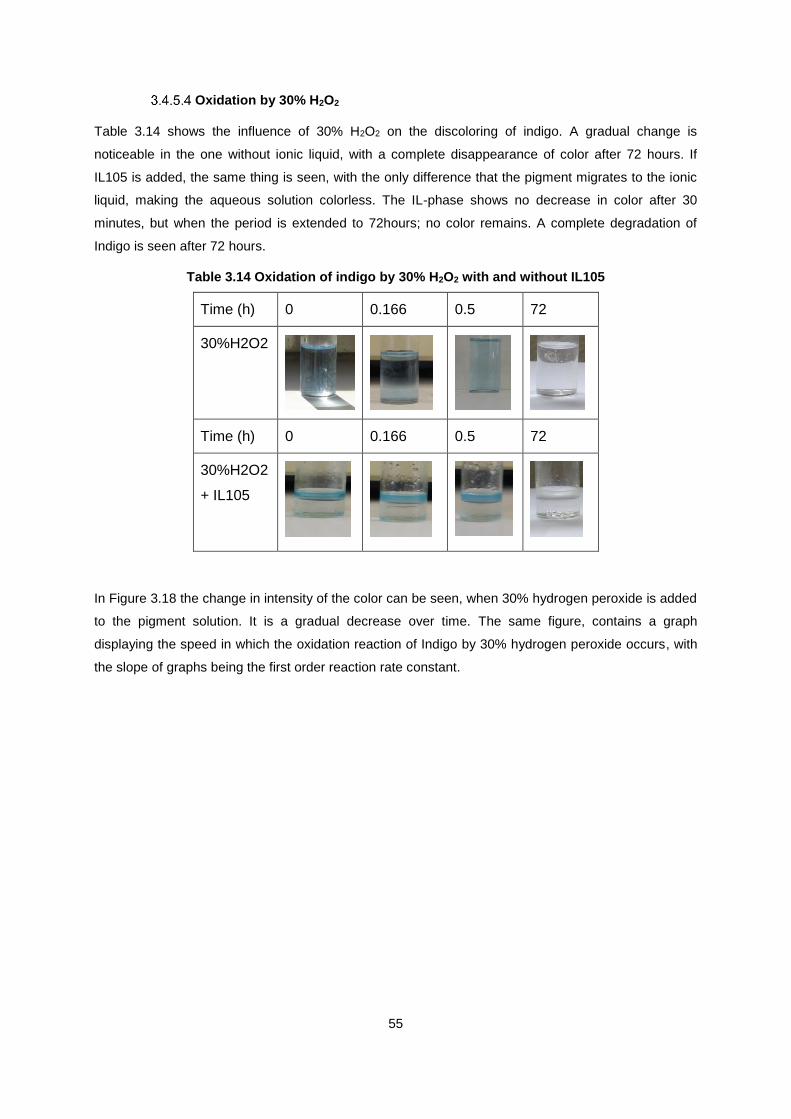
55
Oxidation by 30% H2O2
Table 3.14 shows the influence of 30% H2O2 on the discoloring of indigo. A gradual change is
noticeable in the one without ionic liquid, with a complete disappearance of color after 72 hours. If
IL105 is added, the same thing is seen, with the only difference that the pigment migrates to the ionic
liquid, making the aqueous solution colorless. The IL-phase shows no decrease in color after 30
minutes, but when the period is extended to 72hours; no color remains. A complete degradation of
Indigo is seen after 72 hours.
Table 3.14 Oxidation of indigo by 30% H2O2 with and without IL105
Time (h) 0 0.166 0.5 72
30%H2O2
Time (h) 0 0.166 0.5 72
30%H2O2
+ IL105
In Figure 3.18 the change in intensity of the color can be seen, when 30% hydrogen peroxide is added
to the pigment solution. It is a gradual decrease over time. The same figure, contains a graph
displaying the speed in which the oxidation reaction of Indigo by 30% hydrogen peroxide occurs, with
the slope of graphs being the first order reaction rate constant.
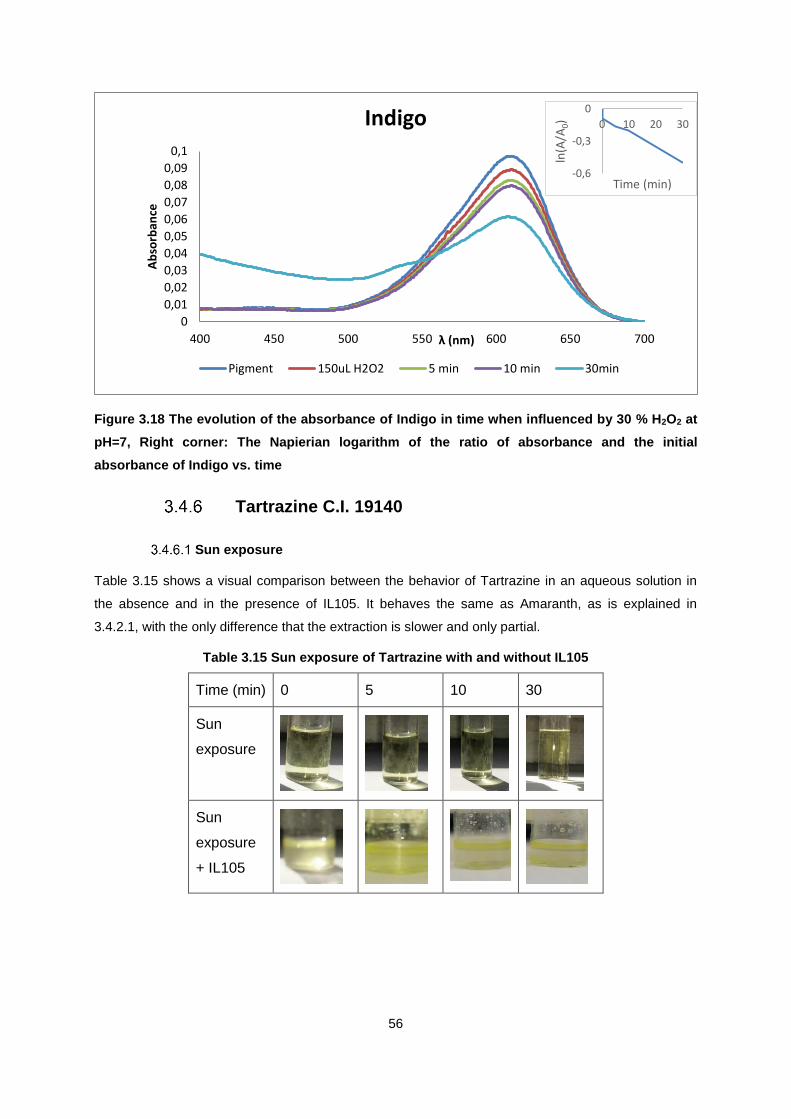
56
Figure 3.18 The evolution of the absorbance of Indigo in time when influenced by 30 % H2O2 at
pH=7, Right corner: The Napierian logarithm of the ratio of absorbance and the initial
absorbance of Indigo vs. time
Tartrazine C.I. 19140
Sun exposure
Table 3.15 shows a visual comparison between the behavior of Tartrazine in an aqueous solution in
the absence and in the presence of IL105. It behaves the same as Amaranth, as is explained in
3.4.2.1, with the only difference that the extraction is slower and only partial.
Table 3.15 Sun exposure of Tartrazine with and without IL105
Time (min) 0 5 10 30
Sun
exposure
Sun
exposure
+ IL105
0
0,01
0,02
0,03
0,04
0,05
0,06
0,07
0,08
0,09
0,1
400 450 500 550 600 650 700
Ab
sorb
ance
λ (nm)
Indigo
Pigment 150uL H2O2 5 min 10 min 30min
-0,6
-0,3
0
0 10 20 30
ln(A
/A0)
Time (min)

57
Evolution of the extraction in time
In Figure 3.19 the extraction of Tartrazine by the ionic liquid, IL105 is displayed. A decrease in
absorbance and thus the migration of pigment to the ionic liquid is seen at all the pH values studied.
The magnitude in which it appears is the highest at a pH of 7. The alteration of the pH affects the
sorption process of pigment from the aqueous phase to the ionic liquid negatively.
Figure 3.19 The evolution of the liquid-liquid extraction of tartrazine by IL105 in time and pH.
As was expected in the previous paragraph, the distribution ratio is the highest in neutral media
(7.1909). The D-values at a pH of 2 and 12 are comparable, with values of respectively 2.5358 and
1.8878 (See annex 2.2). Since the ratios are in the 1-10 range the sorption process is of average
efficiency.
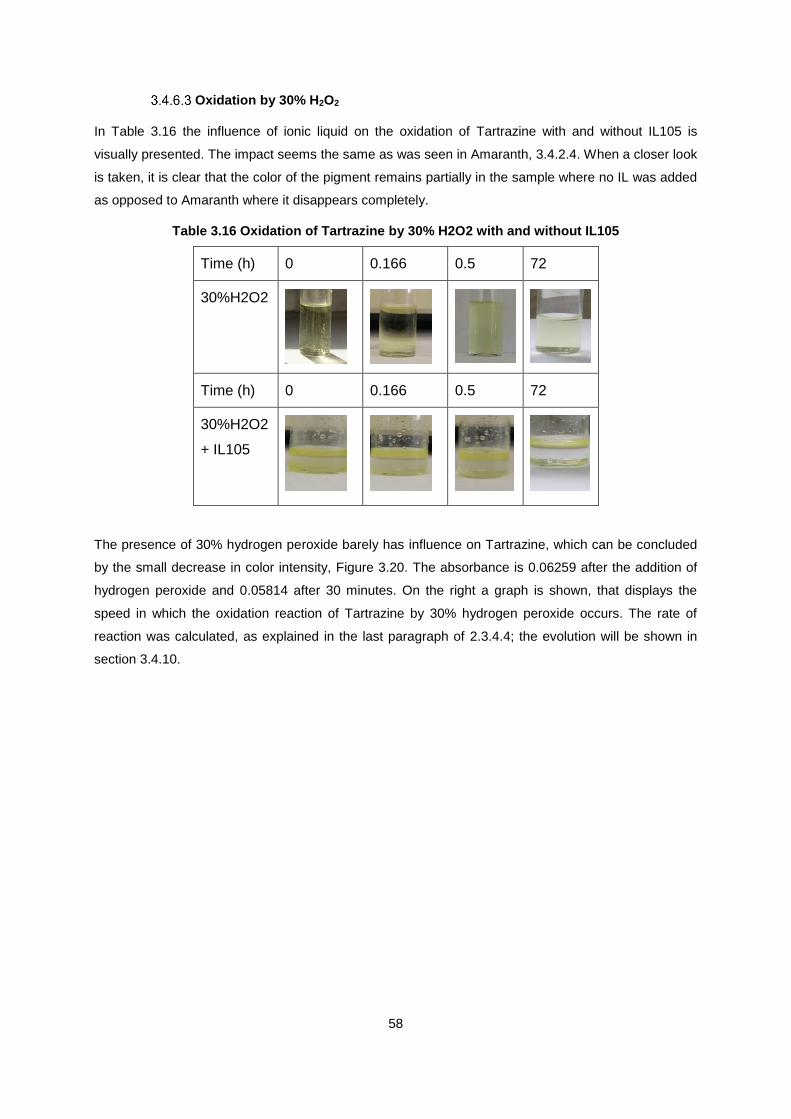
58
Oxidation by 30% H2O2
In Table 3.16 the influence of ionic liquid on the oxidation of Tartrazine with and without IL105 is
visually presented. The impact seems the same as was seen in Amaranth, 3.4.2.4. When a closer look
is taken, it is clear that the color of the pigment remains partially in the sample where no IL was added
as opposed to Amaranth where it disappears completely.
Table 3.16 Oxidation of Tartrazine by 30% H2O2 with and without IL105
The presence of 30% hydrogen peroxide barely has influence on Tartrazine, which can be concluded
by the small decrease in color intensity, Figure 3.20. The absorbance is 0.06259 after the addition of
hydrogen peroxide and 0.05814 after 30 minutes. On the right a graph is shown, that displays the
speed in which the oxidation reaction of Tartrazine by 30% hydrogen peroxide occurs. The rate of
reaction was calculated, as explained in the last paragraph of 2.3.4.4; the evolution will be shown in
section 3.4.10.
Time (h) 0 0.166 0.5 72
30%H2O2
Time (h) 0 0.166 0.5 72
30%H2O2
+ IL105

59
Figure 3.20 The evolution of the absorbance of Tartrazine in time when influenced by 30 % H2O2
at pH=7, Right corner: The Napierian logarithm of the ratio of absorbance and the initial
absorbance of Tartrazine vs. time.
Malachite green C.I. 42000
Sun exposure
Table 3.17 shows a visual comparison between the behavior of Malachite green in an aqueous
solution in the absence and in the presence of IL105. Malachite green is distributed over both the
aqueous phase as the IL phase. No preference for any of the phases is visually noticeable, while
Rhodamine 6G clearly prefers the IL phase.
Table 3.17 Sun exposure of Malachite green with and without IL105
Time (min) 0 5 10 30
Sun
exposure
Sun
exposure
+ IL105
0,00
0,02
0,04
0,06
0,08
0,10
0,12
200 300 400 500 600 700
Ab
sorb
ance
λ (nm)
Tartrazine
Pigment 150uL H2O2 5 min 10 min 30min
-0,2
-0,1
0
0 10 20 30
ln(A
/A0)
Time (min)
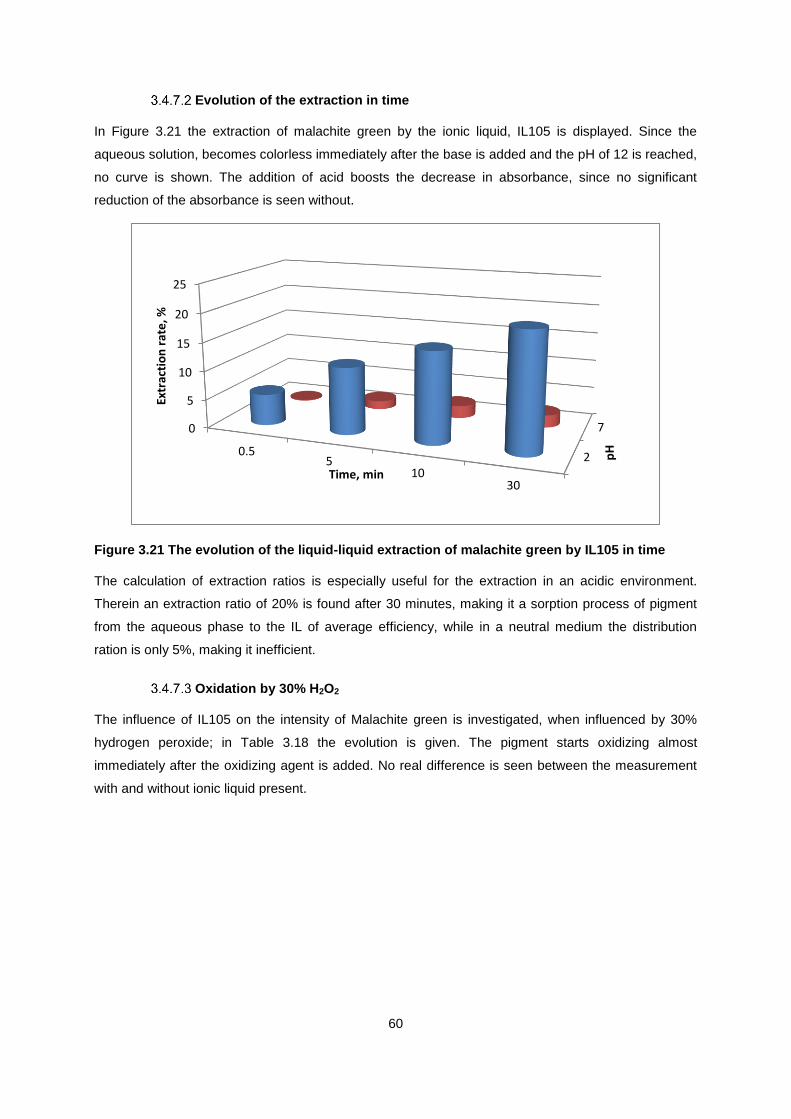
60
Evolution of the extraction in time
In Figure 3.21 the extraction of malachite green by the ionic liquid, IL105 is displayed. Since the
aqueous solution, becomes colorless immediately after the base is added and the pH of 12 is reached,
no curve is shown. The addition of acid boosts the decrease in absorbance, since no significant
reduction of the absorbance is seen without.
Figure 3.21 The evolution of the liquid-liquid extraction of malachite green by IL105 in time
The calculation of extraction ratios is especially useful for the extraction in an acidic environment.
Therein an extraction ratio of 20% is found after 30 minutes, making it a sorption process of pigment
from the aqueous phase to the IL of average efficiency, while in a neutral medium the distribution
ration is only 5%, making it inefficient.
Oxidation by 30% H2O2
The influence of IL105 on the intensity of Malachite green is investigated, when influenced by 30%
hydrogen peroxide; in Table 3.18 the evolution is given. The pigment starts oxidizing almost
immediately after the oxidizing agent is added. No real difference is seen between the measurement
with and without ionic liquid present.
2
70
5
10
15
20
25
0.55
1030
pH
Extr
acti
on
rat
e, %
Time, min

61
Table 3.18 Oxidation of Malachite green by 30% H2O2 with and without IL105
Time (h) 0 0.166 0.5 72
30%H2O2
Time (h) 0 0.166 0.5 72
30%H2O2
+ IL105
Out of the visual representation of the solution of malachite green and hydrogen peroxide one could
conclude that the color already disappears after 10 minutes. When UV-VIS measurements are done
on the other hand, it is seen that a longer time is needed to fully degrade Malachite green, thus
retaining its color partially. This change in absorbance versus time, can be seen in Figure 3.22. A
graph displaying the speed in which the oxidation reaction of Malachite green by 30% hydrogen
peroxide occurs is shown in the right hand corner.
Figure 3.22 The evolution of the absorbance of Malachite green in time when influenced by 30
% H2O2 at pH=7, Right corner: The Napierian logarithm of the ratio of absorbance and the initial
absorbance of Malachite green vs. time.
0
0,01
0,02
0,03
0,04
0,05
0,06
500 550 600 650 700
Ab
aso
rban
ce
λ (nm)
Malachite green
Pigment 150uL H2O2 5 min 10 min 30min
-2
-1
0
0 10 20 30
ln(A
/A0)
Time (min)

62
Methyl violet C.I. 42535
Sun exposure
Table 3.19 shows a visual comparison between the behavior of methyl violet in an aqueous solution in
the absence and in the presence of IL105. No difference is seen between both, since Methyl violet
does not show any affinity for the ionic liquid.
Table 3.19 Sun exposure of Methyl violet with and without IL105
Time (min) 0 5 10 30
Sun
exposure
Sun
exposure
+ IL105

63
Evolution of the extraction in time
Methyl Violet (MV) is a protonated amine. Not unexpectedly then, MV partitioning is more sensitive to
changes in the aqueous pH than is the distribution of the other cationic dyes, like methylene blue.
Specifically, increasing pH, which would be accompanied by deprotonation of MVH+ to yield the
neutral dye, results in a decrease in the extraction. In Figure 3.23 the evolution of the absorbance in
time is given for the contact between IL105 and Methyl violet.
.
Figure 3.23 The evolution of the liquid-liquid extraction of methyl violet by IL105 in time and
pH.
Because Methyl violet is a protonated amine it is not unexpected that the methyl violet partitioning is
sensitive to changes in the aqueous pH. Increasing the pH, would be accompanied by deprotonation
of the amine-function, yielding a neutral dye, results in a decrease of the distribution ratio, annex 2.2.
In this case it is seen indeed, that in an acidic medium the sorption of methyl violet by IL105 is of more
significance than in a neutral medium.
Oxidation by 30% H2O2
The influence of IL105 on the intensity of methyl violet is investigated, when influenced by 30%
hydrogen peroxide; in Table 3.20 the evolution is given. The pigment starts oxidizing quite rapidly after
the oxidizing agent is added, almost losing its color after 30 minutes.
Extraction of the dye by IL105 is seen after 5minutes. The aqueous phase will lose its color even
faster than it does without the presence of ionic liquid. In the ionic liquid phase on the other hand, the
degradation of Methyl violet is much slower compared to the speed of degradation in the pigment
solution without IL added.
2
70
1
2
3
4
0.55
1030
pH
Extr
acti
on
rat
e, %
Time, min

64
Table 3.20 Oxidation of Methyl violet by 30% H2O2 with and without IL105
Time (h) 0 0.166 0.5 72
30%H2O2
Time (h) 0 0.166 0.5 72
30%H2O2
+ IL105
If only Table 3.20 would be examined, it would appear that almost all the pigment is degraded after 10
minutes. If Figure 3.24 is taken into account it can be seen that, that is not entirely true. The intensity
of the dye decreases gradually. The graph also contains a graph displaying the speed in which the
oxidation reaction of Methyl violet by 30% hydrogen peroxide occurs. It is shown in the right hand
corner.
Figure 3.24 The evolution of the absorbance of Methyl violet in time when influenced by 30 %
H2O2 at pH=7, Right corner: The Napierian logarithm of the ratio of absorbance and the initial
absorbance of Methyl violet vs. time.
0
0,05
0,1
0,15
0,2
0,25
0,3
0,35
400 450 500 550 600 650 700
Ab
sorb
ance
λ (nm)
Methyl violet
Pigment 150uL H2O2 5 min 10 min 30min
-0,6
-0,1 0 10 20 30
ln(A
/A0)
Time (min)
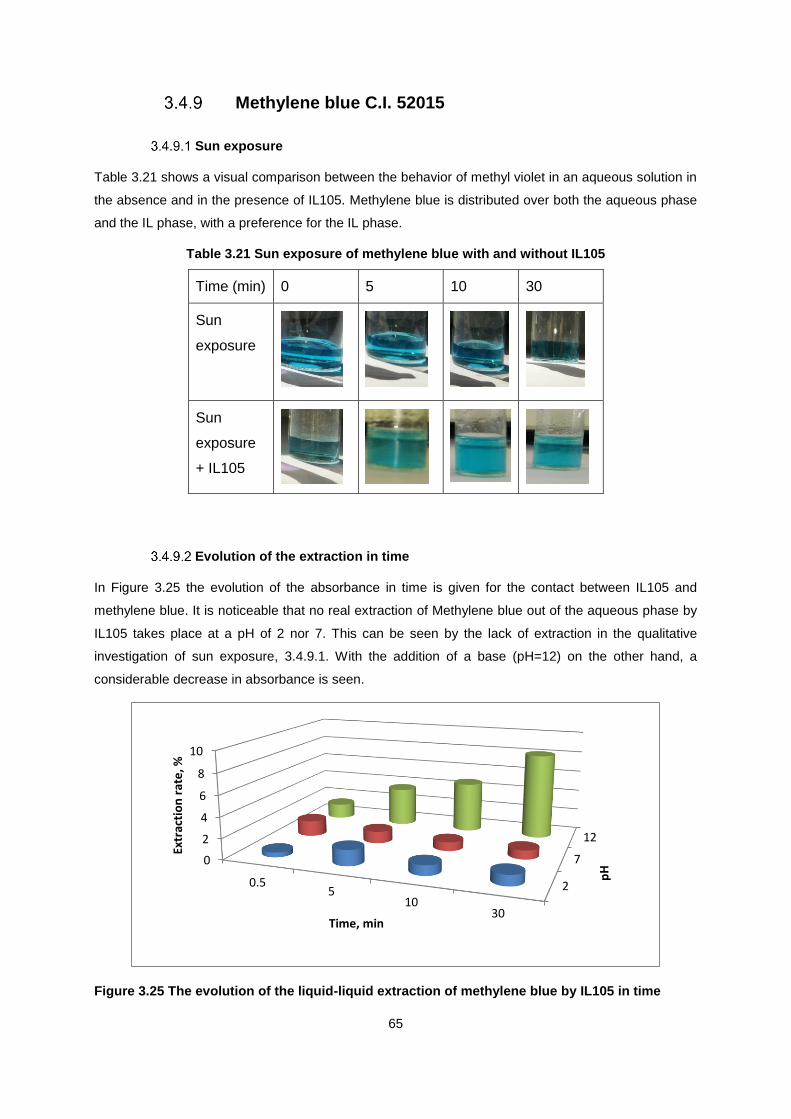
65
Methylene blue C.I. 52015
Sun exposure
Table 3.21 shows a visual comparison between the behavior of methyl violet in an aqueous solution in
the absence and in the presence of IL105. Methylene blue is distributed over both the aqueous phase
and the IL phase, with a preference for the IL phase.
Table 3.21 Sun exposure of methylene blue with and without IL105
Time (min) 0 5 10 30
Sun
exposure
Sun
exposure
+ IL105
Evolution of the extraction in time
In Figure 3.25 the evolution of the absorbance in time is given for the contact between IL105 and
methylene blue. It is noticeable that no real extraction of Methylene blue out of the aqueous phase by
IL105 takes place at a pH of 2 nor 7. This can be seen by the lack of extraction in the qualitative
investigation of sun exposure, 3.4.9.1. With the addition of a base (pH=12) on the other hand, a
considerable decrease in absorbance is seen.
Figure 3.25 The evolution of the liquid-liquid extraction of methylene blue by IL105 in time
2
7
12
0
2
4
6
8
10
0.55
1030
pH
Extr
acti
on
rat
e, %
Time, min
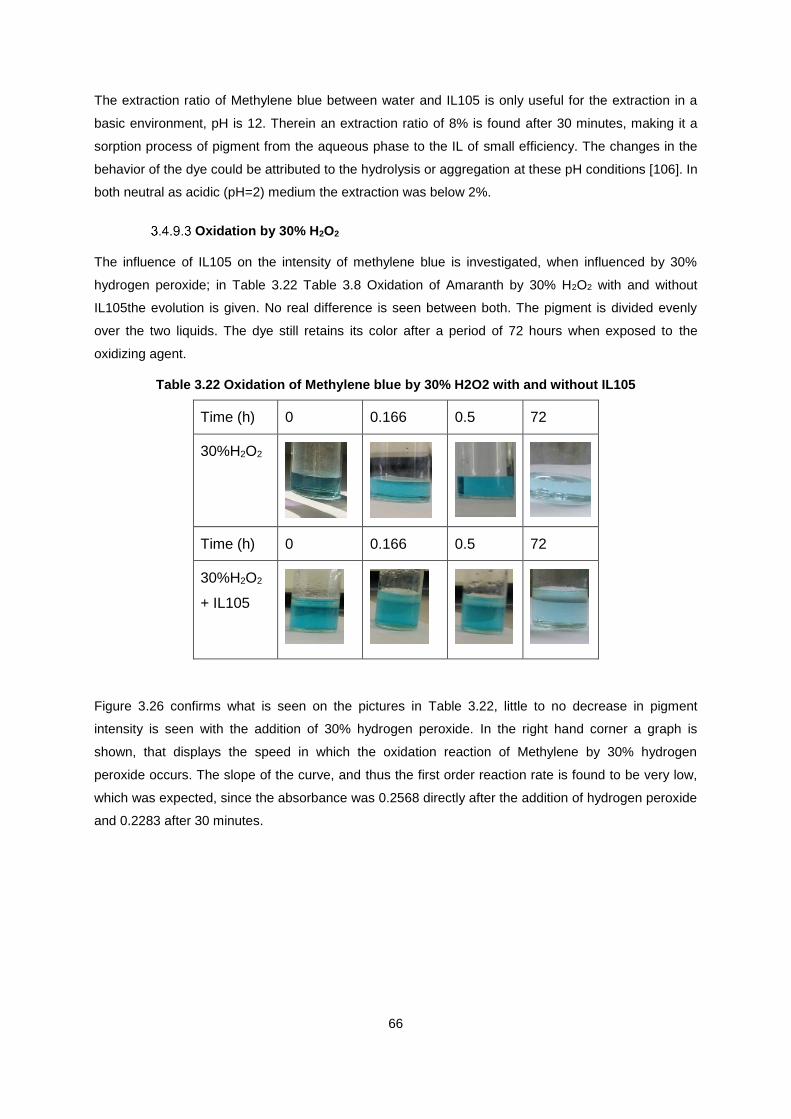
66
The extraction ratio of Methylene blue between water and IL105 is only useful for the extraction in a
basic environment, pH is 12. Therein an extraction ratio of 8% is found after 30 minutes, making it a
sorption process of pigment from the aqueous phase to the IL of small efficiency. The changes in the
behavior of the dye could be attributed to the hydrolysis or aggregation at these pH conditions [106]. In
both neutral as acidic (pH=2) medium the extraction was below 2%.
Oxidation by 30% H2O2
The influence of IL105 on the intensity of methylene blue is investigated, when influenced by 30%
hydrogen peroxide; in Table 3.22 Table 3.8 Oxidation of Amaranth by 30% H2O2 with and without
IL105the evolution is given. No real difference is seen between both. The pigment is divided evenly
over the two liquids. The dye still retains its color after a period of 72 hours when exposed to the
oxidizing agent.
Table 3.22 Oxidation of Methylene blue by 30% H2O2 with and without IL105
Time (h) 0 0.166 0.5 72
30%H2O2
Time (h) 0 0.166 0.5 72
30%H2O2
+ IL105
Figure 3.26 confirms what is seen on the pictures in Table 3.22, little to no decrease in pigment
intensity is seen with the addition of 30% hydrogen peroxide. In the right hand corner a graph is
shown, that displays the speed in which the oxidation reaction of Methylene by 30% hydrogen
peroxide occurs. The slope of the curve, and thus the first order reaction rate is found to be very low,
which was expected, since the absorbance was 0.2568 directly after the addition of hydrogen peroxide
and 0.2283 after 30 minutes.

67
Figure 3.26 The evolution of the absorbance of Methylene blue in time when influenced by 30 %
H2O2 at pH=7, Right corner: The Napierian logarithm of the ratio of absorbance and the initial
absorbance of Methylene blue vs. time.
0
0,05
0,1
0,15
0,2
0,25
0,3
500 550 600 650 700
Ab
sorp
tio
n
λ (nm)
Methylene blue
Pigment 5min 10min 30min
-0,2
-0,1
0
0 10 20 30
ln(A
/A0)
Time (min)

68
Rate of reaction
Figure 3.27 First order reaction rate vs. time for the oxidation of pigments with 30% hydrogen
peroxide with respectively Amaranth
The first order reaction rate is given in function of time for the oxidation of pigments, Figure 3.27.
Methyl violet, Chrysoidine, Methylene blue and Rhodamine 6G show a linear behavior, thus being a
first order reaction. The oxidation of Amaranth, Indigo and Malachite green on the other hand show a
second order equation and will go through via a second order reaction. Tartrazine has more complex
reaction rate, that will need to be futher investigated.
0
0,0002
0,0004
0,0006
0,0008
0,001
0,0012
0 5 10 15 20 25 30
k (s
-1)
t (s)
Reaction rate Amaranth
Rhodamine 6G
Chrysoidine
Indigo
Malachite green
Methyl violet
Methylene Blue

69
Discussion
Density
Density measurements for [P6.6.6.14][DCA] were done in trifold or more in order to get reproducible
results, thus diminishing the chance of errors occurring. The result obtained is situated in the
uncertainty range of the literature results.
Electrochemical behaviour of ionic liquids
As expected, the ILs with halides, and in particular the ones with the chloride anion, are limited for
oxidation applications above ca. 1 V, since the chloride undergoes oxidation at that potential. [14]
The best overall stability is delivered by [P6.6.6.14][DCA] which exhibits similar, and wide, useful limits at
both positive and negative potentials.
The electrochemical potential window of room temperature ionic liquids is sensitive to impurities. A
change in the water content of an ionic liquid will affect conductivity: as the water content increases, so
does conductivity; thus decreasing the electrochemical potential window.
Hydrophobicity of an ionic liquid increases with increasing alkyl chain length. Adding CH2 groups to the
alkyl chain on the imidazolium cation promotes a larger surface area with more hydrogen available,
making the interaction with the water molecules less relevant. For the series [Cnmim][NTf2] (n = 4, 6, or
8) this theory is confirmed. [C4mim][NTf2] is being the most affected. The magnitude in which ILs
containing [Cl]- as an anion and different cations got influenced by the water content is to be put in
order as follows; [P6.6.6.14]+, [N1.8.8.8]+, [C6mim]+. An increase in the size of the cationic part, showed to
promote hydrophobicity and therefor lowered the sensitivity of the presence of water molecules.
A bigger decrease in electrochemical window with an increase in water content is seen at [P6.6.6.14]Cl
as compared to [P6.6.6.14][DCA].
The process [Fe(C5H5)2]+/0 of the traditionally used reference compound ferrocene has been studied at
a platinum disk electrode in the ionic liquids [C6mim][NTf2] and [P6.6.6.14][DCA]. A reversible, one-
electron reduction process was observed.

70
Peroxidative oxidation of cyclohexane
The catalytic activity of ferrocene in trihexyl(tetradecyl)phosphonium dicyanimide, [P6.6.6.14][DCA], was
tested as catalyst for the oxidation of cyclohexane with aqueous tert-butylhydroperoxide (ButOOH,
TBHP) as oxidizing agent, at 50 °C.
Only cyclohexanone was produced by oxidation of cyclohexane in the above-mentioned conditions
(cyclohexanol was not detected, not even traces). A maximum cyclohexanone yield of 15.7% was
obtained in the presence of acidic medium. This selectivity is rare, being the cyclohexanol and
cyclohexanone mixture the common products obtained. Interestingly, both acidic and basic additives
led to an enhancement of the amount of cyclohexanone produced.
Martins et al. also found that the addition of HNO3 promotes the activity of the [FeCl2{η³-
HC(pz)3}]/CNT-Oxi-Na combination for the catalytic conversion of cyclohexane to both cyclohexanol
as cyclohexanone. [15]
G.B. Shul’pin et al. showed that the addition of a base can have an accelerating-, retardation- or
inhibiting effect on the decomposition of hydro peroxides. It is dependent on the composition of the
base, oxidant and the catalyst used. [16]
A reaction pathway for this reaction as is suggested by Nowotny et al. [103] is the direct-oxidation
reaction via the free-radical chain reaction pathway. It is the presumed mechanistic pathway for the
one-pot oxidation of cyclohexane with TBHP as an oxidant.
Pigments
The distribution ratios (annex 2.2) of the pigment between the aqueous phase and IL105 is to be used
as a way of comparing the sorption capacity of the ionic liquid for that specific pigment.
Generally, at low pH solution, the percentage of dye removal will decrease significantly for cationic dye
adsorption, with Malachite green and methyl violet being exceptions. Since the extraction of methyl
violet was of such a small order, it is excluded. At a high pH solution the distribution ratio of the dyes
increase significantly, with Malachite green showing a comparable distribution ratio compared to a
neutral solution.
If the results of the high pH solutions of the anionic dyes are compared to the low pH solutions, an
increase in the distribution ratio is seen in all the anionic dyes. The migration of Tartrazine to IL105
shows to be the most efficient at a pH of 7. This finding is opposed to the finding of Osma et al. [107]
that found a decrease in the adsorption of reactive black 5 by seed shells with an increase in pH. It
was attributed to the fact that the adsorption was driven by electrostatic attraction between the positive
charge at the solution interface and the adsorbent surface that appeared to be negatively charged. An
increase in pH will thus decrease the positive charge at the solution, subsequently decreasing the
extraction rate.
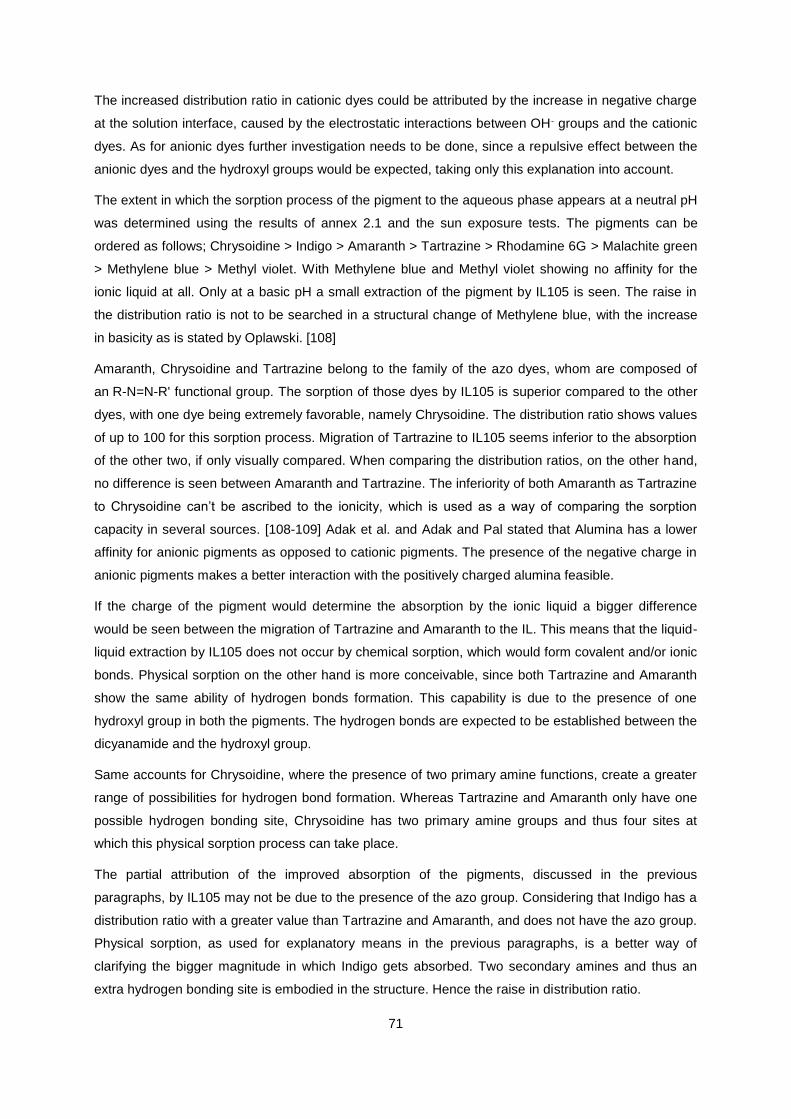
71
The increased distribution ratio in cationic dyes could be attributed by the increase in negative charge
at the solution interface, caused by the electrostatic interactions between OH- groups and the cationic
dyes. As for anionic dyes further investigation needs to be done, since a repulsive effect between the
anionic dyes and the hydroxyl groups would be expected, taking only this explanation into account.
The extent in which the sorption process of the pigment to the aqueous phase appears at a neutral pH
was determined using the results of annex 2.1 and the sun exposure tests. The pigments can be
ordered as follows; Chrysoidine > Indigo > Amaranth > Tartrazine > Rhodamine 6G > Malachite green
> Methylene blue > Methyl violet. With Methylene blue and Methyl violet showing no affinity for the
ionic liquid at all. Only at a basic pH a small extraction of the pigment by IL105 is seen. The raise in
the distribution ratio is not to be searched in a structural change of Methylene blue, with the increase
in basicity as is stated by Oplawski. [108]
Amaranth, Chrysoidine and Tartrazine belong to the family of the azo dyes, whom are composed of
an R-N=N-R' functional group. The sorption of those dyes by IL105 is superior compared to the other
dyes, with one dye being extremely favorable, namely Chrysoidine. The distribution ratio shows values
of up to 100 for this sorption process. Migration of Tartrazine to IL105 seems inferior to the absorption
of the other two, if only visually compared. When comparing the distribution ratios, on the other hand,
no difference is seen between Amaranth and Tartrazine. The inferiority of both Amaranth as Tartrazine
to Chrysoidine can’t be ascribed to the ionicity, which is used as a way of comparing the sorption
capacity in several sources. [108-109] Adak et al. and Adak and Pal stated that Alumina has a lower
affinity for anionic pigments as opposed to cationic pigments. The presence of the negative charge in
anionic pigments makes a better interaction with the positively charged alumina feasible.
If the charge of the pigment would determine the absorption by the ionic liquid a bigger difference
would be seen between the migration of Tartrazine and Amaranth to the IL. This means that the liquid-
liquid extraction by IL105 does not occur by chemical sorption, which would form covalent and/or ionic
bonds. Physical sorption on the other hand is more conceivable, since both Tartrazine and Amaranth
show the same ability of hydrogen bonds formation. This capability is due to the presence of one
hydroxyl group in both the pigments. The hydrogen bonds are expected to be established between the
dicyanamide and the hydroxyl group.
Same accounts for Chrysoidine, where the presence of two primary amine functions, create a greater
range of possibilities for hydrogen bond formation. Whereas Tartrazine and Amaranth only have one
possible hydrogen bonding site, Chrysoidine has two primary amine groups and thus four sites at
which this physical sorption process can take place.
The partial attribution of the improved absorption of the pigments, discussed in the previous
paragraphs, by IL105 may not be due to the presence of the azo group. Considering that Indigo has a
distribution ratio with a greater value than Tartrazine and Amaranth, and does not have the azo group.
Physical sorption, as used for explanatory means in the previous paragraphs, is a better way of
clarifying the bigger magnitude in which Indigo gets absorbed. Two secondary amines and thus an
extra hydrogen bonding site is embodied in the structure. Hence the raise in distribution ratio.
72
CONCLUSIONS AND FUTURE WORK
The use of ionic liquids is already a step in the right direction, when it comes to being ‘green’. Of
course it is preferred to search for the ones that are inherently non-toxic, such as P6.6.6.14Cl. If the
synthesis can be effected by a route involving non- or less toxic starting, it is even a bigger
improvement. For example, it is shown that hydroxyl-functionalized analogs of the imidazolium cation
can be synthetized from fructose, which occurs naturally.
The densities of IL105 at several temperatures were in the uncertainty range of the values obtained in
the literature.
The alteration in water content of the ionic liquids showed to have an influence on all of the ionic
liquids tested. Therein an increase in the length of methylimidazolium alkyl chains showed to decrease
both the usable potential range as the magnitude in which the ILs get influenced by water addition.
Trihexyl(tetradecyl)phosphonium dicyanamide (IL105) showed to have a wide potential window, which
was greatly influenced by the addition of water. A reversible, one-electron reduction process was
observed with the addition of ferrocene, which is mostly used as an internal standard in molecular
solvents.
More research needs to be done on the influence of water on the electrochemical behavior of ILs.
Therein the field of search needs to be broadened to the alterations that are seen with other
impurities, since they can greatly influence the usability of ionic liquids in electrochemical experiments.
Ferrocene did not seem to be affected by the ionic liquids tested, namely
trihexyl(tetradecyl)phosphonium dicyanamide and 1-hexyl-3-methylimidazolium
bis(trifluoromethylsulfonyl)imide. Its behaviour in a broader range of ILs will have to be investigated.
As for the catalytic cyclohexane oxidation by ferrocene in an IL105 medium; a considerable yield was
found. The interactions between ionic liquids and ferrocene and more specifically the catalytic
oxidation of alkanes are to be investigated. The oxidation of cyclohexane and the reaction pathway in
which the corresponding alcohols and ketones get formed, and the influence the pH has on this
process, needs to be the furtherly investigated.
The ionic liquid IL105 was examined as an adsorbent for several pigments out of an aqueous pigment
solution. A considerable extraction of several pigments by the IL was seen, with the extraction of
Chrysoidine being the most successful. The pH of the aqueous pigment solution showed to be an
influential factor of great importance. An alteration in the pH, can either promote or depress the
adsorption process significantly. As for the oxidation of the pigments by hydrogen peroxide 30 v/v%; a
considerable protective effect of the ionic liquid against the pigment oxidation was seen in Amaranth,
Chrysoidine and Indigo.

73
It would be useful to examine the extraction efficiencies of a variety of ILs on different dyes. More
commonly used pigments can be tested, to get a precise idea of which ionic liquids have the ability to
adsorb which dyes. If all the data were to be categorized, an idea of interactions between both the IL
and the dye and influences on the extraction capacity of the IL can be formed. Concerning the dyes,
different dyes with a broad spectrum of properties should be utilized; those involve cationic-, anionic-,
azo-dyes etc. In ionic liquids the influence of the length of the alkyl chain, hydrophobicity, viscosity,
density, anion, cation and so on will be investigated.
Most beneficial would be tests on real wastewater samples with a variety of ionic liquids. Naturally,
these experiments would create issues with measurements as it would be difficult to create calibration
standards due to the variety of colors and color combinations that would be encountered.
Instrumentation other than UV-VIS spectrometers could potentially be used, once a measurement
methodology can be established.

74
REFERENCE
[1] Jiménez-González J., Constable D. J. C. (2011), “Green Chemistry and Engineering—A Practical
Design Approach,” John Wiley & Sons Inc., Hoboken, 3-39.
[2] Ahluwalia V. K. (2009), “Green Chemistry, Environmentally Benign Reaction,” CRC Press &
Francis Group, Boca Raton.
[3] Sheldon R. A. (2012), “Fundamentals of Green Chemistry: Efficiency in Reaction Design,”
Chemical Society Reviews, 41 (4), 1437-1451.
[4] Dunn P. J. (2012), “The Importance of Green Chemistry in Process Research and Development,”
Chemical Society Reviews, 41 (4), 1452-1461.
[5] Ghernaout D., Ghernaout B. and Naceur M. W. (2011), “Embodying the Chemical Water Treatment
in the Green Chemistry: A Review,” Desalination, 271 (1-3), 1-10.
[6] Capello C., Fischer U. and Hungerbuhler K. (2007), “What Is a Green Solvent? A Comprehensive
Framework for the Environmental Assessment of Solvents,” Green Chemistry, 9 (9), 927-934.
[7] Slater C. S. and Savelski M. (2007), “A Method to Characterize the Greenness of Solvents Used in
Pharmaceutical Manufacture,” Journal of Environmental Science and Health, Part A, 42 (11), 1595-
1605.
[8] Rundquist E. M., Pink C. J. and Livingston A. G. (2012), “Organic Solvent Nanofiltration: A Potential
Alternative to Distillation for Solvent Recovery from Crystallisation Mother Liquors,” Green Chemistry,
14 (8), 2197-2205.
[9] Huddleston J. G., Visser A. E., Reichert E. W., Willauer H. D., Broker G. A. and Rogers R. D.
(2001), “Characterisation and comparison of hydrophilic and hydrophobic room temperature ionic
liquids incorporating the imidazolim cation,” Green chemistry, 3, 156-164.
[10] Anastas P. and Warner J. (1998), “Green Chemistry: Theory and Practice,” Oxford University
Press: New York, 30.
[11] United States Environmental Protection Agency (2014, October 16), “Basics of green chemistry,”
Retrieved from http://www.epa.gov.
[12] Earle M.J. and Seddon K.R. (2009), “Ionic liquids: Green solvents for the future,” Pure applied
sciences, 72 (7), 1391-1398.
[13] Yoshimoto S., Taguchi R., Tsuji R., Ueda H. and Nishiyama K. (2012), “Dependece on the
crystallographic orientation of Au for the potential window of the electrical double-layer region in
imidazolium-based ionic liquids,” Electrochemistry communications, 20, 26-28.
[14] Handy S. T. (2011), “Ionic liquids - Classes and Properties,” Intech: Rijeka.
[15] Castner E. W. Jr., Wishart J. F. (2010), “Spotlight on ionic liquids,” The journal of chemical
physics, 132, 120901.
75
[16] Dake S. A., Kulkarni R. S., Kadam V. N., Modani S. S., Bhale J. J., Tathe S. B. and Pawar R. P.
(2009), “Phosphonium Ionic Liquid: A Novel Catalyst for Benzyl Halide Oxidation,” Synthetic
Communications, Vol. 39, No. 21, 3898-3904.
[17] Cao H. and Alper H. (2010), “Palladium-Catalyzed Double Carbonylation Reactions of o-
Dihaloarenes with Amines in Phosphonium Salt Ionic Liquids,” Organic Letters, 12 (18), 4126-4129.
[18] Luska K. L., Demmans K. Z., Stratton S. A. and Moores A. (2012), “Rhodium Complexes
Stabilized by Phosphine- Functionalized Phosphonium Ionic Liquids Used as Higher Alkene
Hydroformylation Catalysts: Influence of the Phosphonium Headgroup on Catalytic Activity,” Dalton
Transactions, 41 (43), 13533-13540.
[19] Fan A., Chuah G.K. and Jaenicke S. (2012), “Phosphonium Ionic Liquids as Highly Thermal
Stable and Efficient Phase Transfer Catalysts for Solid-Liquid Halex Reactions,” Catalysis Today, 198
(1), 300-304.
[20] Harper N. D., Nizio N. D., Hendsbee A. D., Masuda J. D., Robertson K. N., Murphy L. J.,
Johonson M. B., Pye C. C. and Clyburne J. A. C. (2011), “Survey of Carbon Dioxide Capture in
Phosphonium-Based Ionic Liquids and End- Capped Polyethylene Glycol Using DETA (DETA =
Diethylenetriamine) as a Model Absorbent,” Industrial & Engineering Chemistry Research, 50 (5),
2822-2830.
[21] Wasserscheid P. and Welton T. (2002), “Ionic liquids in synthesis,” Wiley-VCH Verlag GmbH &
co. KGaA, Weinheim.
[22] Mjalli F., Naser J., Jibril J., Alizadeh V., and Gano Z. (2014), “Tetrabutylammonium chloride based
ionic liquids and their physical properties,” Journal of chemical engineeringdata, 59 (7), 2242-2251.
[23] Pratap K., Chhotaray P. K. and Gardas R. L. (2014), “Thermophysical properties of ammonium
and hydroxylammonium protic ionic liquids,” Journal of chemical themodynamics, 72, 117-124.
[24] Klomfar J., Soucková M. and Pátek J. (2014), “Low Temperature Densities from (218 to 364) K
and up to 50 MPa in Pressure and Surface Tension for Trihexyl(tetradecyl)phosphonium
Bis(trifluoromethylsulfonyl)imide and Dicyanamide and 1-Hexyl-3- methylimidazolium
Hexafluorophosphate,” Journal of chemical engineering data 59 (7), 2263-2274.
[25] Tariq M., Forte P. A. S., Gomes C. M. F., Lopes C. J. N. And Rebelo L. P. N. (2009), “Densities
and refractive indices of imidazolium- and phosphonium-based ionic liquids: Effect of temperature,
alkyl chain length, and anion,” The journal of chemical thermodynamics, 41 (6), 790-798.
[26] Carrera G. V. S. M., Afonso C. A. M. and Branco L. C. (2010), “Interfacial properties, densities,
and contact angles of task specific ionic liquids,” 55 (2), 609-615.
[27] Neves C. M. S. S. Carvalho P. J., Freire M. G., Coutinho J. A. P. (2011), “Thermophysical
properties of pure and water-saturated tetradecyltrihexylphosphonium-based ionic liquids,” 43 (6), 948-
957.

76
[28] Quijada-Maldonado E., van der Boogaart S. Lijbers J. H., Meindersma G. W., de Haan A. B.
(2012), “Experimental densities, dynamic viscosities and surface tensions of the ionic liquids series 1-
ethyl-3-methylimidazolium acetate and dicyanamide and their binary and ternary mixtures with water
and ethanol at T = (298.15 to 343.15 K),” Journal of chemical thermodynamics, 51, 51-58.
[29] Sánchez L. G., Espel J. R., Onink F., Meindersma G. W. And de Haan A. B. (2009), "Density,
viscosity, and surface tension of synthesis grade imidazolium, pyridinium, and pyrrolidinium based
room temperature ionic liquids," Journal of chemical engineering data, 54, 2803-2812.
[30] Jacquemin J., Husson P., Padua A. S. H. And Majer V. (2005), "Density and viscosity of several
pure and water-saturated ionic liquids," Green chemistry, 8, 172-180.
[31] Diogo J. C. F., Caetano F. J. P., Fareleira J. M. N. A., Wakeham W. A., Afonso C. A. M., and
Marques C. S. (2011), “Viscosity Measurements of the Ionic Liquid Trihexyl(tetradecyl)phosphonium
Dicyanamide [P6,6,6,14][dca],” Journal of chemical & engineering data, 57 (4), 1015-1025.
[32] Diogo J. C. F., Caetano J. P., Fareleira J. M. N. A. And Wakeham W. (2014), "Viscosity
measurements on ionic liquids: a cautionary tale," International journal of thermophysics, 35, 1615-
1635.
[33] Fröba A. P., Kremer H. and Leipertz A. (2008), “Density, refractive index, interfacial tension, and
viscosity of ionic liquids [EMIM][EtSO4], [EMIM][NTf2], [EMIM][N(CN)(2)], and [OMA][NTf2] in
dependence on temperature at atmospheric pressure,” The journal of physical chemistry B, 112 (39),
12420-12430.
[34] Seddon K. R., Stark A. and Torres M. (2000), “Influence of chloride, water, and organic solvents
on the physical properties of ionic liquids,” Pure applied chemistry, 72 (12), 2275-2287.
[35] Hiroyuki O., “Electrochemical aspects of ionic liquids”, John Wiley & Sons, Inc., Hoboken, New
Jersey, 2011.
[36] Fung Y. S. and Zhu D. R.. (2012), “Electrodeposited Tin Coating as Negative Electrode Material
for Lithium-Ion Battery in Room Temperature Molten Salt,” Journal of the electrochemical society, 149
(3), A319–A324.
[37] Shobukawa H., Tokuda H., Susan M. A. B. H. and Watanabe M. (2005), “Ion Transport Properties
of Lithium Ionic Liquids and Their Ion Gels,” Electrochimica acta, 50 (19), 3872– 3877.
[38] Shobukawa H., Tokuda H., Tabata S. I. and Watanabe M. (2004), “Preparation and Transport
Prop‐ erties of Novel Lithium Ionic Liquids,” Electrochimica Acta, 50(2-3), 305–309.
[39] Seki S., Kobayashi Y., Miyashiro H., Ohno Y., Usami A., Mita Y., Watanabe M. and Terada N.
(2006), “Highly Reversible Lithium Metal Secondary Battery Using a Room Temperature Ionic
Liquid/Lithium Salt Mixture and a Surface-Coated Cathode Active Material,” Chemical
Communications (5), 544–545.
77
[40] Stenger-Smith J. D., Webber C. K., Anderson N., Chafin A. P., Zong K. and Reynolds J. R.
(2002), “Poly(3,4-alkylenedioxythiophene)-Based Supercapacitors Using Ionic Liquids as Supporting
Electrolytes,” Journal of the Electrochemical Society, 149 (8), A973–A977.
[41] Sato T., Masuda G. and Takagi K. (2004), “Electrochemical Properties of Novel Ionic Liquids for
Electric Double Layer Capacitor Applications,” Electrochimica Acta, 49 (21), 3603– 3611.
[42] Liu H., He P., Li Z., Liu Y. and Li J. (2006) “A Novel Nickel-Based Mixed Rare-Earth Oxide/Acti‐
vated Carbon Supercapacitor Using Room Temperature Ionic Liquid Electrolyte,” Electrochimica Acta,
51 (10), 1925–1931.
[43] Kubo W., Murakoshi K. and Kitamura T. (2001), “Quasi-Solid-State Dye-Sensitized TiO2 Solar
Cells: Effective Charge Transport in Mesoporous Space Filled with Gel Electrolytes Containing Iodide
and Iodine,” Journal of Physical Chemistry B, 105 (51) 12809– 12815.
[44] Kubo W., Kitamura T., Hanabusa K., Wada Y. and Yanagida S. (2002), “Quasi-Solid-State Dye-
Sen‐ sitized Solar Cells using Room Temperature Molten Salts and a Low Molecular Weight Gelator,”
Chemical Communications, (4), 374–375.
[45] Wang P., Zakeeruddin S. M., Moser J. E. and Grätzel M, “A New Ionic Liquid Electrolyte
Enhances the Conversion Efficiency of Dye-Sensitized Solar Cells,” Journal of Physical Chemistry B,
107 (48), 13280–13285.
[46] Xia J., Masaki N., Jiang K. and Yanagida S. (2006), “Deposition of a Thin Film of TiOx from a
Titani‐ um Metal Target as Novel Blocking Layers at Conducting Glass/TiO2 Interfaces in Ionic Liquid
Mesoscopic TiO2 Dye-Sensitized Solar Cells,” Journal of Physical Chemis‐ try B, 110 (50), 25222–
25228.
[47] Wang P., Zakeeruddin S. M., Moser J E., Humphry-Baker R. and Grätzel M. (2004), “A Solvent-
Free, SeCN- /(SeCN)3- Based Ionic Liquid Electrolyte for High-Efficiency Dye-Sensitized
Nanocrystalline Solar Cells,” Journal of the American Chemical Society, 126 (23), 7164–7165.
[48] Wang P., Zakeeruddin S. M., Comte P., Exnar I. and Grätzel M. (2003), “Gelation of Ionic
LiquidBased Electrolytes with Silica Nanoparticles for Quasi-Solid-State Dye-Sensitized So‐ lar Cells,”
Journal of the American Chemical Society, 125 (5), 1166–1167.
[49] Noda A., Susan M. A. B. H., Kudo K., Mitsushima S., Hayamizu K. and Watanabe M. (2003),
“Brønsted Acid-Base Ionic Liquids as Proton-Conducting Nonaqueous Electrolytes,” Journal of
Physical Chemistry B, 107 (17) 4024–4033.
[50] Martins V. L., Nicolau B. G., Urahata S. M., Ribeiro M. C. C. and Torresi R. M. (2013), “Influence
of Water Content on the Structure and Physicochemical Properties of an Ionic Liquid and Its Li+
Mixture,” Journal of physical chemistry, 117 (29), 8782-8792.
[51] Aslanov L.A (2011), “Ionic liquids: liquid structure,” Journal of molecular liquids, 162 (3), 101-104.
78
[52] Visser A. E. , Swatloski R. P., Reichert W. M., Griffin S. T. and Rogers R. D., “Traditional
extractants in nontraditional solvents: Groups 1 and 2 extraction by crown ethers in room-temperature
ionic liquids,” Industrial & engineering chemistry research, 39 (10), 3596-3604.
[53] Rabideau B. D. and Ismail A. E. (2015), “Mechanisms of hydrogen bond formation between ionic
liquids and cellulose and the influence of water content,” Physical chemistry chemical physics, 17,
5767-5775.
[54] Lu X., Burell G., Separovic F., and Zhao C. (2012), “Electrochemistry of room temperature protic
ionic liquids: A critical assessment for use as electrolytes in electrochemical applications,” The journal
of physical chemistry, 116 (30), 9160-9171.
[55] Siraj N., Grampp G., Landgraf S. and Punyain K. (2012), “Cyclic voltammetric study of
heterogeneous electron transfer rate constant of various organic compounds in ionic liquids:
measurements at room temperature,” zeitschrift für physikalische chemie.
[56] Barrado E., Couto R. A. S.; Quinaz M. B., Lima J. L. F. C. And Castrillejo Y. (2014),
“Electrochemical behaviour of ferrocene in the ionic liquid 1-ethyl-3-methylimidazolium
tetrafluoroborate, EMIMBF4, at 298 K,” Journal of electroanalytical chemistry, 720-721, 139-146.
[57] https://www.electrochem.org/dl/ma/203/pdfs/2567.pdf, Consulted at 04-06-2015.
[58] Whyman R. (2001), “Applied Organometallic Chemistry and Catalysis,” Oxford University Press,
Oxford.
[59] Smiley R. A., Jackson H. L. (2002), “Chemistry and the Chemical Industry,” CRC Press.
[60] Weissermel K. and Arpe H. –J. (1993), “Industrial Organic Chemistry,” 2, VCH Press, Weinheim.
[61] Bäckvall J.-E. (2004), “Modern Oxidation Methods,” Wiley-VCH, Weinheim.
[62] Sheldon R. A., Arends I. and Hanefeld U. (2007), “Green Chemistry and Catalysis,” Wiley-VCH,
Weinheim.
[63] Chiusoli G. P. and Maitlis P. M. (2006), “Metal-catalysis in Industrial Organic Processes,” Royal
Society of Chemistry, Cambridge, ch. 2.
[64] Wolf E. E. (ed.) (1992), “Methane Conversion by Oxidative Processes: Fundamental and
Engineering Aspects,” Van Nostrand Reinhold, New York.
[65] Derouane E. G., Haber J., Lemos F., Ramôa Ribeiro F. and Guinet M. (Eds.) (1998), “Catalytic
Activation and Functionalization of Light Alkanes” NATO ASI Series, 44, Kluwer Academic Publishers,
Dordrecht, The Netherlands.
[66] Schuchardt. U., Cardoso D., Sercheli R., Pereira R., da Cruz, R. S., Guerreiro M. C., Mandelli D.,
Spinacé E. V. and Pires, (2001), “Cyclohexane oxidation continues to be a challenge,” E. L. Applied
Catalysis A: General, 211, 1-17.

79
[67] Pombeiro A. J. L. (Ed.) (2013), “Advances in Organometallic Chemistry and Catalysis: The
Silver/Gold Jubilee International Conference on Organometallic Chemistry Celebratory Book,” John
Wiley & Sons, Inc., Hoboken, NJ, USA, Chapters 1, 2,3 and 22.
[68] da Silva J. A. L., Fraústo da Silva J. J. R., A. Pombeiro A. J. L. (2011), “Oxovanadium Complexes
in Catalytic Oxidations,” Coord. Chem. Rev., 255, 2232-2248;
[69] L. M. D. R. S. Martins, A. J. L. Pombeiro (2014), “Tris(pyrazol-1yl)methane metal complexes for
catalytic mild oxidative functionalizations of alkanes, alkenes and ketones,” Coord. Chem. Rev., 265,
74-88.
[70] Martins L. M. D. R. S. , Peixoto de Almeida M., Carabineiro S. A. C., Figueiredo J. L. and
Pombeiro A.J.L. (2013), “Heterogenisation of a C-Scorpionate FeII Complex on Carbon Materials for
Cyclohexane Oxidation with Hydrogen Peroxide,” chemcatchem, 5 (12), 3847-3856.
[71] Karthikeyan P., Bhagat P. R. and Kumar S. S. (2012), “A novel, green 1-glycyl-3-methyl
imidazolium chloride–copper(II) complex catalyzed CH oxidation of alkyl benzene and cyclohexane,”
Chinese chemical letters, 23 (6), 681-684.
[72] Janying J., Hua Z., Xiangjing Z. and Yongqi H. (2008), “Oxidation of cyclohexane catalyzed by
TS-1 in ionic liquid with Tert-butyl-hydroperoxide,” Chinese journal of chemical engineering, 16 (3),
373-375.
[74] Tian P., Liu Z., Wu Z., Xu. L and He Y. (2004), “Characterization of metal-containing molecular
sieves and their catayltic properties in the selctive oxidation of cyclohexane,” Catalysis today, 93-95,
735-742.
[75] Shul’pin G. B., Kirillova M. V., Shul’pina L. S., Pombeiro, A. J. L. Karslyan E. E. And Kozlov Y. N.
(2013), “Mild oxidative alkane functionalization with peroxides in the presence of ferrocene,” Catalysis
communications, 31, 32-36.
[76] Shul'pina L. S., Durova E. L., Kozlov Y. N., Kudinov A. R., Strelkova T. V. and Shul'pin G.B.
(2013), “Oxidation of benzene with hydrogen peroxide catalyzed with ferrocene in the presence of
pyrazine carboxylic acid,” Russian journal of physical chemstry A, 87 (12), 1996-2000.
[77] Li Z., Li G., Jiang L. Li J. Sun G., Xia C. And Li F. (2015), “Ionic liquids as precursors for efficient
mesoporous iron-nitrogen-doped oxygen reduction electrocatalysts,” Angewandte chemie, 127, 1514-
1518.
[78] Audin C., Daran J., Deydier É., Manoury E. And Poli R. (2010), “New ferrocenyl P,O ligand with
polar substituents,” Comptes rendus chimie, 13 (8-9), 890-899.
[79] Neumann P. Dib H., Caminade A. M. And Hey-Hawkins E. (2015), “Redox control of a dentritic
ferrocenyl-based homogenous catalyst,” Angewandte chemie, 54 (1), 311-314.
[80] Couling D. J., Bernot R. J., Docherty K. M., Dixon J. K. and Maggin E. J. (2006), “Assessing the
factors responsible for ionic liquid toxicity to aquatic organisms via quantitative structure–property
relationship modeling” Green Chemistry, 8, 82–90.
80
[81] Pernak J., Kalewska J., Ksycinska H. and Cybulski J. (2001),”Synthesis anti-microbial activities of
some pyridinium salts with alkoxymethyl hydrphobic group,” European journal of medicinal chemistry,
36, 899.
[82] Pernak J., Rogoza J. and Mirska I. (2001), “Synthesis and antimicrobial activities of new
pryidinium and benzimidazolium chlorides,” European journal of medicinal chemistry, 36, 313.
[83] Pernak J. and Chwala P. E. (2001), “Synthesis and anti-microbial activities of choline-like
quaternary ammonium chlorides,” European journal of medicinal chemistry, 38, 1035.
[84] Pernak J., Goc I. and Mirska I. (2004), “Anti-microbial activities of protic ionic liquids with lactate
anion,” Green chemsitry, 6, 323-329.
[85] Pernak J., Sobaszkiewicz K. and Mirska I. (2003), “Anti-microbial activities of ionic liquids,” Green
Chemistry, 5, 52–56.
[86] Cho C.-W., Pham T. P. T., Jeon Y.-C., Vijayaraghavan K., Choe W.-S. And Yun Y.-S. (2007),
“Toxicity of imidazolium salt with anion bromide to a phytoplankton Selenastrum capricornutum. Effect
of alkyl-chain length,” Chemosphere, 69 (6), 1003-1007.
[87] Cho C. W., Jeon Y. C., Pham T. P., Vijayaraghavan K. and Yun Y. S. (2008), “The ecotoxicity of
ionic liquids and traditional orgnaic solvents on microalga selenastrum capricornutum,” Ecotoxicology
and environmental safety, 71 (1), 166-171.
[88] Pang Y. L. and Abdullah A. Z. (2013), “Current status of textile industry wastewater management
and research progress in Malaysia: A review,” Clean, soil, air and water, 41 (8), 1-14.
[89] Bokare A. D. , Chikate R. C., Rode C. V. and Paknikar K. M. (2008), “Iron-nickel bimetallic
nanoparticles for reductive degradation of azo dye Orange G in aqueous solution,” Apllied catalysis B:
environmental, (79 (3), 270-278.
[90] Bhat R. V. and Mathur P. (1998), “Changing scenario of food colours in India,” Current science,
74, 198-202.
[91] Sharma K. P., Sharma K., Kumar S. Sharma S., Grover R., Soni P. Bhardwaj S.M., Chaturvedi
R. K. and Sharma S. (2005), “Response of selected aquatic macrophytes towards textile dye
wastewaters,” Indian journal of biotechnology, 4, 538-545.
[92] Mahmoud A. S., Ghaly A. E., and Brooks M. S. (2007), “Removal of dye from textile wastewater
using plant oils under different pH and temperature conditions,” American Journal of Environmental
Sciences, 4 (3), 205-218.
[93] Visser A.E., Swatloski R.P., and Rogers R.D. (200), “pH-Dependent partitioning in room
temperature ionic liquids,” Green Chemistry, 1-4.
[94] Vijayaraghavan R., Vedaraman N., Surianarayanan M., and MacFarlane D.R. (2006), “Extraction
and recovery of azo dyes in an ionic liquid,” Talanta, 69, 1059-1062.

81
[95] Ali M., Sarkar A., Pandey M.D., and Pandey S. (2006), “Efficient precipitation of dyes from dilute
aqueous solutions of ionic liquids,” Analytical Sciences, 22, 1051-1053.
[96] Pei Y.C., Wang J.J., Xuan X.P., Fan J., and Fan M. (2007), “Factors affecting ionic liquids based
removal of anionic dyes from water,” Environmental Science & Technology, 41 (14), 5090-5095.
[97] Li C., and Xin B. (2008), “Extraction and mechanisms of acid dyes into a room temperature ionic
liquid,” 2nd International Conference on Bioinformatics & Biomedical Engineering, 3519-3522.
[98] Fan J., Fan Y., Zhang S., and Wang J. (2011), “Extraction of azo dyes from aqueous solutions
with room temperature ionic liquids,” Separation Science and Technology, 46, 1172-1177.
[99] Rydberg J., Choppin G. R., Musikas C. and Sekine T. (2004), “Solvation Extraction Principles and
Practice, Revised and Expanded,” CRC Press: Boca Raton.
[100] Pei Y., Liu J., Yan Z., Li Z., Fan J. and Wang J. (2012), “Association of ionic liquids with cationic
dyes in aqueous solution: A thermodynamic study,” Journal of chemical thermodynamics, 47, 223-227.
[101] Zhang S., Sun N., He X., Lu X., and Zhang, X. (2006), “Physical properties of ionic liquids:
Database and evaluation,” Journal of Physical Chemical Reference Data, 35 (5), 1475-1517.
[102] O’Mahony A. M., Silvester D. S., Aldous L., Hardacre C. An Compton R. G. (2008), “Effect of
Water on the Electrochemical Window and Potential Limits of Room-Temperature Ionic Liquids,"
Journal of chemical engineering data, 53 (12), 2884-2891.
[103] Nowotny M., Pedersen L. N., Hanefeld U., and Maschmeyer T. (2002), “Increasing the ketone
selectivity of the cobalt-catalyzed radical chain oxidation of cyclohexane,” Chemistry a European
journal, 8 (16), 3724-3731.
[104] Pal N., Pramanik M., Bhaumik A. and Ali M. (2014), “Highly selective and direct oxidation of
cyclohexane to cyclohexanone over vanadium exchanged NaY at room temperature under solvent-
free conditions,” Journal of molecular catalysis A: chemical, 392, 299-307.
[105] Önal Y., Akmil-Basar C., Eren D., SarIcI-Özdemir Ç. and Depci T. (2006), “Adsorption kinetics of
malachite green onto activated carbon prepared from Tunçbilek lignite,” Journal of hazardous
materials, 128, 150–157.
[106] Muthuraman G., Teng T. T. and Tan S. H. (2012), “Liquid–liquid extraction of Cibacron Red FN-
R by TBAB as an extractant,” Desalination, 284,135–141.
[107] Osma J. F., Saravia V., Toca-Herrera J. L., Couto S. R. (2007),”Sunflower seed shells: a novel
and effective low-cost adsorbent for the removal of the diazo dye Reactive Black 5 from aqueous
solutions,” Journal of hazardous materials, 147, 900–905.
[108] Oplawski S. (2014), “Extraction of indicator dyes into imidazolium-based ionic liquids,” theses
and dissertations, paper 477.
[109] Garvey. S.L. and Dietz, M.L. (2013), “Ionic liquid anion effects in the extraction of metal ions by
macrocyclic polyethers,” Seperation and Purification Technology, 123, 145-152.

82
[110] Tissinger P. T. and Heineman W. R. (1983), “Cyclic voltammetry,” Journal of chemical education, 60, 702-706.
[111] Mabott G. A. (1983), “An introduction to cyclic voltammetry,” Journal of chemical education, 60, 698-702.
[112] Brett C. M. A. (2005), “Electrochemistry principe, methods and applications,” Oxford university press, London.
[113] Bard A.J. and Faulkner L.R. (2001), “Electrochemical Methods: Fundamentals and applications,” John Wiley & sons, New York.
[114] Experiment 5. Cyclic voltammetry Retrieved from www.chemistry.msu.edu., consulted 05-04-2015

83
ANNEX
Annex 1
Figure A1 Calibration curve of absorbance vs concentrationrespectively Amaranth, Rhodamine
6G, Chrysoidine, Indigo Tartrazine, Malachite green, Methyl violet and Methylene blue at pH=2
Figure A2 Calibration curve of absorbance vs concentration respectively Amaranth,
Rhodamine 6G, Chrysoidine, Indigo Tartrazine, Malachite green, Methyl violet and Methylene
blue at pH=7
0,0
0,2
0,4
0,6
0,8
1,0
0 0,02 0,04 0,06 0,08 0,1
abso
rban
ce
Concentration (mM)
Calibration curve pH=2
Amaranth Rhodamine 6G Chrysoidine Indigo
Methylene blue Methyl violet Malachite green Tartrazine
0,0
0,2
0,4
0,6
0,8
1,0
0 0,02 0,04 0,06 0,08 0,1
Ab
sorb
ance
Concentration (mM)
Calibration curve pH=7
Amaranth Rhodamine 6G Chrysoidine Indigo
Tartrazine Malachite green Methyl violet Methylene blue
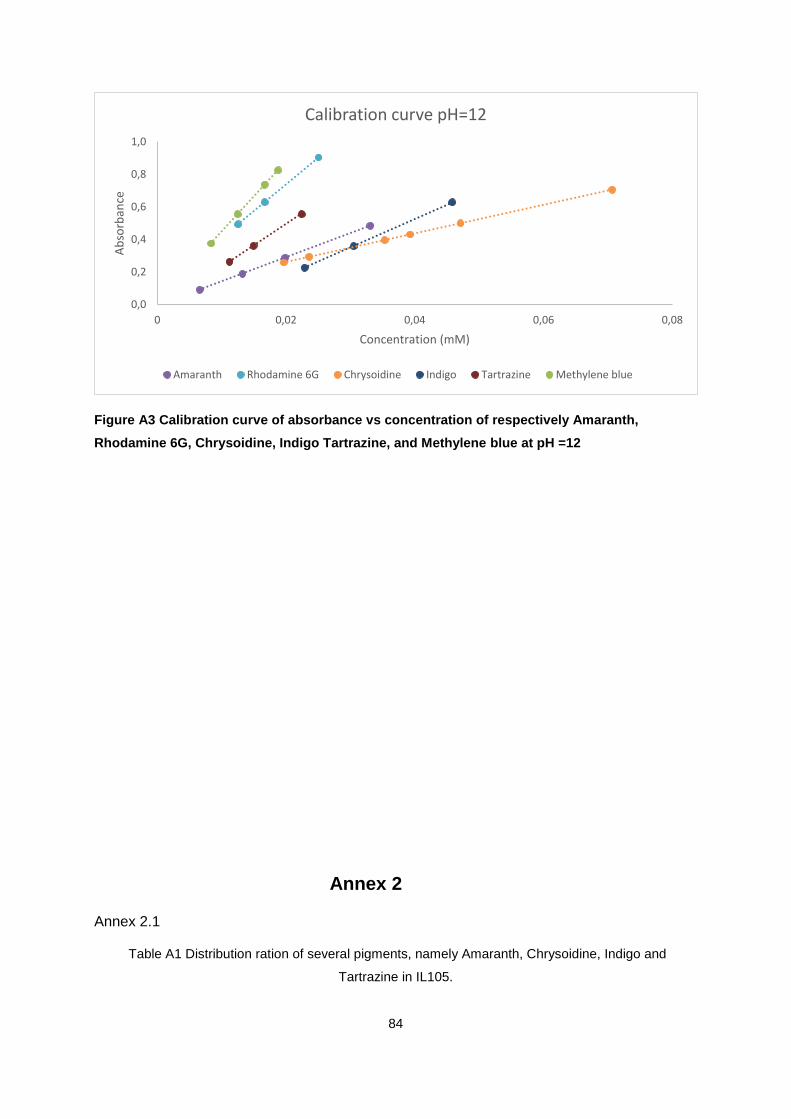
84
Figure A3 Calibration curve of absorbance vs concentration of respectively Amaranth,
Rhodamine 6G, Chrysoidine, Indigo Tartrazine, and Methylene blue at pH =12
Annex 2
Annex 2.1
Table A1 Distribution ration of several pigments, namely Amaranth, Chrysoidine, Indigo and
Tartrazine in IL105.
0,0
0,2
0,4
0,6
0,8
1,0
0 0,02 0,04 0,06 0,08
Ab
sorb
ance
Concentration (mM)
Calibration curve pH=12
Amaranth Rhodamine 6G Chrysoidine Indigo Tartrazine Methylene blue

85
Amaranth Chrysoidine
Cinitial (mM) D Cinitial(mM) D
0.00602 0.86553 0.00788 104.1702
0.01198 3.16818 0.01958 68.1166
0.01420 3.03921 0.03928 40.5294
0.02366 2.65108 0.05012 35.0169
Indigo Tartrazine
Cinitial(mM) D Cinitial(mM) D
0.01028 0.4974 0.00772 2.8531
0.01693 4.0983 0.01578 3.0111
0.02623 4.1677 0.02173 2.7186
0.03470 3.0269
0.03979 4.1433

86
Annex 2.2
Table A2 Distribution ratios at a pH of 2, 7 and 12 of respectively Amaranth,
Rhodamine 6G, Chrysoidine, Indigo Tartrazine, Malachite green, Methyl violet and
Methylene blue
Amaranth Rhodamine 6G
Time 0 5 10 30 0 5 10 30
pH value
2.0 0.79 1.11 1.20 1.21 0.00 0.01 0.02 0.05
7.0 0.07 0.11 0.17 0.17 0.58 0.81 0.89 0.90
12.0 0.41 0.94 1.19 1.50 1.88 1.92 2.26 4.66
Chrysoidine Indigo
Time 0 5 10 30 0 5 10 30
pH value
2.0 0.09 0.11 0.11 0.22 2.20 3.24 3.82 5.36
7.0 1.79 2.78 3.33 4.67 0.20 0.26 0.43 0.47
12.0 1.95 2.62 13.38 14.71 1.74 3.23 3.13 6.16
Tartrazine Malachite green
Time 0 5 10 30 0 5 10 30
pH value
2.0 1.04 1.49 1.70 2.08 0.64 1.48 2.13 2.96
7.0 1.64 3.11 4.20 6.18 0.01 0.14 0.21 0.21
12.0 0.18 1.00 1.66 2.46 / / / /
Methyl violet Methylene blue
Time 0 5 10 30 0 5 10 30
pH value
2.0 0.37 0.27 0.27 0.35 0.05 0.13 0.10 0.11
7.0 0.35 0.20 0.06 0.11 0.14 0.11 0.08 0.08
12.0 / / / / 0.14 0.35 0.46 0.82
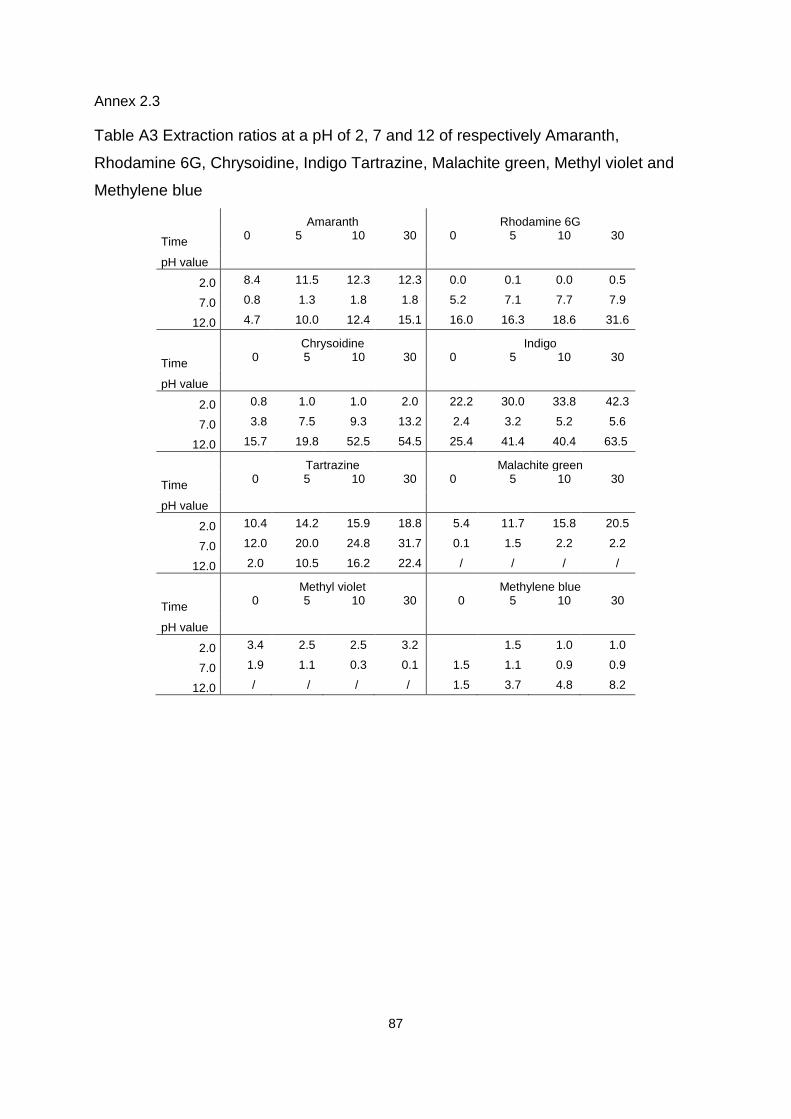
87
Annex 2.3
Table A3 Extraction ratios at a pH of 2, 7 and 12 of respectively Amaranth,
Rhodamine 6G, Chrysoidine, Indigo Tartrazine, Malachite green, Methyl violet and
Methylene blue
Amaranth Rhodamine 6G
Time 0 5 10 30 0 5 10 30
pH value
2.0 8.4 11.5 12.3 12.3 0.0 0.1 0.0 0.5
7.0 0.8 1.3 1.8 1.8 5.2 7.1 7.7 7.9
12.0 4.7 10.0 12.4 15.1 16.0 16.3 18.6 31.6
Chrysoidine Indigo
Time 0 5 10 30 0 5 10 30
pH value
2.0 0.8 1.0 1.0 2.0 22.2 30.0 33.8 42.3
7.0 3.8 7.5 9.3 13.2 2.4 3.2 5.2 5.6
12.0 15.7 19.8 52.5 54.5 25.4 41.4 40.4 63.5
Tartrazine Malachite green
Time 0 5 10 30 0 5 10 30
pH value
2.0 10.4 14.2 15.9 18.8 5.4 11.7 15.8 20.5
7.0 12.0 20.0 24.8 31.7 0.1 1.5 2.2 2.2
12.0 2.0 10.5 16.2 22.4 / / / /
Methyl violet Methylene blue
Time 0 5 10 30 0 5 10 30
pH value
2.0 3.4 2.5 2.5 3.2
1.5 1.0 1.0
7.0 1.9 1.1 0.3 0.1 1.5 1.1 0.9 0.9
12.0 / / / / 1.5 3.7 4.8 8.2


![METILPIRIMIDINA-4,6-DIIL]BISHIDRAZONA ESTUDUIOS ... · feitos através de voltametria de onda quadrada indicando que os compostos preparados possuem potenciais redox dentro da faixa](https://img.pdfslide.us/doc/110x75/5c12413b09d3f23b288d5bb5/metilpirimidina-46-diilbishidrazona-estuduios-feitos-atraves-de-voltametria.jpg)