Embed Size (px)
Citation preview

Applications of Data Assimilationin Earth System Science
Alan O’NeillData Assimilation Research Centre
University of Reading

DARC
Current & Future Satellite Coverage

Formation Flying - Afternoon Constellation
Ascending node crossing times and launch dates.OCO (1:15) August 2007Aqua (1:30) May 2002Cloudsat (1:31) April 2005 Calipso (1:31:15) April 2005Parasol (1:33) October 2004 (?)Aura (1:38) June 2004
AURA Launch
19 June 2004

2020 VISION
• By 2020 the Earth will be viewed from space with better than 1km/1min resolution
• Computer power will be over 1000 times greater than it is today
• To exploit this technological revolution, the world must be digitised

Welcome to Music World
High-tech SamplerWhat experts get What end-users want
Well-balanced high-quality blended music
Synthesis of tracks10 soundtracks
Vital to ensure Return On Investment!Courtesy PP Mathieu

Welcome to Digi World
What users get What end-users want
4D digital movie ofthe Earth System
High-tech Sampler
Level 2 forindividual sensor
Synthesis via Assimilation of EO data into Earth System Model
Courtesy PP Mathieu

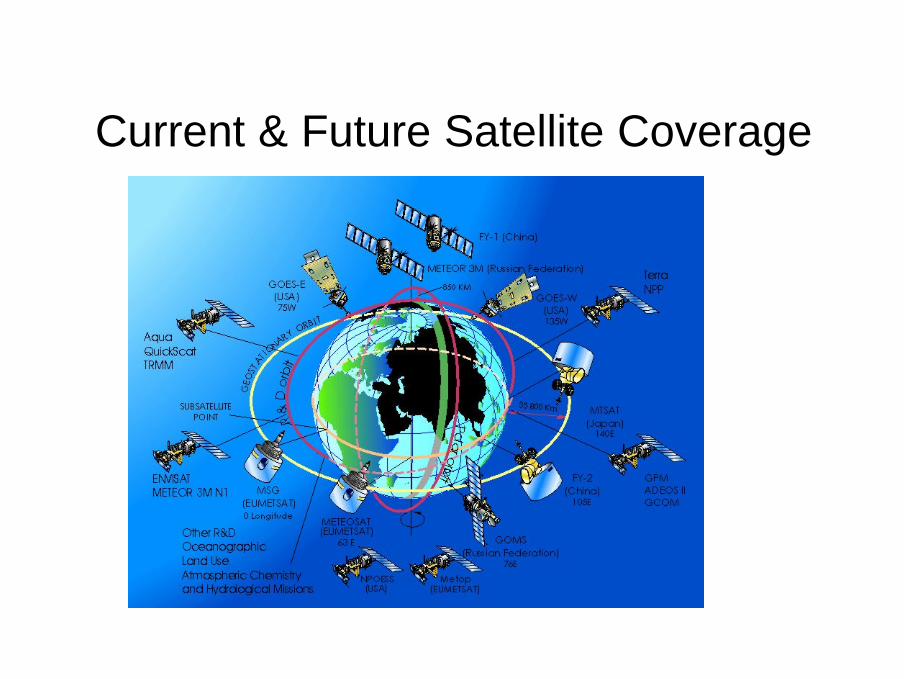
(1) Physical interpolationEO data provide a global view ……but have a limited & sequential sampling …..
Assimilation of data into models provides an optimal synthesis of heterogeneous observations taking account of errors and dynamical principles …
Fill gaps
Courtesy PP Mathieu

O3 measured by MIPAS/Envisat
Chemical analysis
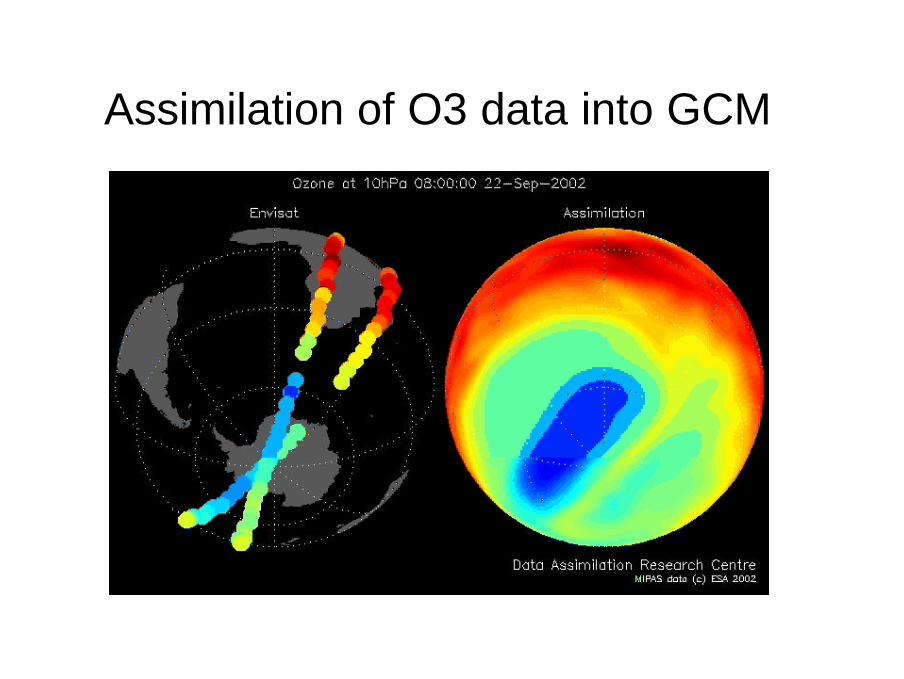
Assimilation of O3 data into GCM

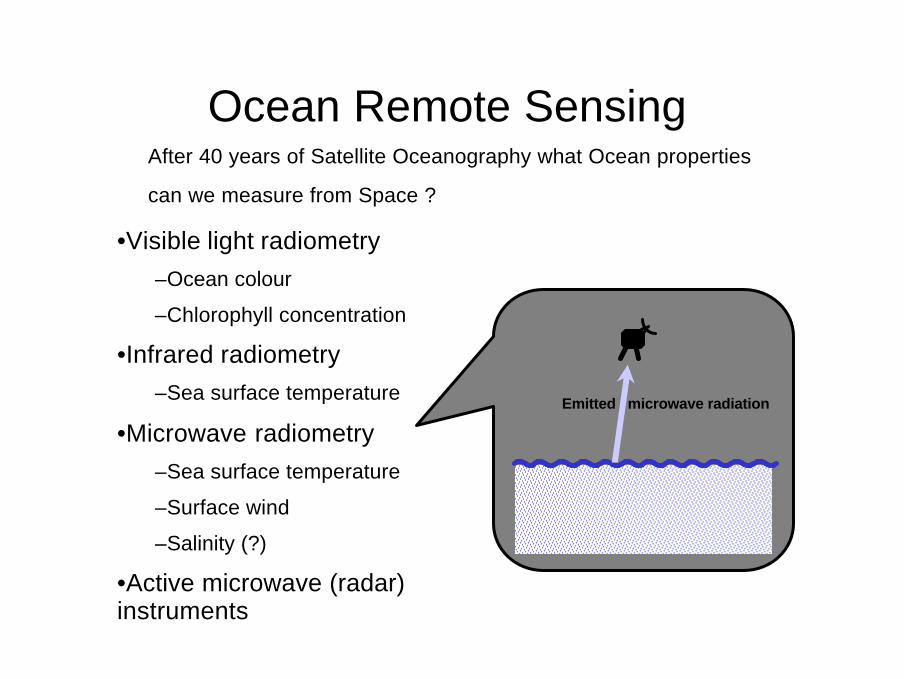
Ocean Remote SensingAfter 40 years of Satellite Oceanography what Ocean properties
can we measure from Space ?
•Visible light radiometry–Ocean colour
–Chlorophyll concentration
•Infrared radiometry–Sea surface temperature
•Microwave radiometry–Sea surface temperature
–Surface wind
–Salinity (?)
•Active microwave (radar) instruments
sunlight
lightabsorption & scattering
Ocean Remote SensingAfter 40 years of Satellite Oceanography what Ocean properties
can we measure from Space ?
•Visible light radiometry–Ocean colour
–Chlorophyll concentration
•Infrared radiometry–Sea surface temperature
•Microwave radiometry–Sea surface temperature
–Surface wind
–Salinity (?)
•Active microwave (radar) instruments
Emitted microwave radiation
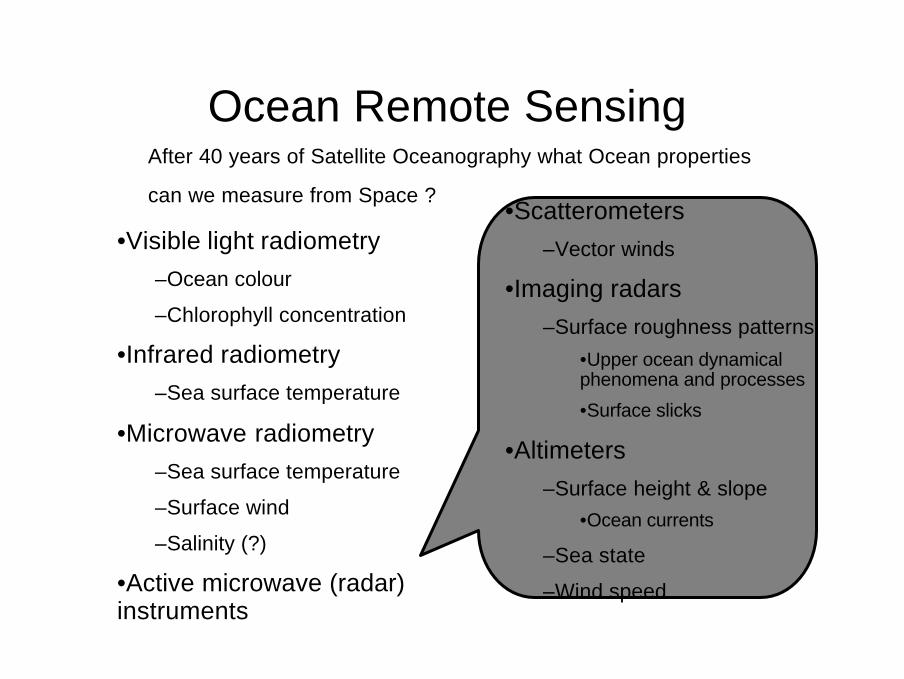
Ocean Remote SensingAfter 40 years of Satellite Oceanography what Ocean properties
can we measure from Space ?
•Visible light radiometry–Ocean colour
–Chlorophyll concentration
•Infrared radiometry–Sea surface temperature
•Microwave radiometry–Sea surface temperature
–Surface wind
–Salinity (?)
•Active microwave (radar) instruments
•Scatterometers–Vector winds
•Imaging radars–Surface roughness patterns
•Upper ocean dynamical phenomena and processes
•Surface slicks
•Altimeters–Surface height & slope
•Ocean currents
–Sea state
–Wind speed
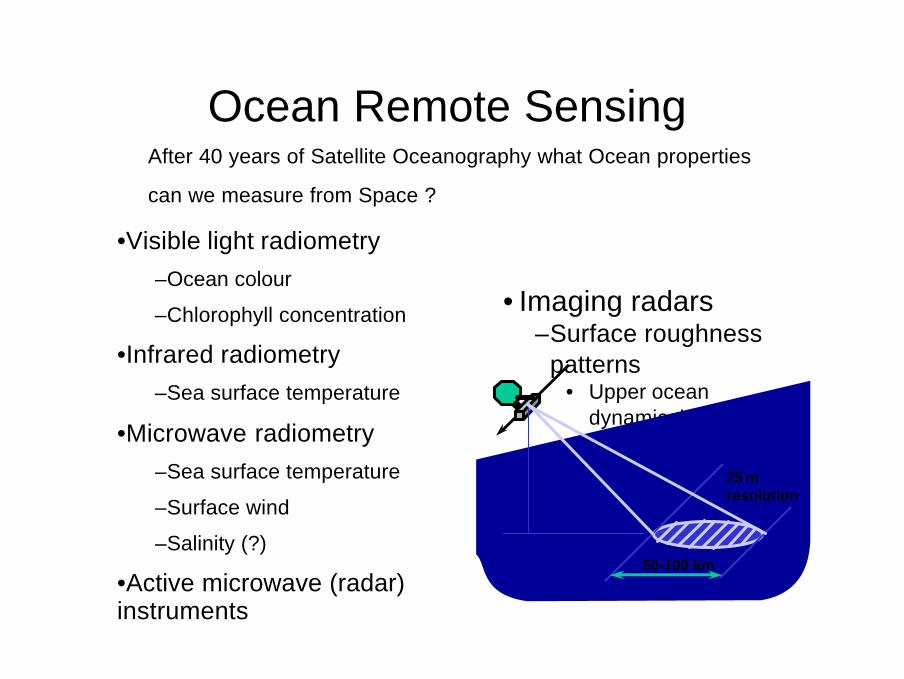
Ocean Remote SensingAfter 40 years of Satellite Oceanography what Ocean properties
can we measure from Space ?
•Visible light radiometry–Ocean colour
–Chlorophyll concentration
•Infrared radiometry–Sea surface temperature
•Microwave radiometry–Sea surface temperature
–Surface wind
–Salinity (?)
•Active microwave (radar) instruments
• Imaging radars–Surface roughness
patterns• Upper ocean
dynamical processes . . . ? ?
50-100 km
25 m resolution

DARC

DARC

What is special about the view of the ocean from a satellite?
• A spatially detailed view– Spatial resolution from 25m to 50km– A synoptic picture that is 100 km - 10 000 km wide
• Regularly repeated views– Revisit intervals between 30 min. and 35 days– Continuously repeated over years to decades
• A view with global coverage– Satellites see the parts where ships rarely go– Single-sensor consistency - no intercalibration
uncertainties• Measures parameters that cannot be observed in situ
– Surface slope (a few cm over 100s of kilometres)– Surface roughness at short length scales (2-50 cm)

DARC

Operational oceanography
Assimilation of EO data into ocean models provides the best available quantitative picture of the ocean state.
Essential building block for the development of operational marine services (ROSES).
Model dynamics transports EO information from surface (data-rich region) to depth (data-poor region).
Courtesy LEGI
Salinity (SMOS)
Temperature (AATSR)
Sea Level Height (RA2)
Gulf Stream eddies
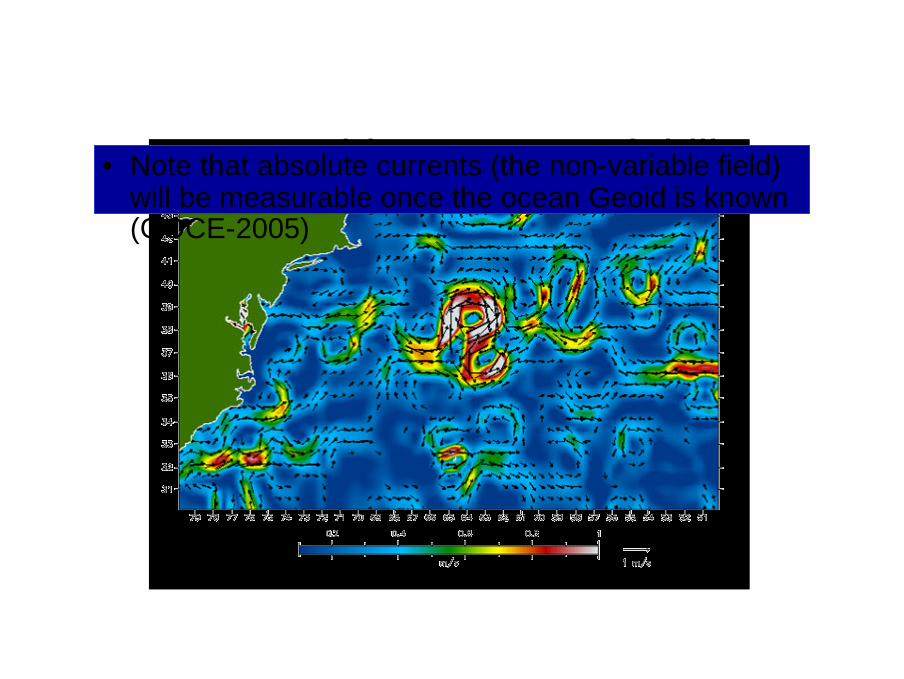
Geostrophic current variabilityThe variable part of currents in the N Atlantic (Gulf Stream)• Note that absolute currents (the non-variable field) will be measurable once the ocean Geoid is known (GOCE-2005)

DARC
Cross-section in mid Atlantic
northsouth

DARC
MERIS ocean colour

Ocean eddies in a chlorophyll image
SeaWiFS data May 11th 2002
Image from NASA

Regional Scale: Regional Scale: WWalnut alnut GGulch (Monsoon 90)ulch (Monsoon 90)
Model
Model with 4DDA
Observation
Tombstone, AZ
0% 20%
Houser et al., 1998

Land InitializationLand Initialization: : MotivationMotivation
• Knowledge of soil moisture has a greater impact on the predictability of summertime precipitation over land at mid-latitudes than Sea Surface Temperature (SST).
(2) Environmental ForecastEO data are critical for monitoring the global environment but managing risks requires forecast …..
Assimilation of data into models is at the heart of operational prediction….
Predict
Courtesy PP Mathieu

NOAA-15 NOAA-16 NOAA-17
Goes-W Goes-W Met-7 Goes-W GMS(Goes-9)
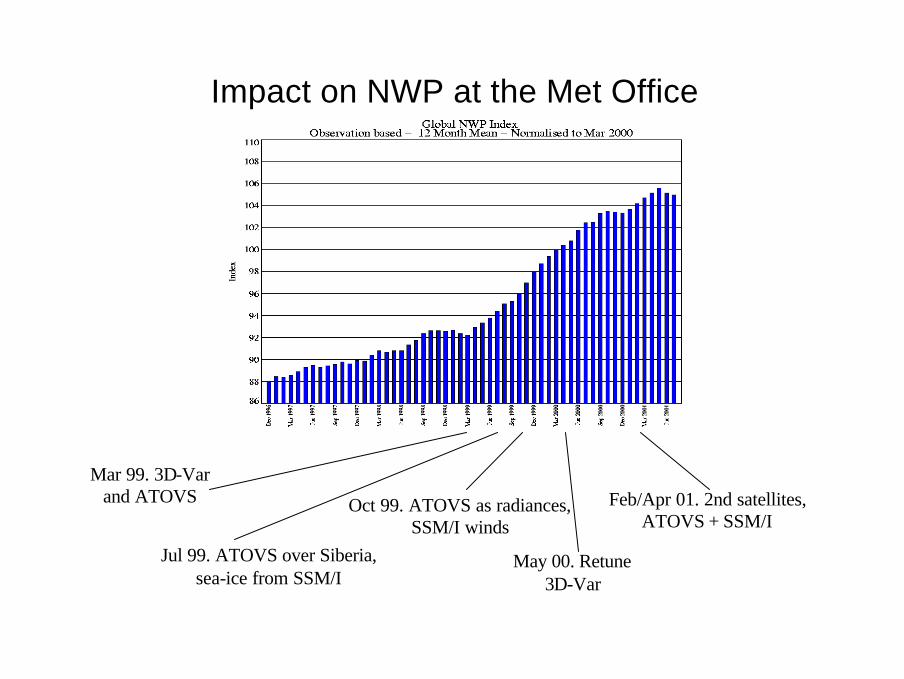
Impact on NWP at the Met Office
Mar 99. 3D-Var and ATOVS
Jul 99. ATOVS over Siberia, sea-ice from SSM/I
Oct 99. ATOVS as radiances, SSM/I winds
May 00. Retune 3D-Var
Feb/Apr 01. 2nd satellites, ATOVS + SSM/I

Weather forecasting
NWP Forecast Skill
Satellite data have contributed tothe continuous improvement of forecast quality with enormousbenefits for society.
Numerical Weather Prediction:Ø Sophisticated atmospheric models.Ø Most mature assimilation techniques (able to ingest sounding radiances).Ø Very big user of EO data.
SH
NH
Day 7
Day 5
Day 3
Courtesy PP Mathieu & ECMWF

Breakup 2000ozone hole
19 November 20004-day forecast

Breakup 2000ozone hole
19 November 2000analysis
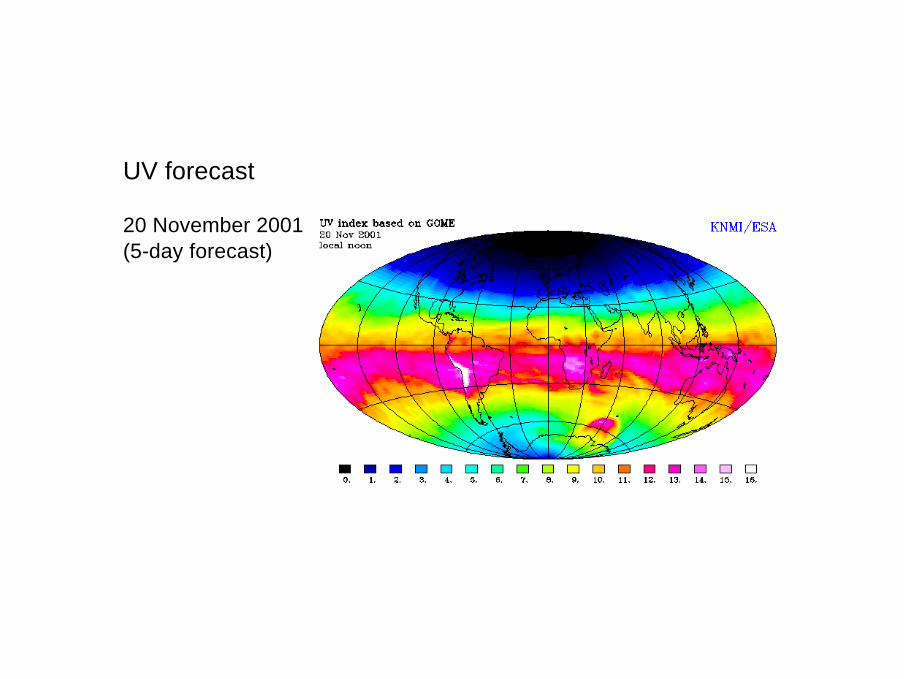
UV forecast
20 November 2001 (5-day forecast)
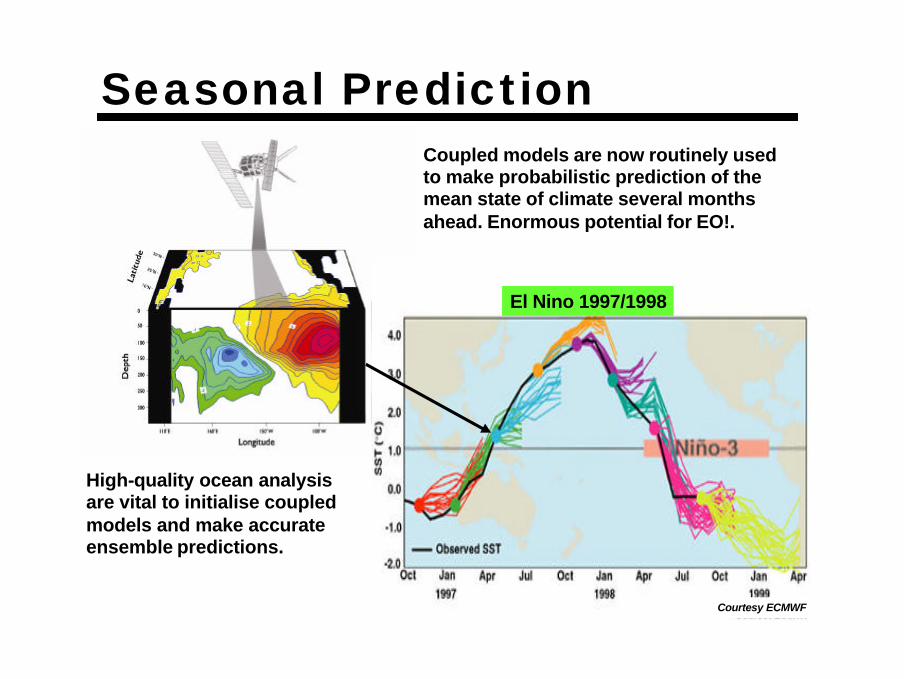
Seasonal PredictionCoupled models are now routinely used to make probabilistic prediction of the mean state of climate several months ahead. Enormous potential for EO!.
High-quality ocean analysis are vital to initialise coupled models and make accurate ensemble predictions.
El Nino 1997/1998
Courtesy ECMWF

Worldwide impact of El Nino
Fishery disruptionWildfire Fatalities
WaterRationing
CropDamage
ENSO teleconnections have dramatic societal and economic impactsaround the globe (e.g. U.S. impact of ENSO 1997/98 $25billions).

Seasonal Forecasts for Europe (DJF 1997/98)
Forecast probability of above average temperatures
Measured temperature anomaly

(3) Observing System DesignObserving systems should help to advance our current state of knowledge …..
Model sensitivity experiments allow us to target observations and to evaluate objectively the incremental value of EO data.Potential cost savings!
Target
Courtesy PP Mathieu

Numerical LaboratoryWhere/What should we measure?Data Assimilation helps to identify sensitive regions where observations would maximise benefits for forecast.
What is the added value of EO?Observing System experiments help to quantify the impact of withdrawing various (synthetic) data streams on forecast skill (e.g. evaluation of Swift mission before launch!).
Control No sondes No satellite
40%
50%
60%
70%
80%
90%
100%
Day 3 Day 5 Day 7
Forecast Skill (SH)Courtesy PP Mathieu & ECMWF
Region forForecast
Max er
ror
growth
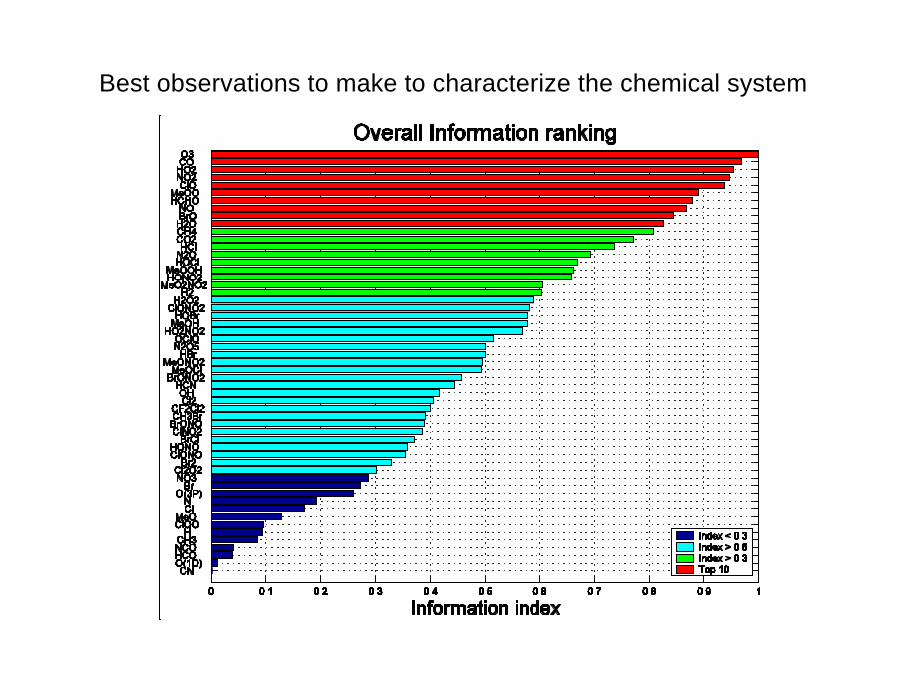
Best observations to make to characterize the chemical system

(4) Inverse Modelling
EO provides an indirect measure of the quantity of interest …..
Assimilation of data into models enables to infer [non-observable] geophysical quantities of interest by exploiting physical/chemical linkages in the system.
Infer
Courtesy PP Mathieu
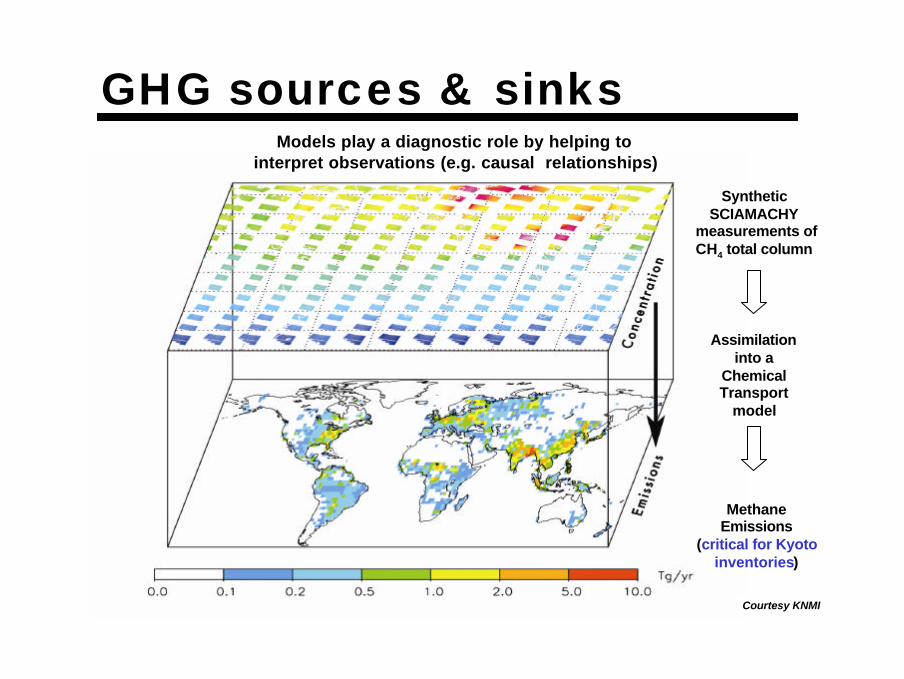
GHG sources & sinks
Methane Emissions
(critical for Kyoto inventories)
Models play a diagnostic role by helping tointerpret observations (e.g. causal relationships)
Synthetic SCIAMACHY
measurements of CH4 total column
Assimilation into a
ChemicalTransport
model
Courtesy KNMI
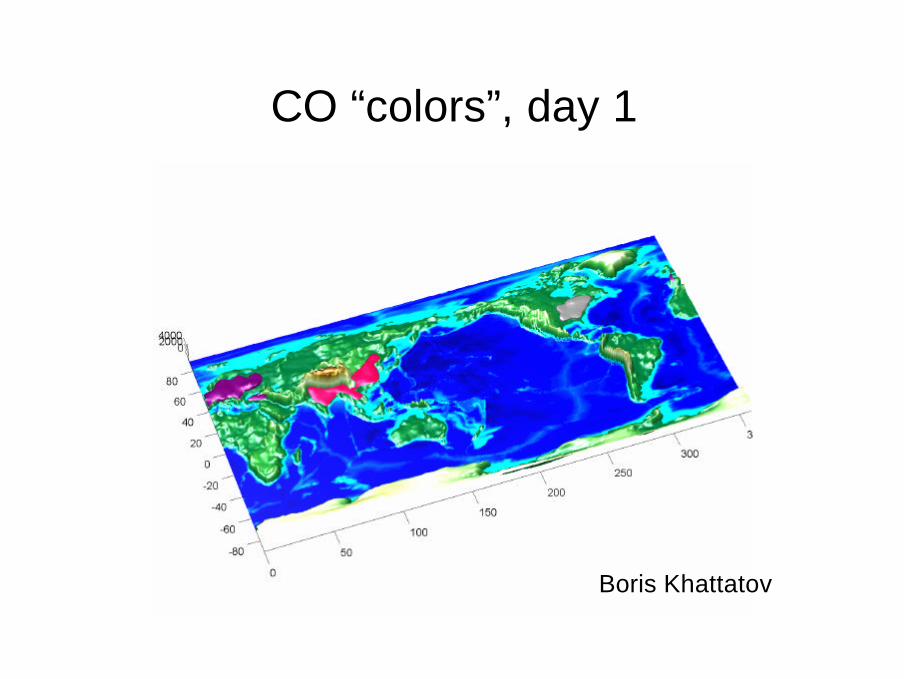
CO “colors”, day 1
Boris Khattatov

CO “colors”, day 65
Boris Khattatov

CO “colors”, day 85
Boris Khattatov

t
data assimilation cycles
extended-range forecasts
(5) Testing Climate Models

t
error
10 days

Skill Measures: Observation Increment, (O-F)
• The difference between the forecast from the first guess, F, and the observations, O, also known as observed-minus-background differences or the innovation vector.
• This is probably the best measure of forecast skill.

ECMWF
Ozonemonthly-mean analysis increment.
Sept. 1986
_
+
T

GMES
Satellite data
Satellite data
Satellite data
In situ ship data
Buoy data Argo
floats
Many data sources Many users / clients
Governmentpolicy makers
Monitoring international
treaty obligations
Environmental quality
management
Resourcemanagement
Climateprediction
Commercialusers
Private individuals
O.F.S.Data processing,modelling,assimilation,archiving
Operational oceanforecasting
Climate data compositing
Statistical dataanalysis
Analysis andinterpretation
Large scale/globalintegration
Dataproduc
t
Dataproduc
t
ManagementInformation
Dataproduc
t
ManagementInformation
P U B L I C G
O O
D
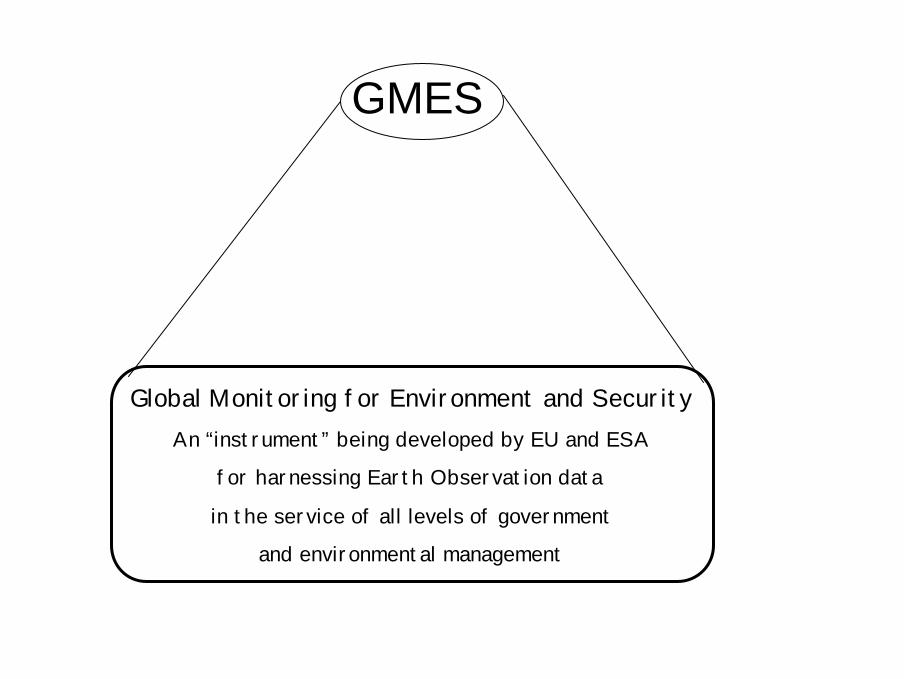
GMES
Global Monitoring for Environment and SecurityAn “instrument” being developed by EU and ESA
for harnessing Earth Observation data
in the service of all levels of government
and environmental management

Conclusion
Organise – Complement – Supplement
Assimilation
Val
ue c
hain UNDERSTANDING,
MONITORING, FORECASTING
the Earth System& global change
Data Digi World Science & Services
Validate – Initialise – Constrain
Courtesy PP Mathieu