Embed Size (px)
Citation preview
1
Applications in the use of Isotope Geochemistry to identify the origin of
methane in the environment
Fred J. Baldassare, P.G.Geologist
Pennsylvania Department of Environmental Protection
2
Methane Is the Principal Hydrocarbon Detected in All of Our
Stray Gas Investigations
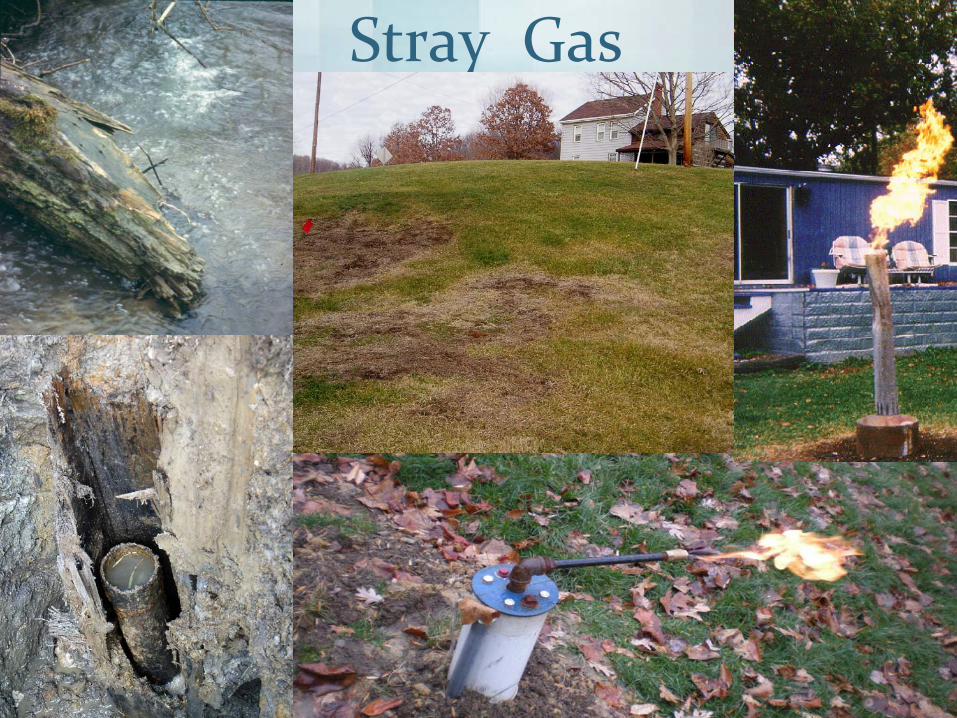
• Methane (CH4) is the simplest paraffin hydrocarbon gas.
• Flammable, colorless, odorless.• Specific gravity: .555• Explosive range: 5-15%• Solubility in water: 26-34 mg/l
3
Potential Stray Gas Sources in Pennsylvania
• Abandoned & operating gas wells• Natural gas storage fields• Natural gas pipelines• Abandoned & operating coal mines• CBM wells
• Abandoned & operating landfills• Shallow formations – microbial/thermogenic• Drift gas
4
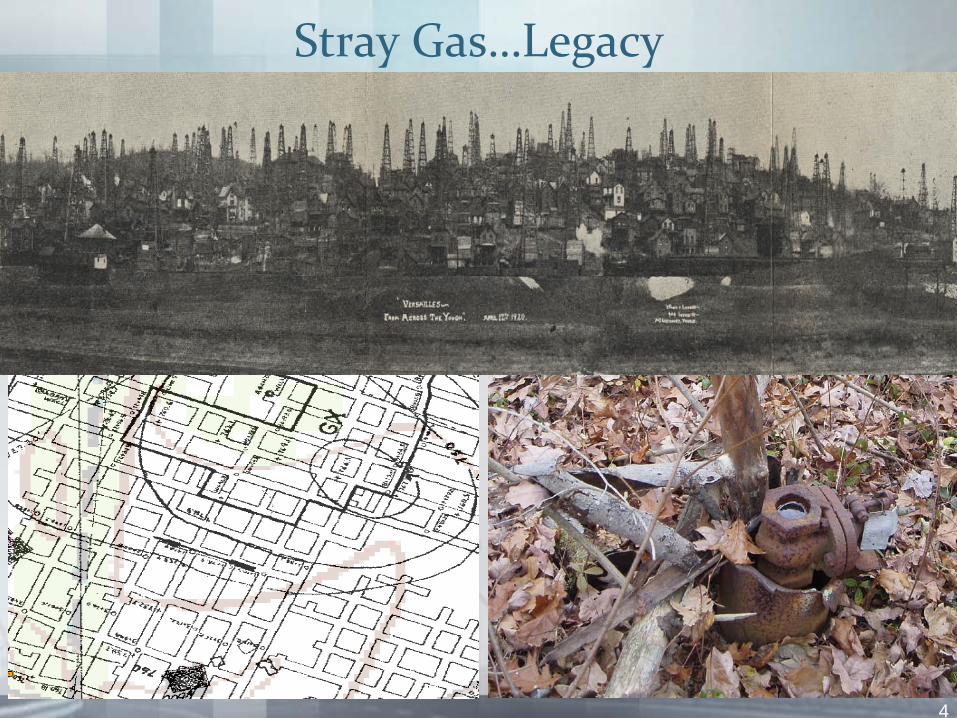
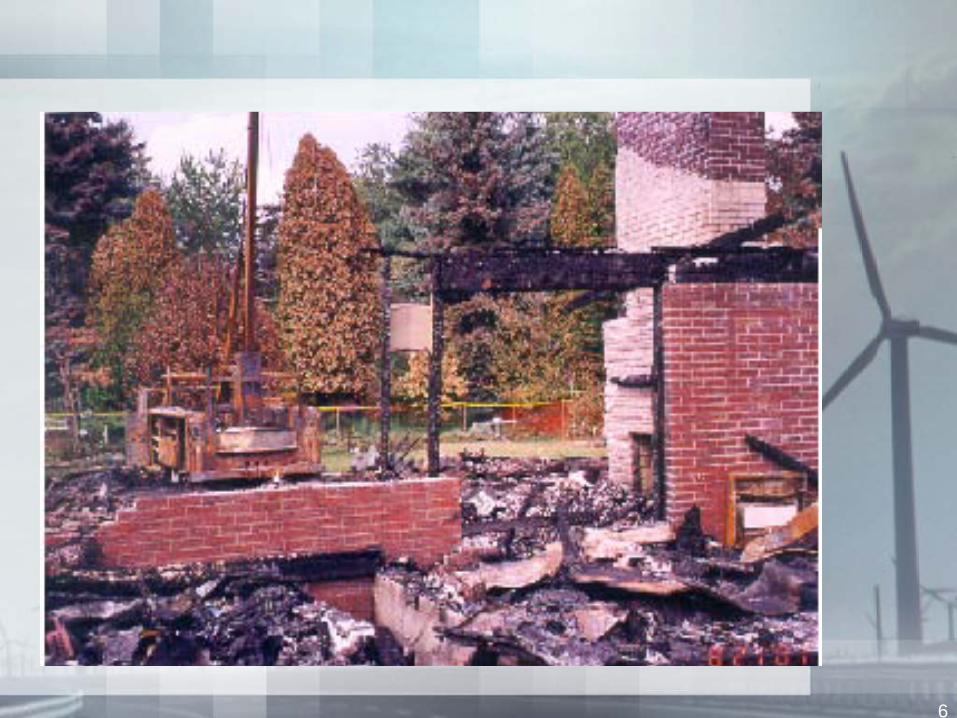
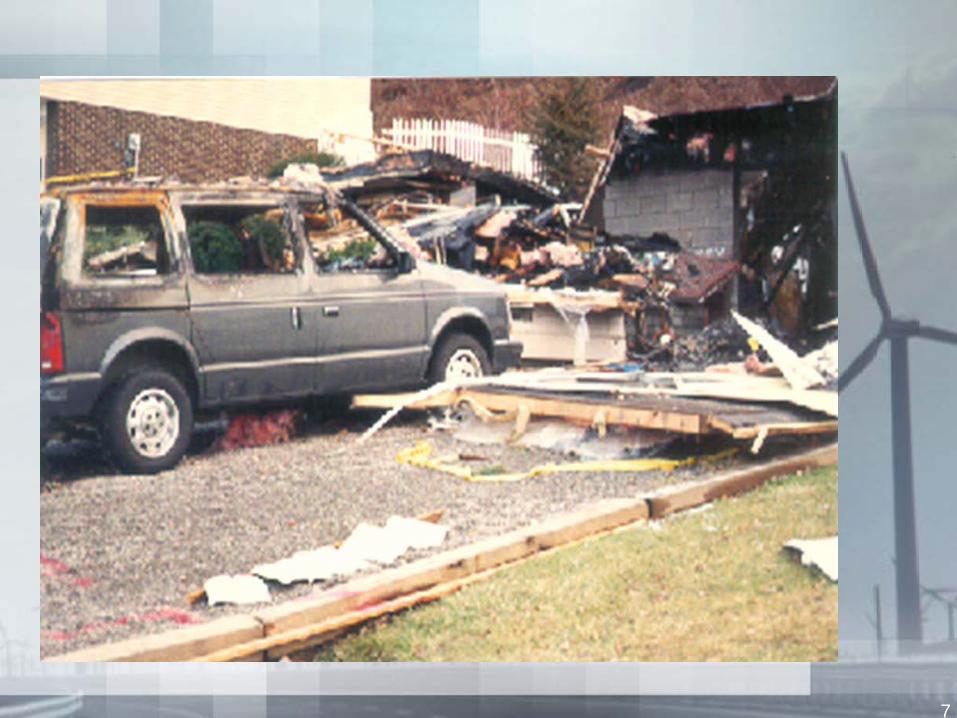
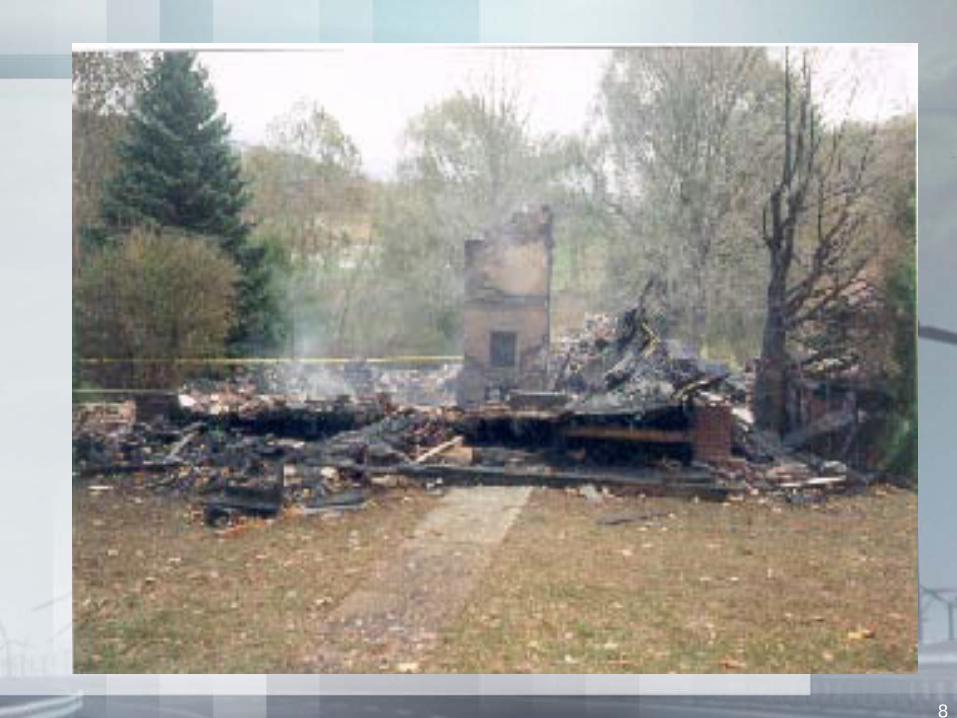
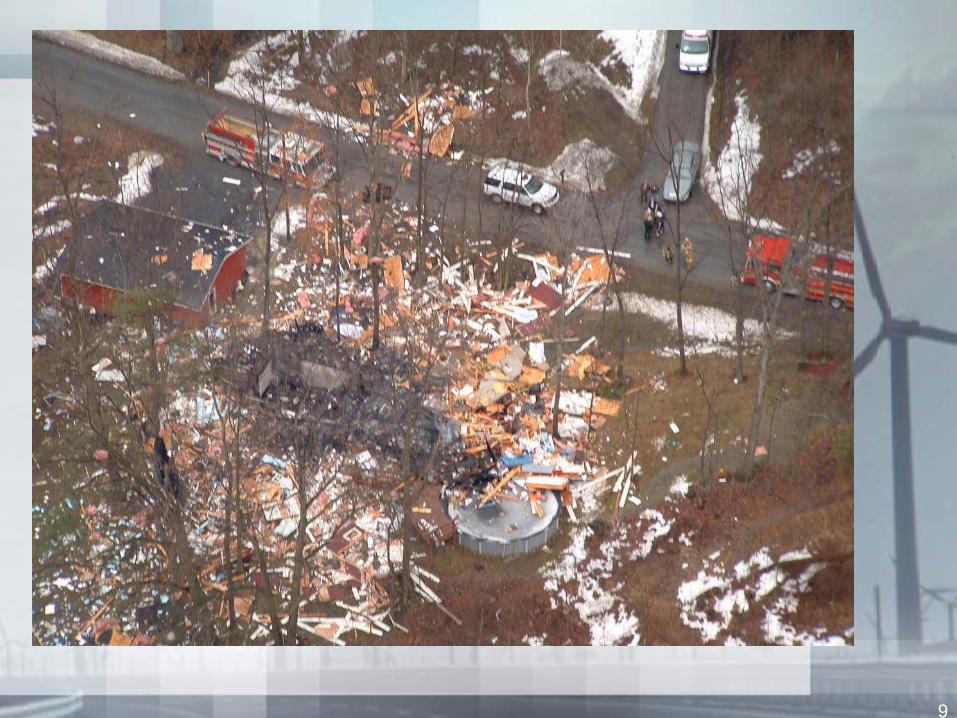
Stray Gas…Legacy
5
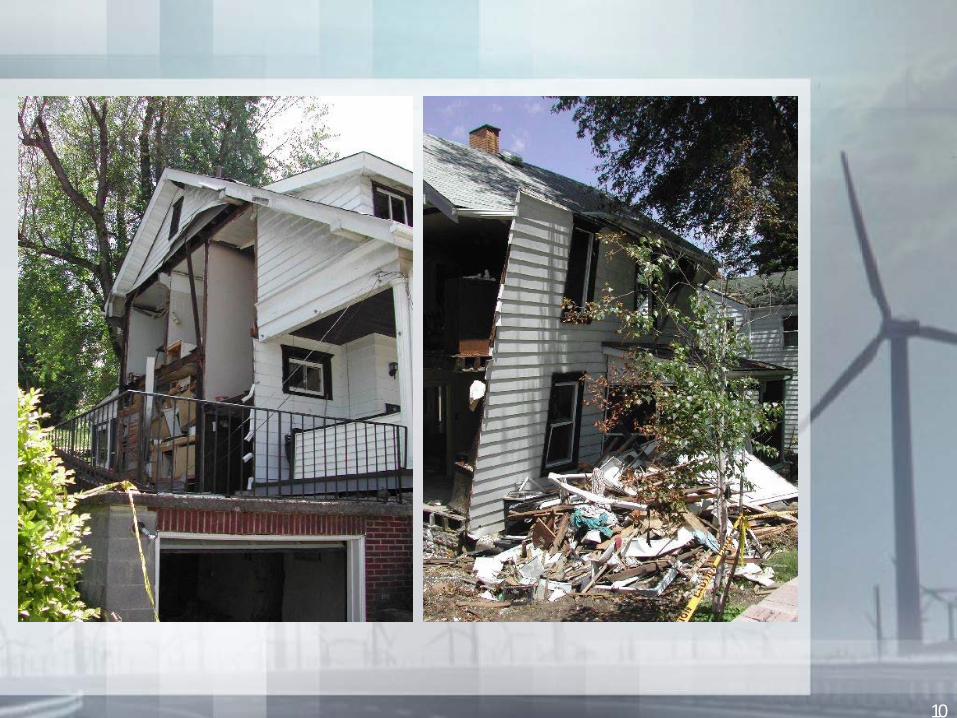
The Consequences of the Undetected Migration of Stray Gas in the Subsurface
Can Be Devastating.
6
7
8
9
10
11
Stray Gas

12
13
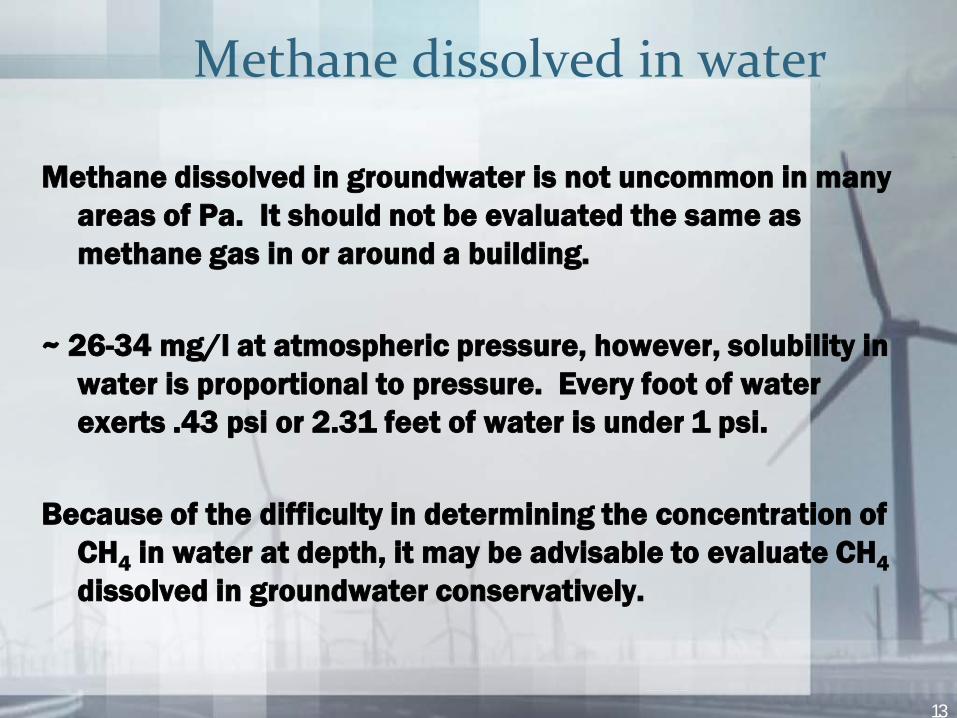
Methane dissolved in water
Methane dissolved in groundwater is not uncommon in many areas of Pa. It should not be evaluated the same as methane gas in or around a building.
~ 26-34 mg/l at atmospheric pressure, however, solubility in water is proportional to pressure. Every foot of water exerts .43 psi or 2.31 feet of water is under 1 psi.
Because of the difficulty in determining the concentration of CH4 in water at depth, it may be advisable to evaluate CH4dissolved in groundwater conservatively.
14
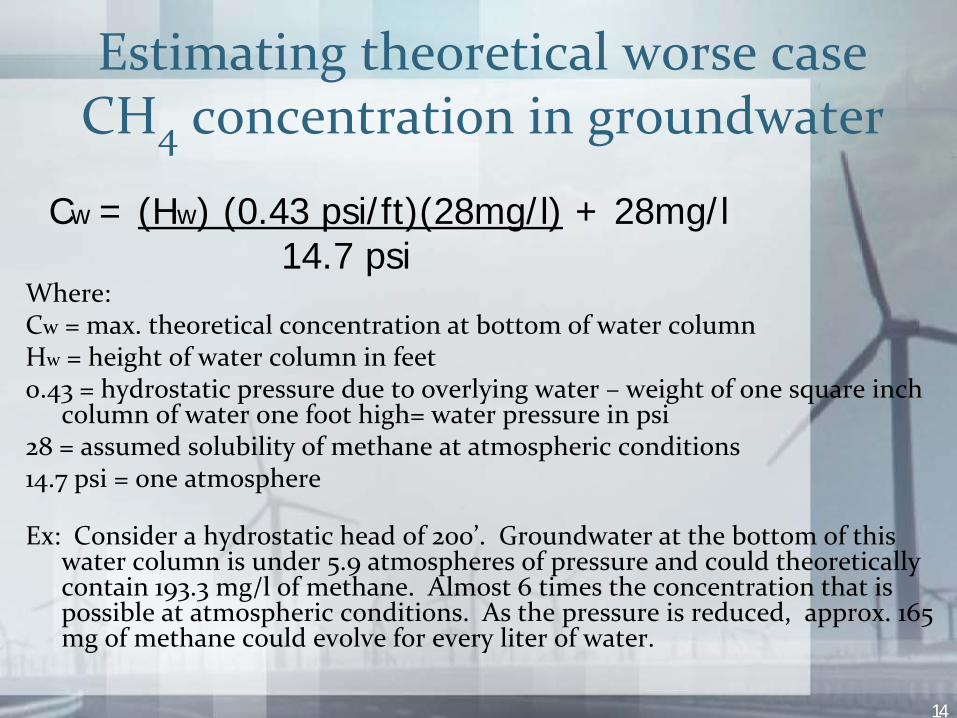
Estimating theoretical worse case CH4 concentration in groundwater
Cw = (Hw) (0.43 psi/ft)(28mg/l) + 28mg/l14.7 psi
Where:Cw = max. theoretical concentration at bottom of water columnHw = height of water column in feet0.43 = hydrostatic pressure due to overlying water – weight of one square inch
column of water one foot high= water pressure in psi28 = assumed solubility of methane at atmospheric conditions14.7 psi = one atmosphere
Ex: Consider a hydrostatic head of 200’. Groundwater at the bottom of this water column is under 5.9 atmospheres of pressure and could theoretically contain 193.3 mg/l of methane. Almost 6 times the concentration that is possible at atmospheric conditions. As the pressure is reduced, approx. 165 mg of methane could evolve for every liter of water.
15
Principles of gas migration in the subsurface…important variables for evaluating monitoring data
Gas migrates from areas of high pressure to areas of low pressure (advective transport)
Gas migration in the subsurface is influenced by:– Changes in barometric pressure – Soil/bedrock porosity, permeability– Precipitation - Pore water – Diurnal/Temperature contrasts
16
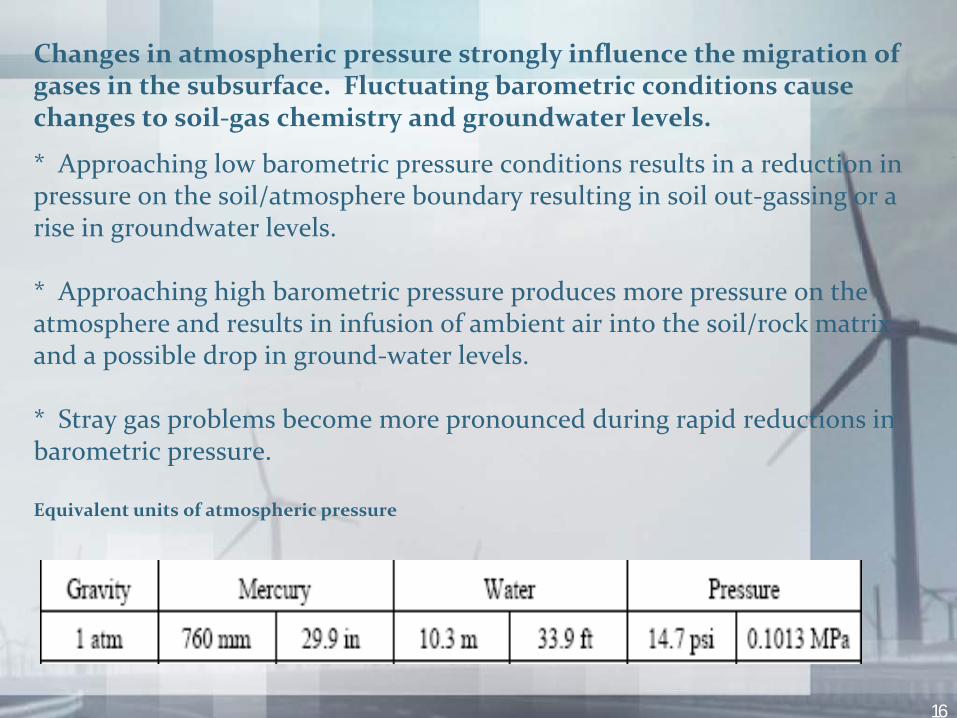
Changes in atmospheric pressure strongly influence the migration of gases in the subsurface. Fluctuating barometric conditions cause changes to soil-gas chemistry and groundwater levels.
* Approaching low barometric pressure conditions results in a reduction in pressure on the soil/atmosphere boundary resulting in soil out-gassing or a rise in groundwater levels.
* Approaching high barometric pressure produces more pressure on the atmosphere and results in infusion of ambient air into the soil/rock matrix and a possible drop in ground-water levels.
* Stray gas problems become more pronounced during rapid reductions in barometric pressure.
Equivalent units of atmospheric pressure
17
Genetic CharacterizationIsotope Geochemistry
Thermogenic: C1 – C6 hydrocarbons generated. Formed during the thermal alteration of organic materials.
Microbial: C1 – C3 hydrocarbons generated. Formed by the bacterial decomposition of organic matter.
18
Molecular Analysis Not Always Conclusive & May Be Misleading
Gas composition may be affected by subsurface conditions/processes:
– Fractionation– Barometric Pressure (influences soil gas flux)– Oxidizing bacteria
19
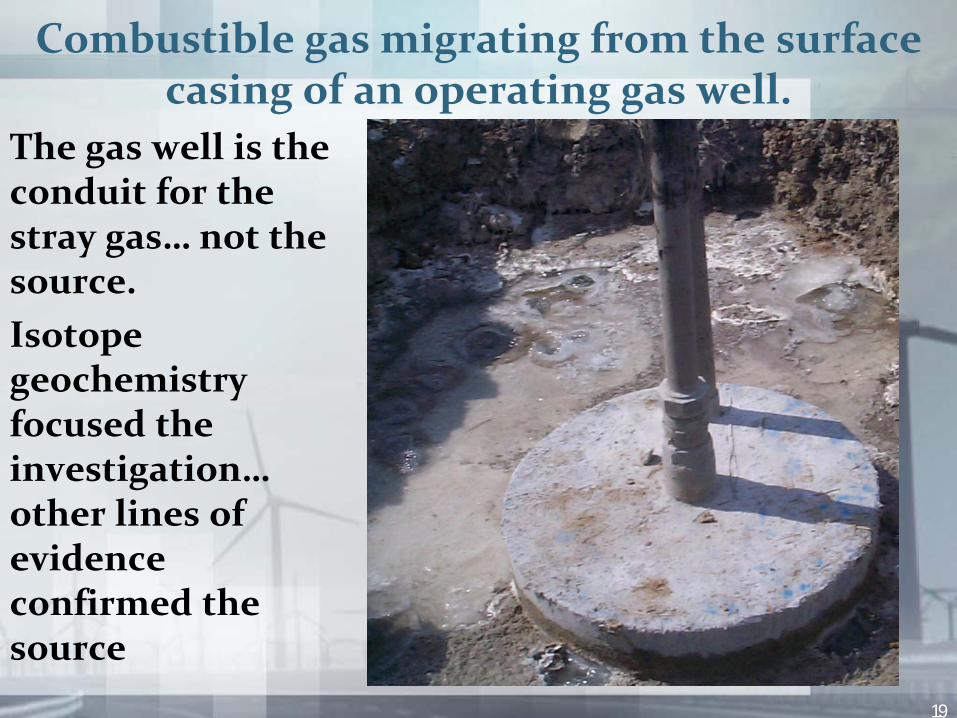
Combustible gas migrating from the surface casing of an operating gas well.
The gas well is the conduit for the stray gas… not the source.Isotope geochemistry focused the investigation… other lines of evidence confirmed the source
20
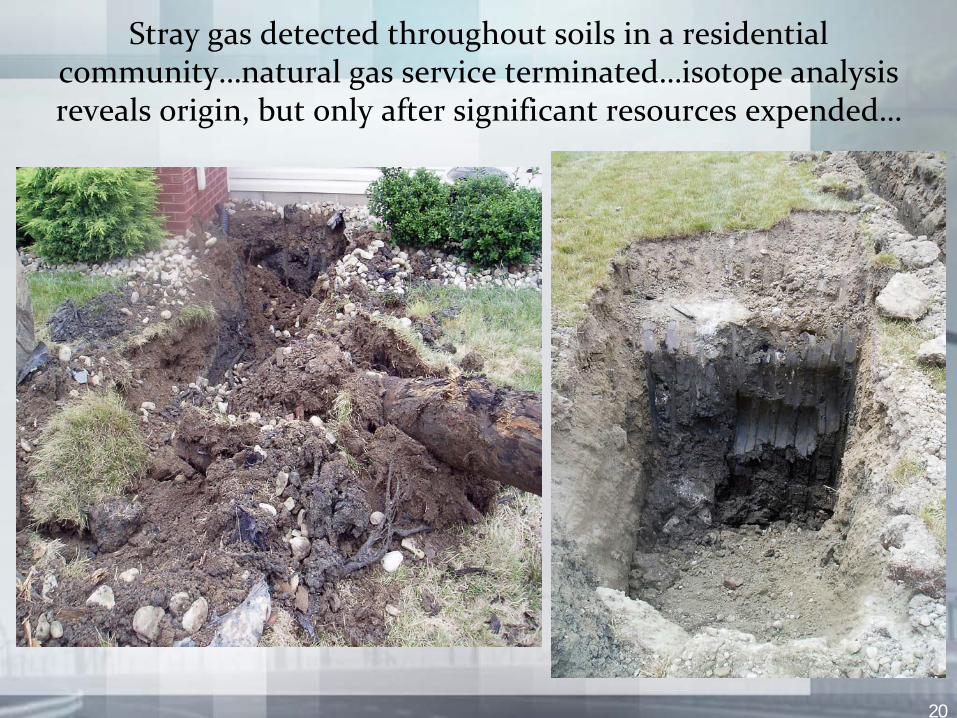
Stray gas detected throughout soils in a residential community…natural gas service terminated…isotope analysis reveals origin, but only after significant resources expended…
21
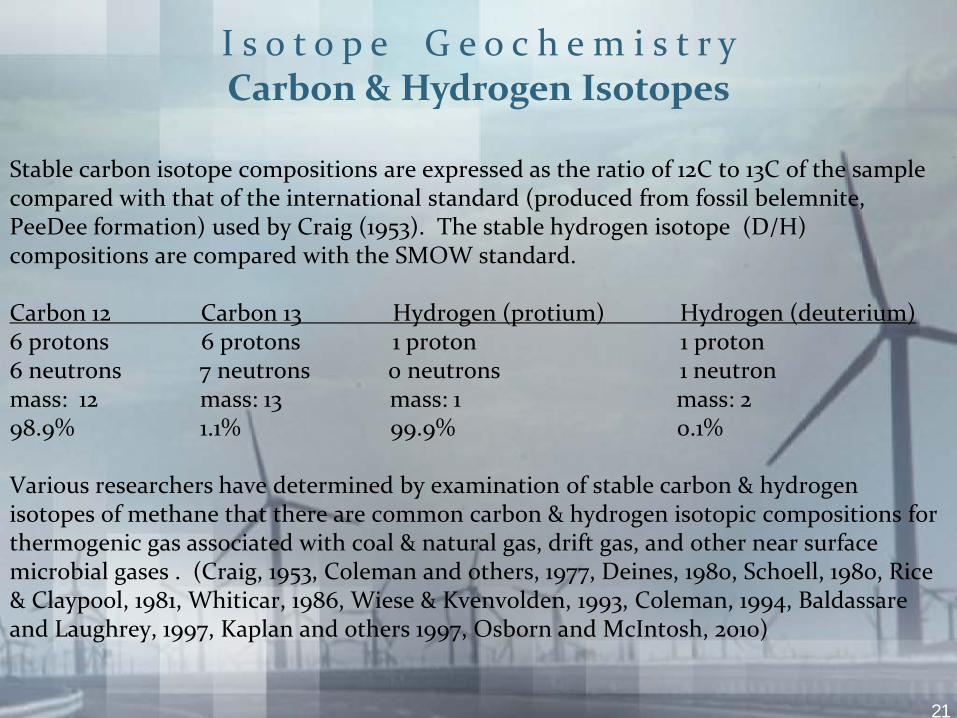
Stable carbon isotope compositions are expressed as the ratio of 12C to 13C of the sample compared with that of the international standard (produced from fossil belemnite, PeeDee formation) used by Craig (1953). The stable hydrogen isotope (D/H) compositions are compared with the SMOW standard.
Carbon 12 Carbon 13 Hydrogen (protium) Hydrogen (deuterium)6 protons 6 protons 1 proton 1 proton 6 neutrons 7 neutrons 0 neutrons 1 neutronmass: 12 mass: 13 mass: 1 mass: 298.9% 1.1% 99.9% 0.1%
Various researchers have determined by examination of stable carbon & hydrogen isotopes of methane that there are common carbon & hydrogen isotopic compositions for thermogenic gas associated with coal & natural gas, drift gas, and other near surface microbial gases . (Craig, 1953, Coleman and others, 1977, Deines, 1980, Schoell, 1980, Rice & Claypool, 1981, Whiticar, 1986, Wiese & Kvenvolden, 1993, Coleman, 1994, Baldassare and Laughrey, 1997, Kaplan and others 1997, Osborn and McIntosh, 2010)
I s o t o p e G e o c h e m i s t r yCarbon & Hydrogen Isotopes
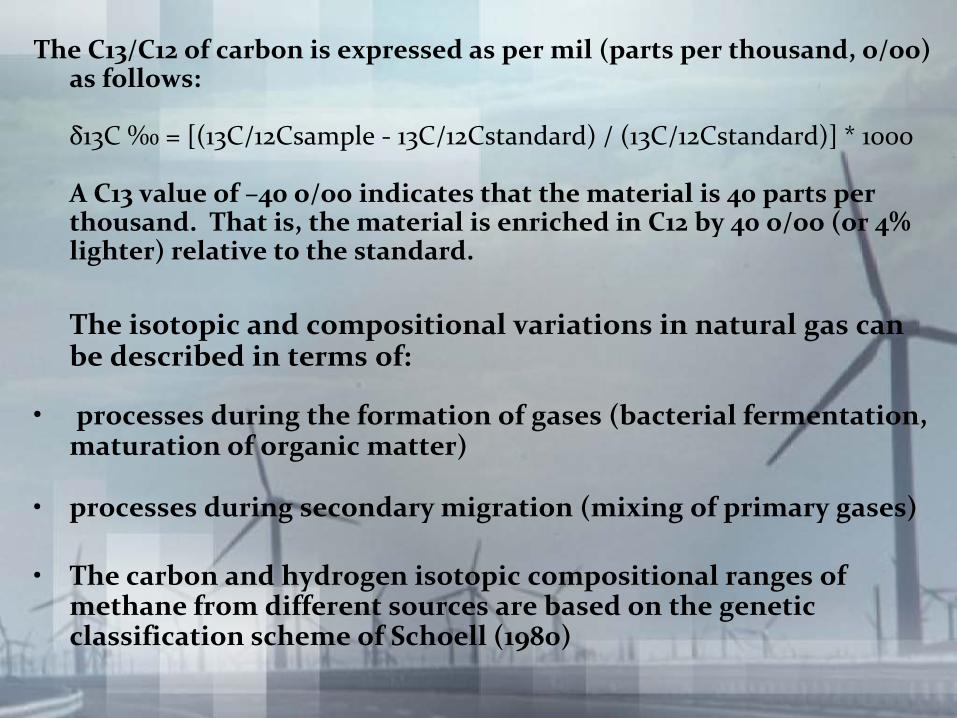
The C13/C12 of carbon is expressed as per mil (parts per thousand, o/oo) as follows:
δ13C ‰ = [(13C/12Csample - 13C/12Cstandard) / (13C/12Cstandard)] * 1000
A C13 value of –40 o/oo indicates that the material is 40 parts per thousand. That is, the material is enriched in C12 by 40 o/oo (or 4% lighter) relative to the standard.
The isotopic and compositional variations in natural gas can be described in terms of:
• processes during the formation of gases (bacterial fermentation, maturation of organic matter)
• processes during secondary migration (mixing of primary gases)
• The carbon and hydrogen isotopic compositional ranges of methane from different sources are based on the genetic classification scheme of Schoell (1980)

23
Isotopic signatures of methane In general:
Microbial methane - acetate fermentation - CH3COOH = CH4 + CO2
(marsh gas & landfill gas)• Del 13C: -40 to -62 o/oo• Del D: -270 to -350 o/oo
Microbial methane - CO2 reduction - CO2 + 4H2 = CH4 + 2H2O(drift gas)• Del 13C: -62 to -90 o/oo• Del D: -180 to -240 o/oo
Thermogenic methane• Del 13C: -26 to -55 o/oo• Del D: -110 to -250 o/oo

24
25
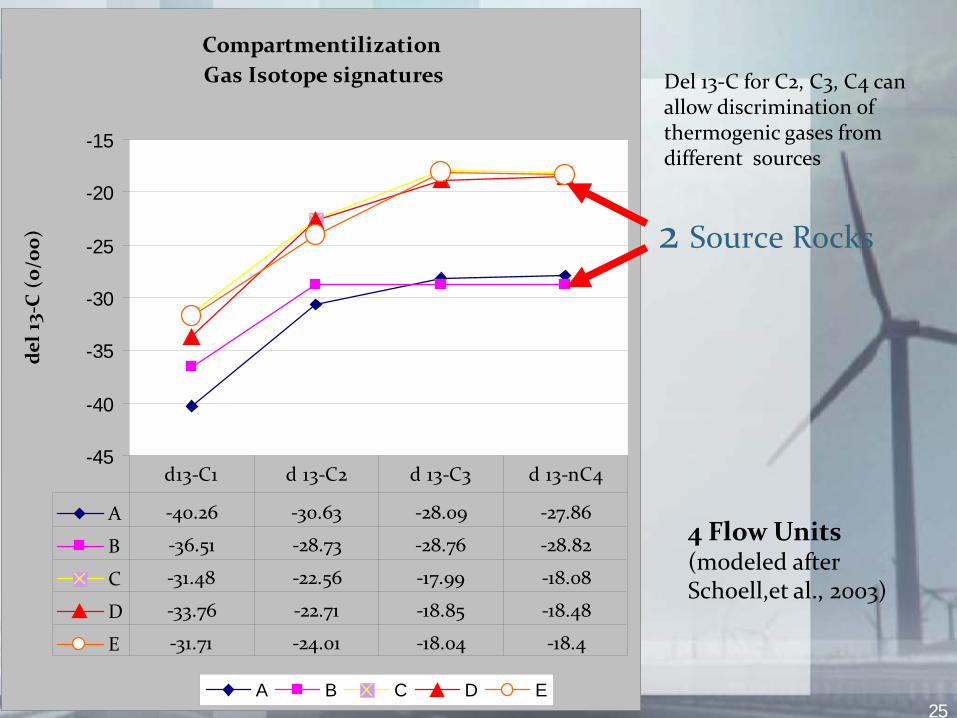
Compartmentilization Gas Isotope signatures
-45
-40
-35
-30
-25
-20
-15
del 1
3-C
(o/
oo)
A B C D E
A -40.26 -30.63 -28.09 -27.86
B -36.51 -28.73 -28.76 -28.82
C -31.48 -22.56 -17.99 -18.08
D -33.76 -22.71 -18.85 -18.48
E -31.71 -24.01 -18.04 -18.4
d13-C1 d 13-C2 d 13-C3 d 13-nC4
2 Source Rocks
4 Flow Units(modeled after Schoell,et al., 2003)
Del 13-C for C2, C3, C4 can allow discrimination of thermogenic gases from different sources
26
Isotope Geochemistry Interpretations, Considerations, Challenges
Dosing – isotope geochemistry can provide additional line of evidence regarding source strength
Oxidation – under certain conditions, the isotope signature can be altered by bacterial oxidation in the shallow subsurface
Mixing – stray gases of different origins can mix in the subsurface creating a composite signature of the gas – In some areas, gas from abandoned gas wells has migrated to more shallow formations mixing with microbial gas or thermogenic gas of a different origin
Variability – the isotope signature from a source can change temporarily or over time due to production variability
27
Isotope Geochemistry Interpretations, Considerations, Challenges
Thermal maturity - (diagenesis, catagenesis, metagenesis) - Natural gas sources can vary regionally- Shale formations – shale beds: reservoir and source rock
- The Marcellus Shale is thermally mature to post mature throughout much of the Appalachian basin
- Isotope signatures reveal greater variability than gas from conventional reservoirs
- isotope evidence reveals multiple origins of gas in the shale bed- Marcellus gas composition from southwestern PA differs from gas produced in
northcentral PA - Isotope reversals (C2, C3)