Embed Size (px)
Citation preview
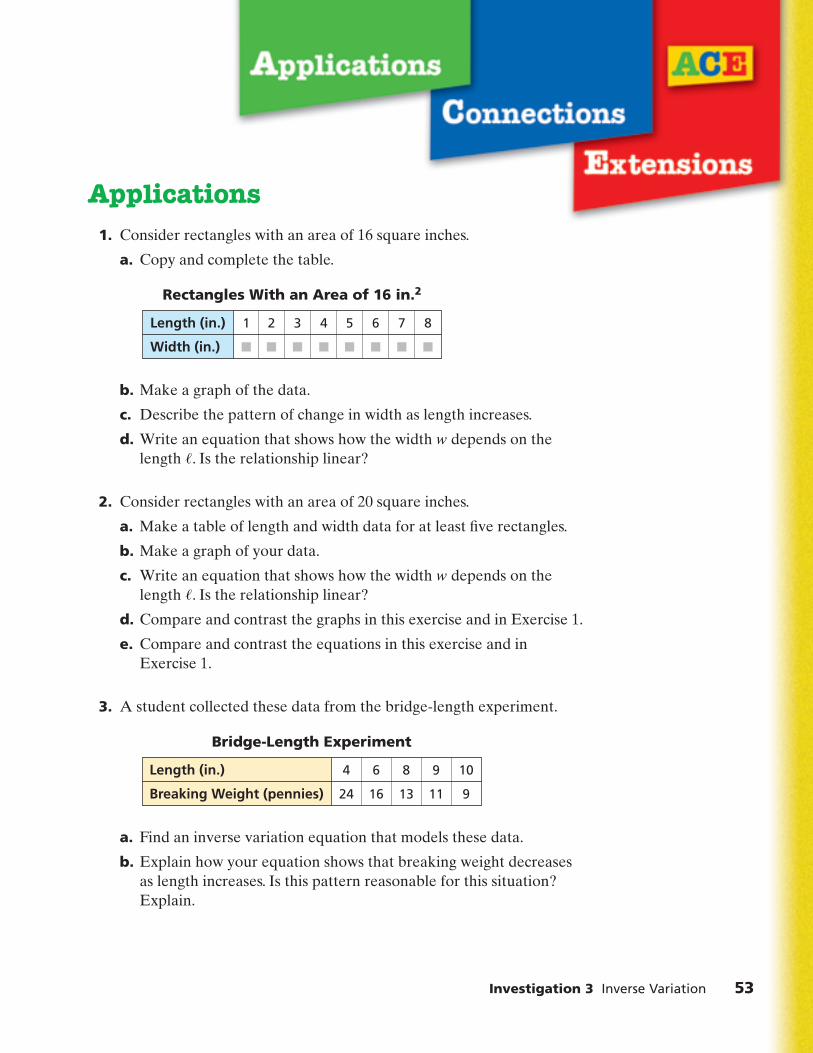
Applications1. Consider rectangles with an area of 16 square inches.
a. Copy and complete the table.
b. Make a graph of the data.
c. Describe the pattern of change in width as length increases.
d. Write an equation that shows how the width w depends on thelength /. Is the relationship linear?
2. Consider rectangles with an area of 20 square inches.
a. Make a table of length and width data for at least five rectangles.
b. Make a graph of your data.
c. Write an equation that shows how the width w depends on thelength /. Is the relationship linear?
d. Compare and contrast the graphs in this exercise and in Exercise 1.
e. Compare and contrast the equations in this exercise and in Exercise 1.
3. A student collected these data from the bridge-length experiment.
a. Find an inverse variation equation that models these data.
b. Explain how your equation shows that breaking weight decreases as length increases. Is this pattern reasonable for this situation? Explain.
Length (in.)
Breaking Weight (pennies)
Bridge-Length Experiment
4
24
6
16
8
13
9
11
10
9
Length (in.)
Width (in.)
Rectangles With an Area of 16 in.2
2
■
3
■
4
■
5
■
6
■
7
■
8
■
1
■
Investigation 3 Inverse Variation 53
8cmp06se_TM3.qxd 6/8/06 9:56 AM Page 53
For Exercises 4–7, tell whether the relationship between x and y is aninverse variation. If it is, write an equation for the relationship.
4.
5.
6.
7.
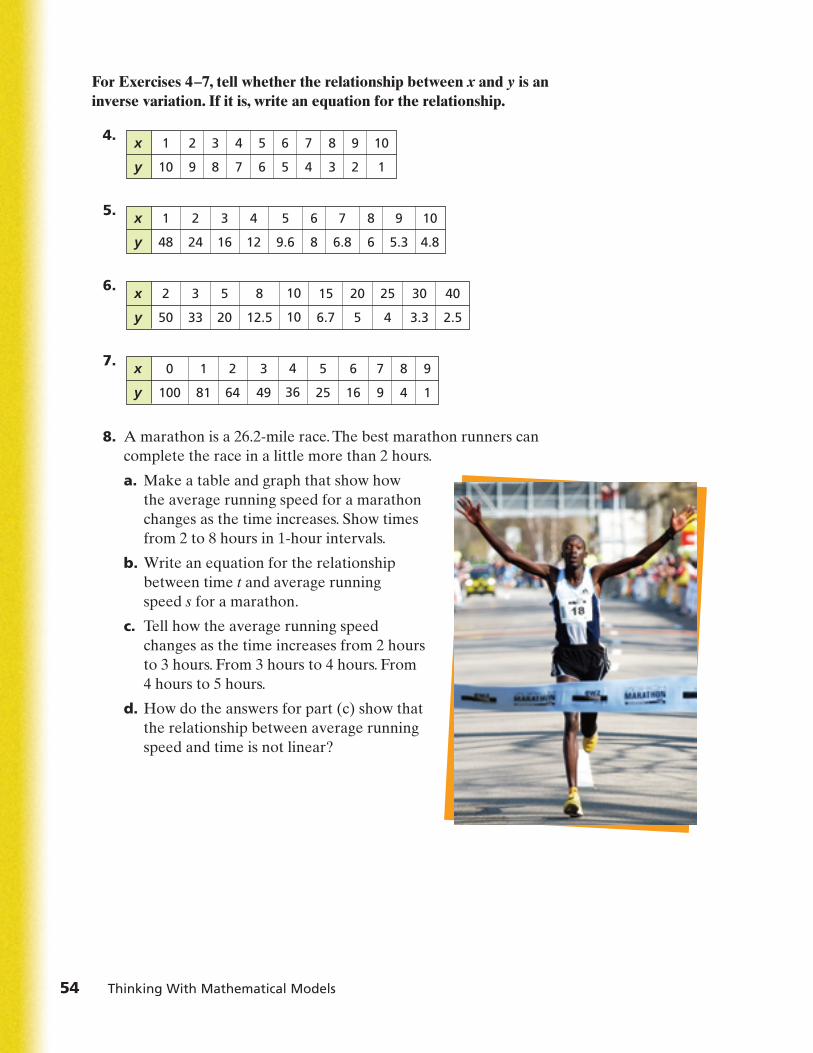
8. A marathon is a 26.2-mile race. The best marathon runners cancomplete the race in a little more than 2 hours.
a. Make a table and graph that show how the average running speed for a marathon changes as the time increases. Show times from 2 to 8 hours in 1-hour intervals.
b. Write an equation for the relationship between time t and average running speed s for a marathon.
c. Tell how the average running speed changes as the time increases from 2 hours to 3 hours. From 3 hours to 4 hours. From 4 hours to 5 hours.
d. How do the answers for part (c) show that the relationship between average running speed and time is not linear?
x
y
1
81
2
64
3
49
4
36
5
25
6
16
7
9
8
4
9
1
0
100
x
y
3
33
5
20
8
12.5
10
10
15
6.7
20
5
25
4
30
3.3
40
2.5
2
50
x
y
2
24
3
16
4
12
5
9.6
6
8
7
6.8
8
6
9
5.3
10
4.8
1
48
x
y
2
9
3
8
4
7
5
6
6
5
7
4
8
3
9
2
10
1
1
10
54 Thinking With Mathematical Models
8cmp06se_TM3.qxd 6/8/06 9:56 AM Page 54
1
2
3
4
5
6
7
8
9
10
11
12
13
14
15
16
17
18
19
20
Investigation 3 Inverse Variation 55
9. On one day of a charity bike ride, the route covers 50 miles.Individual riders cover this distance at different average speeds.
a. Make a table and a graph that show how the riding time changes as the average speed increases. Show speed values from 4 to 20 miles per hour in intervals of 4 miles per hour.
b. Write an equation for the relationship between the riding time t and average speed s.
c. Tell how the riding time changes as the average speed increasesfrom 4 to 8 miles per hour. From 8 to 12 miles per hour. From 12 to 16 miles per hour.
d. How do the answers for part (c) show that the relationship between average speed and time is not linear?
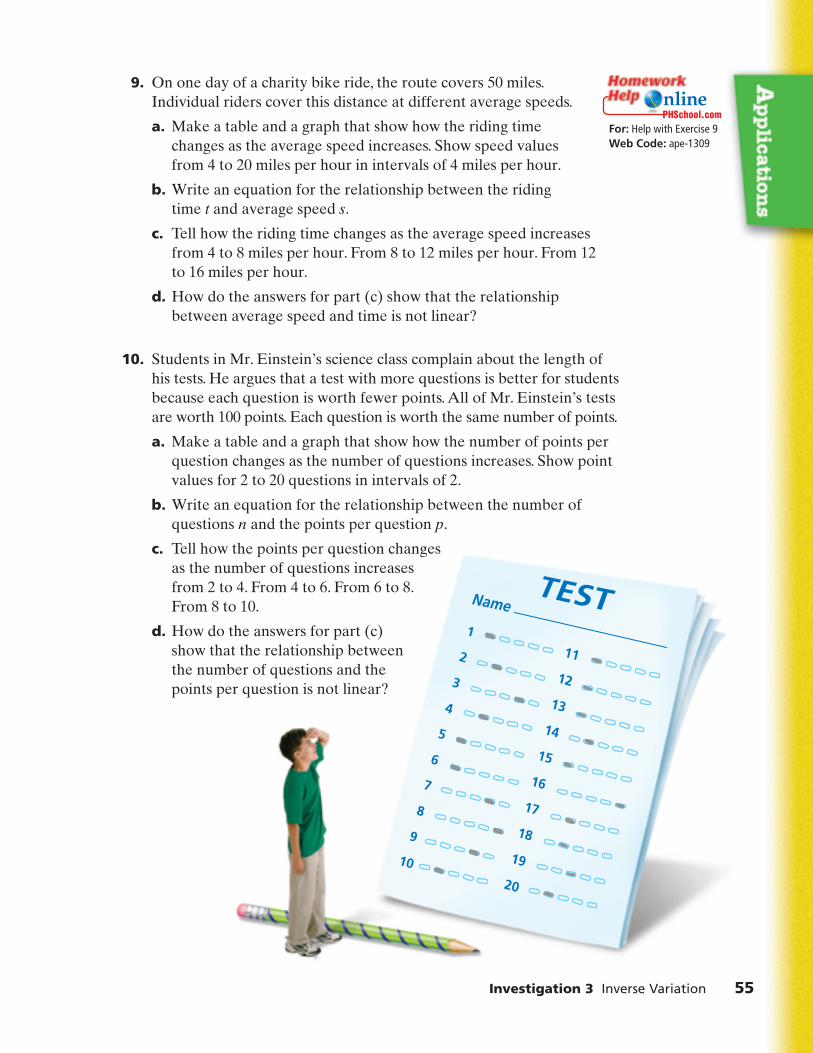
10. Students in Mr. Einstein’s science class complain about the length ofhis tests. He argues that a test with more questions is better for studentsbecause each question is worth fewer points. All of Mr. Einstein’s testsare worth 100 points. Each question is worth the same number of points.
a. Make a table and a graph that show how the number of points perquestion changes as the number of questions increases. Show pointvalues for 2 to 20 questions in intervals of 2.
b. Write an equation for the relationship between the number ofquestions n and the points per question p.
c. Tell how the points per question changes as the number of questions increases from 2 to 4. From 4 to 6. From 6 to 8.From 8 to 10.
d. How do the answers for part (c) show that the relationship between the number of questions and the points per question is not linear?
For: Help with Exercise 9Web Code: ape-1309
8cmp06se_TM3.qxd 6/8/06 9:56 AM Page 55
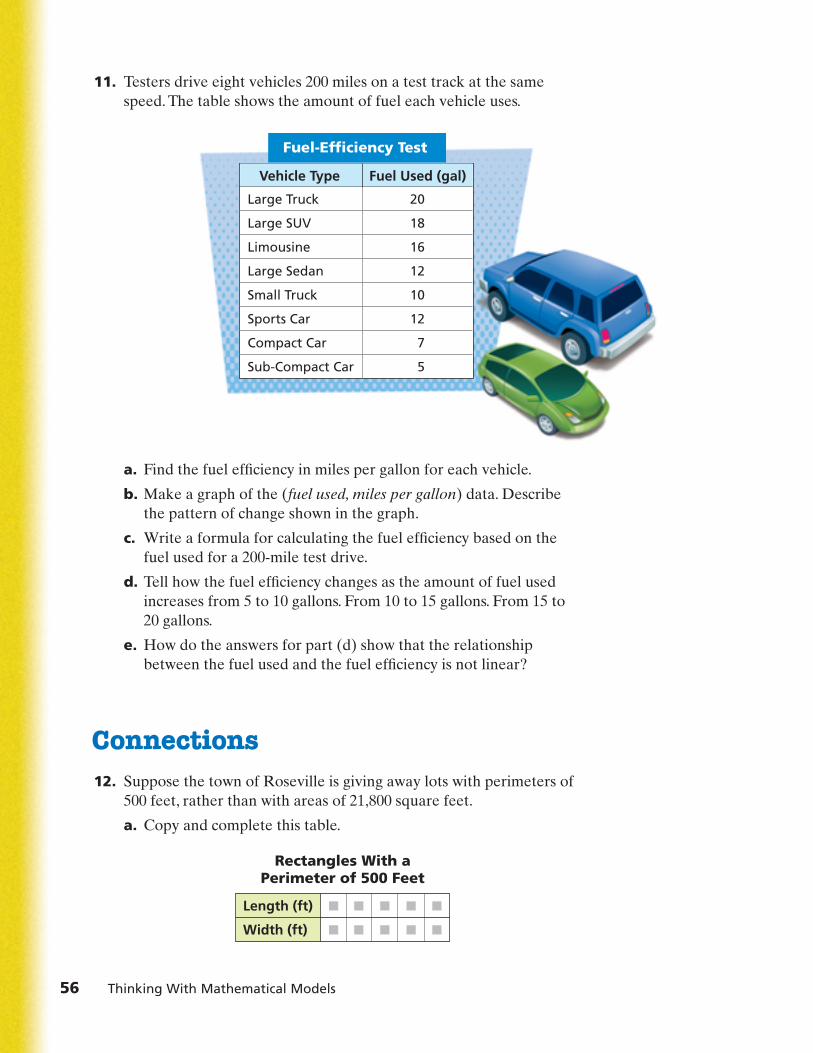
11. Testers drive eight vehicles 200 miles on a test track at the same speed. The table shows the amount of fuel each vehicle uses.
a. Find the fuel efficiency in miles per gallon for each vehicle.
b. Make a graph of the (fuel used, miles per gallon) data. Describe the pattern of change shown in the graph.
c. Write a formula for calculating the fuel efficiency based on the fuel used for a 200-mile test drive.
d. Tell how the fuel efficiency changes as the amount of fuel usedincreases from 5 to 10 gallons. From 10 to 15 gallons. From 15 to 20 gallons.
e. How do the answers for part (d) show that the relationship between the fuel used and the fuel efficiency is not linear?
Connections12. Suppose the town of Roseville is giving away lots with perimeters of
500 feet, rather than with areas of 21,800 square feet.
a. Copy and complete this table.
Length (ft)
Width (ft)
Rectangles With aPerimeter of 500 Feet
■
■
■
■
■
■
■
■
■
■
Fuel Used (gal)Vehicle Type
Large Truck
Large SUV
Limousine
Large Sedan
Small Truck
Sports Car
Compact Car
Sub-Compact Car
20
18
16
12
10
12
7
5
Fuel-Efficiency Test
56 Thinking With Mathematical Models
8cmp06se_TM3.qxd 6/8/06 9:56 AM Page 56
Investigation 3 Inverse Variation 57
b. Make a graph of the (length, width) data. Draw a line or curve thatmodels the data pattern.
c. Describe the pattern of change in width as length increases.
d. Write an equation for the relationship between length and width. Isthis a linear relationship? Explain.
A number b is the of the number a if a ± b ≠ 0.For example, –5 is the additive inverse of 5 because 5 ± (–5) ≠ 0.For Exercises 13–18, find the additive inverse of each number.
13. 2 14. 15. 2.5
16. -2.11 17. 18.
19. On a number line, graph each number in Exercises 13–18 and itsadditive inverse. Describe any patterns you see.
A number b is the of the number a if ab ≠ 1. For example, is the multiplicative inverse of because ≠ 1. ForExercises 20–25, find the multiplicative inverse of each number.
20. 2 21. -2 22. 0.5
23. 4 24. 25.
26. On a number line, graph each number in Exercises 20–25 and itsmultiplicative inverse. Describe any patterns you see.
Jamar takes a 10-point history quiz each week. Here are his scores on thefirst five quizzes: 8, 9, 6, 7, 10. Use this information for Exercises 27–28.
27. Multiple Choice What is Jamar’s average quiz score?
A. 6 B. 7
C. 8 D. 9
28. a. Jamar misses the next quiz and gets a 0.What is his average after six quizzes?
b. After 20 quizzes, Jamar’s average is 8.He gets a 0 on the 21st quiz. What is his average after 21 quizzes?
c. Why did a score of 0 have a different effect on the average when it was the sixth score than when it was the 21st score?
53
34
Q32RQ2
3R23
32
multiplicative inverse
37
73
2 62
additive inverse
For: Multiple-Choice Skills Practice
Web Code: apa-1354
8cmp06se_TM3.qxd 6/8/06 9:56 AM Page 57
29. Suppose a car travels at a speed of 60 miles per hour. The equation d = 60t represents the relationship between the time t in hours and the distance d driven in miles. This relationship is an example of adirect variation. A relationship between variables x and y is a directvariation if it can be expressed as y = kx, where k is a constant.
a. Find two relationships in this unit that are direct variations. Givethe equation for each relationship.
b. For each relationship from part (a), find the ratio of the dependentvariable to the independent variable. How is the ratio related to kin the general equation?
c. Suppose the relationship between x and y is a direct variation.How do y-values change as the x-values increase? How does thispattern of change appear in a graph of the relationship?
d. Compare direct variation and inverse variation. Be sure to discussthe graphs and equations for these types of relationships.
Solve the equation using a symbolic method. Then, describe how thesolution can be found by using a graph and a table.
30. 5x - 28 = -3 31. 10 - 3x = 7x - 10
For Exercises 32–34, find the equation of the line with the giveninformation.
32. slope y-intercept (0, 5)
33. slope 3, passes through the point (2, 2)
34. passes through the points (5, 2) and (1, 10)
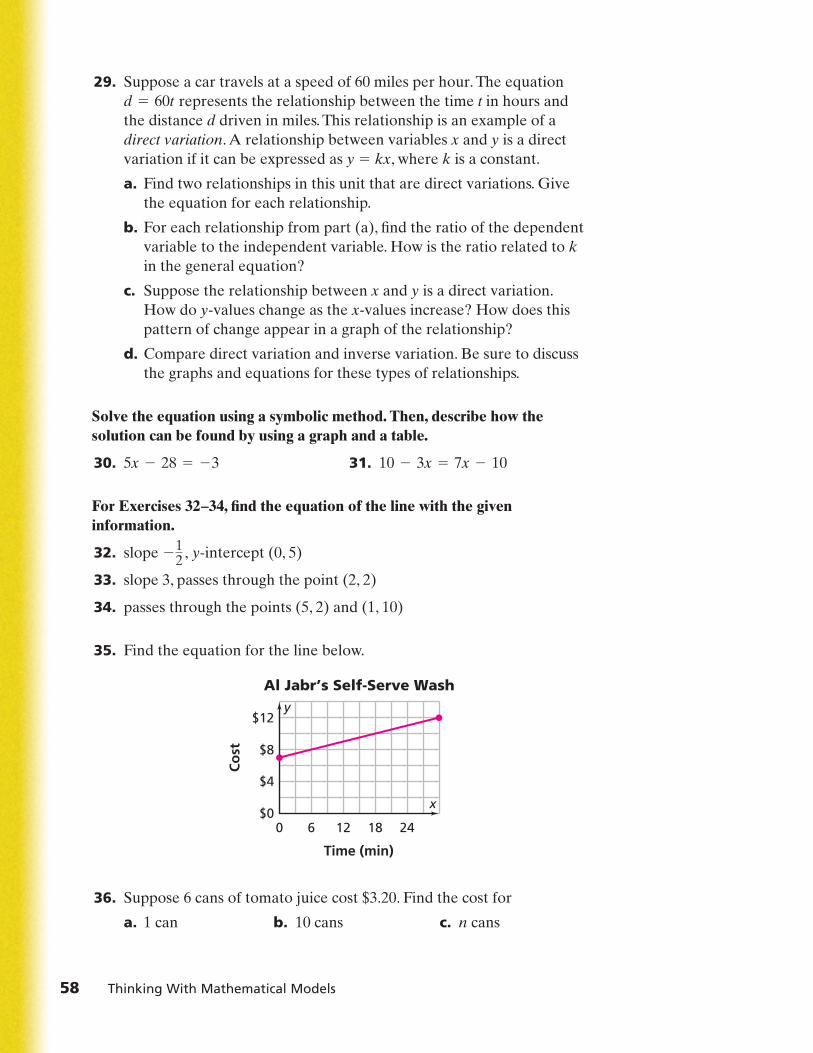
35. Find the equation for the line below.
36. Suppose 6 cans of tomato juice cost $3.20. Find the cost for
a. 1 can b. 10 cans c. n cans
Al Jabr’s Self-Serve Wash
24186 12
Time (min)
Co
st
0
$4
$0
$12
$8
y
x
2 12 ,
58 Thinking With Mathematical Models
8cmp06se_TM3.qxd 6/8/06 9:57 AM Page 58
Investigation 3 Inverse Variation 59
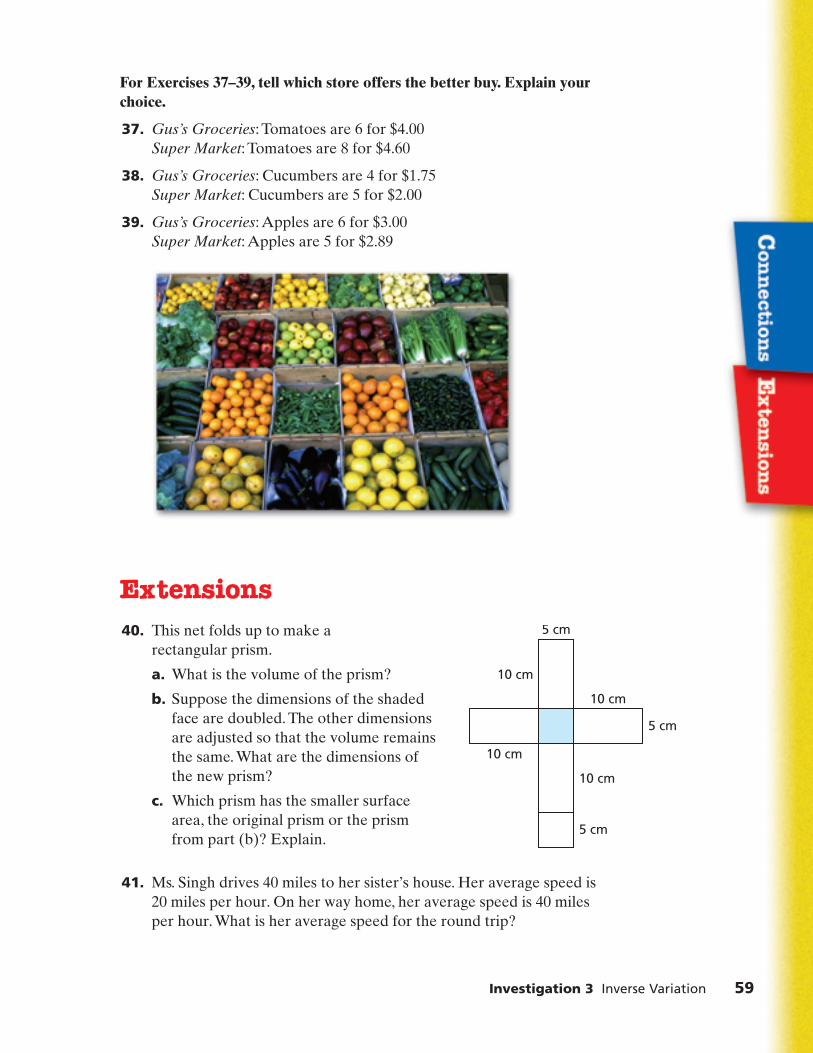
For Exercises 37–39, tell which store offers the better buy. Explain yourchoice.
37. Gus’s Groceries: Tomatoes are 6 for $4.00Super Market: Tomatoes are 8 for $4.60
38. Gus’s Groceries: Cucumbers are 4 for $1.75Super Market: Cucumbers are 5 for $2.00
39. Gus’s Groceries: Apples are 6 for $3.00Super Market: Apples are 5 for $2.89
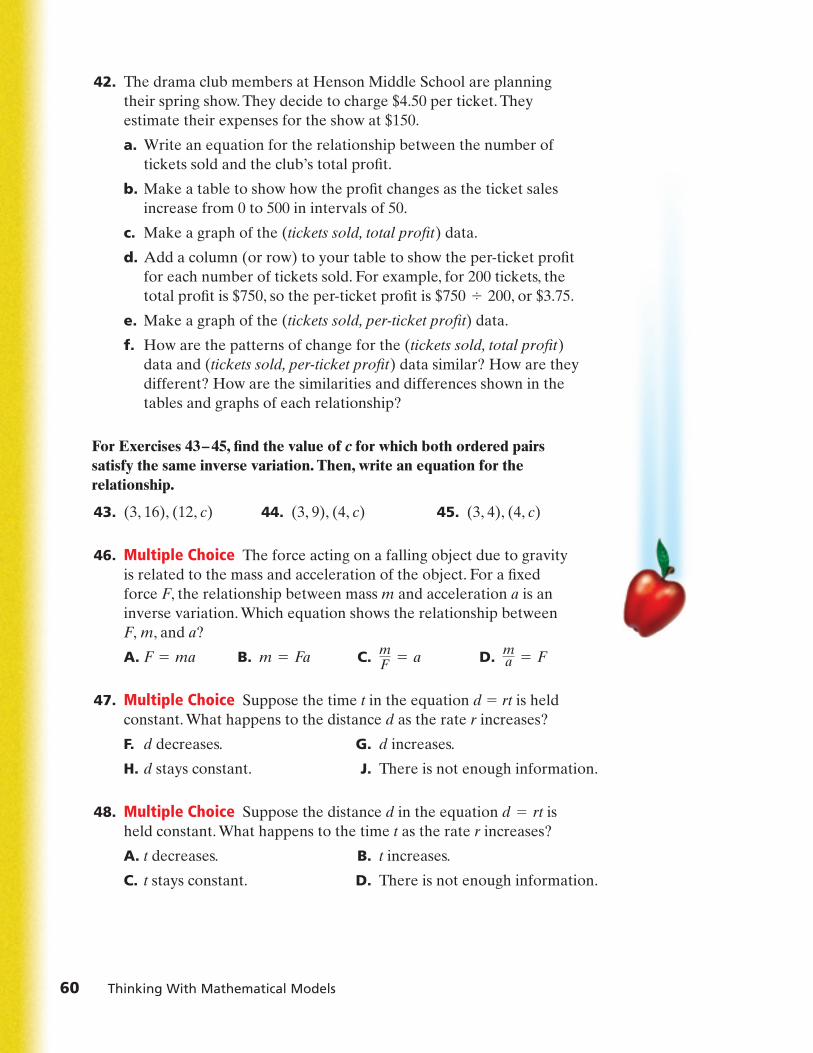
Extensions40. This net folds up to make a
rectangular prism.
a. What is the volume of the prism?
b. Suppose the dimensions of the shaded face are doubled. The other dimensions are adjusted so that the volume remains the same. What are the dimensions of the new prism?
c. Which prism has the smaller surface area, the original prism or the prism from part (b)? Explain.
41. Ms. Singh drives 40 miles to her sister’s house. Her average speed is 20 miles per hour. On her way home, her average speed is 40 miles per hour. What is her average speed for the round trip?
5 cm
5 cm
5 cm
10 cm
10 cm
10 cm
10 cm
8cmp06se_TM3.qxd 6/8/06 9:57 AM Page 59
42. The drama club members at Henson Middle School are planning their spring show. They decide to charge $4.50 per ticket. They estimate their expenses for the show at $150.
a. Write an equation for the relationship between the number oftickets sold and the club’s total profit.
b. Make a table to show how the profit changes as the ticket salesincrease from 0 to 500 in intervals of 50.
c. Make a graph of the (tickets sold, total profit) data.
d. Add a column (or row) to your table to show the per-ticket profitfor each number of tickets sold. For example, for 200 tickets, thetotal profit is $750, so the per-ticket profit is $750 4 200, or $3.75.
e. Make a graph of the (tickets sold, per-ticket profit) data.
f. How are the patterns of change for the (tickets sold, total profit)data and (tickets sold, per-ticket profit) data similar? How are theydifferent? How are the similarities and differences shown in thetables and graphs of each relationship?
For Exercises 43–45, find the value of c for which both ordered pairs satisfy the same inverse variation. Then, write an equation for therelationship.
43. (3, 16), (12, c) 44. (3, 9), (4, c) 45. (3, 4), (4, c)
46. Multiple Choice The force acting on a falling object due to gravity is related to the mass and acceleration of the object. For a fixed force F, the relationship between mass m and acceleration a is aninverse variation. Which equation shows the relationship between F, m, and a?
A. F = ma B. m = Fa C. = a D. = F
47. Multiple Choice Suppose the time t in the equation d = rt is heldconstant. What happens to the distance d as the rate r increases?
F. d decreases. G. d increases.
H. d stays constant. J. There is not enough information.
48. Multiple Choice Suppose the distance d in the equation d = rt is held constant. What happens to the time t as the rate r increases?
A. t decreases. B. t increases.
C. t stays constant. D. There is not enough information.
ma
mF
60 Thinking With Mathematical Models
8cmp06se_TM3.qxd 6/8/06 9:57 AM Page 60