Embed Size (px)
Citation preview

Mike Canney
Application Performance Analysis
1
Welcome to Sharkfest ‘12
Mike Canney, Principal Network Analyst, Tektivity, Inc.
[email protected] 319-365-3336
www.getpackets.com
2
con
tact
Agenda
• So why focus on the application? • Creating a CDA (Capture to Disk Appliance) • Using Pilot for “back in time” troubleshooting with your
CDA and Wireshark • Application QA Lifecycle • Top Causes for Application Performance issues
– Application Turns – TCP – Layer 7 Issues – TCP Retransmissions
• Using Wireshark to create custom profiles to troubleshoot CIFS/SMB
3
agen
da

So why focus on the Application?
• In many cases it is the Network Engineers that have the tool set to help pinpoint where the problem exists.
• “It’s not the Network!” - The Network is guilty until proven innocent.
• Application performance issues can impact your business/customers ability to make money.
• User Response time is “Relative”. • Intermittent performance issues (moving
target).
4
focu
s
The “moving target”
• Analyzer placement - Two options – Move the analyzers as needed – Capture anywhere and everywhere
• To defend the Network multiple capture points of the problem is the best solution.
5
targ
et

Commercial vs. Free Capture
• Define your capture strategy – Data Rates – What are my goals? Troubleshooting vs.
Statistical information. – Do I need to capture every packet?
6
cap
ture
Capture to Disk Appliance (on a budget)
• What is needed? – dumpcap is a command line utility included
with the Wireshark download to enable ring buffer captures.
– Use an inexpensive PC or laptop (best to have 2 NICs or more).
– Basic batch file to initiate capture. – Cascade Pilot (optional but recommended)
7
bu
dg
et
Dumpcap Example
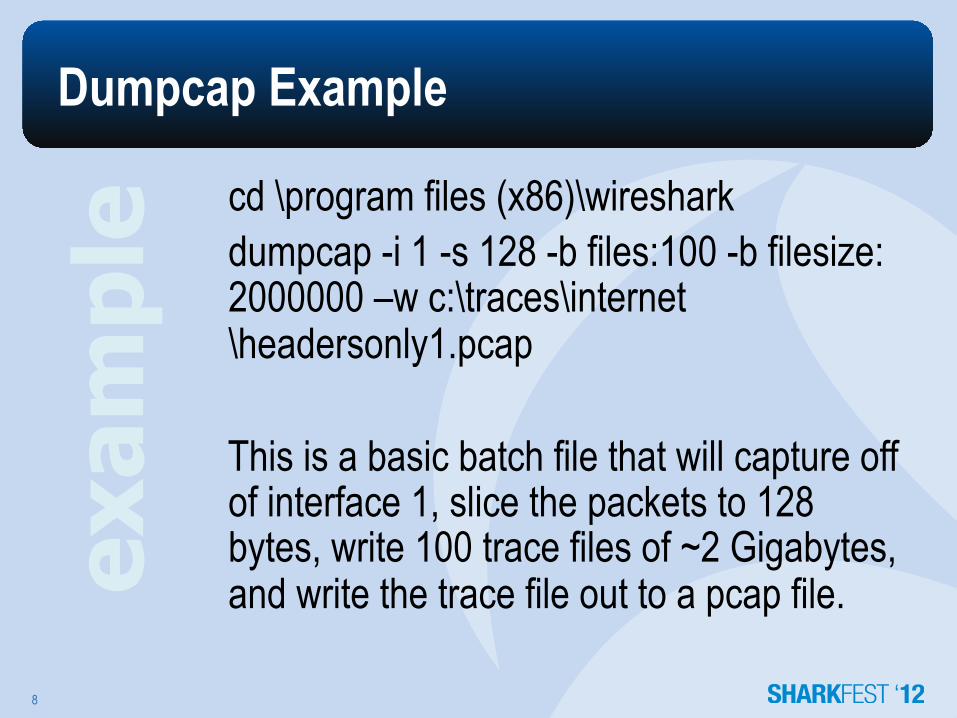
cd \program files (x86)\wireshark dumpcap -i 1 -s 128 -b files:100 -b filesize:2000000 –w c:\traces\internet\headersonly1.pcap
This is a basic batch file that will capture off of interface 1, slice the packets to 128 bytes, write 100 trace files of ~2 Gigabytes, and write the trace file out to a pcap file.
8
exam
ple
So why did I write multiple 2 Gig trace files?
• Pilot! • Pilot can easily read HUGE trace files. • This allows us to utilize our CDA in ways
no other analyzer can. • I personally have sliced and diced 50 GB
trace files in Pilot in a matter of seconds.
9
trac
e fi
le
So how does this all work together?
• Directory full of 2GB trace files, all time stamped based on when they were written to disk.
• User calls in and complains that “the network” is slow.
• Locate that trace file based on time and date and launch Pilot.
10
pra
ctic
e
Instructor Demo
Troubleshooting user “Network Issue”
11
dem
o
Think about the possibilities…
• From a multix GB trace file we were able to: – Look at the total Network throughput. – See what applications were consuming the
bandwidth. – Identify the user that was responsible for consuming
the bandwidth. – Identify the URI’s the user was hitting and what the
response times were. – Drill down to the packets involved in the slow web
response time in Wireshark. • All in a matter of a few seconds.
12
hm
mm

Why are there so many application issues?
• Applications are typically developed in a “golden” environment – Fastest PCs – High Bandwidth/low latency
• When applications move from test (LAN) to production (WAN) the phone starts ringing with complaints coming in.
13
hel
p
The Application QA Lifecycle
• In most organizations, applications go through a QA process
• Typical QA/App developers test the following: – Functional tests – Regression tests – Stress tests (server) – Rinse and Repeat
• What is often missing is “Networkability” testing • All QA Lifecycles should include Networkability
testing
14
qa
cycl
e

Application Networkablility Testing
• Identify key business transactions, number of users and network conditions the application will be deployed in.
• Simulation vs. Emulation – Simulation is very quick, often gives you rough
numbers of how an application will perform over different network conditions.
– Emulation is the only way to determine when an application will “fail” under those conditions.
• A Combination of both is recommended.
15
test
ing

Top Causes for Poor Application Performance
• Application Turns • TCP • Layer 7 Bottlenecks • Congestion (network) • Processing Delay
16
top
5
Causes for Slow Application Performance
Application Turns
17
turn
s

Application Turns
• An Application Turn is a request/response pair
• For each “turn” the application must wait the full round trip delay.
• The greater the number of turns, the worse the application will perform over a WAN (latency bound).
18
turn
s

App Turn
19
Begin
End

Example in Wireshark
20
Display Filter:
882 Application Turns in this trace

App Turns and Latency
• It is fairly easy to determine App Turns impact on end user response time – Multiply the number of App Turns by the
round trip delay: • 10,000 turns * .050 ms delay = 500 seconds due
to latency
• Note, this has nothing to do with Bandwidth or the Size of the WAN Circuit
21
late
ncy
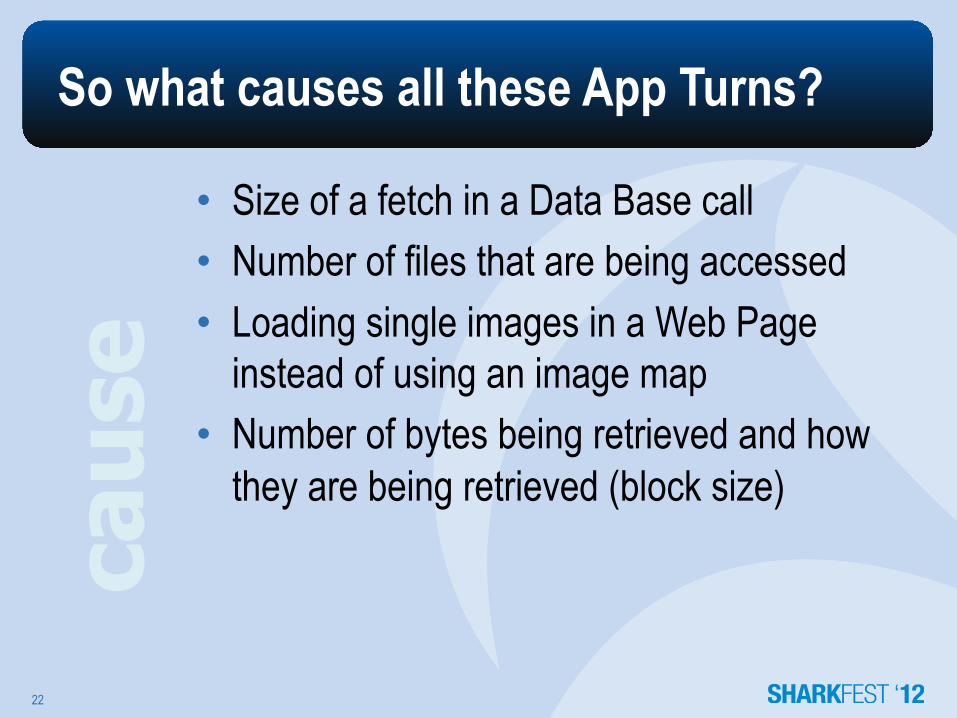
So what causes all these App Turns?
• Size of a fetch in a Data Base call • Number of files that are being accessed • Loading single images in a Web Page
instead of using an image map • Number of bytes being retrieved and how
they are being retrieved (block size)
22
cau
se
Causes for Slow Application Performace
TCP
23
tcp

TCP Window Size
• The TCP Window Size defines the host’s receive buffer.
• Large Window Sizes can sometimes help overcome the impact of latency.
• Depending on how the application was written, advertised TCP Window Size may not have an impact at all (more on this later).
24
size

TCP Inflight Data
• The amount of unacknowledged TCP data that is on the wire at any given time.
• TCP inflight data in limited by the following: – TCP Retransmissions – TCP Window Size – Application block size
• The amount of TCP inflight data will never exceed the receiving devices advertised TCP Window Size.
25
infl
igh
t

TCP Inflight Data in Wireshark
26
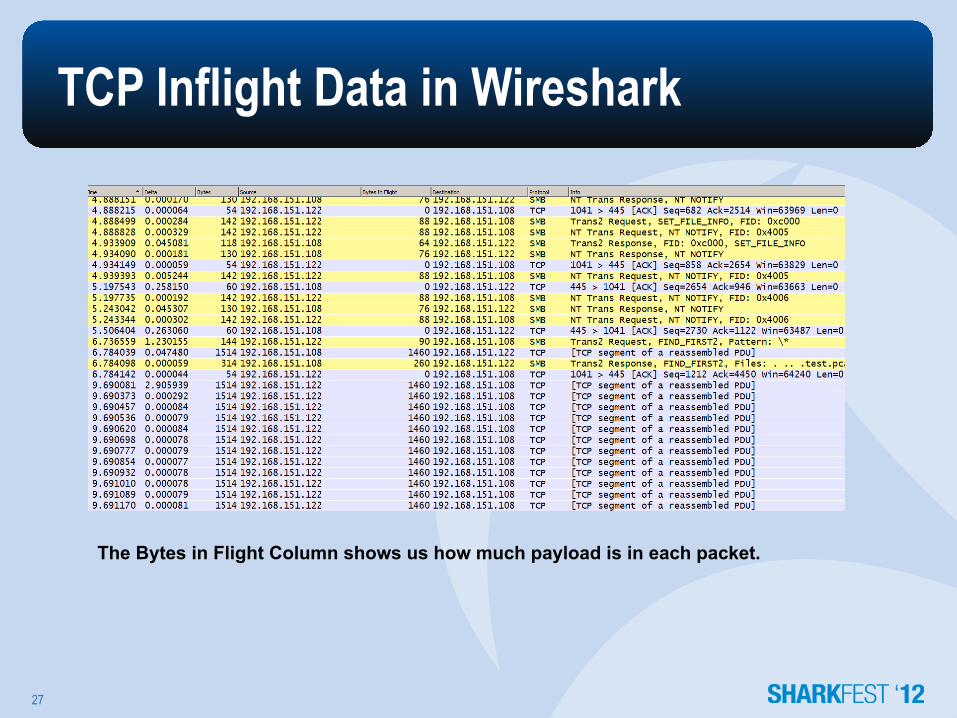
TCP Inflight Data in Wireshark
27
The Bytes in Flight Column shows us how much payload is in each packet.
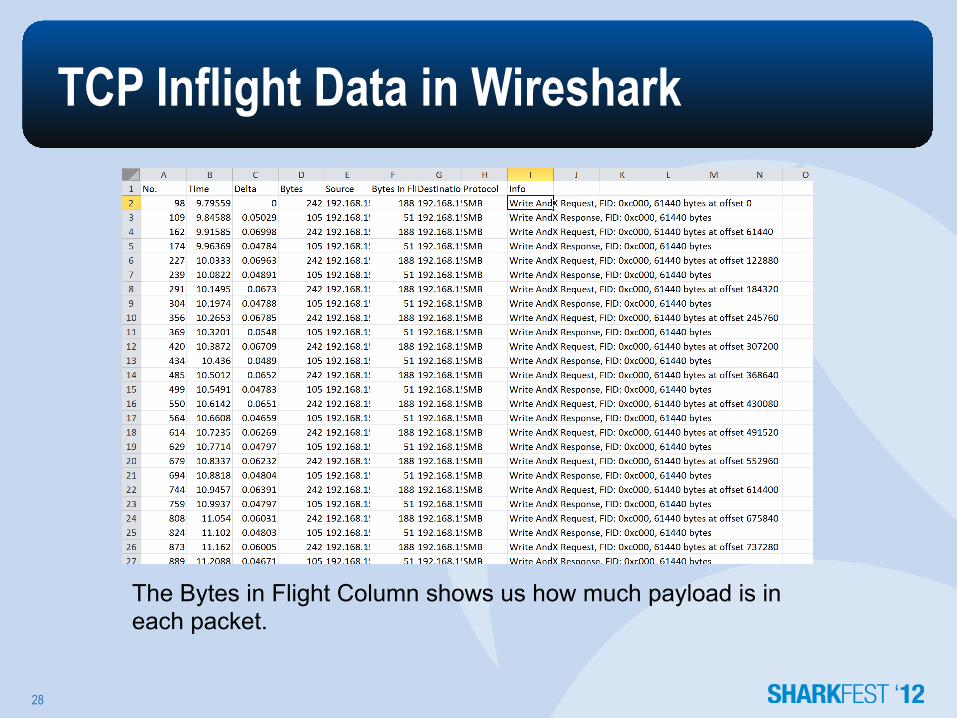
TCP Inflight Data in Wireshark
28
The Bytes in Flight Column shows us how much payload is in each packet.
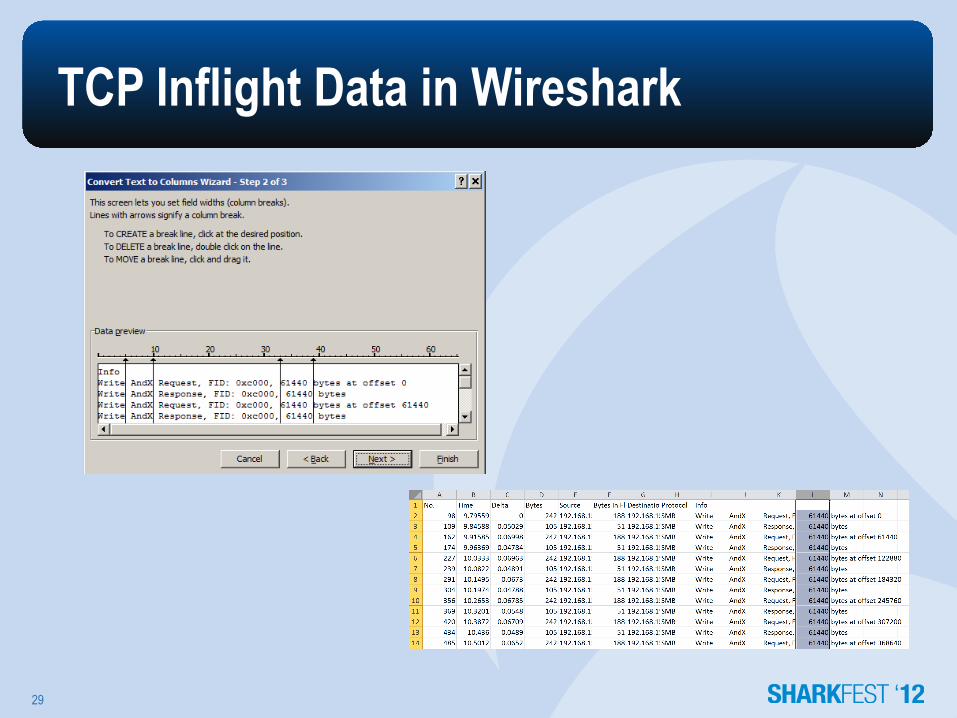
TCP Inflight Data in Wireshark
29

TCP Inflight Data in Wireshark
30
Graphed in Excel

Easier way for SMB/CIFS
31
TCP Retransmissions
• Every time a TCP segment is sent, a retransmission timer is started.
• When the Acknowledgement for that segment is received the timer is stopped.
• If the retransmission timer expires before the Acknowledgement is received, the TCP segment is retransmitted.
32
tcp
TCP Retransmissions
• Excessive TCP Retransmissions can have a huge impact on application performance.
• Not only does the data have to get resent,
but TCP flow control (Slow Start) kicks into action.
33
tcp
flo
w
Application Performance
Layer 7 Bottlenecks
34
dem
o

ULPs (upper layer protocols) • TCP often gets blamed for the ULPs problem.
– The application hands down to TCP amount of data to go retrieve (application block size)
– TCP then is responsible for reliably getting that data back to the application layer
• TCP has certain parameters in which to work with and can usually be tuned based on bandwidth and latency
• Many times too much focus is put on “tuning” TCP as the fix for poor performance in the network
• If the TCP advertised receive window is set to 64K and the application is
only handing down to TCP requests for 16K, where is the bottleneck?
35
ulp

ULPs (upper layer protocols)
Case in point: CIFS/SMB
36
ulp

Troubleshooting CIFS/SMB
• Arguably the most common File Transfer method used in businesses today.
• SMB was NOT developed with the WAN in mind.
• One of the most “chatty” protocols/applications I run into (with the exception of poorly written SQL).
37
Cif
s/sm
b
CIFS/SMB Quiz
• What is faster using MS File Sharing? – Pushing a file to a file server? – Pulling a file from a file server?
38
qu
iz
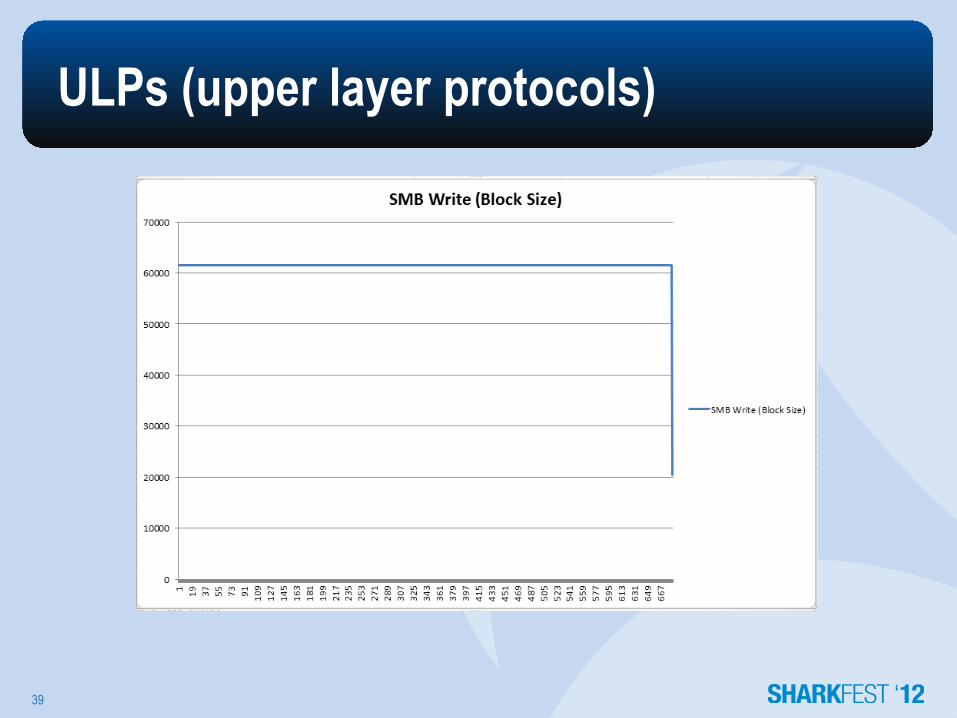
ULPs (upper layer protocols)
39
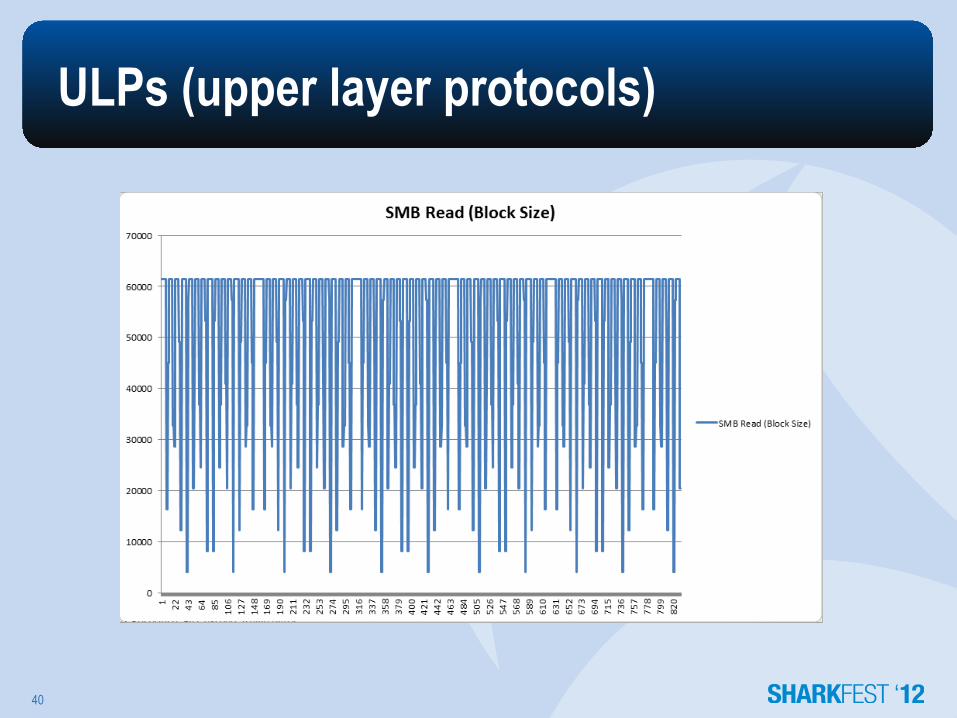
ULPs (upper layer protocols)
40
CIFS/SMB
• What is faster using MS File Sharing? – Pushing a file to a file server? – Pulling a file from a file server?
• SMB Write (Pushing the file) can almost be 2X as fast as pulling (SMB Read)
• Depends on the Latency
41
cifs
/sm
b
CIFS/SMB Tuning
• SMB Maximum Transmit Buffer Size – Negotiated MaxBufferSize in the Negotiate
Protocol response – Default for Windows servers is typically
16644 (dependent upon physical memory) – Client default typically 4356
42
tun
ing
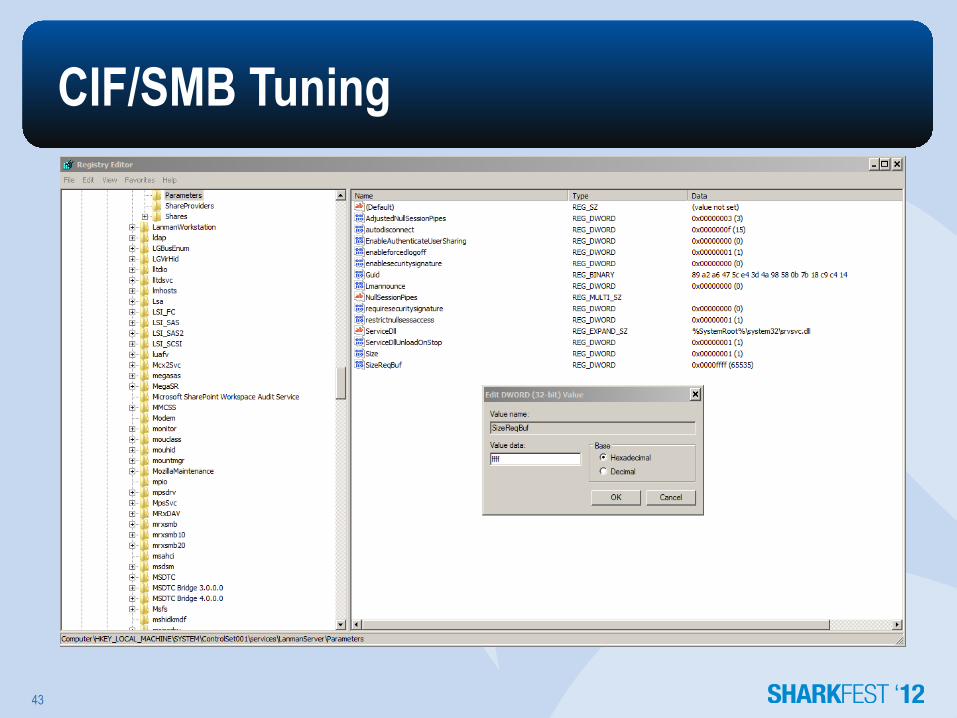
CIF/SMB Tuning
43
CIFS/SMB Tuning
• Caveat: – SMB is extremely dependent upon the API
• Even though you set the max buffer size to 64K, windows “share” data will always get truncated to 60K (61440) even though the server can support 64K
44
tun
ing

CIFS/SMB Tuning
• Custom SMB APIs
– The Windows limitation can be exceeded by programs written to use SMB as they file transfer protocol
45
tun
ing

CIFS/SMB Tuning
46
Note the SMB writes of 65,536 This is a file transfer using a custom API on a Windows XP machine

CIFS/SMB Tuning (Preallocation)
47
Prealloca:on sets the file info for SMB Writes and can dras:cally reduce some of the “cha@yness” of SMB
Instructor Demo of SMB Profiles
Demo of SMB Tracefiles
48
dem
o
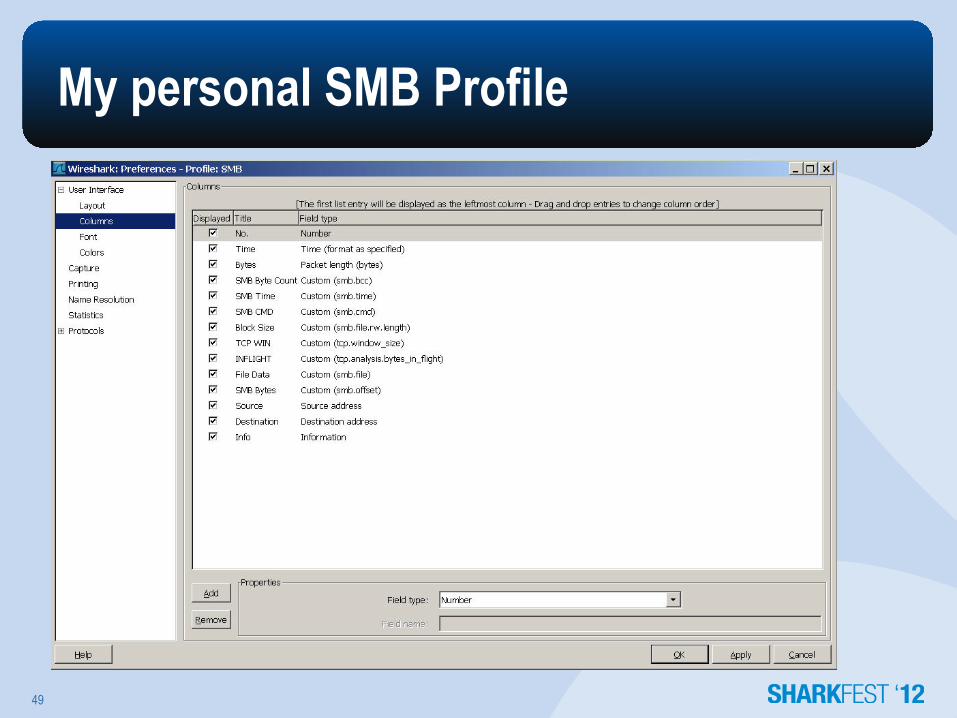
My personal SMB Profile
49

Take Away Points
• Building your own CDA is easy to do and may fit in a majority of the areas you need to capture from
• Pilot, Pilot, Pilot, it’s not just a fancy reporting engine for Wireshark!
• Test your applications “Networkability” before they hit production.
• Use the Wireshark Profiles, they will save you a ton of time.
50
po
ints
Mike Canney
Principal Network Analyst
51