Embed Size (px)
Citation preview

Potsdam Institute for Climate Impact ResearchResearch Domain Sustainable Solutions
Application of the new scenario approach in the ReMIND-MAgPIEintegrated assessment framework
Elmar Kriegler, Alexander Popp, David KleinLena Reuster, Jana Schwanitz, Nico Bauer
Gunnar Luderer, Marian Leimbach, Franziska PiontekWorkshop on new SMA/ SSP approach
16-17 July 2011, Changwon, Korea

Elmar KrieglerPotsdam Institute for Climate Impact Research
OverviewOverview
1. An overview of ReMIND-MAgPIE model capabilities
2. Which narrative to choose?
3. Tentative implementation of narratives in ReMIND-MAgPIE
4. SSP1 vs. SSP5: An example from EMF24
5. Outlook

Elmar KrieglerPotsdam Institute for Climate Impact Research 3
Welfare
LabourCapital
Energy system costs
Output
ConsumptionInvestments
Final energy
Energy transformations and conversion technologies
Fuelcosts
Investment costs
Operation and Maintenance
costs
Labourefficiency Emissions
Learningby doing
Ressource and potential
constraints
Macro Economy
Energy system
Exogenous Data
Energy efficiency
Trade
Trade
Trade
Climatemodule
Quick Quick introductionintroduction to to thethe modelsmodels: : ReMINDReMIND
Leimbach,Bauer, Baumstark, Edenhofer, O. (2009)

Elmar KrieglerPotsdam Institute for Climate Impact Research
ReMIND regions
USA - USA EUR - EU27 JAP - Japan CHN - China IND - India RUS - Russia AFR - Sub-Saharan Africa (excl. Republic of South Africa) MEA - Middle East, North Africa, central Asian countriesOAS - Other Asia (mostly South East Asia)LAM - Latin America ROW - Rest of the World (Canada, Australia, New Zealand, Republic of South Africa, Rest of Europe).
Quick Quick introductionintroduction to to thethe modelsmodels usedused: : ReMINDReMIND
Elmar KrieglerPotsdam Institute for Climate Impact Research
Cereals
Oilseeds
Pulses
Sugarbeets
Crop yieldsLand & Water constraints
+200 mm-200 -100 0 +100
CCSR
ECHAM4
Climate
LPJ (50x50 km grid)
Biophysical inputs
Income vs. Food consumption
0
500
1000
1500
2000
2500
3000
3500
4000
0 5000 10000 15000 20000 25000 30000 35000 40000
GDP / Cap / Year
Kca
l / C
ap /
Day
kcal_cap (105 countries, 1990/2000) kcal_cap (fitted values)
kcal = 802 * gdp^(0.142327) [R^2 = 0.66]
0
2
4
6
8
10
12
14
16
1900 1920 1940 1960 1980 2000 2020 2040 2060 2080 2100
Bill
ion
Low fertility, low mortality High fertility, high mortality Central fertility, central mortality (Lutz et al. 2001)
Demography
Income and diet
Food demand, production costs
Socioeconomicinputs
MAgPIEMAgPIE – a global land use optimisation model• spatially explicit (0.5°), 10 economic regions• 30 production activities (13 crops, livestock,
irrigation, bioenergy, land conversion)• internal feed balances, international trade• endogenous land expansion• endogenous technological change
Bioenergy
Lotze-Campen , Popp et al. (2008), Agricultural Economics

Elmar KrieglerPotsdam Institute for Climate Impact Research
Land
use
dyna
mic
s
Income vs. Food consumption
0
500
1000
1500
2000
2500
3000
3500
4000
0 5000 10000 15000 20000 25000 30000 35000 40000
GDP / Cap / Year
Kca
l / C
ap /
Day
kcal_cap (105 countries, 1990/2000) kcal_cap (fitted values)
kcal = 802 * gdp^(0.142327) [R^2 = 0.66]
0
2
4
6
8
10
12
14
16
1900 1920 1940 1960 1980 2000 2020 2040 2060 2080 2100
Bill
ion
Low fertility, low mortality High fertility, high mortality Central fertility, central mortality (Lutz et al. 2001)
Cereals
Oilseeds
Pulses
Sugarbeets
Crop yieldsLand & Water constraints
+200 mm-200 -100 0 +100
CCSR
ECHAM4
Climate change (GCM)Demography
Income and diet
Food demand, production costs
LPJ (50x50 km grid)
Biophysical inputs
Socioeconomicinputs
Bioenergy
Lotze-Campen et al. (2008), Agricultural Economics
Land usepattern
2035

Elmar KrieglerPotsdam Institute for Climate Impact Research
Income vs. Food consumption
0
500
1000
1500
2000
2500
3000
3500
4000
0 5000 10000 15000 20000 25000 30000 35000 40000
GDP / Cap / Year
Kca
l / C
ap /
Day
kcal_cap (105 countries, 1990/2000) kcal_cap (fitted values)
kcal = 802 * gdp^(0.142327) [R^2 = 0.66]
0
2
4
6
8
10
12
14
16
1900 1920 1940 1960 1980 2000 2020 2040 2060 2080 2100
Bill
ion
Low fertility, low mortality High fertility, high mortality Central fertility, central mortality (Lutz et al. 2001)
+200 mm-200 -100 0 +100
CCSR
ECHAM4
Climate change (GCM)Demography
Income and diet
Food demand, production costs
Biophysical inputs
Socioeconomicinputs
Lotze-Campen and Popp, World Development Report 2010
Cereals
Oilseeds
Pulses
Sugarbeets
Crop yieldsLand & Water constraints
LPJ (50x50 km grid)
Bioenergy

Elmar KrieglerPotsdam Institute for Climate Impact Research
Income vs. Food consumption
0
500
1000
1500
2000
2500
3000
3500
4000
0 5000 10000 15000 20000 25000 30000 35000 40000
GDP / Cap / Year
Kca
l / C
ap /
Day
kcal_cap (105 countries, 1990/2000) kcal_cap (fitted values)
kcal = 802 * gdp^(0.142327) [R^2 = 0.66]
0
2
4
6
8
10
12
14
16
1900 1920 1940 1960 1980 2000 2020 2040 2060 2080 2100
Bill
ion
Low fertility, low mortality High fertility, high mortality Central fertility, central mortality (Lutz et al. 2001)
+200 mm-200 -100 0 +100
CCSR
ECHAM4
Climate change (GCM)Demography
Income and diet
Food demand, production costs
Biophysical inputs
Socioeconomicinputs
Popp et al. 2010, GEC
Cereals
Oilseeds
Pulses
Sugarbeets
Crop yieldsLand & Water constraints
LPJ (50x50 km grid)
Bioenergy
2055 Agricultural N2O [Mt CO2-e]

Elmar KrieglerPotsdam Institute for Climate Impact Research
InfluenceInfluence of of dietsdietsCombinationCombination
A – Pop. growth & diet shifts B – Less livestock productsC – Technological mitigation D – Combination of B & C
Elmar KrieglerPotsdam Institute for Climate Impact Research
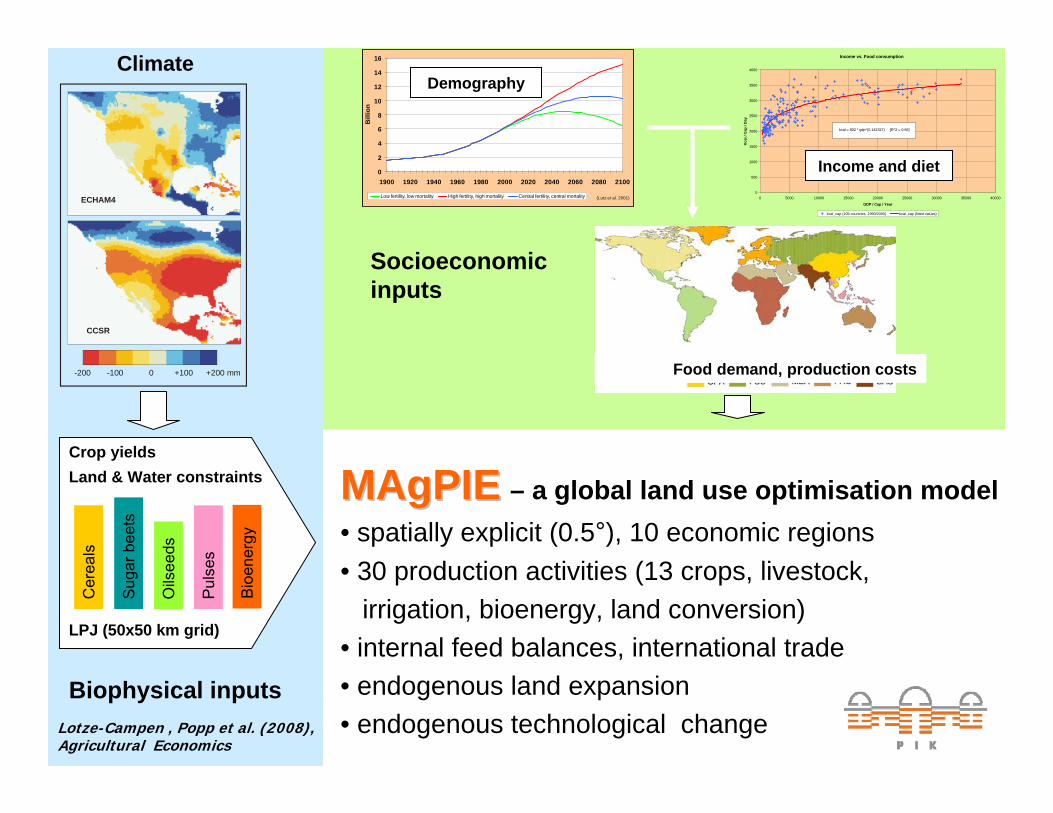
Bondeau et al. 2007, GCB
Input: climate, CO2, soil, land-use
Naturalvegetation
Managedgrasland
Cropland
LPJmL

Elmar KrieglerPotsdam Institute for Climate Impact Research
Agricultural yields Carbon content
Run-off
Müller, Bondeau, Popp et al. WDR 2010
Bondeau et al. 2006, GCB
Füssel, Popp, Heinke (2010)
Gumpenberg, Popp et al. 2010, ERL
LPJmL

Elmar KrieglerPotsdam Institute for Climate Impact Research
Model Model couplingcoupling
Objective: Model framework to explore potential contribution of bioenergyto climate change mitigation, including its costs and trade-offs
LPJmL - global vegetation and hydrology model
MAgPIE - global land use optimization model
REMIND- global energy-economy-climate model

Elmar KrieglerPotsdam Institute for Climate Impact Research
WhichWhich storylinesstorylines to to choosechoose??

Elmar KrieglerPotsdam Institute for Climate Impact Research
WhichWhich storylinesstorylines to to choosechoose??
Increasing socio-economic adaptation challenges
Incr
easi
ngso
cio-
econ
omic
miti
gatio
nch
alle
nges
SSP 5Coal & gaspoweredgrowth
SSP 1Sustainabledevelopment
SSP 3Fragmented
world
SSP 4Divided in rich & poor
SSP 2
Elmar KrieglerPotsdam Institute for Climate Impact Research
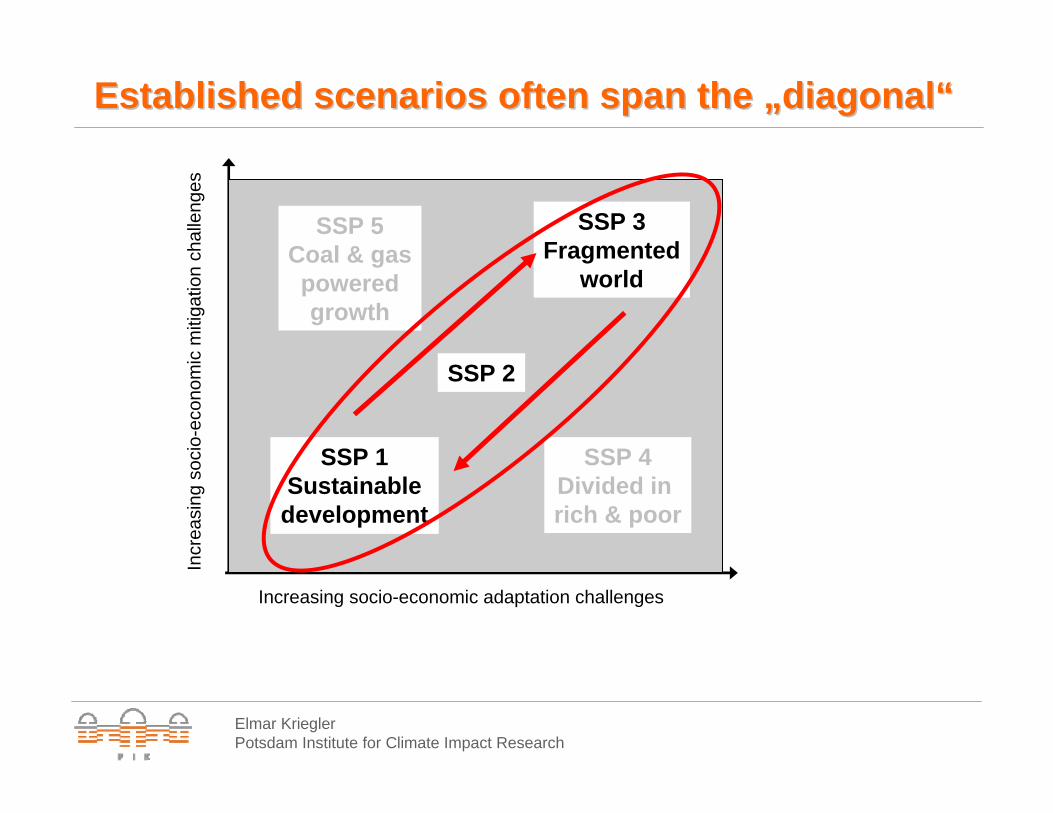
EstablishedEstablished scenariosscenarios oftenoften spanspan thethe „„diagonaldiagonal““
Increasing socio-economic adaptation challenges
Incr
easi
ngso
cio-
econ
omic
miti
gatio
nch
alle
nges
SSP 5Coal & gaspoweredgrowth
SSP 1Sustainabledevelopment
SSP 3Fragmented
world
SSP 4Divided in rich & poor
SSP 2

Elmar KrieglerPotsdam Institute for Climate Impact Research
OffOff--diagonal diagonal scenariosscenarios far far lessless consideredconsidered
Increasing socio-economic adaptation challenges
Incr
easi
ngso
cio-
econ
omic
miti
gatio
nch
alle
nges
SSP 5Coal & gaspoweredgrowth
SSP 1Sustainabledevelopment
SSP 3Fragmented
world
SSP 4Divided inrich & poor
SSP 2
Elmar KrieglerPotsdam Institute for Climate Impact Research
TentativeTentative implementationimplementation of of
narratives in narratives in ReMINDReMIND and and MAgPIEMAgPIE

Elmar KrieglerPotsdam Institute for Climate Impact Research
ContrastingContrasting SSPsSSPs: High : High vsvs lowlow adaptive adaptive capacitycapacity
High adapativecapacity
Low adapativecapacity
Increasing socio-economic adaptation challenges
Incr
easi
ngso
cio-
econ
omic
miti
gatio
nch
alle
nges
SSP 5
SSP 1
SSP 3
SSP 4

Elmar KrieglerPotsdam Institute for Climate Impact Research
High adaptative capacity
• low to medium populationgrowth
• well-functioning markets and institutions
• globalized and cooperativeworld
• High inter-/ intraregional convergence
• rapid technological progress
Low adaptative capacity
• high population growth
• distorted markets and institutions
• fragmented world prone to conflicts
• Low inter-/ intraregional convergence
• slow technological progress
ContrastingContrasting SSPsSSPs: High : High vsvs lowlow adaptive adaptive capacitycapacity
Narrative matches ReMINDdefault assumptions

Elmar KrieglerPotsdam Institute for Climate Impact Research
HowHow to to differentiatedifferentiate betweenbetween thethe twotwo verticalsverticals
• Low exogenous populationscenario
• High exogenous labourproductivity with fast convergence betweenregions
• free capital and commoditytrade
• technology spill-overs• Convergence of energy
service and food demand
• High exogenous populationscenario
• Low exogenous labourproductivity with slowconvergence betweenregions
• regionally differentiated trade costs and capital taxesreducing the rate of return on capital, import / export quotas on capital and commodities
• No technology spill-overs• Persisting regional
differences in energy serviceand food demand
High adapative capacity Low adapative capacity
Increasing socio-economic adaptation challenges
Incr
easi
ngso
cio-
econ
omic
miti
gatio
nch
alle
nges
Elmar KrieglerPotsdam Institute for Climate Impact Research
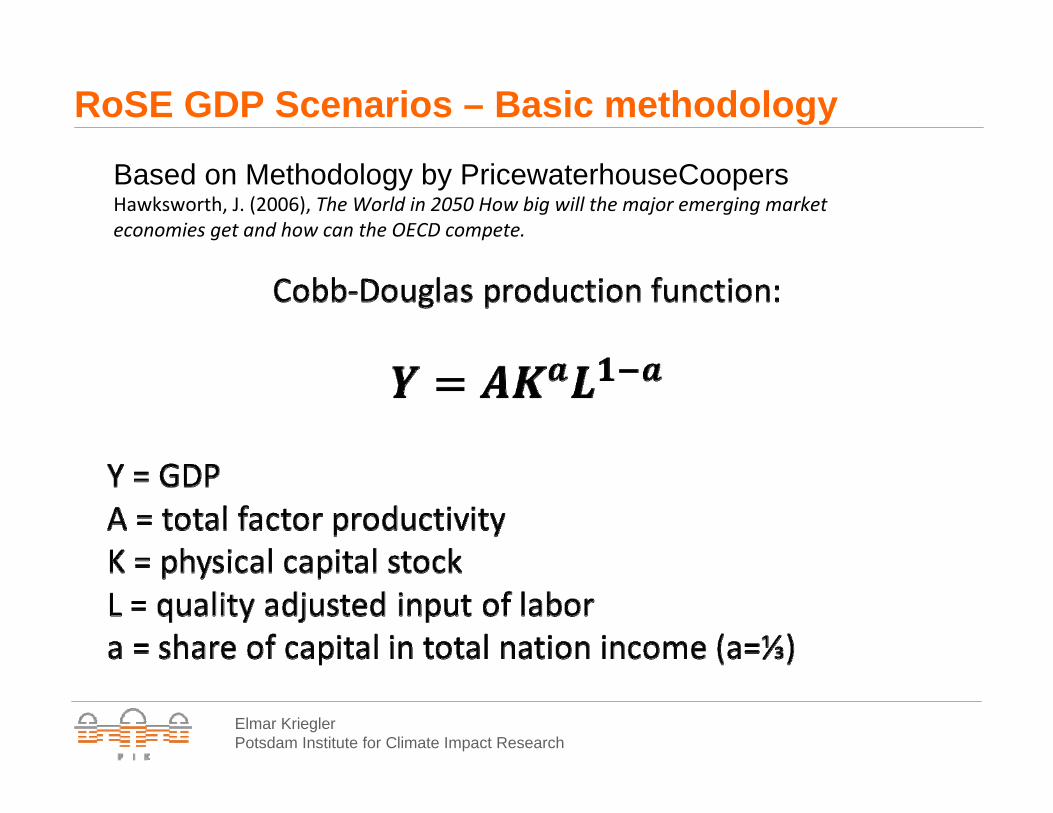
RoSE GDP Scenarios – Basic methodology
Based on Methodology by PricewaterhouseCoopersHawksworth, J. (2006), The World in 2050 How big will the major emerging market economies get and how can the OECD compete.

Elmar KrieglerPotsdam Institute for Climate Impact Research
Quality adjusted input of labor
L = h(s) ( e1N(15-64 yr) + e2N(65+ yr) )s = average years of school (data from Barro and Lee, 2001; Scenario after 2010)
e1 = labor particapation rate working age population (Varies from 55% –75% across regions. Cultural factors dominating? Assumed constant after 2010) e2 = labor participation rate of population 65+ years old(Varies from 3% – 50% across regions. Dominated by per capita income. 3%-20% in developed countries. Scenario assumed after 2010)

Elmar KrieglerPotsdam Institute for Climate Impact Research
RoSE GDP per capita scenarios - World
Preliminary results

Elmar KrieglerPotsdam Institute for Climate Impact Research
RoSE GDP per capita scenarios - China
Preliminary results

Elmar KrieglerPotsdam Institute for Climate Impact Research
ContrastingContrasting narratives: SSP1 vs. SSP5narratives: SSP1 vs. SSP5
Low mitigative capacity
High mitigative capacity
Incr
easi
ngso
cio-
econ
omic
miti
gatio
nch
alle
nges
Increasing socio-economic adaptation challenges
SSP 5
SSP 1

Elmar KrieglerPotsdam Institute for Climate Impact Research
ContrastingContrasting narratives: SSP1 vs. SSP5narratives: SSP1 vs. SSP5
SSP 1• Environment: lifecycle
perspective and closed-loop industries, high external costs of fossil energy, fossil fuel availability limited
• Technology: rapid technological progress on RE, high TC in agricultural sector
• Behaviour: sustainableconsumption patterns
SSP 5• Environment: problem-oriented
environmental regulation (end-of pipe approach), external costs of fossil fuels well controlled, gasification world, NIMBY perpective with RE
• Technology: strong reliance on fossil fuels, broad access to cheap fossil energy, maximizationof resource extraction
• Behaviour: energy intensive consumption patterns (buildings, cars,…), meat rich diet

Elmar KrieglerPotsdam Institute for Climate Impact Research
HowHow to to differentiatedifferentiate betweenbetween thethe twotwo horizontalshorizontals
Low mitigativecapacity
High mitigativecapacity
Incr
easi
ngso
cio-
econ
omic
miti
gatio
nch
alle
nges
Increasing socio-economic adaptation challenges
• large fossil fuel availability, no fossil resource extractionconstraints
• high energy intensity/ end energy demand• scenario for high calory demand, high lifestock share,
high consumer waste share• high exogenous scenarios for RE investment costs,
efficiencies, adjustment costs and expansion constraints
• low fossil fuel availability, fossil resource extractionconstraints
• low final energy intensity/ end energy demand• scenario for low calory demand, low lifestock share, low
consumer waste share• low exogenous scenarios for RE investment costs,
efficiencies and adjustment costs, and no expansion constraints

Elmar KrieglerPotsdam Institute for Climate Impact Research
EMF24 EMF24 exampleexample: Low vs. high : Low vs. high mitigativemitigative capacitycapacitywithwith unchangedunchanged adaptive adaptive capacitycapacity
SSP1 EMF24 run R2G2, low energy intensity
SSP5 EMF24 run R2G6, high energy intensity, pessimistic RE, low biomass

Elmar KrieglerPotsdam Institute for Climate Impact Research
SummarySummary and and conclusionsconclusions
• Fun work to try to translate SSP narratives in modelassumptions
• Hard work to implement it and ensure that model results arereasonable and reflective of the narrative
• Need guidance and coordination: Where would it best to focus, where are other groups focusing
• Need dialogue and cooperation with a range of non-IAMgroups: demography, growth accounting, institutionalanalysis, human development, IAV
• Concern about lock-in in low, medium, high UN populationscenarios (e.g. divided world scenarios)

Elmar KrieglerPotsdam Institute for Climate Impact Research
Thank you!Thank you!

Elmar KrieglerPotsdam Institute for Climate Impact Research
Backup SlidesBackup Slides

Elmar KrieglerPotsdam Institute for Climate Impact Research
CrucialCrucial indicatorsindicators forfor SSPsSSPs
Population: total population, age structure, urbanization
Economy: GDP, sectoral structure, investment rate, income
convergence, labor participation rates
Environment: external costs (fossils, RE), energy intensity of
consumption patterns, pollution, land use footprints
Equity: intra- and interregional income distribution, energy
and food prices
Technology: energy resources and technologies, agricultural productivity,
diffusion rates, direction of technological change
Governance: rule of law, political stability, international regimes, market
regimes
Globalisation: trade patterns / limitations, knowledge transfer, capital markets
Behaviour: consumption patterns, health indicators
Category Indicators