Embed Size (px)
Citation preview
discon
APPLICATION OF THE EXPECTANCY-DISCONFIRMATION MODEL IN THE PREDICTION OF HEARING AID USER SATISFACTION
by
Elaine Rosenthal Mormer
BS, University of Massachusetts, 1979
MA, University of Massachusetts, 1981
Submitted to the Graduate Faculty of
The School of Health and Rehabilitation Sciences in partial fulfillment
of the requirements for the degree of
Doctor of Philosophy
University of Pittsburgh
2012

ii
UNIVERSITY OF PITTSBURGH
School of Health and Rehabilitation Sciences
This dissertation was presented
by
Elaine Rosenthal Mormer
It was defended on
October 19, 2012
and approved by
J. Jeffrey Inman, PhD, Professor, School of Business
Sheila Pratt, Associate Professor, PhD, Communication Science and Disorders
J. Scott Yaruss, Associate Professor, PhD, Communication Science and Disorders
Dissertation Advisor: Catherine Palmer, PhD, Associate Professor, Communication Science
and Disorders

iii
Copyright © by Elaine Rosenthal Mormer
2012

iv
APPLICATION OF THE EXPECTANCY-DISCONFIRMATION MODEL IN THE
PREDICTION OF HEARING AID USER SATISFACTION
Elaine Mormer, PhD
University of Pittsburgh, 2012
The relationship between expectations and satisfaction, across a variety of products and services,
has been documented in consumer and health care literature. The expectancy-disconfirmation
model of satisfaction has grown out of this work. This model proposes that the size of difference
between a consumer's expectation and perception of a product or experience (disconfirmation) is
predictive of the resulting satisfaction. This model has been empirically tested and shown to
predict satisfaction in health care settings such as vision correction, hospital stays, and pharmacy
purchases as well as in consumer services and purchases. Results from a study of the expectancy-
disconfirmation model suggest that disconfirmation might be a strong predictor of satisfaction in
Chinese first-time hearing aid users.
This topic is relevant to hearing health care and health care in general, at the conceptual
and the clinical level. Patient satisfaction leads to increased patient compliance with the
procedures or interventions offered, leading to better treatment outcomes. Patient satisfaction has
an important influence on utilization patterns and on patients’ responses to the care given. Many
treatment outcomes, particularly those associated with hearing aid use, are dependent on a high
level of patient compliance. As clinicians seek to attain optimal treatment outcomes, which
should include improved quality of life; it is legitimate to pursue patient satisfaction as a
prerequisite goal.
One component of this study was to develop a reliable hearing aid disconfirmation
measurement instrument that could be used to investigate the relationship between

v
disconfirmation and satisfaction in first time purchasers of hearing instruments in the United
States. Further research questions addressed more specific aspects of that relationship. Results
indicated that disconfirmation is a strong predictor of satisfaction in first time hearing aid users.
The perception of hearing aid performance and the disconfirmation contribute heavily to
satisfaction, and seem to carry similar weighting. The use of self-report measures in hearing aid
outcomes appears to be immune to the bias posed by socially desirable responding. This study
provides the first empirical evidence that the expectancy-disconfirmation model of satisfaction
can be applied to the study of satisfaction in first time hearing aid purchasers in the United
States.

vi
TABLE OF CONTENTS
PREFACE .................................................................................................................................. XII
1.0 INTRODUCTION ........................................................................................................ 1
2.0 LITERATURE REVIEW ............................................................................................ 6
2.1 MODELING CONSUMER SATISFACTION ................................................. 6
2.1.1 Cross Cultural Considerations .................................................................. 21
2.1.2 Summary ...................................................................................................... 23
2.2 FROM CONSUMER TO PATIENT SATISFACTION ................................ 27
2.2.1 Summary of the Expectancy-Disconfirmation Paradigm ....................... 38
2.3 METHODOLOGICAL CONSIDERATIONS IN PAST RESEARCH ........ 40
2.4 EXPECTANCY- DISCONFIRMATION IN HEALTH CARE .................... 45
2.5 EXPECTATION/SATISFACTION RESEARCH IN AUDIOLOGY .......... 65
2.6 CONCLUSION .................................................................................................. 90
3.0 RESEARCH QUESTIONS AND METHODS ........................................................ 92
3.1 OBJECTIVES AND AIMS ............................................................................... 92
3.2 METHODS ......................................................................................................... 95
3.2.1 General Research Design ........................................................................... 95
3.2.2 Variables and Operationalization ............................................................. 97
3.2.2.1 Perceived Performance ....................................................................... 97

vii
3.2.2.2 Disconfirmation ................................................................................... 99
3.2.2.3 Satisfaction ......................................................................................... 101
3.2.2.4 Response Bias .................................................................................... 103
3.2.3 Data Collection Procedures ...................................................................... 105
3.2.3.1 Recruitment ....................................................................................... 105
3.2.3.2 Subjects .............................................................................................. 106
3.2.3.3 Procedures: ........................................................................................ 106
3.2.3.4 Sample size determination................................................................ 107
3.2.4 Data collected ............................................................................................ 108
3.2.4.1 Management of missing data ........................................................... 111
3.2.4.2 Descriptive data ................................................................................. 111
3.3 SPECIFIC RESEARCH QUESTIONS AND ANALYSIS .......................... 111
3.3.1 Pre-study question .................................................................................... 111
3.3.2 Main research questions ........................................................................... 113
3.3.2.1 Question #1 ........................................................................................ 113
3.3.2.2 Question #2 ........................................................................................ 115
3.3.2.3 Question #3 ........................................................................................ 116
3.3.2.4 Question #4 ........................................................................................ 118
3.3.2.5 Question #5 ........................................................................................ 119
3.3.2.6 Sub-Questions: .................................................................................. 121
4.0 RESULTS AND CONCLUSIONS ......................................................................... 123
4.1 RESULTS ......................................................................................................... 123
4.1.1 Descriptive statistics: participant demographics ................................... 123

viii
4.1.2 Descriptive statistics: measurement instruments ................................... 125
4.1.3 Pre-study question: Test-retest reliability on disconfirmation measures
126
4.1.4 Results of analysis on specific research questions .................................. 127
4.1.4.1 Q1: Global disconfirmation predicting satisfaction ....................... 127
4.1.4.2 Q2: Disconfirmation for product/service predicting satisfaction . 128
4.1.4.3 Q3: Influence of response bias on hearing aid measures .............. 129
4.1.4.4 Q4: Performance/disconfirmation predicting satisfaction ............ 130
4.1.4.5 Q5: Interaction of response bias on prediction of satisfaction...... 131
4.1.4.6 Predicting multi-item questionnaire results from single items ..... 132
4.2 DISCUSSION ................................................................................................... 133
4.2.1 Pre-study question: Test-retest reliability on disconfirmation measures
133
4.2.2 Q1: Global disconfirmation predicting satisfaction............................... 134
4.2.3 Q2: Disconfirmation for product and service predicting satisfaction.. 137
4.2.4 Q3-5: Influence and moderating effect of response bias ....................... 138
4.2.5 Predicting multi-item questionnaire results from single items ............. 140
4.3 CONCLUSIONS .............................................................................................. 141
4.3.1 Future questions ........................................................................................ 142
APPENDIX: PARTICIPANT QUESTIONNAIRE ............................................................... 144
BIBLIOGRAPHY ..................................................................................................................... 162

ix
LIST OF TABLES
Table 1. Summary of reviewed expectancy-disconfirmation studies in consumer context .......... 24
Table 2. Contribution of various disciplines in patient satisfaction research ............................... 35
Table 3. Theories with relevance to the expectancy-disconfirmation paradigm .......................... 39
Table 4. Conceptual challenges and considerations in hearing aid disconfirmation research ..... 42
Table 5. Operational challenges and considerations in hearing aid disconfirmation research ..... 43
Table 6. Aspects of various health services compared to hearing aid dispensing ........................ 48
Table 7. Expectancy-Disconfirmation research on satisfaction in health care ............................. 63
Table 8. Studies on expectations/satisfaction in the Audiology literature .................................... 84
Table 9. Original norms for the SADL global and subscales for ages 60-75 years .................... 102
Table 10. Study constructs and related instruments for operationalization ................................ 105
Table 11. Coding of data from each measurement and study question ...................................... 110
Table 12. Pre-study question constructs, instruments, codes, and values ................................... 112
Table 13. Main research questions constructs, instruments, codes, and values .......................... 113
Table 14. Age data for participants (n=64) ................................................................................. 123
Table 15. Descriptive statistics for responses across measurement instruments ........................ 126
Table 16. ICC coefficients on T1-T2 disconfirmation responses ............................................... 127
Table 17. Beta and p values for predictor variables, question 2 ................................................. 128

x
Table 18. Regression of performance, disconfirmation, and satisfaction on SDRS-5 .............. 129
Table 19. Beta and p values for performance, disconfirmation, and response bias .................... 130
Table 20. Beta, t and p values for the interaction term of socially desirable responding ........... 131
Table 21. Data from regression of single item measures on multiple item measures ................ 132

xi
LIST OF FIGURES
Figure 1. Woodruff’s model of disconfirmation and the zone of indifference ............................... 9
Figure 2: Assimilation/contrast model of satisfaction .................................................................. 36
Figure 3. Relationships of expectations and priorities to satisfaction .......................................... 61
Figure 4. Predicted regression line question 1 ............................................................................ 114
Figure 5. Predicted regression lines for question 2 ..................................................................... 115
Figure 6. Predicted regression lines for question 3 ..................................................................... 117
Figure 7. Predicted regression lines for question 4 .................................................................... 119
Figure 8. Predicted regression lines for question 5 .................................................................... 120
Figure 9. Predicted regression line for sub-question A ............................................................... 121
Figure 10. Predicted regression line for sub-question B ............................................................. 122
Figure 11. Predicted regression line for sub-question C ............................................................. 122
Figure 12. Distribution of participants by highest grade of school completed. .......................... 124
Figure 13. Distribution of participants across categories of household income ......................... 125

xii
PREFACE
I am grateful for the significant help and support I received from many of the faculty in the
Communication Science and Disorders Department at the University of Pittsburgh, in particular
Dr. Mick McNeil and Dr. Connie Tompkins. I have received invaluable input on this project
from all of the PhD and AuD students who have passed through Dr. Catherine Palmer’s lab since
this project began. This dissertation would not have come to completion without both personal
and statistical guidance from Dr. Elaine Rubinstein and Dr. John Miller. Undergraduate students
Louis Billera and Katelin Archer provided essential assistance with data collection and coding,
as did Jennifer Fruit of the University of Pittsburgh Medical Center.
I would like to thank my committee members, Dr. Scott Yaruss, Dr. Sheila Pratt, and Dr.
Jeffrey Inman, each of whom contributed valued expertise, time, and encouragement along the
way. I have eternal respect and gratitude for my committee chair, Dr. Catherine Palmer. Her
endless mentoring, support, guidance, and friendship inspired me to undertake and complete this
project.
I was only able to complete this project because of the unending support and patience of
my children and my husband, Karl Mormer.
This study was supported in part through funding from the SHRS Research Development
Fund, School of Health and Rehabilitation Sciences, University of Pittsburgh.

1
1.0 INTRODUCTION
The relationship between expectations and satisfaction, across a variety of products and
services, has been documented in consumer and health care literature (Newsome &
Wright, 1999; Oliver & DeSarbo, 1988; Spreng, MacKenzie, & Olshavsky, 1996;
Thompson & Sunol, 1995; Zwick, Pieters, & Baumgartner, 1995). This topic addresses a
research priority in audiology, specifically in the area of patient satisfaction with hearing
aids. An international group of audiology researchers identified this priority when they
convened for a workshop in 1999 (Cox & Alexander, 2000). Their purpose was to
summarize the state of research addressing self-report outcome measures of audiologic
rehabilitation. One goal of the workshop was to identify and rank research priorities in
this area. Foremost among the resulting list of research priorities was the need to “explore
the relationship between expectations and outcome, especially including satisfaction.”
The authors pointed out that pre-fitting expectations and post treatment outcome
measures could have a significant impact on clinical treatment decisions. Since that time
methods used to explain this relationship, and the data obtained, have not yielded a clear
or consistent explanation of the expectation-satisfaction relationship (Cox & Alexander,
2000; Wong, 2004; Wong, Hickson, & McPherson, 2003).

2
The need to better explain satisfaction with hearing aid fitting goes beyond
academic curiosity. This topic is relevant to hearing health care and health care in
general, both at the conceptual and the clinical level. Healthcare providers have seen the
role of the patient evolve to more closely resemble that of a consumer over the past thirty
years (Batchelor, Owens, Read, & Bloor, 1994; Linder-Pelz, 1982b; Newsome & Wright,
1999; Sitzia & Wood, 1997; Susman, 1994). This may be due in part to increased direct-
to-consumer marketing strategies on the part of hospitals, drug manufacturers, and
physicians. Other authors have explained this phenomenon as a natural outgrowth of the
cultural shift towards consumerism in all areas of service delivery (Sitzia & Wood,
1997).
Within the last two decades the internet has provided inquisitive patients with a
plethora of information and misinformation by which expectations of outcome can be
influenced. Patients receiving health related services expect to play an active role in the
planning of diagnostic and treatment procedures. This attitude of consumerism applies
across health care disciplines ranging from surgery to dentistry, pharmacy, rehabilitation
services, and the dispensing of durable medical equipment. From a business prospective,
health care providers are faced with the challenge of achieving satisfaction, or losing
patients/consumers to other practitioners.
The goal of achieving patient satisfaction is not solely focused on creating an
advantage in a competitive service environment. Patient satisfaction leads to increased
patient compliance with the procedures or interventions offered, leading to better
treatment outcomes (Francis, Korsch, & Morris, 1969; Garrity, 1981). Significantly,

3
patient satisfaction has an important influence on utilization patterns (Strattmann, 1975)
and on patients’ responses to the care given (Hill, 1977). Sherbourne et al.(1991)
showed, in a longitudinal study, that patient satisfaction with certain attributes of care
was positively associated with adherence to medical recommendations for cardiac
patients. Many treatment outcomes, particularly those associated with hearing aid use, are
dependent on a high level of patient compliance. Thus, as clinicians seek to attain optimal
treatment outcomes, which should include improved quality of life, it is legitimate to
pursue patient satisfaction as a prerequisite goal (Stark & Hickson, 2004).
In 1974 it was estimated that 21% of older adult hearing aid candidates in the
United States actually used hearing aids (Arnold & McKenzie, 1998). This number
remained stable over the next two decades as evidenced by Kochkin’s 1992 estimate that
20% of patients who could benefit from amplification actually sought to make a hearing
aid purchase (Kochkin, 1993a; Kochkin, 1993b; Kochkin, 1993c). During the following
decade the industry saw hearing aids evolve from simple analog instruments to fully
digital circuits with a variety of high level options and features. Despite these dramatic
technological improvements, Kochkin’s estimate of market penetration did not change
when data were collected again in 2005 (Kochkin, 2005a). One explanation for this
consistently low market penetration is reflected in a study showing that negative attitudes
towards hearing aids serve as a significant barrier to instrument purchase (Kochkin,
2007). These attitudes seem to be based largely on the reported experiences or beliefs of
friends, co-workers, or family members; influences that play a role in the development of
hearing aid expectations.
4
If satisfactory experiences with these devices could be increased, it should follow
that more hard-of-hearing individuals would become successful hearing aid users. This is
of particular importance in the elderly population, where the incidence of hearing loss is
high and is associated with cognitive impairment and/or depression and reduction of
functional status (Cacciatore et al., 1999; Lin, 2011). In this population, hearing loss is
associated with reduced quality of life and higher levels of depressive symptoms. Hard
of hearing individuals who become hearing aid users show less depression and improved
quality of life compared to those who do not use hearing aids (Chisolm et al., 2007;
Mulrow et al., 1990; Stark & Hickson, 2004). Improved satisfaction with hearing aids
should generally increase the number of users, enabling more people to experience the
improved quality of life associated with better communication.
In order to pursue the goal of increased satisfaction it is necessary to understand
the construct of satisfaction and to review approaches used to study its components and
predictors. Suggestions for maximizing satisfaction should be based on a widely accepted
approach that has been documented in the literature across a variety of disciplines. The
relationship of expectations and satisfaction has been studied in the consumer satisfaction
literature and in patient satisfaction literature via the expectancy-disconfirmation model
of satisfaction (Churchill & Surprenant, 1982; Ho, Mursch, Ong, & Perttula, 1997;
Kumar et al., 2007; Newsome & Wright, 1999; Oliver, 1977; Pager, 2004; Sitzia &
Wood, 1997). Research on this model often involves the use of patient report outcomes,
particularly in the assessment of patient benefit and/or satisfaction (Alazri & Neal, 2003;
Humes et al., 2002; Kumar et al., 2007; Pager, 2004; Vestergaard, 2006).

5
There are a variety of instructional materials used for audiology student training
and continuing education in the area of hearing aid dispensing. These include textbooks,
journals, and online articles. Within this literature, the management of realistic hearing
aid expectations is touted as a primary factor in achieving patient satisfaction
(McLauchlin, 1992; Sweetow, 1999a; Sweetow, 1999b; Weigand, Bodkin, Madell,
Rosenfeld, & Press, 2002). Empirical evidence of this expectation/satisfaction
relationship, as applied to hearing aid fitting, has been limited to date (Cox & Alexander,
2000; Gatehouse, 1994; Jerram & Purdy, 2001; Wong et al., 2003; Wong, Hickson, &
McPherson, 2004).
This paper begins with a review of the development of consumer satisfaction
models. A review of literature describing application of the expectancy-disconfirmation
model of satisfaction across a variety of disciplines is presented Literature that has
explored the components of hearing aid satisfaction also is summarized. The application
of the expectancy-disconfirmation model in hearing aid fitting is open for exploration.
The goal of this review is to provide a rationale for applying this approach to modeling
satisfaction among hearing aid users.
.

6
2.0 LITERATURE REVIEW
2.1 MODELING CONSUMER SATISFACTION
Models of consumer satisfaction were created and researched well before the construct of
patient satisfaction was widely accepted. The theoretical underpinnings of consumer
satisfaction were drawn from research in areas of social and applied psychology (Oliver,
1980). During the 1970’s a number of authors culled theoretical constructs and empirical
data from a variety of disciplines to arrive at a conceptual understanding of consumer
satisfaction (Day, 1977; Locker & Dunt, 1978; Oliver, 1977; Olshavsky & Miller, 1972;
Olson, 1979). Contributions came from fields that included marketing theory,
psychology, social science research, and business management. Out of this consolidation
of theoretical and empirical research the expectancy-disconfirmation paradigm became
the dominant model used to explain satisfaction. In this paradigm the consumer
satisfaction/dissatisfaction outcome is believed to result from a process of comparison.
The consumer forms expectations of a given product or brand prior to the purchase.
These expectations are internal predictions of the nature and level of performance the
buyer will receive from the product. Once the product is purchased and used, the
consumer compares the perceived performance with the initial expected performance.

7
Confirmation results when there is a close match between the expected and perceived
actual performance. The term disconfirmation is used when there is a mismatch between
the expected and perceived actual performance. A disconfirmation can be either positive
or negative. A positive disconfirmation occurs when the perceived performance exceeds
the expectation. A negative disconfirmation occurs when the perceived performance falls
below the level of expectation. The response to the disconfirmation is an emotional
reaction called satisfaction/dissatisfaction, depending on the direction of the mismatch
(Woodruff, Cadotte, & Jenkins, 1983).
There are four constructs that are encompassed in the basic expectancy-
disconfirmation paradigm. These are expectations, perceived performance,
disconfirmation, and satisfaction. A variety of designs have validated the nature of the
relationships between these constructs throughout the disconfirmation literature. In
particular, many of these studies have focused on the resulting dissatisfaction occurring
when expectations are disconfirmed (Churchill & Surprenant, 1982). Additionally, many
of the studies reviewed in this paper relate to understanding the nature and measurement
of the constructs themselves (Alford, 1998; Cadotte, Woodruff, & Jenkins, 1987;
Churchill & Surprenant, 1982; Fishbein & Ajzen, 1975; LaVois, Nguyen, & Attkisson,
1981; Linder-Pelz, 1982; Locker & Dunt, 1978).
A number of investigations have demonstrated significant disconfirmation effects
on satisfaction across a variety of products and services (Oliver, 1980). Following wide
acceptance of the expectancy-disconfirmation paradigm, several studies attempting to
better explain and theorize the components and nature of pre-purchase expectations arose

8
in the consumer satisfaction literature (Oliver, 1980; Spreng & Olshavsky, 1993; Tse &
Wilton, 1988; Woodruff et al., 1983). Oliver (1980) conducted a study demonstrating
that attitude played a key role in the formation of expectation and satisfaction. Oliver’s
approach was derived from the Attitude Theory literature as the Expectancy- Value
theory (Fishbein & Ajzen, 1975). According to Expectancy-Value models, beliefs and
associated evaluations are the determinants of an attitude. Thus, patient satisfaction can
be considered an attitude, composed of belief strength and attribute evaluations.
Attributes refer to the dimensions or features of a product’s performance (e.g., cost;
reliability; convenience, etc.). Fishbein and Ajzen (1975) created a mathematical
equation to model the relationship described above where B = belief strength and E=
measures of evaluation. The formula for this model is:
Attitude = ∑ B1E1
This model was tested by Ware et al. (1978) and the BE measures were found to
correlate significantly with direct measures of satisfaction. Ware’s work was consistent
with the Expectancy-Value model put forth by Fishbein and Ajzen, further giving rise to
the accepted importance of expectancy-disconfirmation as a determinant of satisfaction.
Oliver (1980) applied this model to the empirical study of the antecedents and
consequences of satisfaction. He studied participants in a flu vaccination program and
concluded that satisfaction resulted from a combination of initial expectation/attitude and
disconfirmation.

9
Woodruff et al. (1983) expanded on the expectancy-disconfirmation paradigm by
adding in the components of prior product and brand experience and experience based
performance norms. Each of these are derived from personal experience, word-of-mouth
opinions, and/or marketing efforts of a product manufacturer. These authors hypothesized
that brand attitudes and brand expectations combine to form the norm to which
evaluation of the product is compared. Thus, experience (of brand and/or product)
combines with other preconceived performance norms to influence the amount of
confirmation/disconfirmation. A graphic representation of the relationship between post-
use performance, norm of performance, and confirmation/disconfirmation is shown in
Figure 1.
Figure 1. Woodruff’s model of disconfirmation and the zone of indifference

10
Note that the area labeled Norm is a region or zone within which performance is
perceived as essentially equivalent to the expectation. Woodruff et al. proposed that this
area comprises a zone of indifference, where neither confirmation nor disconfirmation
results (other authors have referred to this area as the zone of tolerance). In other words,
perceived performance in this area does not evoke a conscious response enlisting
attentional resources to the evaluation process. Responses outside of the zone of
indifference are unusual or attention-arousing. In these conditions the satisfaction process
evokes a positive or negative emotional response. Recall that the response of satisfaction
is described as an emotion, thus only perceived performance falling outside of the zone of
indifference results in confirmation/disconfirmation and thus satisfaction/dissatisfaction.
The Woodruff et al. article goes on to explore the outcomes of
satisfaction/dissatisfaction in relation to consumer behavior, further arguing for the
importance of understanding the satisfaction response. These authors state that for most
consumer purchases, perceived performance falls within the zone of indifference. This
means that most reactions to perceived performance may not evoke the emotional
response necessary to constitute satisfaction or dissatisfaction. The authors reason that
otherwise consumers would be “in a frequent state of excitement or frustration.” Though
this could well be the case with many hearing aid patients/consumers, the more typical
satisfaction response is a continued desire to use the product. From a psychological
standpoint, this response occurs because the match of perceived performance to pre-
purchase expectations serves to reinforce the consumer’s decision to engage with a
product. The authors discussed the outcomes that arise when product performance is

11
unusually good or bad, that is, outside the zone of indifference. Some of these outcomes
relate to the establishment or refinement of users’ internalized norms or expectancy-
disconfirmation for the product and or brand. These positive or negative satisfaction
responses increase the likelihood that the consumer will react in some way. Reactions
may include changing product/brand attitudes, intentions to use the product/brand again,
giving word-of-mouth testimony or warnings to friends and family, complaining to the
provider, or even taking legal action. This analysis of the behavior change resulting from
the satisfaction response is useful in appreciating the importance of achieving
satisfaction. It could be that the satisfaction a hearing aid provider seeks is best achieved
by targeting the zone of indifference. Based on Woodruff et al., users in this category
would be likely to have higher hours of use per day of their instruments. As we will see
later, hours of use per day is associated with higher satisfaction in hearing aid users. On
the other hand, would hearing aid dispensers be better off to understate expectations so
that a larger positive disconfirmation could be achieved? This question has been
addressed in the product marketing literature, as will be noted later in this paper (Spreng
& Droge, 2001). Research regarding hearing aid satisfaction will need to take these issues
into consideration.
Based on the above model, a number of questions and potential research
hypotheses were suggested by these authors. This work set forth a modified theoretically
based model and enough research questions to supply a career’s worth of programmatic
research on the expectancy-disconfirmation paradigm. Moreover, the authors focused on
specific conceptual issues to be investigated in testing the model e.g., (1) Do experience-

12
based norms have a significant role in confirmation/disconfirmation responses? (2) Are
there different types of norms and if so, what are they like? (3) Does a zone of
indifference mediate between a cognitive and an emotional state? The authors believed
that each of these general questions would lead to several research hypotheses which
could then be applied in a variety of consumer experiences and products across service
disciplines. Additionally, the authors described issues in operationalization of the
constructs for each of the research questions. An important component of this work was a
discussion of measurement challenges involved in the use of satisfaction/dissatisfaction
scales and some suggested approaches to assessing the validity and characteristics of the
zone of indifference. In essence, this foundational work laid out a very specific plan for
further validation of the expectancy-disconfirmation model and tools that could be
adopted for use in testing potential variations on the disconfirmation model.
In a later study (Cadotte et al., 1987) components of the above model were tested
via a causal modeling method. Specifically, three variations of the expectancy-
disconfirmation model were operationalized. Each one varied by the reference standard
used for comparison of perceived performance to determine the disconfirmation. The first
model used brand expectation as the comparison reference. The second model used best
brand norm and the third used product norm. Each model was tested in relation to a
variety of attributes of restaurant experiences in a large sample of typical restaurant
consumers. Based on chi square values obtained in the analysis, the product norm model
provided the best fit with the data, followed by the best brand norm model and then the
brand expectation model. Of note, all of the disconfirmation models were supported by

13
the analysis, suggesting that the general expectancy-disconfirmation paradigm is a useful
framework that might involve a variety of comparison processes. These authors used an
array of restaurant experiences in this study. They found that in two of the three
restaurant situations a different evaluation standard (product norm vs. best brand norm)
better explained the data. These findings confirmed an earlier observation (Churchill &
Surprenant, 1982) that comparison processes in satisfaction may vary across product and
service categories or situations. For example, it could be that disconfirmation for fast
food restaurants may involve a different reference standard than that for a leisurely
family dining experience. Churchill and Surprenant (1982) had compared participants’
satisfaction formation processes for video disc players versus chrysanthemum plants in
order to reach their conclusion. This research expanded the view from the simple
expectancy-disconfirmation paradigm to a more complex model whereby disconfirmation
is tied to consumers’ various standards of comparison depending on prior experience and
on the product or service under evaluation. Later, (Cadotte et al., 1987) recognized this as
a multidimensionality of standards used to compare brand performance.
Tse and Wilton (1988) expanded the disconfirmation model further when they
examined, theoretically and empirically, the role of perceived perception in satisfaction
formation. These authors argued that disconfirmation alone could not always adequately
explain satisfaction. For example, if a consumer needed to use a product of inferior
quality because the higher quality item was not available, s/he might perceive poorer
performance without experiencing a disconfirmation. In addition to perceived
performance as a direct determinant of satisfaction these authors noted that consumption

14
motivation could influence perceived performance. The research to validate these
concepts involved a laboratory experiment in which expectations and product
performance were manipulated. Subjects in this study role-played consumers trying out a
new handheld record player for a trial period. Manipulation of expectations was achieved
by supplying subjects with a one page description of the product, followed by elicitation
of product performance/attribute expectations. Product performance manipulations were
achieved by supplying subjects with either high or low performing players.
Manipulation checks of the expectation and product performance treatments were
included in the study. The results of this study supported the direct influence of perceived
performance in satisfaction formation.
Zwick, Pieters, and Baumgartner (1995) contributed to the expectation literature
by investigating the role of hindsight bias. Specifically, they questioned the role of
hindsight bias in satisfaction formation and its impact on the pattern of relationships in
the expectancy-disconfirmation model. Hindsight bias refers to the tendency for people
to exaggerate in hindsight what could have been expected in foresight. Hindsight bias is
said to occur when a consumer’s experience with a product systematically distorts recall
of foresight expectations in the direction of perceived product performance. Also known
as the I knew it all along effect, hindsight bias is an important consideration in testing of
the expectancy-disconfirmation model of satisfaction. Decisions regarding timing of the
expectation measure should be made with this bias in mind.
In Zwick et al’s study the authors manipulated expectations and product
performance for a personalized envelope product. Foresight and hindsight expectations

15
were recorded and compared and the results showed that experience with the product did
distort subjects’ recall of their foresight expectations consistent with the hindsight bias
phenomenon. Of note, in the subject groups where performance was manipulated in the
positive direction, mean hindsight expectations were generally higher than foresight
expectations. These authors argue that disconfirmation is mediated by hindsight versus
foresight expectations for consumers in real world experiences. Their findings have
significant implications for the design of research and instruments intended to test the
effect of expectations on satisfaction. In many of the studies on disconfirmation
researchers have based the disconfirmation construct on measurement of foresight
expectations and perceived performance. This method has been referred to as direct
versus subjective measurement of expectations (Yuksel, 2001). The use of foresight
expectations, or measurement of direct disconfirmation, indicates that participants are
asked to rate their expectations of a product or service’s performance prior to exposure or
use. For example, direct measurement occurs when a researcher asks a participant to rate
his/her expectation of speech clarity in noise with a soon to be dispensed hearing aid. In a
hindsight, or subjective disconfirmation approach the participant would first be fit with
the hearing aid and asked to rate the aided speech clarity in noise. He or she would then
be asked to rate how different the speech clarity in noise is from what was expected
before the fitting. Direct measurement of expectation was generally thought to be the
more valid strategy as it would avoid any memory bias inherent in asking subjects to
recall pre-purchase expectations. Zwick et al.’s (1995) findings suggested that the use of
subjective (hindsight expectations) disconfirmation would result in research findings that

16
were actually more valid and generalizable to marketplace circumstances. Intuitively, this
makes sense in that direct disconfirmation is only captured in a research environment. In
the real world, when consumers experience disconfirmation, it is always subjective in
nature. In other words, disconfirmation in the marketplace does not occur until after
experiencing a product or service. At that time, the recalling of initial expectations has
already been contaminated with the hindsight bias. Though the foresight technique may
be more objective, the hindsight approach may be more applicable to the real world.
Zwick et al.’s (1995) study is a valuable resource not only in examining foresight
versus hindsight expectation measurement, but also in its in-depth management of
expectation manipulation and the verification thereof. These authors indirectly
manipulated expectations through a simulated advertising campaign. They then carefully
analyzed the foresight expectation results to be sure that the manipulation successfully
separated apart low and high expectation groups. This step is appropriate in any research
design where expectation manipulation is used. As illustrated in a disconfirmation study
to be described later (Kumar et al., 2007), the manipulation and verification process may
be necessary in order to create enough variance in the disconfirmation to test for
correlations.
The management of customer expectations was further reviewed and investigated
(Spreng & Droge, 2001) in an attempt to better understand the impact of expectation
management on customer satisfaction. Specifically, these authors questioned whether
minimizing expectations of high performing products would result in a large positive
disconfirmation and therefore, higher satisfaction. Secondly, the authors questioned

17
whether manipulations of expectations in the upward direction would result in higher
satisfaction, regardless of actual product performance. This second goal could be
described as looking for a direct relationship between expectations and satisfaction versus
the direct relationship between disconfirmation and satisfaction. These first questions
were based on earlier research (Boulding, Kalra, Staelin, & Zeithaml, 1993; Olshavsky &
Miller, 1972; Yi, 1990) showing divergent results on the impact of expectation
management, as mentioned earlier in this paper. The question addressed by this study
was, simply stated: Do people see what they expect to see (Perceived Performance
model) such that satisfaction is mediated directly by expectations, or is satisfaction
mediated by the size and direction of disconfirmation (expectancy-disconfirmation
model). This study focused specifically on information given directly to customers from
a retail salesperson versus externally supplied information such as word-of-mouth reports
or printed advertising. These authors created appropriate hypotheses to test each model in
regard to products and services that might be offered in retail settings. In addition to the
comparison of the Perceived Performance versus Expectancy/ Disconfirmation models,
these authors probed the impact of managing expectations on satisfaction with
information. This aspect of their investigation was based on Spreng et al’s (1996) earlier
proposal of the construct satisfaction with product information. With potential relevance
to hearing aid use, this construct is based on the argument that a disconfirmation response
to product performance comes not only from perceived product performance, but from
perceived adequacy or inadequacy of the pre-purchase product information. This
dissatisfaction with information provided can then influence overall satisfaction. This

18
argument differentiates satisfaction with product information from satisfaction with
product attributes. The authors propose that the truth and accuracy of information may
play an important role in determining overall satisfaction. The perception that the product
information was untruthful in either a negative or positive direction may lead to
information dissatisfaction.
Finally, these authors tested the determinants of satisfaction by measuring the
individual impact of each of the above described three predictors (expectations; perceived
performance; and information satisfaction) on overall satisfaction, in an attempt to
empirically validate the above arguments. The experiments were conducted in a
laboratory using a camcorder as the target product. Both expectation and performance for
the camcorders were manipulated across three different attributes (ease of use, image
quality, versatility). For example, expectations were manipulated by giving participants
differing written descriptions of a camcorder device that each participant would operate
for a short period. One group of participants was given information suggesting that the
product would be easy to use but that the images would not be high quality. The other
group was instructed that operation of the product was difficult but that the images would
be very high quality. Expectations were then elicited on the target camcorder attributes,
providing a manipulation check. Performance was manipulated by showing subjects
either one of two different camcorders and giving a demonstration of the camcorder
features. One of the camcorders was easy to use while the other was difficult to operate.
Versatility and image quality were controlled as well. Subjects then used the camcorders
and were asked to report on perceived attribute performance and satisfaction. There were
19
two levels of the expectation factor (high, low) and two levels of the performance factor
(high, low). Measures of perceived performance served as performance manipulation
checks in addition to providing data to test the hypotheses. These authors verified that
appropriate disconfirmations (or confirmations) were created for each attribute by asking
subjects to rate the level at which the attribute performance met initial expectations. After
rating attribute performance, subjects were asked to rate their satisfaction with the
product. This aspect of the study raises the question as to whether a perception of
satisfaction can be validly elicited from a subject who is neither purchasing nor earning a
product. These authors argued that, in this study, satisfaction could be elicited because
participation in the experiment required a sacrifice of time resulting in a cash and product
donation to the subjects’ church. In addition to being asked about general satisfaction
with the product, subjects were asked to rate their satisfaction with the product
information.
Analysis of these results began with verification of the manipulation effect on
expectations and performance. Appropriate differences were measured in the
expectations and perceived performance ratings of each manipulation group. Other
findings from this study have importance to research in this area. The first important
result relates to the intentional lowering of expectation so that a larger positive
disconfirmation is created. In this study, when attribute expectations were managed in a
downward direction, satisfaction was not greater than when expectations were managed
to match performance. Similarly, greater dissatisfaction was not observed when a larger
negative disconfirmation was created, for two of the three attributes under study. These

20
findings suggest that consumers’ perception of product quality is influenced by their
satisfaction with the information supplied with the product. Participants were probably
reacting to the falsity of the information provided when they expressed lower satisfaction
in this part of the study. The authors noted that disconfirmation did positively predict
satisfaction for each of the attributes. In regard to the question of a direct relationship
between expectations and perceived performance, these authors found that perception of
performance was higher when expectations had been raised, in two of the three product
attributes. This was true even when actual performance was managed to be lower.
Similarly, downward management of expectations resulted in lower perceived
performance. These results support a direct link from manipulated expectations to
perceived performance. Notably, as will be reported later in this paper, this finding of a
direct link from expectations to perceived performance has been found in the hearing aid
literature (Cox & Alexander, 2000; Wong et al., 2004). Finally, in evaluating satisfaction
with information, these authors found that regardless of the direction of expectation or
performance manipulation, satisfaction for information was greatest when the
information accurately reflected future performance. These authors argue against
manipulation of expectations in order to achieve greater satisfaction. Overall conclusions
from this study mainly focus on the effect of information accuracy in the formation of
satisfaction. Though disconfirmation did positively predict satisfaction in the study, the
accuracy of product information is clearly an important factor in satisfaction.
Additionally, these authors demonstrated the direct relationships between expectation and
perceived performance.

21
One limitation of applying this study to satisfaction with hearing aids relates to
the relative difficulty one encounters in accurately predicting perceived performance of a
hearing aid versus service or performance of a consumer product. For example, a
passenger airline might choose to follow the Expectancy-Disconfirmation model to
increase customer satisfaction. As such, they might tell customers that the flight on which
they are about to embark will be very bumpy when weather conditions are such that it
should be very smooth. Alternatively, the airline might employ the Perceived
Performance model and truthfully inform passengers that the flight will likely be bumpy
when data indicate that will be the case. Translation of this manipulation of
product/service attribute to hearing aid attributes is much more complex. Performance of
the most meaningful hearing aid attributes cannot be as clearly predicted as expected
weather during an airline flight. For example, it is difficult to predict with certainty how
much a user will benefit when listening to speech in noise or receiving information on the
telephone. Thus, expectation of hearing aid attributes may not be as easily managed or
targeted, since attribute performance may be variable across users.
2.1.1 Cross Cultural Considerations
Studies of disconfirmation in products and service have been conducted in the United
States and in a number of other countries. Are the results from one culture applicable to
members of another cultural and or geographic area where distribution of products and
services are different? One study examined cross cultural application of the expectancy-
22
disconfirmation model by matching samples of students in the United States and Taiwan
(Spreng & Chiou, 2002). Specifically, these authors set out to demonstrate that the model
was generalizable to the Asian population in Taiwan. The authors noted that societies in
places like Taiwan, Hong Kong, South Korea, and other Asian countries demonstrated a
collective versus an individualistic culture. A collectivist society has a more close-knit
social structure and members have clear impressions of who is in the in-group and who is
not. In individualistic societies, such as in the United States, Canada, Great Britain, and
other western cultures, people are more motivated by self-interests. The authors were
particularly interested to see if the collectivist culture in Taiwan vs. the individualistic
culture in the United States might differentially influence satisfaction decision processes.
This study was a laboratory experiment using digital cameras as the product of focus. The
experiment was conducted in separate sites in the United States and in Taiwan. Both
expectations and product performance were manipulated to ensure variance in the
disconfirmation. Expectation was manipulated via varying versions of pre-use product
information. Product performance was manipulated by showing subjects photographs
purportedly produced by the camera under consideration. The photographs varied in
quality across subjects. Subjects in both sites were asked to rate expectations after
product information was shared. After viewing the photographs, subjects were asked to
rate performance and then satisfaction for the attribute of quality of the picture. Analysis
of these data confirmed the predictions of the model. Importantly, the results showing the
relationships between model constructs was not significantly different between the US
and Taiwanese groups. The authors proposed further research in this area; however, this

23
study supports the applicability of the expectancy-disconfirmation model across cultures.
The finding would be of interest to hearing aid manufacturers and audiologists serving
diverse cultures and locations. Of note, the issue of cross cultural applicability will be
mentioned later in this paper in reference to patient satisfaction studies conducted in
Israel, a Middle Eastern country with yet different cultural influences than those in the
United States or Asia (Baron-Epel, Dushenat, & Friedman, 2001) and in Hong Kong
(Wong et al., 2004). As will be evident in this paper, much of the literature on patient
satisfaction has come from research conducted in countries where administration of
health care is a governmental function. Studies showing that results are equivalent across
cultures and health care delivery help to provide a solid rationale for application of the
model to hearing aid fitting in the United States.
2.1.2 Summary
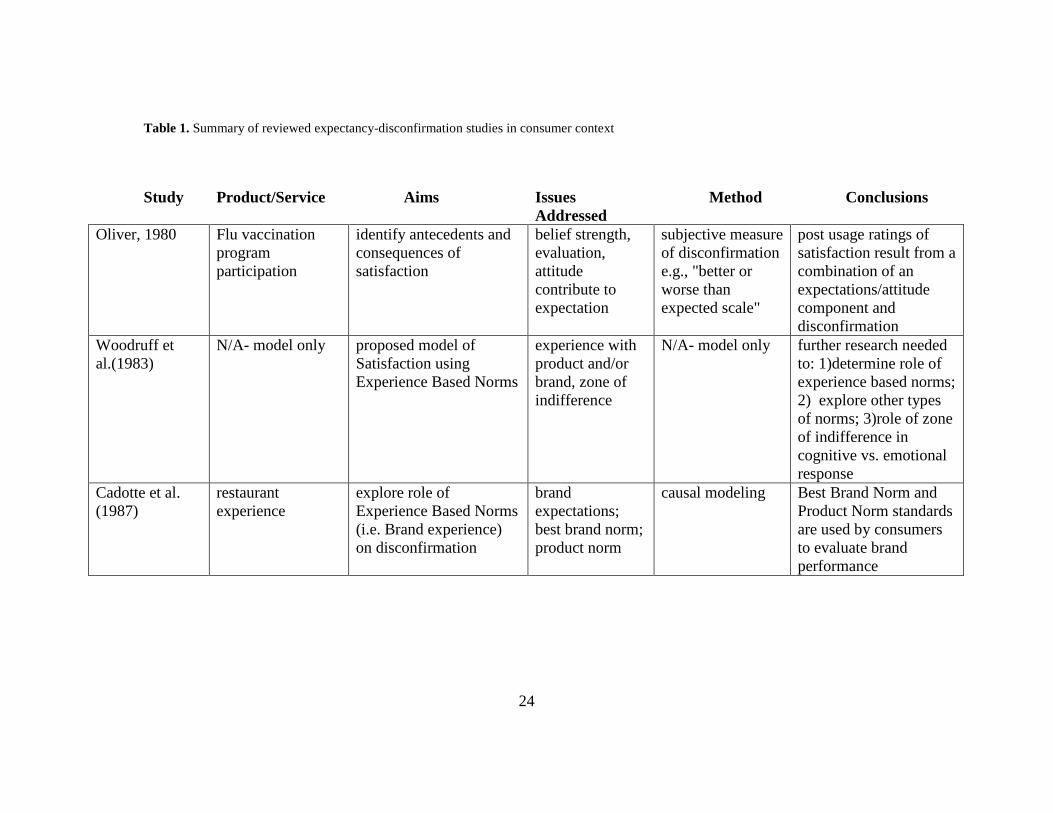
The studies reviewed so far are summarized in table 1. The methodologies and
conclusions offer direction in the application of the model if/when it is used outside of
the consumer context.
24
Table 1. Summary of reviewed expectancy-disconfirmation studies in consumer context
Study Product/Service Aims Issues Addressed
Method Conclusions
Oliver, 1980 Flu vaccination program participation
identify antecedents and consequences of satisfaction
belief strength, evaluation, attitude contribute to expectation
subjective measure of disconfirmation e.g., "better or worse than expected scale"
post usage ratings of satisfaction result from a combination of an expectations/attitude component and disconfirmation
Woodruff et al.(1983)
N/A- model only proposed model of Satisfaction using Experience Based Norms
experience with product and/or brand, zone of indifference
N/A- model only further research needed to: 1)determine role of experience based norms; 2) explore other types of norms; 3)role of zone of indifference in cognitive vs. emotional response
Cadotte et al. (1987)
restaurant experience
explore role of Experience Based Norms (i.e. Brand experience) on disconfirmation
brand expectations; best brand norm; product norm
causal modeling Best Brand Norm and Product Norm standards are used by consumers to evaluate brand performance

25
Study Product/Service Aims Issues Addressed
Method Conclusions
Churchill & Surprenant (1982)
video disc player/ chrysanthemum plant
Is disconfirmation vs. expectations/performance necessary to measure in prediction of satisfaction? Does product type affect role of disconfirmation in satisfaction formation
Interrelationships among expectations, perceived performance, disconfirmation, and satisfaction; satisfaction formation in durable vs. non-durable goods;
manipulation of performance for two products; analysis of correlations among measures from each construct
comparison processes in satisfaction vary across products and service categories
Tse & Wilton (1988)
record player Does perception of product performance, in addition to disconfirmation, influence satisfaction formation?
perceived perception of performance
manipulation of expectation and product performance; laboratory study;
found direct influence of perceived performance in satisfaction formation
Zwick et al. (1995)
personalized envelopes
What is the role of hindsight bias in satisfaction formation?
hindsight bias- tendency for people to exaggerate in hindsight what could have been expected in foresight
manipulation of expectation, comparison of foresight and hindsight expectations
Hindsight expectations (vs. foresight expectations) are higher and should be used in disconfirmation studies. Foresight expectations are more objective but less generalizable.
Table 1 (continued)

26
Study Product/Service Aims Issues Addressed
Method Conclusions
Spreng & Droge (2001)
camcorder What is the impact of expectation level alone on satisfaction formation? How does pre-purchase product information impact satisfaction?
expectation level vs. disconfirmation in satisfaction formation; satisfaction with information;
manipulated expectancy with written material, manipulated perceived performance with different quality products
providing inaccurate product information to consumers results in lower satisfaction with product information; increasing attribute expectation increased perception of attribute performance
Spreng & Chiou (2002)
digital cameras Does the disconfirmation model generalize to non-American cultural groups?
collectivist vs. individualist culture in Asian countries vs. the U.S.
manipulation of expectation and product performance; laboratory study;
disconfirmation model applies across cultures
Spreng & Page (2003)
college student advising services, camcorder
comparison of five methods of operationalizing disconfirmation
lab vs. field study, timing of expectation measurement, expectation probe questions
5 methods applied to study of one service and one product in both lab and field settings
Additive Difference Model (subjective report of expectation and perceived outcome after delivery) was best across product and service categories
Table 1 (continued)

27
2.2 FROM CONSUMER TO PATIENT SATISFACTION
As shown in the above literature review, researchers have not reached agreement that a single
expectation norm accounts for the comparison standard that is formed by consumers across all
types of products and services. Perhaps this is one reason why the conceptualization of patient
satisfaction needed to be modified from the strictly consumer focused models. For example,
none of the models we have reviewed so far have considered influence from physician or
provider affect or impact on health status or quality of life. For example, it is reasonable to
suppose that a patient’s desire for improved quality of life would have some impact on the
formation of the expectation for medical services. The next section of this paper addresses the
application of the expectancy-disconfirmation paradigm in studies of patient satisfaction.
Articles addressing the issue of patient satisfaction with health care became evident in
research literature in the 1970’s and early 1980’s (Linder-Pelz, 1982; Locker & Dunt, 1978;
Ware, Davies-Avery, & Stewart, 1978). Linder-Pelz (1982b) explained this interest as an
outgrowth of the consumer movement and recognition that satisfied patients are more compliant
and therefore have better healthcare outcomes. Patient satisfaction was seen as one of the goals
of health care delivery. The theoretical basis for studies of patient satisfaction had not been
developed (Locker & Dunt, 1978). A conceptual model of patient satisfaction would allow for
definition of the concept and more valid study of its various determinants and consequences
(Linder-Pelz, 1982b). By reviewing the body of literature on consumer satisfaction and job

28
satisfaction Linder-Pelz (1982b) put forth the definition of patient satisfaction as: “positive
evaluations of distinct dimensions of the health care” (p. 578).
Linder-Pelz’s (1982) efforts to develop a conceptual theory of patient satisfaction drew
not only from the social science literature, but also from a body of research on job and pay
satisfaction. The studies she reviewed posited a variety of theories of satisfaction. Those most
widely accepted were the fulfillment theory, the discrepancy theory, and the equity theory. These
theories varied somewhat in their approaches to exploring the components of satisfaction
however all of them involved some focus on the fulfillment of expectation (Lawler, 1971;
Vroom, 1964). Linder-Pelz concluded her work with definitions of the hypothesized
determinants of satisfaction with health care. These included: expectations; value; entitlement;
occurrences; and interpersonal comparisons. Each of these determinants was seen as a perception
with the exception of value, which is seen as an attitude. These definitions were applied to the
development of several hypotheses reflecting the social psychological determinants of patient
satisfaction as follows:
1. Satisfaction scores will be directly related to the sum of the products of beliefs
(expectations) and valuations (values) scores regarding various aspects of the care.
2. Satisfaction scores will vary positively with the extent to which perceived occurrence
concurs with prior expectation.
3. Satisfaction scores will be directly related to the perceived occurrence score less the
expectation score, all divided by the expectation score.
4. Satisfaction will vary positively with the concurrence of perceived occurrence and prior
expectation only when the object is valued

29
5. A combination of positive expectation and positive perceived occurrence will yield the
highest satisfaction scores, while positive expectation and negative occurrence will result
in the lowest satisfaction scores
As is evident above, the variable of expectations was prevalent in these early hypotheses
of patient satisfaction.
The continued development of the construct of patient satisfaction can be traced through
several articles published after the Linder-Pelz work cited above. As the construct became more
widely explored and accepted the article titles progressed from referring to the concept of
consumer satisfaction to consumer satisfaction with healthcare/medical care to patient
satisfaction (Locker & Dunt, 1978; Williams, 1994; Zastowney, Roghmann, & Hengst, 1983),
reflecting the incorporation of elements from Oliver’s earlier work.
The validity of the construct of patient satisfaction was explored extensively by Williams
in 1994. He noted that the relationship of patient satisfaction to patient compliance had long been
accepted and thus patient satisfaction was directly related to treatment outcomes. Therefore,
patient satisfaction had become an attribute of quality and a legitimate health care goal. This
notion was implemented as policy by the National Health Service in Great Britain in 1983. At
that time, managers and directors of health facilities were instructed to solicit patient perceptions
as a means of monitoring medical service quality. This idea had been promoted earlier by a well-
known author, Donabedian, in the field of quality assurance. In the often quoted words of
Donabedian (1988): “patient satisfaction may be considered to be an …element in health status
itself.” (Williams, 1994, p. 23) The resulting proliferation of patient surveys stimulated a number
of researchers to investigate the methodologies used to measure patient satisfaction. From this

30
perspective, Williams argued that the construct of patient satisfaction had to be thoroughly
validated by empirical research. In reviewing research data up to this point he highlighted a few
major concerns. First, he argued that models of consumer satisfaction used to explain patient
satisfaction had not been substantially supported in published literature. While evidence did
suggest that patient’s expectations and values were involved in evaluations, they did not appear
to be related in a simplistic fashion. Secondly, Williams questioned the assumption that patient’s
expressions of satisfaction are valid representations of approval. Williams referred to the
problem of patients assuming that medical providers are technically competent, and therefore
unable to validly rate the attribute of clinician competency. This topic will be addressed later in
this paper in regards to studies of dental patient satisfaction (Alford, 1998; Newsome & Wright,
2000). Thirdly, Williams questioned the assumption that patients will have valid expectations of
the healthcare visit and that these expectations have equivalence to consumer expectations of
products. He argued that the nature of the patient role and the power differential between patient
and clinician might inhibit valid expressions of perceived performance. Williams called for
investigations of these issues before satisfaction questionnaires could be used to judge quality of
services.
A few years later, some of William’s concerns were answered by Sitzia and Wood
(1997) in an extensive review of patient satisfaction research. In describing determinants of
satisfaction these authors noted that expectancy-disconfirmations continue to emerge as a
fundamental element of satisfaction. More specifically, the Discrepancy Model was described as
a modification of the expectancy-disconfirmation Model. The Discrepancy Model argues that
satisfaction is a relative concept, defined mainly by the perceived discrepancy between a

31
patient’s expectation and their actual experience. Other variables also are described as having an
influence on satisfaction, though none are as influential as is expectation. These other variables
include demographic characteristics such as age, level of education, gender, and ethnicity.
Additionally, these authors described some psychosocial variables implicated in expressions of
satisfaction. These relate to patient’s perceptions of their own role in the patient-caregiver
relationship. One example would be the ingratiating response bias in which respondents provide
invalid positive satisfaction responses in order to ingratiate themselves to the researchers or care
providers. Similarly, the self-interest bias occurs as patients feel that the very service under
evaluation may be threatened if negative responses are supplied. In this case the respondents
provide invalid positive responses in their own self interest in maintaining the availability of the
service. The self-interest bias is of particular concern in patient satisfaction studies conducted in
countries with government managed health care delivery, e.g., Great Britain or Canada. In these
settings respondents may fear that lower satisfaction ratings may threaten the continuation of
given health services. Another type of bias, with relevance to both health care and marketing
research is the social desirability response bias. This bias results when patients/consumers report
higher satisfaction than they actually perceived because they think that positive comments will
be more acceptable to survey administrators. It would seem that these influences, once
empirically validated, would need to be considered in any future studies using satisfaction
questionnaires. These psychosocial factors were noted to potentially influence satisfaction
ratings, though little empirical evidence of this effect was available at the time of the Sitzia and
Wood review. Recently, Steenkamp et al. (2010) reviewed literature addressing socially
desirable responding (SDR). This form of response bias was identified as one of the most

32
pervasive threats to validity of marketing surveys. The problem of response bias has been
addressed in at least one hearing aid satisfaction study and will be described in further detail in a
later section of this paper (Cox, Alexander, & Gray, 2007). The problem of controlling for these
potential response biases could pose a major challenge to future work in understanding hearing
aid satisfaction. Of note, these biases were elucidated by LaVois (1981) who referred to them as
artifacts. The use of this term implies that survey results will include these biases by the very
nature of the survey method. Though researchers need to be aware of these potentially
confounding factors it may be very difficult to control for them in a research design.
Studies of patient satisfaction often focus on the outcome of whether patients will return
to a given health care provider. This link between satisfaction with a health care provider and
intention to return to that provider is established and might be grounded in Woodruff et al’s
(1983) association of the zone of indifference and continued product use (see page 10) (Alford,
1998; Baron-Epel et al., 2001; Solomon, Surprenant, Czepiel, & Gutman, 1985). Alford (1998)
addressed three areas believed to contribute to patient satisfaction and intention to return to a
given provider. His three areas of focus included the patient’s perception of provider affect,
perceived attributions of the health care provider, and the role of disconfirmation on satisfaction
with the health care provider. This study was focused on service encounters alone. As such, no
provision of product or purchase of product was involved in this study. Based on theoretical
principles applied to each of the constructs of interest, Alford developed hypotheses to assess the
contribution of affect, attribution, and disconfirmation on patients’ repeat patronage intention.
Of interest is the method he used to operationalize each of these constructs and the approach
used to collect data. With regard to methodology this author acknowledged the trade-off between

33
control and generalizability in studies of satisfaction. He chose to conduct a laboratory study
using a scenario approach to collect the data. As described earlier in a number of studies
reviewed in this paper, this approach has been used widely in satisfaction research (Churchill &
Surprenant, 1982; Jayanti, 1996). In this case subjects were asked to watch video recorded
scenarios of dental care appointments and to imagine themselves in the place of the video
recorded patient. The dental visit scenarios were created such that positive and negative versions
of the patient encounter were created. Manipulated factors demonstrated in the videos included
service outcome (e.g., was the patient’s toothache resolved by the end of the appointment) and
provider affect (whether the dentist was likable). Disconfirmation was defined as the difference
between subjects’ expectation of how the dental visit should go, and their perceptions of the
dentist’s performance. The author did not give specific detail on the manner in which the
disconfirmation data were collected (e.g., subjective versus direct disconfirmation measurement).
Two groups of subjects each watched videotapes that portrayed either a positive or negative
encounter for the patients. The hypotheses were tested via regression analysis with dependent
variables being both satisfaction and repeat patronage intention. The results showed that affect
strongly influenced subject’s initial response to the scenarios. In other words, subjects who liked
the dentist showed more satisfaction and intention to return. Contrary to the findings in product
related studies discussed earlier in this paper, disconfirmation was not predictive of satisfaction
itself. Disconfirmation did influence intention to return. The author suggested that due to the
technical nature of health care services, patients may not feel competent to judge service quality
of medical personnel. This finding further confirmed Williams (1994) prediction that patients
may not register valid opinions. It could be the case that patients have a wider zone of

34
indifference than that illustrated in studies of consumer satisfaction (Woodruff et al., 1983). As
mentioned earlier, these findings confirmed that patient satisfaction influences intention to return
to the provider. This author summarized that affect is the primary determinant of satisfaction and
repeat patronage. The affective response comes not only from the provider but also from all
personnel involved in the service delivery, including office staff. From this perspective, the
cognitive process of perceived quality of the encounter seems to be of less importance than affect
in the health care service setting.
Alford’s results shed light on the differences that might be necessary in modeling
satisfaction in health care settings versus satisfaction with consumer products. Alford’s work has
direct relevance to hearing aid dispensing since much of this work is done within medical
settings. In applying the expectancy-disconfirmation model to health care it would seem
important to include affect in the model to account for the patient’s reaction to the personality
and style of the provider. This concept is further developed below.
Thompson and Sunol (1995) published an important and useful review of literature in the
field of patient satisfaction. Their goal was to clarify definitions and to illustrate practical models
of the relationship between expectations and satisfaction. Additionally these authors aimed to
identify the influential personal and social variables and to consider the special context of health
care. This article served to bridge theory and data from the consumer environment to that of the
health care environment.
Thompson and Sunol reviewed articles from a variety of disciplines considered
contributory to patient satisfaction. These included psychology, sociology, social policy, health
care services and management, and marketing. With regard to expectations research, they noted

35
distinct differences in the focus of interest and the desired goal from work in each of these
disciplines. These differences are summarized in table 2:
Table 2. Contribution of various disciplines in patient satisfaction research
Discipline Focus of Interest in Expectation Research
Basis for Expectation
Psychology Influence on behavior Beliefs, evaluations of beliefs
Sociology Formulation of predictions for social interaction
Construction of reality through the development of causal networks
Marketing Segment market sectors Market created materials
Biomedical Rule out placebo effect in treatment Symptomatic and physiological changes experienced by patients
Health Care Management
Quality assurance, continuous quality improvement, achievement of patient satisfaction
Preferred or anticipated outcomes, based on personal or knowledge of others’ experiences
The hearing aid fitting environment encompasses components of each of the disciplines
described above. Thomson and Sunol’s exploration of these topics offers valuable insight into
the development of an appropriate model for this subject. Their article went on to describe the
evolution of several models used to study satisfaction. Based on these models they proposed a
model that would facilitate future research of the expectation/satisfaction relationship in the
context of healthcare. These authors pointed out that the comparison of perceived outcome to
initial expectations is a cognitive process. However, there is an affective component to

36
satisfaction as the experience of satisfaction/dissatisfaction itself is emotional in nature.
Therefore, they argue, an ideal model will include both cognitive and affective components.
The model proposed by these authors is known as the Assimilation-Contrast Model of
Satisfaction and is shown below in figure 2:
Figure 2: Assimilation/contrast model of satisfaction
The concept of Assimilation-Contrast comes from the psychology literature. This refers
to a tendency for people to adjust their perceptions towards their expectations. This adjustment is
known as the Assimilation effect. At some point, when the perception is greatly different from
the expectation, people begin to exaggerate the large variation between the two. This is known as
the Contrast effect. The area of assimilation can be likened to our earlier concept of the zone of
indifference, as described by Woodruff (1983). Thompson and Sunol’s proposed model therefore

37
includes one axis addressing the initial perceived perception and another axis for the modified
perception. This modified perception occurs after the Assimilation or Contrast effect takes place.
The model defines satisfaction and dissatisfaction under the disconfirmation paradigm.
Satisfaction is shown on the vertical axis when perceptions exceed expectations and
dissatisfaction is shown along the continuum where perceptions are below expectations. As can
be seen in figure 2, satisfaction is achieved in cases where either initial or modified perceptions
exceed expectations. Note that the expectations addressed in this model are described as
predicted expectations. The authors differentiated between types of expectations, noting that
predicted expectations refer to realistic, practical, or anticipated outcome, based on what users
actually believe or deduce they should receive from health care services. This type of expectation
is in contrast to others such as Ideal Expectations, Normative Expectations, or Unformed
Expectations. Thompson and Sunol felt that this model represented three important components
of the satisfaction response. These components include the cognition-affect factor, the
assimilation-contrast effect, and the concept of the zone of tolerance.
In addition to modeling the components of satisfaction, Thompson and Sunol’s review
addressed factors that influence the development of expectations in health care settings. These
influences are categorized as personal or social influences. The personal influences include
factors such as patients’ needs, values, health care experiences, information, moods and
emotions, and perceived consequences of outcomes. In the social context, factors such as
sociodemographics, equity, social norms, and task requirements have been documented. The
authors additionally proposed that the healthcare environment is distinct from other contexts. In
comparison to other consumptive experiences, the relationship with the service provider can be

38
much longer, and may be more affective in nature. For example, a consumer involved in a car
purchase is not likely to feel the same emotional involvement as a patient seeking cancer
treatment. Moreover, the motivation to access healthcare is usually driven by a need versus a
desire.
Thompson and Sunol concluded with recommendations calling for the development of
questionnaires specifically aimed at measuring expectations in healthcare. Moreover, they
suggested that research exploring the expectation-satisfaction relationship be conducted across a
variety of health care contexts. In regard to their first recommendation, researchers in Audiology
have developed at least one psychometrically sound instrument with which to measure patient
expectations (Cox, 1999). This tool will be addressed later in this paper. With regard to
Thompson and Sunol’s call for further research across health care contexts, there have been a
number of such studies across medical fields including optometry, dentistry, pharmaceuticals,
internal medicine, hospital care, and many others (Ammentorp, Mainz, & Sabroe, 2006; Kravitz,
2001; Kumar et al., 2007; Newsome & Wright, 2000; Pager, 2004; Staniszewska & Ahmed,
1999). These studies will be reviewed later in this paper.
2.2.1 Summary of the Expectancy-Disconfirmation Paradigm
A number of theories have been put forth to explain the relationship of expectancy
disconfirmation and satisfaction. These have come from the consumer and the patient
satisfaction literature. Table 3 summarizes some of the various theories and constructs discussed
in this review. All of the theories listed here have relevance to the expectancy-disconfirmation

39
paradigm. Of note, authors have used various terminologies to refer to models which share
common constructs as noted in Table 3.
Table 3. Theories with relevance to the expectancy-disconfirmation paradigm
Theory Constructs addressed
Theory of Cognitive Dissonance (Thompson & Sunol, 1995)
Expectations, perceptions of attribute performance, assimilation effects, contrast effects
Expectancy Value Theory (Fishbein & Ajzen, 1975)
Expectations, belief strength, attribute evaluation
Theory of Expectancy Disconfirmation (Oliver, 1980)
Prior expectations, perceptions of product or service attributes, satisfaction
Fulfillment Theory (Linder-Pelz, 1982b)
Satisfaction, expectations/rewards desired, rewards received
Equity Theory (Linder-Pelz, 1982b)
Perceived equity, inputs, outputs, social comparisons, satisfaction
Discrepancy Theory (Linder-Pelz, 1982b)
Expectations, perceptions, satisfaction

40
2.3 METHODOLOGICAL CONSIDERATIONS IN PAST RESEARCH
Early work in the expectancy-disconfirmation paradigm was focused on satisfaction with
consumer products. Later, the model was applied to service encounters across a variety of
industries. Since the process of hearing aid dispensing combines both product and service
components it is worthwhile to consider this model from the service perspective as well.
Yuksel and Yuksel (2001) provided a thorough critique of the expectancy-
disconfirmation paradigm in the context of hotel and travel services. These authors explored
challenges and limitations of the paradigm in response to its wide acceptance and application in
the hospitality and tourism industry. In this industry, as in service encounters, the product is
generally experiential in nature. The outcome is essentially the positive or negative memory that
is left from a travel or restaurant experience. Though not perfectly paralleling the service and
product components of a hearing aid fitting, this information is useful as it highlighted a number
of relevant methodological considerations. Specifically, conceptual and operational challenges
relating to the expectancy-disconfirmation paradigm are summarized.
These authors question some of the assumptions and/or definitions applied by
researchers in the field in previous studies. For example, they question whether consumers do
have clear expectations of products/services on which a disconfirmation could be based.
Furthermore, they explore which types of expectations consumers use in determining satisfaction
(e.g., predictive expectations vs. values, desires, or ideals). Other conceptual challenges include
participants’ interpretation of expectation questions. If some respondents focus on personal
importance (this is not important to me so I don’t need to rate it accurately) of the probed

41
attributes while others respond from the ideal performance perspective (what would be the best
performance for the most people), survey data may not be valid. The authors gave several other
examples of these conceptual challenges and then moved on to consider operational challenges.
The operational challenges focus on logistical implementation of the research designs used in the
field. For example, should expectations be solicited prior to or after the service experience? How
can we control for response bias in survey data?
Some of the methodological challenges raised in this article, and throughout this paper,
remain unresolved in the disconfirmation literature. Others have been explored by authors in
various fields with potential solutions or explanations. Table 4 and Table 5 summarize the
challenges and provide considerations that may be useful in addressing these challenges in the
context of hearing aid dispensing. Considerations to address each challenge have been taken
from existing disconfirmation and/or hearing aid literature.

42
Table 4. Conceptual challenges and considerations in hearing aid disconfirmation research
Concept Conceptual Challenge Considerations
Pre-purchase Expectation
Without expectations, disconfirmation cannot occur. How realistic would it be to expect patients/clients to have firm expectation of all attributes prior to fitting commitment? Does the model apply across all consumptive situations?
Cox and Alexander (2000) and Kochkin (2007) data show that people have measurable expectations of hearing aids from family and friends. Schum (1999) showed that inexperienced users not only have expectations but show a significant variation in expectation level.
Meaning of Expectations
Would an expectation question signify the same meaning to everyone? E.g., Affective issues, personality, prior experiences… “do I deserve this outcome because I paid for the device..”
Vestergaard (2006) gives specific guidelines on use of questionnaires with higher face validity for new hearing aid users. Spreng and Page (2003) suggest anchor terms for attribute performance based on Additive Difference Model.
Single or Multiple Comparisons
Does customer satisfaction come from disconfirmation of expectations alone?
Thompson and Sunol (1995) and Cox (2000) show direct effect of perceived outcome on satisfaction. Perceived outcome/satisfaction relationship and/or direct expectation to perceived performance effect (Spreng & Droge, 2001)
Logical Inconsistency
Would meeting low expectations generate satisfaction as the model predicts? Why do customers report overall satisfaction when their ratings indicate service performance falling short of their initial expectations?
Need to target outcome at a high level of performance. Satisfaction with information plays a role in overall satisfaction (Spreng & Droge, 2001)
Disconfirmation Process
Does the model apply across all consumptive situations? Does evidence from studies using video cameras apply to hearing aids?
Data across health care and product/service delivery have validated the model, (Linder-Pelz, 1982;Newsome & Wright, 1999). Hearing Aid delivery represents elements of consumer and patient product and service delivery

43
Table 5. Operational challenges and considerations in hearing aid disconfirmation research
Operation Operational Challenge Considerations
Timing of the Expectation Measure
Before or after the delivery experience? i.e. “What do you expect..?” vs. “How does the outcome compare to what you expected..?”
Zwick, et al. (1995) explored foresight vs. hindsight response bias and recommend expectation measure prior to product delivery to avoid hindsight bias.
“I have a high Expectation norm”
If scores on expectations are consistently high, outcome may never exceed them
Cox and Alexander (2000) showed wide variability in expectation levels across new hearing aid users. Otherwise, would need to manipulate Expectations and/or performance in lab environment.
Possibility of misleading conclusions
Would meeting a high expectation with a high performance and meeting a low expectation with low performance signify equal satisfaction in each case?
Need to look for disconfirmation in the positive direction. Fishbein and Ajzen (1975) data show a “zone of tolerance” when performance just meets expectation. Satisfaction is not increased in this “zone of tolerance.” Direct performance/satisfaction relationship (Spreng & Droge, 2001)

44
Operation Operational Challenge Considerations
Dual Administration and possibility of response-tendency bias
Answering the same set of questions twice might bore the respondents, what is test-retest reliability on questionnaires?
Cox and Alexander (2000) data and Mormer, Kasewurm, and Palmer (2006) showed good test-retest reliability on expectation questionnaires. Could use a measure of response bias likelihood as per Cox (2007).
Data collected in Lab vs. Field
Field study of new hearing aid users won’t be able to control and/or manipulate expectations or perceived outcome. Risk lack of variability across expectations and/or outcome.
Lab study affords ability to manipulate expectations and/or outcome. Could use groups of high vs. low expectation and do quantitative analysis. Doesn’t generalize to hearing aid users’ need for adaptation over time. Field study- less control over expectation variability, but better generalization to population
As seen in Table 4 and 5, a variety of methodological issues surround the construct of
disconfirmation. Various approaches to the operationalization of disconfirmation have discrepant
results when used to predict satisfaction. One such study involved an empirical investigation of
five methods of operationalization of disconfirmation (Spreng & Page, 2003). Each method was
applied in a study of students receiving advising services. Additionally, two of the methods were
used and compared in a laboratory study of adult users of a camcorder. The laboratory study
involved the carefully controlled manipulation of expectations and performance. The results
Table 5 (continued)

45
showed that across the studies (laboratory vs. field) and across the product/service categories,
one method did appear to work better than others. This method is referred to as the Additive
Difference Model (ADM). This method is a subjective measure in which participants are asked
to report on the difference between what was expected and what was received. Anchor terms for
attribute performance using the ADM method might include: “exactly as I expected/ extremely
different than I expected.” Respondents are then asked to describe the discrepancy as either
good or bad. This measurement is very close to the conceptual definition of disconfirmation in
that the size of the expectation- performance difference is elicited and then evaluated. Other
methods assessed in this study were better (explained more of the variance in satisfaction) in
either the product or service components of the study, however the ADM method worked well in
both product and service categories. These findings have important implications for
methodological issues in studying the disconfirmation effect on satisfaction with hearing aids.
Since hearing aid fitting satisfaction is based on the perception of performance in the service and
product categories, such research should use the methodology most appropriate for both.
Another feature of the ADM method of operationalization is that it is consistent with hindsight
bias thought to be experienced by consumers in the field (Zwick et al., 1995).
2.4 EXPECTANCY- DISCONFIRMATION IN HEALTH CARE
The dispensing of hearing aids contains elements of both consumer and patient domains (Wong
et al., 2003). The hearing aid itself is a product, but it is seldom purchased off the shelf. The

46
audiologist plays an important role in the success of the hearing aid fitting by providing
expertise, information, supportive counseling, and service. It is likely that hearing aid users, as a
group, would have various views of themselves as consumers vs. patients depending on the
setting in which the hearing aids are dispensed. Some hearing aids are dispensed within medical
settings such as a doctor’s office or hospital. Others are dispensed from a private practice setting
that may look like a sales focused storefront or a department store unit. Within the hearing aid
literature, users are variably referred to as patients, clients, or consumers. In any case, this
blending of consumer and patient user characteristics leaves open the question of how and which
variant model of expectancy-disconfirmation is most appropriate to explain hearing aid
satisfaction. As mentioned earlier, there is probably variation in the expectation/satisfaction
relationship associated with different categories of products and services, and with delivery
environments (Sitzia & Wood, 1997; Thompson & Sunol, 1995).
As will be explained later, Humes (2006) noted that hearing aid satisfaction probably
results from a complex interplay of a variety of factors. These might include severity of hearing
loss and perceived handicap. These factors would not come into play in a strictly consumer
focused model, but would in the patient satisfaction domain, where an impaired body system is
the primary motivating factor in service or product seeking behavior. In addition to seeking
improved communication across a variety of listening challenges, the prospective hearing aid
user is assessing factors such as cosmetics, comfort, relationship with provider, ease of access to
service, and perceived value (Abrams & Hnath-Chisolm, 2000; Kochkin, 2007). These attributes
of the hearing aid experience extend beyond those typically seen in a pure product purchase or in
a purely medical service environment, and may require a model that combines elements common

47
to both of these areas. From that perspective it is worthwhile to look at ways in which the basic
expectancy-disconfirmation model has been applied to a variety of health related disciplines.
Towards this end, an attempt was made to search the literature from health related disciplines
where products are integral to the treatment process. Specifically, the search for this literature
began with a focus on professional services thought to share common elements with Audiology
and hearing aid dispensing. Other criteria for this search included service characteristics such as:
product could be purchased off the shelf; requires active patient compliance for successful
outcome; involves some third party reimbursement; requires ongoing maintenance; affects
personal image; and involves a high level of expense. As the search progressed, it became clear
those disciplines thought to be most like Audiology did not have published literature in which
the expectancy-disconfirmation paradigm was addressed. For example, no such studies were
found in areas such as wheelchair fitting or Orthodontics, though each of these fields has
addressed issues of expectations. Therefore the search was expanded to include health care
contexts that did not necessarily parallel Audiology per se. Professions such as Dentistry and
Pharmacy were found to have used the expectancy-disconfirmation approach to understanding
patient satisfaction. Similarly, many related articles in internal medicine, vision correction, and
inpatient hospital satisfaction were found. Articles from other related disciplines were included if
their contents appeared to offer meaningful contributions to application in hearing aid fitting.
Table 6 summarizes the health related services reviewed and the relevant elements in each
field/service. The final column in Table 6 indicates whether the expectancy-disconfirmation
paradigm has been expressly studied in the context of that discipline.

48
Table 6. Aspects of various health services compared to hearing aid dispensing
Buy Off Shelf
Requires High Patient Compliance
3rd Party Reimburse- ment
Ongoing Maintenance
Personal Image
High Out of Pocket Expense
Expectancy/Dis confirmation Literature found?
Hearing Aid Fitting YES YES YES YES YES YES MINIMAL Orthodontics NO YES YES YES YES YES NO Dentistry NO YES YES YES YES YES YES Vision Correction
NO YES YES NO YES YES YES
Pharmacy YES YES YES NO NO YES YES Wheelchair Fitting
YES YES YES YES YES YES NO
Ped Hospital Care
N/A YES YES YES N/A NO YES
Primary Care Office Visits
N/A N/A YES NO N/A N/A YES
Cardiac Care
NO YES YES YES NO NO YES
Emergency Department
NO YES YES N/A N/A YES YES

49
The next section of this paper reviews, when available, examples of the application of the
expectancy-disconfirmation paradigm across the settings noted in Table 6. Literature from
Dentistry offers some good examples of such an application. Newsome and Wright (1999a,
1999b, 2000) provided a broad review of the way patient satisfaction had been perceived in the
dental literature since the 1980’s. At that time, dental researchers had focused on the role of
patient perceptions of dental service attributes and on the socio-demographic factors contributing
to satisfaction formation. These authors drew from the expectancy/ disconfirmation literature to
explore the construct of patient satisfaction. Newsome and Wright (2000) conducted a pilot study
to investigate how patients evaluate dentists. They aimed to refute the notion that satisfaction
with dental services can be explained simply as an aggregate reaction to patients’ perceptions of
dental service attributes. In particular, the attributes they addressed were: technical competence,
interpersonal factors, convenience, costs, and facilities. Notably, all of these factors are
important to satisfaction with hearing aid dispensing services (Cox & Alexander, 2000; Kochkin,
2005a). Newsome and Wright used qualitative research methods to gather their data. They
recruited participants into focus groups that were systematically interviewed regarding previous
dental visits. Through open ended questions participants were probed on their opinions on past
visits and the process of judging dental care received. Interviews were tape recorded and
transcribed for analysis. Analysis involved the coding of interview transcripts into thematic
concepts. The results were displayed as a code map used to further examine the content.
These authors reported an array of findings in regard to various attributes of the dental
care experience. One prominent finding, consistent with that addressed previously in this paper
(Alford, 1998; Williams, 1994), relates to the assumption that patients use perception of

50
technical competence as a factor in judging satisfaction. In this study, patients tended not to
believe in the legitimacy of their own evaluation of dental skill. One theme that did recur
throughout the study interviews was that of the relationship with the dentist. This was expressed
using words such as trust, faith, and confidence, or the lack thereof. In line with the
disconfirmation theory, analysis of the focus group data did reveal consistently that
disconfirmation of patient expectations does take place. This finding was based on repeated
references to what patients expected prior to visits and their judgments of the perceived outcome.
A number of participants reported dissatisfaction when office procedures or outcomes did not
match pre-visit expectations. In those cases, the participants were directly questioned as to
whether they would have been more satisfied if better information had been available from
which to form more accurate expectations. In addition to demonstrating the disconfirmation
effect this study revealed the role that patient attribution makes in satisfaction formation.
Attribution refers to the source of which the patient ascribes the outcome. For example, some
participants reported unsatisfactory outcomes but general satisfaction with the dentist. This
occurred when the concepts of duty and culpability were taken into account. In other words, the
patient may blame him or herself when an outcome is less than desired. In such a case, overall
satisfaction may remain positive. On the other hand, when a patient believed the dentist to be
culpable for the failure of a desired outcome, satisfaction was reduced. Other perceptions
considered by participants in this study included the dentists’ and staffs’ attitudes and behaviors,
cost factors, and physical characteristics of the office. The authors concluded that patient
evaluation of dentists is a complex process that includes patient perceptions and expectations and

51
beliefs. These authors went on to tout the potency of qualitative methodology in exploring the
topics around patient satisfaction.
Staniszewska and Ahmed (1999) had previously used a qualitative approach to define
satisfaction with inpatient and outpatient care of cardiac patients. Their study explored the
concepts of patient expectations and satisfaction from the patient perspective. These authors used
a Content Analysis technique applied to interviews with patients before and after care. The
authors felt that efforts to elicit satisfaction ratings should not use closed set response formats.
Alternatively, as they probed satisfaction via interviews, participants described their experiences
in their own natural language. As such, the term satisfaction was not used by the interviewer.
Interviewers asked patients to describe their experience of care. This technique was drawn from
Williams (1994) who stressed that closed set questionnaires could limit patients’ responses and
could obscure patients’ true desires and values. Interestingly, during the post care interviews, it
was noted that patients tended to describe their care by comparing it to their initial expectations.
They rarely used the word “satisfaction.” Though not empirically supporting the expectancy-
disconfirmation model, this study corroborated some of the types of expectation reported in the
literature (e.g., expectations of the doctor’s affective behavior; expectations of outcome,
expectations of nurses’ advice and information giving) (Thompson & Sunol, 1995). Additionally,
the evaluative process of comparing experience to expectations was illustrated. Participants were
noted to consistently express their opinions of the treatment experience in terms of how it
compared to their initial expectations. It could be useful to incorporate techniques such as
Content Analysis in future studies of hearing aid satisfaction.
52
Thompson and Yarnold (1995) tested the disconfirmation paradigm in the context of
perceived waiting time in a hospital Emergency Department. Unlike other service attributes
waiting time is easily quantified in hours and minutes. Thus, there is little subjectivity in
assessing the expectation or the actual outcome in this context. These authors proposed that,
based on the expectancy-disconfirmation model, patients who waited longer than expected in the
emergency department would be dissatisfied. Those whose wait matched their expected waiting
time would be satisfied and those whose wait was shorter than expected would be the most
satisfied. Telephone follow up surveys were conducted on patients who had been seen at a
community hospital Emergency Department, two to four weeks previously. These authors used a
subjective disconfirmation technique. As such, during the telephone interview patients were
asked if the time they waited to be seen by the doctor was shorter than expected, as expected, or
longer than expected. They also were asked to describe their emergency department experience
as poor, fair, good, or excellent. Consistent with the disconfirmation paradigm, patients in this
study were least satisfied when waiting times were longer than expected, were relatively satisfied
when waiting times were as expected, and were highly satisfied when waiting times were shorter
than expected. The size and direction of disconfirmation had a greater influence than the wait
time itself. However, it is possible that the reported disconfirmation was influenced by the
experience itself, as per Zwick (1995) and Yuksel (2001). There are other factors that influence
the satisfaction of an emergency department visit, however those factors were not considered in
this study.
Vision correction is an area that draws many parallels to hearing aid dispensing. For
one, satisfaction is derived from perceptions of both service and product. Another common

53
feature of hearing aid fitting and vision correction is the application of both objective and
subjective measures of function used in both professions. Visual acuity testing in optometry
parallels audiometric testing in audiology. Each of these procedures is a quantitative measure of
sensitivity and acuity. Similarly, patient concern, individual needs, and subjective reports of
function are primary factors in treatment plans for both of these professions. Pager (2004)
measured the contributions of patient understanding, expectations, and ultimate outcome versus
expectation-discrepancy in the formation of patient satisfaction with cataract surgery. This
research was conducted on patients who were scheduled for cataract surgery at a private hospital
in Sydney, Australia. Preoperatively, participants had their visual acuity measured, and visual
function assessed via the VF-14 questionnaire. The VF-14 questionnaire is a widely used
instrument that provides an index of functional visual ability (Cassard et al., 1995). After
completing the VF-14 describing current function, subjects were asked to again complete the
questionnaire rating their expected postoperative function for each of the items. Additionally,
participants were shown a video explaining either the anatomy of cataract or the procedures
conducted during cataract surgery. Neither of these videos contained content that was meant to
influence expected outcome. One month postoperatively, these subjects were asked to answer
the questions on the VF-14 and to rate overall satisfaction with the procedure. In addition to the
post-operative data described above, these subjects were asked to rate their degree of
understanding of the cataract procedure. Analysis of these data was conducted via correlations
and multiple regression analyses. Spearman correlations were used to assess the relationship
between overall satisfaction and expected or achieved visual function. Multiple regression was
used to measure the contribution of postoperative function, improvement, and expectation-

54
outcome discrepancy (disconfirmation) toward predicting satisfaction. Additionally, t tests were
used to compare the measured outcomes from the groups exposed to the different informational
videos and no difference between groups was measured. A multiple regression of the significant
predictors of patient satisfaction was conducted. Expected improvement, actual improvement,
and expectation-outcome discrepancy (disconfirmation) were all moderately correlated with
satisfaction, supporting earlier findings in the consumer model that satisfaction is complex and
multidimensional (Cadotte et al., 1987; Linder-Pelz, 1982; Tse & Wilton, 1988). Of note, when
controlling for all other factors the expectation-outcome discrepancy was the significant
independent determinant of patient satisfaction. In this condition, neither actual improvement nor
actual outcome in visual function significantly correlated with overall satisfaction. If visual
function after cataract surgery is thought of as a product, these results run counter to Tse and
Wilton’s 1988 findings of the direct influence of perceived product performance in satisfaction.
The difference here might be explained by the conceptual differences between the purely
consumer/product focused versus patient/treatment focused models. In any case, the results of
the cataract study support the applicability of the expectancy-disconfirmation model to visual
correction via cataract surgery. This study might offer an appropriate design model for a similar
study with hearing aids.
It is reasonable to draw parallels from cataract surgery and visual function to hearing aid
fitting and auditory function. Similarly, pharmacy services and products are congruent with
elements of audiology services and hearing aids. Ho et al. (1997) applied the disconfirmation
model to satisfaction with Over-the-Counter (OTC) medications. These authors further expanded
on the expectancy-disconfirmation model by explaining factors such as product ambiguity,

55
involvement, and perceived risk in the formation of the satisfaction response. These factors are
described below.
Product ambiguity refers to the acknowledgement that consumers have no prior
experience with some products or brands on which to accurately base reasonable expectations.
Particularly in the case of unfamiliar products or services, they will have inaccurate or poorly
informed expectations about brand or product attributes. The most accurate means of discerning
product performance is via knowledge or familiarity with that product category, usually through
one’s own experience (Sujan, 1985). Without product knowledge or prior experience it may be
difficult for consumers to evaluate quality and or performance, particularly in products or brands
having disparate or noncomparable attributes. New medications, like first time hearing aid
fittings or cataract surgery, can be thought of as highly ambiguous transactions. Note that the
lack of experience on which to base expectations was noted earlier by Thompson and Sunol
(1995).
The next factor described by Ho et al. is referred to as product involvement. This refers to
the extent to which consumers assign greater or lesser personal relevance or importance to
certain product categories. The motivation to pursue relevant information about a product or
brand is higher when there is a high level of involvement. Therefore more highly involved
consumers are generally more knowledgeable. One study on this topic found that more highly
involved consumers apply more complex rationalization when a product fails to meet expectation
(Somasundaram, 1993). Ho et al. (1997) purported that both ambiguity and involvement would
influence perception of performance.

56
Perceived risk is defined as the perception that a choice may result in an outcome that is
less than desirable. As such, perceived risk is closely related to involvement. Generally,
consumers seek purchases with the intent to lower the overall perceived risk of product use.
Based on work in Prospect Theory it appears that consumers who have incurred prior losses will
tolerate less risk as they face prospective purchases (Kahneman & Tversky, 1979).
Ho et al. (1997) considered that consumer decisions involving one’s health would
necessarily be highly involved and often ambiguous, and that an individual’s perceived risk
would be a salient factor in the evaluation of health related products. Earlier studies have shown
that in high ambiguity/high involvement situations, the effects of expectation and
disconfirmation should be great (Yi, 1993). Risk perception can be magnified under such
conditions. Based on these premises Ho et al. tested six different hypotheses measuring the
influence of expectations on satisfaction, either directly or indirectly. Data were collected using
questionnaires aimed at quantifying five different constructs in a modification of the expectancy-
disconfirmation model. These constructs included expectation, disconfirmation, perceived
performance, consumer satisfaction, and perceived risk. These authors used structural equation
modeling (SEM) in an attempt to test relationships between the measured constructs. The SEM
method tests relationships via model paths and allows for an overall test of model fit, using both
multiple regression and factor analysis (Hair, Anderson, Tatham, & Black, 1995). The results of
this analysis showed that these authors’ model, which included the perceived risk factor, had a
very high Goodness of Fit Index (GFI) of .955. Additionally, all of the model paths had
significant values in the expected direction, confirming the hypotheses for the relationship
between expectations and the other constructs. This model was accurate in predicting the

57
relationships between the constructs, confirming that this variation of the expectancy-
disconfirmation model successfully predicted satisfaction when applied to OTC drugs. One
interesting aspect of the methodology used in this study relates to the measurement of
disconfirmation. These authors measured the disconfirmation subjectively, by asking participants
to rate the level at which product performance met the pre-purchase expectation. Actual pre-
purchase expectations (foresight expectations) were not directly measured. Recall that, according
to Zwick, direct measure of disconfirmation, whereby expectation is measured prior to purchase
and performance is measured post use, yields a more objective (though not necessarily valid)
measure, as the influence of hindsight bias is minimized (Zwick et al., 1995). This question of
methodology is yet unresolved, as there seems to be a tradeoff between validity of the measure
and generalizability of the results.
Kumar et al. (2007) studied the association of consumer expectations, experiences
(perceived outcome), and satisfaction with newly prescribed medications. Additionally, they
examined the relationship of satisfaction and intent to continue use of medication. This study
showed a clear application of the expectancy-disconfirmation model. The study used surveys
administered prior to patients’ purchase of a new medication and then one month after
medication use. The first survey probed medication related expectations. The post-use survey
was used to evaluate the medication experience, satisfaction, and intent to continue use. The
disconfirmation was measured as the difference between the subjects’ expectations of the
prescribed medication and their reports on the medication experience. The patient’s report of the
medication experience conceptually parallels the performance outcome described previously in
some of the consumer/product focused studies. In this study the authors measured expectations

58
and experience via a questionnaire they created and tested in a pilot study. Satisfaction was
measured via a previously developed and tested instrument known as the Treatment Satisfaction
Questionnaire for Medications (TSQM). These authors used a combination of Structural
Equation Modeling (SEM) and factorial analysis to analyze the effect of the disconfirmation on
satisfaction. Interestingly, they did not find a significant interaction effect between expectations
and experiences and satisfaction. The authors recognized that this could have been due to very
similar expectation and experience scores. In other words, subjects in this study seem to have
had very accurate expectations of the medication experience they would encounter. As a result
of that accuracy expectations for this sample were generally met, and a disconfirmation effect
was not observed. These authors did not provide subjects with specific medication information
prior to the measurement of expectations. However, the subjects demonstrated realistic
expectations that were realized after the medication use. The authors recognized some design
limitations in this study that could have explained these unexpected results. Most of these
explanations focused on possible response biases and the timing of survey administration. This
article illustrates some of the design challenges in a study of this nature. One such issue relates to
the need to establish a wide enough range in values for expectation, performance, and
satisfaction scores in the study sample in order to establish correlational relationships. Another
problem in this study was that surveys were given to patients to fill out at home or on the
internet. There was no verification that the expectation questionnaires actually were completed
prior to beginning use of the medication. The authors suggested that the lack of disconfirmation
could have been due to participants answering the expectation questionnaire after they had
already experienced the medication effect. Both the Kumar et al. (2007) and Ho et al. (1997)

59
studies offer good examples of the application of the disconfirmation model and possible pitfalls
to avoid in the design process.
Since the provision of audiologic care falls within the category of health care service it is
appropriate to include a review of the disconfirmation model as applied to physician office visits.
As the physician and patient share the mutual goal of optimizing the patient’s health, the
audiologist and patient share the mutual goal of optimizing the patient’s communication
potential. One study used telephone interviews to patients who had recently visited their primary
care physicians (Baron-Epel et al., 2001). These authors were most interested in examining
patients’ selection of, and continuity with, primary care physicians. In addition to looking at
participants’ perceived expectations of their physicians they also measured intention to change
physician. The relevance of this work relates to the relationship between the caregiver and the
patient, a known factor in satisfaction with audiology services (Kargas & Doyle, 1996). Further
relevance is found in this study’s focus on the patient- physician relationship. This relationship
has been identified as a determinant of patient compliance which is one of the goals of achieving
satisfaction (Garrity, 1981). These authors conducted telephone interviews of patients who had
seen their primary care physicians within the prior two months. Respondents were asked to
report on the initial expectations of the physician visit and the perceived fulfillment of
expectations. The expectations were focused on 11 attributes drawn from literature on the
patient-physician relationship. Following the expectation questionnaires subjects were asked to
rate their satisfaction with the visit globally, and on a variety of aspects. Analysis was conducted
via calculation of Spearman’s Rho rank correlations between satisfaction and perceived
fulfillment of expectation (disconfirmation). For attributes where the perceived fulfillment of

60
expectation was very different from the expectation (large negative disconfirmation) there were
no significant correlations with satisfaction. Some attributes (e.g., diagnosis of the problem;
preventive health care counseling; answering questions) did show a statistically significant
correlation between the disconfirmation and satisfaction; however the strength of association was
small. These authors did find that the correlation between perceived fulfillment and satisfaction
was much higher than that between disconfirmation and satisfaction, particularly in attributes
reflecting patient-physician communication (e.g., answering questions; listening to problems;
explanation and discussion). To summarize, this study did not strongly support the expectancy
disconfirmation relationship demonstrated in the consumer model. The variable described as
fulfillment (perceived performance) explained more of the satisfaction variable than the
disconfirmation itself. The discussion that follows the data analysis in this article brings to light a
number of potential limitations in directly applying these results to the patient- physician
experience in the United States. Notably, this study was conducted in Israel where medicine is
socialized and patients have less choice and /or ease in choosing or changing physicians. As
such, there is a much lower rate of registered patient complaints regarding physicians in Israel
versus the United States ( 22% versus 52%) (Shuval, 1992). Further, the study authors point out
that, in general, the consumer role is not parallel to that of a patient role. Where the patient role
has traditionally been one of passivity, the consumer role implies a degree of power in decision
making. Particularly when patients are sick they may take on a less evaluative stance toward the
care giver and could express greater levels of satisfaction. This explanation supports the
prediction of Thompson and Sunol (1995) described earlier in this paper. It is possible that the
application of the expectancy-disconfirmation model may not be fully appropriate for predicting

61
satisfaction in the patient-physician experience, particularly when it is not evaluating a product
or service outcome.
A recent study conducted in Denmark further explored the relationship between the
fulfillment of expectations and satisfaction with pediatric medical care (Ammentorp et al, 2006).
In the pediatric context patient satisfaction is based on feedback from parents of patients. As per
Sitzia and Wood (1997), these authors addressed patient priorities in their expectancy-
disconfirmation model. Prior research conclusions in this area had supported the importance of
the caregiver communication and information sharing role in the formation of patient satisfaction
(Ammentorp et al., 2006; Homer et al., 1999). As such, the authors adapted Oliver’s (Oliver,
1993) model to address this as a patient priority. Additionally, based on Thomson and Sunol
(1995), they included other experiences and patient characteristics as contributions to
satisfaction. The resulting model (Figure 3) was tested in this study.
Figure 3. Relationships of expectations and priorities to satisfaction

62
Surveys were used to measure expectations and priorities for parents whose children were
admitted as inpatients in a pediatric hospital unit. Follow up surveys were administered after
discharge to assess experienced performance and satisfaction. Correlations were calculated
between scores for disconfirmation (fulfillment of expectation) and satisfaction. The authors
reported that a significantly high correlation between disconfirmation and satisfaction was
observed, indicating that parents who were highly satisfied had a proportionately positive
disconfirmation of the experience. Additionally, regression analysis was conducted with high
priorities/low priorities and satisfaction/dissatisfaction as dependent variables. As per the model,
certain patient characteristics and priorities were better predictors of satisfaction than others. For
example, having confidence in the doctors was associated with having an above average
satisfaction score. Other priorities associated with high satisfaction included the opportunity to
get answers to questions and behaviors of nurses and physicians.
To summarize, these authors found that the patient’s (parent’s) confidence in the
caregiver and approval of the caregiver’s behavior made significant contributions to the level of
satisfaction with the care given. Additionally, results were consistent with the disconfirmation
model. These findings support the affective component described earlier, suggesting that a model
used to predict hearing aid satisfaction should likely include an element representing the
patient’s perception of the clinician’s behavior.
As can be seen from review of the above studies, evidence in the health care
literature implicates disconfirmation as a factor in satisfaction. Clearly satisfaction is
multidimensional and the design of research in this realm must be carefully formulated. Table 7
summarizes the aims, methods, and conclusions of the articles discussed above.

63
Table 7. Expectancy-Disconfirmation research on satisfaction in health care
Study Product/Service Aims Issues Addressed Method Conclusions Alford (1998) dental services What are the roles of
perceived provider affect, attributions of the health care provider, and disconfirmation with the service encounter in a health care setting?
Difference in contribution to disconfirmation in health care vs. consumer setting.
lab study; videotaped patient scenarios
perception of provider affect is strongest predictor of satisfaction and intention to return
Ammentorp et al. (2006)
pediatric inpatient care
Examine relationship between fulfillment of expectations and satisfaction for parents' of pediatric inpatients
Parental/patient priorities may influence satisfaction.
survey of priorities, pt. characteristics, and expectations upon admission, survey of experienced performance and satisfaction post discharge; correlational study
significant correlation between disconfirmation and level of satisfaction; confidence in caregiver and access to information from caregiver strongly influenced satisfaction
Pager (2004) cataract surgery What is the contribution of patient understanding, disconfirmation, and percieved outcome to satisfaction?
influence of information, level of expectation, outcome
conducted in field, correlational study of each factor with satisfaction
Disconfirmation was the significant independent determinant of patient satisfaction.
Ho et al. (1997)
OTC drugs What influences play a role in health related products vs. consumer products?
product ambiguity, involvement with product, perceived risk
Structural equation modeling, data collected in field.
Model including product ambiguity, involvement, and perceived risk showed very high goodness of fit index.

64
Study Product/Service Aims Issues Addressed Method Conclusions Kumar et al. (2007)
prescription medications
Test disconfirmation model on patient satisfaction with prescribed medications, effect of disconfirmation on satisfaction
design challenges e.g., expectations and experience levels were consistent across participants, leaving little disconfirmation
Pre-purchase and post purchase surveys. Structural equation modeling/ factorial analysis, data collected in field.
No significant interaction effect between expectations, experiences, and/or satisfaction. DID NOT find disconfirmation, so could not measure effect of disconfirmation to satisfaction.
Baren-Epel, Dushenat et al.(2001)
primary care physician office visits
Is disconfirmation related to satisfaction and intention to return to primary care physicians?
consumer vs. patient role, potential differences in socialized vs. privatized medical systems
telephone interviews post physician visit.
relationship between perceived performance and satisfaction stronger than disconfirmation and satisfaction
Thompson and Yarnold (1995)
Emergency Department waiting time
determine the association of patient satisfaction with waiting time perceptions and expectations
application of the disconfirmation paradigm in the service encounter setting of a hospital emergency department
Telephone interviews after the service encounter. Analysis via optimal data analysis software yielding predictive value of the model
Greatest satisfaction resulted when waiting times were shorter than expected, less satisfaction when results were same as expected. Results support the disconfirmation paradigm.
Newsome and Wright(2000)
dental services determine if disconfirmation of expectations play an important role in formation of dental patient satisfaction
attributional concepts of "duty" and "culpability"
Qualitative study using focus group interviews with code mapping of interview content
Dental patient satisfaction is more complex than just perception of outcome, and includes expectation and belief components.
Staniszewska and Ahmed (1999)
care of cardiac patients
explore concepts of expectations and satisfaction from patients' perspective
variability of expectations across patient groups
Content Analysis of interviews via coding and classification of terms
Identified types of patient expectations as: predicted expectations; normative expectations; unformed expectations
Table 7 (continued)

65
2.5 EXPECTATION/SATISFACTION RESEARCH IN AUDIOLOGY
The last section of this paper reviews some of the explorations into hearing aid expectations
and/or satisfaction within the audiology literature. Authors have explored this topic from a
variety of perspectives. Some of this literature has focused on describing levels of satisfaction
among new and experienced hearing aid users and/or analysis of the factors that most strongly
contribute to satisfaction (Bentler, Niebuhr, Getta, & Anderson, 1993; Brooks & Hallam, 1998;
Hosford-Dunn & Halpern, 2001; Humes, 2003; Kochkin, 2005b). These studies have used a
variety of methodologies and focused on an array of factors such that no consistent evidence of
any predictive factor(s) in satisfaction has emerged. Additionally, the psychometric properties
of some of the satisfaction instruments used in these studies have not been tested adequately.
Valid comparison of results across studies is thus challenging. This review is focused mainly on
articles addressing the relationship of expectations and satisfaction in hearing aids. For an
extensive review of the hearing aid satisfaction literature in the last twenty five years see Wong
(2003).
A few studies have examined the relationship of hearing aid expectations to satisfaction
(Cox & Alexander, 2000; Jerram & Purdy, 2001; Kochkin, 2005b; Schum, 1999; Vestergaard,
2006). Wong’s (2003) review of the hearing aid satisfaction research directed future research
towards the extensive theoretically based literature in both consumer and health care satisfaction.
Since then, two published studies have been drawn from the theoretical basis of the expectancy-
disconfirmation paradigm to examine satisfaction with hearing aids (Wong, 2004; Wong,
Hickson, & McPherson, 2009). The above mentioned articles will be discussed in more detail in

66
the section that follows. Review of these articles will bring to light methodologies and
measurement instruments used in the investigation of hearing aid expectations, outcomes, and
the expectation/satisfaction relationship.
Schum (1999) investigated the relationship between expectations and benefit, an outcome
that is related to, but not the same as, satisfaction. This work included an analysis of the
variability across patients’ expectations for hearing aids. The author created a tool called the
Hearing Aid Needs Assessment (HANA) in order to explore the relationship between expected
and perceived hearing aid benefit. The HANA probes patients’ ratings of communication
difficulty across a variety of listening conditions. This tool was meant to be used as a companion
instrument with the Hearing Aid Performance Inventory (HAPI) (Walden, Demorest, & Hepler,
1984). The HAPI is a survey meant to capture patient self-report of hearing aid benefit. Items on
the HANA were derived from the HAPI so that comparison of pre-purchase needs and post-fit
benefit could be achieved. This instrument was administered on new and experienced hearing
aid users. Users were asked to rate their pre-purchase and expected communication performance
in a variety of listening situations. Eleven listening situations were grouped into four subscales
describing the communication conditions as follows: speech in quiet; speech with no visual cues;
non-speech material; and speech in noise. Because this study was focused on benefit versus
satisfaction the questions probed only the communication domain and did not address other
product attributes such as expected cost, service, or cosmetics. Hearing aid benefit is known as a
related, but separate, dimension of hearing aid success (Jerram & Purdy, 2001). A three point
scale (hardly ever, occasionally, frequently) was used for responses. Though not directly
measuring disconfirmation, Schum’s analysis revealed a number of findings relevant to that
67
topic. Expectation of post fit performance was rated by both experienced and inexperienced
hearing aid users. Experienced users had significantly higher expectations than new users in
three of the four subscales (speech in quiet; speech with no visual cues; non-speech material).
For the speech in noise subscale expectations of experienced and new users was the same.
Additionally, this author noted significant variation between subjects on expectation ratings, as
demonstrated by relatively large standard deviations. This finding could have implications for
future studies designed to test the expectation -satisfaction relationship. This author compared
expectations to the report of benefit (perceived performance). The data showed that overall
expectations were higher than the self-reported benefit. From the standpoint of the consumer
model of satisfaction, this illustrates a negative disconfirmation in this sample of hospital hearing
clinic patients. Additionally of interest, the author administered the expectation questionnaire to
office patients who were seeking information about possible hearing aid fitting. Eventually these
subjects divided themselves into groups of purchasers and non-purchasers. Analysis of the
expectation level data from each of these groups showed no significant differences. This point
may be useful in understanding that high expectations alone may not directly explain hearing aid
purchase behavior or satisfaction. In general, expectations were not highly correlated with
perceived benefit in this study, leading the author to conclude that the ultimate success of a
hearing aid fitting cannot be predetermined by needs or expectations. From the disconfirmation
perspective, the lack of correlation between expectations and benefit (perceived performance)
argues that future studies may need to create a range of disconfirmation with which to test
correlations with satisfaction. The author summarized that clinicians need to focus more on
establishing realistic expectations for potential users in all listening situations. He concluded that

68
the factors most important to hearing aid success are probably more related to patient counseling
and management issues than to other predictive variables. This view supports the notion that
hearing aid satisfaction is not strictly parallel to consumer satisfaction per se.
Cox and Alexander (2000) explored aspects of hearing aid expectations and the
expectation/satisfaction relationship. One goal of this study was to establish reality based norms
for post-fit expectations of hearing aid attributes. This was accomplished by asking experienced
users to rate aspects of hearing aid performance, service, and cost on a seven point scale. This
scale was referred to as the Expected Consequences of Hearing aid Ownership (ECHO). This
study included an analysis of demographic variables related to the participants and no effect was
found for the demographic variables. Of note, one group of participants was veterans who did
not pay out of pocket for their hearing aids. Significantly, their responses to the hearing aid
performance questionnaire were no different than that of users who had purchased their hearing
aids at a typical retail price. This study established a reference point toward which clinicians
could adjust naïve patient expectations via counseling.
Another aim of this study was to compare expectations of first time users to the reports of
perceived hearing aid performance by experienced users. By comparing novice and experienced
users on these scales this study clearly demonstrated that novice hearing aid users did not have
realistic expectations about hearing aids across the four assessed domains. To further probe the
use of expectation ratings, these authors measured the test-retest reliability of participant
responses on their expectation questionnaire. The results showed that prospective hearing aid
users’ expectations of hearing aid attributes are relatively stable during the period before the

69
hearing aid is dispensed and used. This finding was later demonstrated (Mormer et al., 2006)
using a different expectation instrument.
The last phase of Cox’s study involved an investigation of the relationship between
expectation level and satisfaction level, as measured by the ECHO and the Satisfaction with
Amplification in Daily Life (SADL) questionnaire (Cox & Alexander, 1999). Specifically, these
authors were looking to see if high expectations were directly associated with high satisfaction,
low satisfaction, or were unrelated to satisfaction. This relationship was explored in four
domains of hearing aid use. In the Positive Effect domain a moderate positive correlation was
found, indicating that those participants with higher Expectations for psychological and
psychoacoustic benefit from the hearing aid tended to show higher satisfaction after being fit.
The other domains under investigation included Service and Cost, Negative Features, and
Personal Image. No clear correlation between expectation and satisfaction was demonstrated in
these domains. Though the authors controlled for a variety of factors that could have influenced
group results, this study did not include verification of amplification characteristics in the
hearing aids worn by participants. This would be an important factor to address in future
investigations of the expectation-satisfaction relationship. This research made an important
contribution to the understanding of the expectation-satisfaction relationship in a number of
ways. The ECHO tool made it possible to document the unrealistic expectations of naïve hearing
aid users. The development of the ECHO and the SADL, and the well designed and tested rating
scales associated with each, provided a valid means by which to operationalize these concepts.
The authors’ analysis of naïve users’ expectation across domains showed clear differences in
means, however means based on global scores across domains appeared quite similar. This study

70
illustrated the importance of assessing expectations in a variety of hearing aid attributes rather
than based on a global expectation score.
Cox and Alexander (2001) further contributed to the methodology of hearing aid
satisfaction research when they explored the relationship between SADL scores and a traditional
single-item satisfaction measure. This investigation was partially motivated by the fact that the
word “satisfaction” is not actually used anywhere in the SADL questionnaire. The authors
conducted a multi-site study and collected data from a large group of patients. Subjects recorded
SADL ratings along with the single-item rating and the correlation computed between the two
measures was strong (.76). The authors noted that though the SADL provides much of the
information obtained in the single-item measure, there were subjects from whom the single item
measure yielded otherwise undetected dissatisfaction. In other words, in the absence of an
overall single-item probe, aspects of the hearing aid experience may not be addressed when a
multi-item questionnaire is used. This could happen if the subject is greatly dissatisfied with the
fit of the earmold in the ear, an item that is not addressed in the SADL. Based on the findings of
some subjects showing a high Global SADL score, yet a low single-item satisfaction measure,
the authors pointed out the importance of the use of a single-item overall rating as a “safety net”
in outcome measurement. This “safety net” approach should be considered in future studies of
satisfaction.
Hosford-Dunn and Halpern (2001) studied the psychometric properties and validity of the
SADL for use in private practice settings. The SADL had been normed using mainly older,
predominantly male respondents from Veteran Affairs Medical Centers and community clinics.
These authors argued that for full utility this instrument needed to be tested with different patient

71
populations and in different service delivery contexts. Towards that end, Hosford-Dunn and
Halpern collected SADL measures on a large group of recently fitted hearing aid patients in a
private practice setting. Analysis of their data showed good agreement with those of the original
Cox and Alexander (1999) data on this instrument. This report confirmed the psychometric
properties of the SADL as a viable tool to document hearing aid fitting satisfaction in the general
hearing aid user population.
The same authors (Hosford-Dunn & Halpern, 2001) reviewed a number of hearing aid
satisfaction studies and then examined a large set of variables and their influence on satisfaction
via the SADL. In their review of satisfaction studies, they reported that a number of variables
seem to affect satisfaction domains but that the precise nature of the effect is unclear. Their study
aimed to identify the effects of a group of independent variables on the SADL scores. These
authors hoped to establish relationships between given variables and the SADL such that fitting
profiles could potentially serve as predictors of hearing aid satisfaction. The variables examined
were described as falling into extrinsic and intrinsic groups. Intrinsic features were those that
related to subjects themselves such as age, degree of hearing loss, monaural versus binaural,
years of hearing aid experience, etc. Extrinsic variables were features of the hearing aids
themselves such as technology level, style, number of channels, price, etc. These authors did not
report a clear pattern of effects on variables that could accurately predict SADL measures due to
the highly complex interactions. Their results suggest that the construct of hearing aid
satisfaction is multidimensional and highly complex. A few patterns of variable influences did
emerge from the study. For example, satisfaction did vary systematically with hearing aid style,
with greater satisfaction reported by users of smaller instruments. Satisfaction was generally

72
lower for older patients and for listeners with greater difficulty in telephone use. Of note the
lower satisfaction for older patients could have been mainly due to reduced auditory benefit in
general. The report of lower satisfaction in the older subject group is contrary to Ross et al.’s
(1995) findings that older respondents showed greater positive response bias. Based on Hosford-
Dunn and Halpern’s (2001) findings they were not able to develop a model for clinical
predictions of SADL outcome but instead encouraged further research to complete a predictive
model. These authors hoped that the SADL could serve as a “basis for development of such a
predictive model of hearing aid fitting success.”
Jerram and Purdy (2001) evaluated possible predictor variables on three measures of
hearing aid outcomes on a group of new and experienced hearing aid users. The outcome
measures included daily hours of use, self-reported benefit, and satisfaction. The satisfaction
measure used was a single item satisfaction rating across a 20 point rating scale with descriptors
ranging from very, very dissatisfied to very, very satisfied. The predictor variables these authors
measured included adjustment to hearing loss, attitudes towards hearing aids, and pre-fit hearing
aid expectations. Additionally, the subjects used a variety of hearing aid technology options e.g.,
wide dynamic range compression (WDRC); multiple memories; multiple microphones, etc. and
41% of the patients wore monaural versus binaural hearing aids. Regression analyses were used
to look for effects of the demographic, hearing aid features, attitudes and expectations, and
adjustment variables with the outcome measures of hours used, benefit, and satisfaction. A
number of observations regarding the effect of expectations were reported in this study, however
the authors noted that tests of the reliability of the expectation questions used were only
moderately good. One result was that higher expectation scores predicted greater hearing aid

73
benefit in both noisy and quiet situations. These results were not consistent with those of Schum
(1999) or of Seyfried (1990). Satisfaction was not directly related to expectations or to a number
of other variables, but was related to aided benefit in both quiet and noisy situations. Subjects
with higher pre-fitting expectation and better personal adjustment as measured by the
Communication Profile for the Hearing Impaired (CPHI) (Demorest & Erdman, 1987) used their
hearing aids more. Since hours of use were associated with satisfaction in this study there may be
an indirect relationship between higher expectations and higher satisfaction. The finding of a
relationship between hearing aid benefit in a variety of situations and satisfaction was consistent
with earlier conclusions of Kochkin (1996).
These authors concluded that the influence of high expectations on benefit suggested pre-
fit and follow-up counseling may be beneficial in improving outcomes. Specifically they
suggested that expectations could be raised via counseling when indicated. Based on some of the
consumer research reviewed earlier, this approach may not necessarily yield higher satisfaction
(Spreng & Droge, 2001) In terms of methodology, these authors noted that the single item
satisfaction scale may have obscured satisfaction responses across hearing aid fitting attributes.
They suggested that future research should use a differentiated satisfaction scale such as the
SADL.
Another relevant study, addressing hearing aid expectations, was published in 2003.
Bentler et al. designed a study with the purpose of investigating the effect of technology labeling
on a variety of self-report and behavioral hearing aid outcome measures. This study was
conducted shortly after hearing aids using digital technology were introduced in the market. The
authors were particularly interested in finding out whether hearing aid patients’ outcomes would

74
be biased by the digital labeling, or if outcomes with digital hearing aids were truly improved
when compared to analog hearing aids. As such, the study involved the manipulation of patient
expectations. In addition to nationally available hearing aid marketing literature, the authors
supplied manufacturer designed product literature to participants’ prior to the hearing aid fitting.
This marketing information served as a placebo to increase the participants’ expectations of the
digital hearing aids. Participants were divided into two groups for the study. One group wore
each of two digital hearing aids for one month each, believing that the hearing aids were
switched from analog to digital after one month. The other group wore the same digital hearing
aid for the two month duration, also believing that the aids were analog instruments for one of
the months. Outcome measures for the two groups reflected better performance for the condition
when patients thought they were using digital hearing aids. The authors concluded that these
findings reflected a positive bias that was inferred from the digital label. Though not directly
exploring hearing aid expectations, this study has relevance to the topic by demonstrating the
effect of both national media advertising and clinician supplied instrument information on patient
expectations. Additionally this study demonstrates the potential manipulation of expectation via
labeling and information, a method that could be adapted to a study of the expectancy-
disconfirmation paradigm applied to hearing aid fittings. This study further substantiates findings
of both Kochkin (2007) and Cox (2000) showing the availability of general hearing aid
information and its impact on the formation of hearing aid expectations. This impact can drive
expectations in either positive or negative directions, depending on the content and/or source.
Given the evidence for both indirect and direct effects of expectations on outcomes (Cox &
Alexander, 2000; Jerram & Purdy, 2001; Spreng & Droge, 2001), future studies on hearing aid

75
expectations and/or outcomes might need to consider participants’ exposure to prior hearing aid
information.
The first extensive review of research in hearing aid satisfaction, from the 1980’s on, was
conducted by Wong, Hickson, and McPherson (2003). Across all the studies reviewed, a variety
of factors were found to be related to satisfaction. These factors included experience, personality,
daily hours of use, hearing aid type, listening demands, and hearing aid problems. As shown in
articles reviewed in this paper, causal and interactional relationships have not been clearly
established. Methodological issues have arisen across many of these studies and answers to
similar research questions have not been consistent in this literature. These authors reviewed 45
studies on hearing aid self-report outcomes including satisfaction. They concluded that, other
than hours of use, no intrinsic factors have consistently been demonstrated to influence benefit or
satisfaction. After conducting this far-reaching review, Wong et al. recommended that further
work in this area should draw from the vast literature in consumer and healthcare satisfaction.
They pointed out that hearing aids fall into both of those categories (See Wong et al., 2003 for a
more extensive review of general expectation and satisfaction research).
Wong et al. (2004) followed up on the above recommendation and explored the
relationship between hearing aid expectations and post-fit satisfaction in a sample of first-time
hearing aid users in China. One goal of this study was to determine the level of expectations
among users and whether the level of expectation varied systematically across hearing aid
attributes such as service, performance, and cost. This study used both open-ended questions and
questionnaires with predefined situations to elicit the level of patient expectations and
satisfaction. Subjects rated expected levels for Hearing Ability and Dispenser Service on a 0 -

76
100 scale, with 0 indicating no expectation of performance and 100 meaning extremely good
expectation of performance. Opinions of expectation seemed to be elicited with no prior hearing
aid counseling or education provided. By eliciting open ended information about hearing aid
expectations this study uncovered a broad array of specific listening situations with which users
hoped to get help and a variety of hearing aid related problems they did or did not anticipate
encountering. In addition to analyzing the level of expectation across hearing aid attributes, this
study looked at the relationship between expectation levels for these different attributes.
Correlations that ranged from moderate to high (r = .40- to .86) were reported among expectation
levels of all Hearing Ability items and among Dispenser Service items. It should be noted that
these correlations were derived via a Pearson product- moment correlation coefficient, which
assumes the use of an interval scale. The 0-100 scale used by the author was not described as
interval in nature.
Another goal of this study was to determine whether expectations have an impact on
satisfaction in general, and for specific hearing aid attributes. Post fit satisfaction was measured
at 3 months. Correlations between expectations and satisfaction were not found to be significant
for either specific attributes or for composite scores across attributes.
This study was aimed at further documentation of the relationship between expectations
and satisfaction. Specifically, the author was looking at correlations between high expectations
and high satisfaction. The expectations elicited in this study were not influenced by any pre-
fitting counseling or education and therefore may not have been realistic expectations for users to
have. One recommendation that emerged from this study was to look toward consumer models
of satisfaction to better explain the expectation-satisfaction relationship.
77
To further investigate the expectation/satisfaction relationship, Wong et al. considered the
association between disconfirmation and post-fit satisfaction. This was the first time that the
concept of disconfirmation was applied to the study of hearing aid satisfaction. The author
described a positive disconfirmation as the perception that hearing aid performance was better
than initially expected. The results of this study were reported as a poster presentation at the
American Auditory Society in 2004, and later in print in 2009. As reported above, the findings of
this study showed that pre-fitting expectations did not directly affect post-fitting satisfaction, but
a positive disconfirmation was associated with greater satisfaction. The suggestion resulting
from this study was that future research into hearing aid satisfaction should consider the effect of
disconfirmation on satisfaction. No such research, focused on hearing aid satisfaction has been
published since that time.
The utility of self-report hearing aid outcome measures will be germane to future
research addressing satisfaction. Vestergaard (2006) investigated aspects of self-report measures
of benefit and satisfaction. Specifically, he looked at whether results of such measures change
over time and at the validity and relationships within a variety of self-report outcomes. The
measures studied were as follows: Glasgow Hearing Aid Benefit Profile (GHABP)(Gatehouse,
2000); Auditory Lifestyle and Demand (ALD)(Gatehouse, 1999a); International Outcome
Inventory for Hearing Aids (IOI-HA)(Cox, Alexander, & Beyer, 2003); Hearing Aids
Performance Questionnaire (HAPQ); and the Satisfaction With Amplification in Daily Life
(SADL) (Cox et al., 2003). With regard to a longitudinal effect, Vestergaard (2006) found that
first time users who reported hearing aid use for greater than four hours per day showed
improved outcome on the GHABP and IOI-HA. For the SADL and HAPQ no such longitudinal

78
change was observed. These different findings among the scales could be due to differences in
the content of the items in these scales. The author noted that the GHABP and the IOI-HA
address general aspects of hearing aid performance and satisfaction whereas the SADL and
HAPQ probe performance in more specific listening situation. Additionally, study results
showed that listeners with higher auditory demands showed lower ratings on the self-report
outcomes.
In assessing the validity of the self-report outcome measures Vestergaard (2006) noted
some issues with convergence, content, and face validity across items in the measures. Of note,
the author concluded that self-assessment tools addressing specific listening challenges are not
feasible early in the post-fit time frame, as subjects may not be able to appreciate the attributes
being probed. Self-assessment tools of a more general nature show greater stability over time,
possibly due to better face validity.
Vestergaard’s findings have relevance to future research of the expectancy-
disconfirmation model. By examining specific characteristics of a variety of outcome measures,
this article serves as a guide to the tools most appropriately used to operationalize constructs in
the model. The findings of divergent outcome from high versus low auditory demand groups
further supports the notion that expectations may play an important role in the hearing aid
outcome process. Data on the impact of daily use on longitudinal changes in self-report outcome
point out the need to consider factors such as hours of use and time frame of satisfaction
measurement. Finally, this author concurred with Wong (2004) that future studies of self-report
outcomes should consider the role of expectations.

79
Wong et al (2009) published data from a study designed to explore hearing aid
satisfaction via the expectancy-disconfirmation perspective. The study was conducted on new
hearing aid users in Hong Kong. In this study data were collected on self-perceived and
objectively measured hearing aid performance. Measures, obtained using one instrument, were
made regarding expectations, performance, disconfirmation, and satisfaction. Correlation
coefficients across outcomes demonstrated that positive disconfirmation is related to satisfaction
with both specific and general attributes of service. These authors measured disconfirmation
subjectively by asking participants to rate how current function/service compared to prior
expectation of function/service. The authors found a lack of direct relationship between
expectations and satisfaction. They explain this lack of relationship as being consistent with
products that are durable and high-involvement in nature. As explained by Thompson and Sunol
(1995), durable, highly involved products are more receptive to outcome than to pre-purchase
expectation. High involvement products are those for which the consumer is actively engaged in
selecting and using the product (e.g., adjusting settings). It is unclear whether hearing aids can
be considered as such, since the specific product itself is often chosen and fitted by a
professional. The authors concluded that disconfirmation is a “relevant factor in determining
satisfaction, and that it is correlated more strongly with satisfaction than expectation alone.” The
majority of participants in this study were fit monaurally with analog hearing aids. Results may
have been different if the sample had been binaural digital users. As noted earlier in this
literature review, given the cultural differences between the population addressed in this study
and that in the United States, it is questionable whether these findings would be replicable in a
sample of American first time hearing aid users. The data on expectations and disconfirmation

80
collected in this study showed wide variability across participants. These data are consistent with
the earlier cited findings of Cox and Alexander (2000) showing variability across pre-purchase
expectation levels of first time hearing aid users.
A study of hearing aid outcomes was ongoing at the Indiana University for several years
(Humes, 2006). These researchers set out to explain the vast differences in outcomes observed by
similarly appearing older adult hearing aid users. This study necessarily required a review of the
variety of hearing aid outcome measures available at the time this work was undertaken. These
authors have collected data on 173 similarly aided older users across twenty different outcome
measures. The outcome measures initially crossed several domains, including hearing aid usage,
subjective benefit, hearing aid satisfaction, and Speech Recognition performance. These data
were then analyzed for redundancy to assess which measures were ultimately necessary to yield
a comprehensive assessment of hearing aid outcome. The goal was to identify outcome measures
within a variety of domains that would be useful for a factor analysis aimed at explaining
individual differences in outcomes. A few satisfaction focused instruments have been included
in this ongoing study. These have been the SADL (Cox & Alexander, 1999), one section of the
Glasgow hearing Aid Benefit Profile (GHABP) (Gatehouse, 1999b), and the MarkeTrack IV
satisfaction survey (Kochkin, 1996). Ultimately the domains at which these authors arrived
included hearing aid use time, speech recognition, and hearing aid benefaction. The use of the
word benefaction was meant to represent a combination of hearing aid benefit and satisfaction.
Data derived in this domain cannot therefore be directly related to satisfaction alone. Interim
conclusions from this study suggested that 40-50 percent of the variance in the above named
domains can be explained by performance on a variety of measures. In the benefaction domain,
81
one measure of expectations (ECHO) (Cox & Alexander, 2000) was identified as a predictor
variable, accounting for 13.5 percent of the variance in that domain. Among other predictor
variables in the domain, higher expectations were associated with greater self-reported
benefaction. These authors continue to collect data to better identify those predictors of positive
hearing aid outcomes.
Though not directed specifically at hearing aid satisfaction, Cox et al. (2007) conducted a
relevant study assessing the contribution of several different factors to self-reported hearing aid
outcomes. This study addressed the factors of personality, along with expectations and other
related predictor variables in hearing aid outcomes. The personality measure included a set of
questions aimed at assessing a subject’s tendency toward socially desirable responses (SDRS-5).
These authors studied two groups of patient related variables. The first group of variables related
to personal issues such as personality, audiometric results, and hearing problems. The second
group of variables related to amplification characteristics of the user’s hearing aid. In this field
study, subjects were drawn from patient populations in eleven different hearing aid dispensing
sites across the United States. Some of the sites were Veteran Administration sites, in which case
patients would not have paid for their hearing aids. Some of the sites were private practices
where patients would have self-paid for all or part of the hearing aid costs. A variety of pre-fit
measures were obtained on the subjects. These included personality measures and hearing aid
expectation measures. Of note, these authors included the SDRS-5 questions so that data from
them could be analyzed later to study whether a response bias was present. Associations among
the pre-fit variables were assessed via correlation coefficients. Participants, who were higher in
Agreeableness and Conscientiousness, and lower in Neuroticism, were more likely to

82
demonstrate higher expectations for their hearing loss. Notably, these data demonstrated that
personality characteristics of hearing aid candidates were more predictive of self-reported
hearing problems and expectations than severity of hearing loss itself. Additionally, with regard
to outcome measures, personality, per se, was not generally associated with self-reported hearing
aid satisfaction. Specifically, there was a weak association of personality with self-image in that
patients with higher response bias (greater desire to please) reported greater satisfaction on the
Personal Image subtest of the SADL. These data should be considered in future studies using
expectation and/or satisfaction measures. The socially desirable response bias has been
minimally addressed in hearing aid satisfaction research despite the heavy dependency on self-
report measures.
Following the pre-fit measures, subjects were fit with hearing aids that were considered
most appropriate for their hearing losses. At six months post-fit, subjects completed a variety of
outcome measures aimed at assessing residual hearing problems, benefit, satisfaction, and daily
hours of use. Of interest, the authors noted that results from among these outcome measures were
not highly correlated. In other words, several of the self-report outcome measures thought to
address the same outcome domain yielded different results. For example, the Abbreviated Profile
of Hearing Aid Benefit (Cox & Alexander, 1995) and the Hearing Handicap Inventory for the
Elderly (Ventry & Weinstein, 1982) were both administered. These two questionnaires were
found to yield a correlation coefficient of r = .58, a moderate association. This finding poses a
challenge for future researchers when considering which outcome measures validly represent the
targeted outcome component(s).

83
Outcome components used in the analysis of the data from this study were derived via a
principal components analysis. The process of principle components analysis was used to distill
data from the large number of self-report measures into three elements contributing most
significantly to the variance of the outcome data. The three derived generic components were
device merit, success in daily life, and amplification acceptance. Overall, data from measures of
personality were not strongly predictive of subjective fitting outcomes, nor were the traditionally
administered verification measures of hearing aid function. After complex analysis of the
extensive data collected in this study the authors concluded that a substantial proportion of
variance in self-report outcome measures could not be explained by these patient- related and/or
hearing aid- related variables. This article was useful in demonstrating the use of an instrument
designed to measure an individual’s tendency towards socially desirable responses on self-report
surveys. This trait was associated with the personality measure of Agreeableness. The trait was
found to have more influence on self-reports of pre-fit hearing problems than on post-fit hearing
aid satisfaction. There was a small but significant association of this Response Bias score with
the Personal Image subscale of the Satisfaction with Amplification in Daily Life (SADL) score.
Generally, the authors pointed out the need for further research into possible precursors of
hearing aid success and/or satisfaction. As noted above, it would seem important to address
possible response bias in studies measuring satisfaction via self-report instruments.
The call for research to “explore the relationship between expectations and outcome,
especially including satisfaction” (Cox et al., 2000) has been answered by a number of the
articles summarized in the last section of this paper. A chart showing the highlights of these
studies is shown in table 8.

84
Table 8. Studies on expectations/satisfaction in the Audiology literature
Author(s)/Year Question(s) Subjects Measures Used Conclusions Schum,1999 Is there a relationship between
communication needs/expectations and hearing aid benefit?
Adults age 21-93 in University Hospital setting
1. Hearing Aid Needs Assessment 2. Hearing Aid Performance Inventory
1. new users have unrealistic expectations 2. no strong correlation between expectations and benefit
Cox & Alexander, 2000 1. What are realistic expectations? 60-89 years old; 139 experienced users
Expected Consequences of Hearing Aid Ownership (ECHO) and Satisfaction in Daily Life (SADL)
collected reality norms on hearing aid attributes from experienced users
2. Do first time users hold realistic expectations?
67 naïve users (mainly male)
naïve users have unrealistically high expectations, based on reality norms
3. Are expectations of first time users stable?
57 from question #2 expectations remain fairly stable over time

85
Author(s)/Year Question(s) Subjects Measures Used Conclusions
4. Are pre-fit expectations related to post-fit satisfaction?
43 from question #2 moderate correlation between expectations and satisfaction in Postive effect domain
Hosford-Dunn & Halpern (2000)
Validation of psychometric properties of Satisfaction in Daily Life (SADL)scale
375 patients in private practice
SADL confirmed psychometric properties of SADL in private practice setting vs. clinic and VA setting
Hosford-Dunn & Halpern (2001)
What is the predictive validity of 44 variables on the SADL scale?
375 patients in private practice
SADL following variables most related to higher satisfaction: 1. patient age 2. years of hearing aid experience 3. hours of use per day 4. percieved difficulty PTA 5.pure tone average 6. hearing aid style 7. hearing aid technology 8. hearing aid cost
Table 8 (continued)

86
Author(s)/Year Question(s) Subjects Measures Used Conclusions Jerram & Purdy, 2001 What is the influence of technology,
demographic factors, and pre-fit expectations, attitudes, and adjustment to hearing loss on hearing aid outcome?
new and experienced users from 12 private and 7 public hospitals in New Zealand; ages 31-88
1. single item satisfaction question 2. daily hours of use question 3. modified APHAB (Cox & Alexander, 1995) 4.expectation questionnaire (Seyfried, 1990)
1. higher hours of use per day related to higher satisfaction 2. multiple memory hearing aids associated with higher benefit and satisfaction 3. better pre-fit expectations related to benefit in easy and difficult listening situations
Table 8 (continued)

87
Author(s)/Year Question(s) Subjects Measures Used Conclusions Bentler et al., 2003 What is the impact of digital labeling
on outcome measure? 40 older adults (means age = 67 years
1. probe microphone measures 2. Hearing in Noise Test (HINT) (Soli & Nilsson, 1994) 3. CUNY sentence test 4. Abbreviated Profile of Hearing Aid Benefit (APHAB) 5. Glasgow Benefit Inventory (GBI) 6. Client Oriented Scale of Improvement
Labeling of newer technology raises expectations and perceived outcome e.g., serves as a placebo
Wong, 2003 What conclusions can be drawn from the past 20 years of hearing aid satisfaction research?
Review of literature N/A 1.hours per day use correlates with greater satisfaction 2. further research should draw from consumer and healthcare satisfaction literature
Table 8 (continued)

88
Author(s)/Year Question(s) Subjects Measures Used Conclusions Wong 2004 Do expectations have an effect on
satisfaction? 43 first time users in China
1. Hearing Aid Outcome Questionnaire 2. Expectation rating 3. Satisfaction rating 4. Open ended questions
1. no correlation between expectations and satisfaction 2. should explore perceived performance (disconfirmation) in relationship with satisfaction 3. questionnaire results from Chinese subjects was equivalent to those in Western studies
Wong 2004b Explored the relationship between satisfaction and expectation, performance, benefit, and disconfirmation.
36 first time users in China
IOI-HA PHAB
better performance and higher positive disconfirmation associated with greater satisfaction
Wong et al, 2009 What is the relationship between expectation, perceived performance, disconfirmation, and satisfaction?
42 First time users in China
Profile of Hearing Aid Consumer Satisfaction (PHACS)
link between performance and satisfaction, and disconfirmation and satisfaction
Table 8 (continued)

89
Author(s)/Year Question(s) Subjects Measures Used Conclusions Humes, 2006 What factors account for individual
differences in hearing aid outcome? 173 older adults 1. GHABP
2. Daily Use questionnaire 3. HAPI 4. SADL 5. MarkeTrak Survey (Kotchkin 1993) 6. Speech Recognition 7. ECHO
higher expectations associated with greater self-reported benefaction(see Humes, 2006)
Cox, 2007 Which patient and hearing aid variables contribute to hearing aid outcomes?
205 older subjects from 11 clinics
1. Personality measure 2. ECHO 3. HHIE 4. APHAB 5.Hearing Disability Rating 6. Response Bias
1. personality traits associated with self-report outcomes 2.reported hearing problems and previous hearing aid experience associated with successful fitting
Table 8 (continued)

90
2.6 CONCLUSION
Extensive theoretical and empirical support for the expectancy-disconfirmation paradigm has
been published across a number of consumer and health care contexts. This paradigm has not
been applied to the understanding of hearing aid satisfaction in the United States. In the study of
satisfaction with hearing aids there has not been consistency in the instruments used, and the
dimensions of hearing aid satisfaction have not been uniformly defined or probed. Some
instruments measured various dimensions of the construct of expectations (e.g., expectation prior
to contact with the professional versus expectation following initial counseling/information
session). Similarly, measurement of expectations and satisfaction has probed a variety of hearing
aid fitting attributes such as size or stigma, while others have explored expectations and
satisfaction with speech understanding in noise or on the telephone. Attempts to derive a
composite analysis based on these studies would be misleading, due to the inconsistencies in
construct definition and measurement. None of these studies were conceived or designed based
on a theoretically sound and empirically tested conceptual model. Of note, a few of these studies
have identified the Hours of Daily Use variable as one associated with satisfaction (Humes,
2006; Jerram & Purdy, 2001; Wong et al., 2003). This finding might reflect Woodruff et al’s
(1983) model of the zone of tolerance in that the response to satisfaction within the zone of
tolerance is a desire for continued use of the product. It would seem that a model pertaining to
hearing aids would need to include elements from both the consumer and patient satisfaction
domains. Additionally, elements from both the product and service contexts will be relevant.

91
In summary, the expectancy-disconfirmation model, when applied with the use of
validated measurement instruments, should provide a legitimate approach to explore the
relationship of hearing aid expectations and satisfaction. Before addressing questions related to
increasing satisfaction with hearing aids, the first question should be: Can the expectancy-
disconfirmation model predict satisfaction in hearing aid users? Issues such as the influence of
disconfirmation for service and disconfirmation for product will need to be considered. The issue
of response bias, inherent in all self-report measures would seem important to address as well.
Methodological issues aside, testing of the expectancy-disconfirmation model in this context
should take the Audiology discipline one step closer to understanding and improving user
satisfaction with hearing aids.

92
3.0 RESEARCH QUESTIONS AND METHODS
3.1 OBJECTIVES AND AIMS
This study applied the expectancy-disconfirmation model to first time hearing aid users in an
attempt to better elucidate the role of disconfirmation in hearing aid satisfaction. This was done
by examining the relationship of disconfirmation and satisfaction, across product and service
elements. The expectancy-disconfirmation model, as demonstrated across a variety of goods and
services, suggests that the difference between users’ experience and prior expectations of the
hearing aid fitting should predict the level of satisfaction post purchase. Based on the review of
gaps and inconsistencies in our understanding of hearing aid satisfaction the following research
question was posed: Does disconfirmation of expectations predict satisfaction in first time
hearing aid users? Also, given the varying findings on the role of performance in satisfaction,
what is the contribution of performance and disconfirmation (Drew & Bolton, 1991; Wong et al.,
2009)?
As noted by Sukarom (1999), much of the work in the expectancy-
disconfirmation framework has focused on satisfaction in either a given product or service
encounter. Given the relatively rare application of the model to consumer encounters
incorporating both of these components, the contribution of these variables together is not well

93
understood. The second aim of this study was to explore the contribution of disconfirmation for
product and disconfirmation for service elements of the hearing aid purchase experience in
formation of the satisfaction rating.
A third aim of this study was to explore the influence of response bias in self-report
hearing aid measures. The use of self-report measures, for both assessment and outcome
purposes, has become increasingly popular over the past two decades. As described throughout
the literature review, and as noted by Cox and Alexander (2007), response bias could
potentially influence results across all types of self-report hearing related measures (Drew &
Bolton, 1991) . This topic is germane to future research in this area, as well as to clinical
applications of self-report instruments. Questions related to the Socially Desirable Response set
were addressed through a progression of questions, each addressing more specific information.
This topic was initially approached by asking whether the Socially Desirable Response Set has
an influence on self-report hearing aid measures used to measure performance, disconfirmation,
and satisfaction. It would be useful for both clinicians and researchers to be aware of such a
response bias when using these instruments. Since performance, disconfirmation, and socially
desirable response tendency have all been identified as playing a role in satisfaction ratings, all
three of these constructs were then examined for their contribution to the satisfaction response.
Finally, this study examined the extent to which this potential response bias moderates the
relationship of performance and disconfirmation with satisfaction.
Other questions addressed the equivalency of the multi-item measures of performance
with single-item probes of the same constructs. In bringing together customer satisfaction
literature and audiology literature, it is clear that each field uses a different approach to the

94
instrumentation used for self-report ratings. Whereas the audiology literature almost exclusively
uses multiple item questionnaires to assess dimensions of the patient experience, the single-item
rating of 0-100 is commonly seen in the customer satisfaction literature (Drew & Bolton, 1991).
The equivalency of these measures will be explored as a methodological question applicable to
further studies in this area.
In summary, this study attempted to provide empirical evidence that the expectancy-
disconfirmation paradigm can appropriately be applied in the study of hearing aid satisfaction.
Once that is established, the model can serve as a framework from which many other questions
can be addressed.
This study addressed the following specific questions:
1. Does disconfirmation predict satisfaction in first time hearing aid
users?
2. How is hearing aid satisfaction influenced by disconfirmation for the
product and service elements of the purchase?
3. What is the influence of response bias on self-reported measures of
hearing aid performance, disconfirmation, and satisfaction?
4. What are the influences of perceived performance, disconfirmation,
and response bias on satisfaction?
5. Is the influence of disconfirmation and perceived performance
moderated by response bias?
.
95
3.2 METHODS
3.2.1 General Research Design
This study used cross-sectional surveys of hearing aid users to explore the relationship between
disconfirmation and satisfaction after hearing aid purchase. Measures addressed the four
constructs of the expectancy-disconfirmation paradigm: expectations, performance,
disconfirmation, and satisfaction. A measure of Socially Desirable Response Set was included in
the survey questions. Participants were first time hearing aid purchasers who had owned their
hearing aids for at least four to twelve weeks. Subjects were informed that their responses would
remain anonymous and that their dispensing clinician would not have access to their responses
on the survey instrument. This was done to encourage subjects to be candid in their responses.
Subjects answered questionnaires designed to measure perceived performance, subjective
disconfirmation, and hearing aid satisfaction across a variety of fitting attributes. A measure of
socially desirable response tendency was obtained from each participant so that the influence of
this characteristic on self-report hearing aid outcomes could be examined. The project used a
disconfirmation measurement instrument created by combining a well-known self-report
measure of hearing aid performance (APHAP) with a widely accepted disconfirmation
measurement probe. In addition to the multiple item self-report measures used to assess
performance, disconfirmation, and satisfaction, each of these constructs was probed via a single
item measure. The multiple item hearing aid disconfirmation instrument and the single item

96
measures of performance, disconfirmation, and satisfaction were examined for test-retest
reliability during the data collection.
Recognizing the trade-off between generalizability and control of variables, a field study
approach was chosen for this project. Videotaped or role play scenarios and/or laboratory
manipulation of expectation and/or performance have been used extensively in satisfaction
research (Alford, 1998; Bitner, 1990; Churchill & Surprenant, 1982; Jayanti, 1996). These
methods do not appear appropriate for the product and service components of hearing aids. This
is partly because hearing aids, unlike cameras or dental services, require an adjustment period
before a valid satisfaction response can be assessed. Additionally, due to the complexity of the
hearing aid fitting process, it would not be possible to expose participants to an appropriately fit
instrument, and to elicit valid performance or satisfaction self-reports in one or two laboratory
sessions.
Data for this study were collected in the field, from participants who had self-purchased
their hearing aids from an audiology clinic. This situation captured disconfirmation and
satisfaction outcomes in the most natural setting, as has been modeled in satisfaction studies in
the consumer literature. The field study approach and the measurement of subjective
disconfirmation should yield findings that are highly generalizable to the typical hearing aid
consumer population.

97
3.2.2 Variables and Operationalization
3.2.2.1 Perceived Performance
In this study, perceived performance was operationalized via a tool called the Abbreviated
Profile of Hearing Aid Performance (APHAP) (Cox & Alexander, 1995). This instrument was
derived from a longer (66 item) instrument developed to quantify users’ self-reported
communication performance with hearing aids. That longer instrument was known as the Profile
of Hearing Aid Performance (PHAP) (Cox & Gilmore, 1990). Attributes addressed in the PHAP
included the positive effects of improved speech communication and the negative effects of
objectionably amplified environmental sounds. The listening environments addressed in the
PHAP were based on both theoretical research and on data of Walden et al (1984), defining three
broad listening environments to which adult listeners are typically exposed. These environments
include 1) speech at normal conversational levels with full visual cues and minimal background
noise (e.g., one on one, face to face conversation in quiet), 2) reduced speech cues due to lower
intensity, room reverberation, distance from signal, and/or reduced visual cues (e.g., listening in
large audience), and 3) high environmental noise conditions, full visual cues, and high signal
level (e.g., cocktail party conversation). The original PHAP inventory contained 66 items. The
items were organized into four scales, each addressing one of the listening environments
described earlier, and the fourth addressing negative reactions to amplified environmental
sounds. The subscales were named: Easy Communication, Reverberant Conditions,
Background Noise, and Aversiveness of Sounds. Respondents are presented with statements
describing their aided communication abilities or perceptions of sound in daily activities. A
98
seven point response scale captures how frequently the statement is perceived as true by the
listener. Responses are anchored at one end with “Always” and at the other end with “Never.”
Corresponding percentages are shown with each answer choice to further clarify the descriptors
along the scale. Corresponding point values run from one to seven. During development of the
instrument, the PHAP was administered to two groups of older adult hearing aid users with mild
to moderate hearing loss. Psychometric properties of the instrument were tested and internal
consistency, test-retest reliability, and critical differences were found to be acceptable and
similar to data from other self-assessment measures of hearing aid performance.
Cox and Alexander (1995) developed and evaluated a shortened version of the PHAP and
called it the Abbreviated Profile of Hearing Aid Performance (APHAP). This instrument
contains twenty-four questions, each falling into one of the four subscales described in the PHAP
above. The APHAP yields moderate to high correlation coefficients on test-retest administration
across each subscale and globally (.67- .81) (Cox & Gilmore, 1990). Score distributions on the
APHAP norm sample show that standard deviations on the subscales are relatively large,
suggesting respondents use a wide range of the response choices (Cox & Alexander, 1995).
In the present study, the APHAP items and scale were used as one means to operationalize the
perceived performance component of the disconfirmation model. APHAP item ratings served as
a reference point against which expectations were compared for the disconfirmation measure
(described below). Global performance values were calculated, as per author instructions, by
calculating the mean performance rating across all items. Additionally, a single item measure of
perceived hearing aid performance was included in the data collection instrument. This measure
was based on the model of consumer ratings on product and/or service encounters and on patient

99
satisfaction study methodology (Like & Zyzanski, 1987; Wong et al., 2004). Participants rated
the overall performance of the hearing aid on a scale of 0-100 (0= lowest performance, 100= best
performance) on the single item question. A sub-question in the study explored the equivalency
of the APHAP measure and the single item Performance measure. This question has not been
previously addressed in the literature. The APHAP questions, and single item performance
measure can be seen in the appendix. The appendix also includes the APHAP-based and single-
item disconfirmation measure.
3.2.2.2 Disconfirmation
As described in the literature review, there are a variety of approaches to the measurement of
disconfirmation. In the present study the disconfirmation construct was operationalized as the
subjective discrepancy between participants’ perception of hearing aid performance and service
compared to pre-purchase expectations. The specific listening situations were taken directly from
those probed via the items on the Abbreviated Profile of Hearing Aid Performance instrument
(APHAP) (see above). The methodology for measuring disconfirmation was modeled on that
used and/ or described by several authors including Oliver (1980), Spreng and Page (2003), Tse
and Wilton (1988), Hudak et al (2004), and Cadotte, Woodruff, and Jenkins (1987). In this
approach participants are asked to make a subjective assessment of whether, and to what degree,
performance is better or worse than their expectation. In the present study, after rating aided
communication performance on the APHAP items, subjects were asked to rate how the
performance compared to their pre-purchase expectation. Responses were recorded using a seven
point scale anchored at one end with “it is worse than I expected” (negative disconfirmation) and

100
at the other end with “it is better than I expected” (positive disconfirmation). The midpoint on
the seven point scale was labeled as “It is just as I expected.”(simple confirmation). One
limitation inherent in this approach is the potential for censored data at the lower and upper
bounds of the disconfirmation rating. For example, if a participant responds to the performance
probe with the highest value of performance (e.g., with my hearing aid I am NEVER able to
follow the conversation in a grocery store) it is very unlikely that the same participant would
respond to the disconfirmation question with a response indicating that this performance is
BETTER THAN I EXPECTED. In the unlikely event that the data are skewed to the lower and
upper bounds of the performance question, this limitation may present a problem in the data
analysis. This instrument is shown in the Appendix along with the performance questions from
the APHAP. Since this disconfirmation instrument has not previously been used or tested, the
current study included a measure of test-retest reliability on this instrument.
Data from the Disconfirmation measure included a global score, as derived from mean
disconfirmation ratings across the APHAP items. Disconfirmation for product and
disconfirmation for service elements were measured via single item ratings targeting each of
these areas. Data from the disconfirmation measures were used in the main research questions
exploring the relationship between disconfirmation, perceived performance and satisfaction.
Also, these data were used in the questions assessing the influence of socially desirable response
set on self-reported disconfirmation for hearing aid product and services. In sub-questions, data
from the APHAB-based disconfirmation instrument and data from the single item measure of
overall disconfirmation were used to assess inter-test equivalency.

101
3.2.2.3 Satisfaction
The construct of satisfaction was operationalized via Cox and Alexander’s (1999) Satisfaction
with Amplification in Daily Life (SADL) scale. This instrument was developed as a means to
capture the multidimensional construct of hearing aid satisfaction via a self-report questionnaire.
The items included in the SADL were derived from prior data (Hawes, Durand, & Clark, 1985;
Kochkin, 1992) and from interviews with individuals who had owned hearing aids for at least
one year. The sample of interviewees were aged 60 and above and they displayed a range of
hearing losses and configurations from mild and flat to moderate and sloping. After identifying
the elements of satisfaction, interviewees were asked to report on the importance of individual
items listed. The authors analyzed the importance ratings to determine if there were substantial
differences in importance between the items. Additionally the authors used a principal
component analysis to determine whether the items could be grouped into related clusters. This
analysis identified four factors that, taken together, accounted for 68% of the variance in
importance ratings. Thus, four hearing aid satisfaction domains were identified in the
development of the SADL. The final version has 15 items across these domains. The SADL
authors omitted some of the original 25 items that resulted from the subject interviews. These
omissions were based on a priori goals for the final SADL instrument. These included a
relatively short scale with items yielding a mean score closer to the middle, and a wide
distribution of responses. The final version of the instrument includes 15 items sorted into four
domains. The domains are: Positive Effect, Service and Cost, Negative Features, and Personal
Image. The SADL scale uses a seven category rating of satisfaction with descriptors ranging
from “not at all (=1) to “tremendously” (=7). Of note, the descriptors used in this rating scale

102
have been studied and empirically shown to represent approximately equal intervals between
descriptors (Cox & Alexander, 2001). The descriptors are shown in the SADL instrument in the
appendix. These descriptors show strong consistency in interpretation and clear semantic
distinctions when rated by subjects.
Tests re-test reliability and norms for Global and Subscale scores were previously
established. Norms for the SADL were developed and the results are shown in Table 9.
Table 9. Original norms for the SADL global and subscales for ages 60-75 years
These norms were further refined in a later study by (Hosford-Dunn & Halpern, 2000) when data
across a wider age range was collected. As stated earlier, standard deviations on the SADL
normative data were relatively wide, demonstrating variability across the response range.
Similarly, Kochkin (1997) reported normative data for a large group of typical hearing aid
owners in the United States. Responses on his measure of satisfaction fell across a range from
very dissatisfied to very satisfied. These data showed wide variability across the range of
responses, further suggesting that responses to the satisfaction measure in the proposed study
could be predicted to show sufficient variability to yield a significant correlation.
In this study, data from the SADL was based on Global scores derived from the mean
scores across items, as per author instructions (Cox & Alexander, 1999). A single item measure
103
of overall satisfaction, using a 0-100 scale, was included as part of the satisfaction data
collection. These data were used in a sub-question comparing the Global SADL score with the
single item satisfaction measure.
3.2.2.4 Response Bias
A variety of response biases can threaten the validity of self-report surveys. Foremost among
these biases is the tendency for some individuals to respond with answers that make them look
good rather than reporting true feelings or observations (Cox et al., 2007; Steenkamp, De Jong,
& Baumgartner, 2010). As described in the literature review, the Socially Desirable Response
Set (SDRS) construct refers to the degree to which a respondent is likely to respond with answers
that make him or her appear in a positive light. Measures of SDRS are used to control for this
bias so that response validity can be maximized. A number of SDRS measurement instruments
have been developed, validated, and used in survey research, particularly in the psychology and
marketing fields. According to Steenkamp et al. (2010) the most frequently used measure of
SDRS in marketing research is the Marlow-Crowne Socially Desirable Response Set Measure.
The original form of this scale has 33 items. A shortened form of the scale, known as the SDRS-
5 was developed and validated on two groups of outpatients across a wide age range. These
subjects did not display any psychopathology (Hays et al. 1989). The items in the shortened
version of the measure (SDRS-5) were chosen because they had the highest item—total
correlation. Internal consistency reliability was established via the use of Cronbach’s alpha and
the intraclass correlation between items across two samples of patients was calculated. These
values were compared to the longer Marlow-Crowne instrument and it was determined that the

104
shorter test is nearly as reliable as the longer version. Test retest reliability was established with
the administration of the SDRS-5 to a group of older adults two times, separated by a one month
interval.
The development of the SDRS-5 was aimed at providing a reliable instrument with which
clinicians could quickly evaluate whether survey data were likely to be influenced by the
respondents’ tendencies toward socially desirable behavior. Respondents rank each of five items
related to his/her relationships with others. The responses are scored dichotomously as either true
or false; however the response options span a five point scale ranging from definitely true to
definitely false. The expansion of response options was implemented in view of the difficulty
respondents have in choosing between the dichotomous True/False options. Scoring converts the
most extreme response in a given direction to a score of 1, indicative of socially desirable
responding. In this study, the SDRS-5 instrument was scored according to the authors’
instructions. Each of the five items in the scale had a possible value of 1 or 0, with 1 indicating
the trait of socially desirable responding. Though the instrument itself (see Appendix) asked
participants to respond along a continuum from 1-5, only the extreme values at the positive end
were actually scored as a 1. All other values were scored as a 0.
As noted in the literature review, the SDRS-5 was used by Cox et al. (2007) to explore
the relationship of response bias with a number of personality and pre-fitting variables (see
literature review page 81). In this study the SDRS-5 questionnaire was used as a means to
explore the role of socially desirable response bias in self-reports of perceived performance,
disconfirmation and satisfaction measures. Results of the SDRS-5 were used in the analysis of

105
these measures to assess the influence of socially desirable response tendency on hearing aid
outcome questionnaires and to look at the influence of this response bias on the relationship of
disconfirmation, performance, and satisfaction. Table 10 below shows each construct and its
associated instrumentation:
Table 10. Study constructs and related instruments for operationalization
Construct Instrument Performance 1. APHAP-Global
2. Single Item Performance Overall Performance for Product 1. Single Item Product Performance Performance for Service 1. Single Item Service Performance Disconfirmation 1.Disconfirmation-Global
2.Single Item Disconfirmation-Overall Disconfirmation for Product 1. Single Item Disconfirmation -Product
Disconfirmation for Service 1. Single Item Disconfirmation - Service Satisfaction 1. SADL- global 2. Single Item Satisfaction - Overall Response Bias 1. SDRS-5
3.2.3 Data Collection Procedures
3.2.3.1 Recruitment
Subjects were recruited from new hearing aid patients at the Audiology Center at the University
of Pittsburgh Medical Center. First time hearing aid users were mailed surveys, with an
invitation to participate in the study. Surveys were mailed only to private pay patients.

106
3.2.3.2 Subjects
Participants had purchased hearing aids in the four to six week period prior to completing the
survey. Eligible participants were 18 years of age or older and spoke English as their primary
language. No attempt was made to exclude any subject based on given hearing loss or hearing
aid variables other than the fact that they purchased a hearing aid within the above time frame.
3.2.3.3 Procedures:
As noted above, survey instruments were mailed to eligible participants, in paper and pencil
form, 4-6 weeks after the initial hearing aid delivery. The disconfirmation instrument included
the performance measure (APHAP) which served as the reference point for the disconfirmation
response. Participants were asked to respond to the survey items and to return the surveys as
soon as they were completed. Stamped and preaddressed return envelopes were supplied to each
participant.
The initial plan was that survey responses would be obtained from participants during the
four – twelve week time period following the hearing aid dispensing appointment. The rationale
for using this time period came from data by Humes et al (2002) showing that satisfaction ratings
obtained relatively soon after initial fitting remained stable within the first year. More
specifically, Humes found significant correlations between satisfaction measures obtained at 1
month, 6 months, and 12 months after initial fitting. In an earlier study (Humes 2001), hearing
aid users responded to a satisfaction survey addressing a variety of fitting attributes four weeks
post fitting. These responses (excepting one item) were not significantly different from the
norms for the MarkeTrak V satisfaction survey obtained on 524 consumers who had owned

107
hearing aids between three and twelve months (Kochkin, 2000). As later described in the results
section, some surveys were returned later than 12 weeks after the hearing aid fitting. Participants
who completed the study received a generic gift card in appreciation of their time and effort.
In the initial phase of data collection, participants who returned completed surveys were
asked to complete the same survey a second time, one to two weeks later. This continued until 30
participants had completed the survey twice so that test-retest reliability on the disconfirmation
measure could be measured.
3.2.3.4 Sample size determination
According to Green (1991) the determination of required sample size should be based on the
expected effect size (level of correlation sought to detect), alpha level, number of predictors, and
desired power. An alpha level of .05 was used in this study. Effect size was estimated, based on
earlier studies in the disconfirmation/satisfaction literature, when possible. For the
disconfirmation/satisfaction relationship questions prior studies had yielded coefficients ranging
from .4 to .8. (Ammentorp et al., 2006; Hudak, Hogg-Johnson, Bombardier, McKeever, &
Wright, 2004; Tse & Wilton, 1988; Wong et al., 2009). The number of predictors varied for
each question and is shown below, in the detailed data analysis for each question. Based on these
factors a sample size of 100 subjects was initially planned to achieve over 80% power to detect a
moderate coefficient of .4, in each of the main questions. A preliminary analysis was completed
after data from 60 participants were collected. Based on the strong correlations and large effect
sizes observed, data collection was discontinued. The observed power for each question was at
least .999.

108
3.2.4 Data collected
The following data were obtained from each participant.
1. Demographic data from each participant included age and gender, as well as categorically
coded income level and education level. These data were used for descriptive purposes
and were not examined specifically in relation to satisfaction outcomes in this project.
This sample was representative of typical private pay hearing aid users in an urban
Medical Center setting. As such, it was expected that the age range would be limited to
approximately age 60-90, and that the range for hearing aid cost would largely be limited
to one or two price categories used at the recruitment site.
2. Performance as measured by the Abbreviated Profile of Hearing Aid Performance
(APHAP):
a. Global score on the Abbreviated Profile of Hearing Aid Performance (APHAP)
b. Single-item rating of hearing aid performance
3. Disconfirmation:
a. Global Disconfirmation was calculated as the mean of the disconfirmation scores
for all items of the APHAB.
b. An overall disconfirmation rating, obtained from the single item measure of
disconfirmation for the hearing aid fitting.
c. Single-item ratings of disconfirmation for the hearing aid performance and
disconfirmation for service.

109
d. Global Disconfirmation from the APHAP, as described in item a above, was
obtained a second time and was used to assess test retest reliability (further detail
below). Similarly, the disconfirmation ratings described in b and c above were
collected a second time for test-retest reliability analysis.
4. Satisfaction as measured by the Satisfaction with Amplification in Daily Life (SADL):
a. Global Satisfaction was calculated as the mean of the scores for all items rated in
the Positive Effects (PE), Service and Cost (SC), Negative Features (NF), and
Personal Image (PI) subscales. Of note, one question in regard to telephone use
was left out of the calculation if the participant noted no difficulty on the
telephone without hearing aids.
b. Overall Satisfaction rating on the single-item satisfaction for hearing fitting
measure.
5. Socially Desirable Response Tendency as measured by the SDRS-5:
A total SDRS-5 score was calculated for each participant. Scoring was based on
the author’s directions. Responses at the extreme of the scale were scored 1, while
all other responses were scored 0. These scores were then transformed to a 0-20
range.
The table below represents the constructs, operationalization, data collected, and
questions for which data were used in the study.
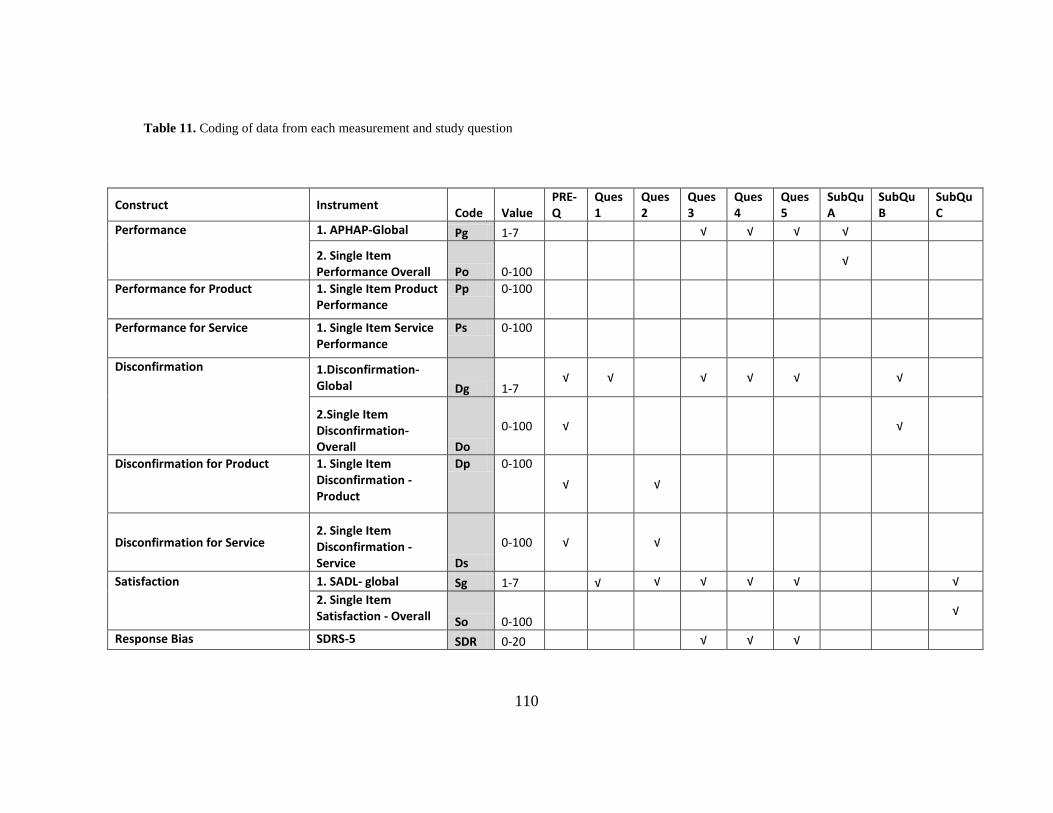
110
Table 11. Coding of data from each measurement and study question
Construct Instrument Code Value PRE-Q
Ques 1
Ques 2
Ques 3
Ques 4
Ques 5
SubQu A
SubQu B
SubQu C
Performance 1. APHAP-Global Pg 1-7 √ √ √ √
2. Single Item Performance Overall Po 0-100
√
Performance for Product 1. Single Item Product Performance
Pp 0-100
Performance for Service 1. Single Item Service
Performance Ps 0-100
Disconfirmation 1.Disconfirmation-Global Dg 1-7
√ √ √ √ √ √
2.Single Item Disconfirmation-Overall Do
0-100 √ √
Disconfirmation for Product 1. Single Item Disconfirmation -Product
Dp 0-100 √ √
Disconfirmation for Service 2. Single Item Disconfirmation - Service Ds
0-100 √ √
Satisfaction 1. SADL- global Sg 1-7 √ √ √ √ √ √
2. Single Item Satisfaction - Overall So 0-100
√
Response Bias SDRS-5 SDR 0-20 √ √ √

111
3.2.4.1 Management of missing data
Participants occasionally left survey questions blank, resulting in missing data points. Any
participant survey containing responses to at least 75% of the survey questions was included in
the analysis.
3.2.4.2 Descriptive data
Data from each of the measures described above was used to calculate the mean, median,
standard deviation and range. These values provided a summary of the distribution of the
participant self-report ratings across constructs.
3.3 SPECIFIC RESEARCH QUESTIONS AND ANALYSIS
3.3.1 Pre-study question
Do repeated administrations of the APHAP-based Hearing Aid Disconfirmation measure, and
single-item measures of overall disconfirmation, disconfirmation for product, and
disconfirmation for service, yield equivalent results?
Data from 30 subjects were used to answer this question. An Intra-Class Correlation
(ICC) was calculated with variables being Disconfirmation Score (Global and single-item

112
overall, single-item product, and single-item service) and test occasion (first and second) as
shown in the table below.
Table 12. Pre-study question constructs, instruments, codes, and values
Construct Instrument Code Value Disconfirmation Tests 1.Disconfirmation-Global- Time 1 Dg1 1-7
2.Single Item Disconfirmation-Overall Time 1 Do1 0-100
1. Single Item Disconfirmation -Product Time 1 Dp1 0-100
2. Single Item Disconfirmation – ServiceTime 1 Ds1 0-100
Disconfirmation Retests 1. Disconfirmation -Global-Time 2 Dg2 1-7
2.Single Item Disconfirmation-Overall Time 2 Do2 0-100
1. Single Item Disconfirmation -Product Time 2 Dp2 0-100
2. Single Item Disconfirmation - Service Time 2 Ds2 0-100
Null Hypotheses: 1 H0: ρDg1,Dg2=0
2
H0: ρDo1,Do2=0
3
H0: ρDp1,Dp2=0
4
H0: ρDs1, s2=0
This question addressed test-retest reliability for the disconfirmation measures used in the study.
Of note, test re-test reliability had previously been established for the performance and
satisfaction measures and was not specifically re-evaluated in this study.

113
3.3.2 Main research questions
The table below shows the construct, instruments, data code, and possible values for data used in
the main questions:
Table 13. Main research questions constructs, instruments, codes, and values
Construct Instrument Code Value Performance 1. APHAP-Global Pg 1-7
2. Single Item Performance Overall Po 0-100 Performance for Product 1. Single Item Product Performance Pp 0-100 Performance for Service 1. Single Item Service Performance Ps 0-100 Disconfirmation 1.Disconfirmation-Global Dg 1-7
2.Single Item Disconfirmation-Overall Do 0-100 Disconfirmation for Product
1. Single Item Disconfirmation -Product Dp 0-100
Disconfirmation for Service 1. Single Item Disconfirmation - Service Ds 0-100
Satisfaction 1. SADL- global Sg 1-7 2. Single Item Satisfaction - Overall So 0-100 Response Bias 1. SDRS-5 SDR 0-20
3.3.2.1 Question #1
Does global disconfirmation predict global satisfaction in first-time hearing aid users?
Power : With the sample size of 59 and alpha=.05 the observed power for this question was
>.999.

114
Independent Variables:
1. Dg1
Dependent Variables:
1. Sg1
Regression Equation:
Sg= b0 + b1 Dg + E
rediction: b1>0
Figure 4. Predicted regression line question 1
Data for this question came from the global scores of the APHAP-based disconfirmation
measure and from the global scores of the SADL measure. This question addressed the
underlying motivation for this research project. It explored the relationship between
disconfirmation and satisfaction. It was hypothesized that higher levels of positive
disconfirmation would be associated with higher levels of satisfaction, as has been shown in the
consumer and health care literature. Results for this question were intended to demonstrate
whether the expectancy-disconfirmation model of satisfaction offers a valid framework from
which we can further explore and understand hearing aid fitting/purchase satisfaction.
satisfaction
disconfirmation

115
3.3.2.2 Question #2
How is overall hearing aid satisfaction influenced by disconfirmation for product and
disconfirmation for service elements of the purchase?
Power: With a sample size of 60 and alpha = .05 observed power for this question was > .999
Independent Variables: 1.
Dp
2. Ds
Dependent Variables:
1. Sg
Regression Equation:
Sg=bo+b1Dop+b2Dos+E
Prediction: b1 >0; b2 >0;b1≠b2
Figure 5. Predicted regression lines for question 2

116
Data for this question came from the single-item measures of disconfirmation for
product, disconfirmation for service, and global hearing aid satisfaction as measured by the
SADL. This question explored the contribution of disconfirmation for the hearing aid product
and disconfirmation of the related services to global hearing aid satisfaction. It was predicted that
as disconfirmation for these elements increased, so too would satisfaction. It was not clear from
the literature which of these areas would be more likely to show a greater contribution to
satisfaction.
3.3.2.3 Question #3
What is the influence of Socially Desirable Response Set on self-reported measures of hearing
aid performance, disconfirmation, and satisfaction with hearing aids?
Power: This question involved one independent variable, socially desirable response set,
and its influence on three different dependent variables. The original estimate of power, with a
sample size of 100, medium effect size, and alpha = .05, was .99.
Independent Variables
1. SDR
Dependent Variables
1. Pg
2. Dg
3. Sg
Equations:
Pg= b0+b1SDR+E Dg= b0+b1SDR+E
Sg= b0+b1SDR+E
Prediction:
b1>0 for each equation

117
Figure 6. Predicted regression lines for question 3
Data for this question came from scores on the SDRS-5 instrument and from global
APHAP, global disconfirmation, and global SADL scores. This question explored whether
higher levels of socially desirable response tendency are associated with higher self-reported

118
ratings on hearing aid performance, disconfirmation, and satisfaction. It was predicted that
higher SDRS-5 scores would be associated with higher global scores on the APHAP,
disconfirmation measure, and SADL.
3.3.2.4 Question #4
What are the influences of perceived performance and disconfirmation on satisfaction,
controlling for socially desirable response set?
Power: With an N= 58, a large effect size, and alpha=.05 power was > .999.
Independent Variables
1. Pg
2. Dg
3. SDR
Dependent Variables
1. Sg
Equation:
Sg= bo+b1Pg+b2Dg+b3SDR+E Prediction: b1>0, b2>0,b3>0; b1<b2, b2>b3

119
Figure 7. Predicted regression lines for question 4
Data for this question came from the APHAP and global disconfirmation measure, and
from the SDRS-5 measure and global SADL score. This question included the perceived
performance construct to assess its contribution towards satisfaction, along with the contribution
of disconfirmation. Adding the SDRS-5 data into this equation allowed for these variables to be
assessed while taking into account contribution of the socially desirable response tendency. It
was predicted that higher perceived performance and positive disconfirmation would be
associated with higher rated satisfaction. It was predicted that higher socially desirable response
tendency would be associated with higher satisfaction.
3.3.2.5 Question #5
Does socially desirable response tendency moderate the influence of disconfirmation and
perceived performance on satisfaction?
Power: This question involved 2 variables and 3 covariates. With the large effect size
and alpha =.05, the sample size of 58 yielded a power of >.999.
Independent Variables 1. SDR X Pg
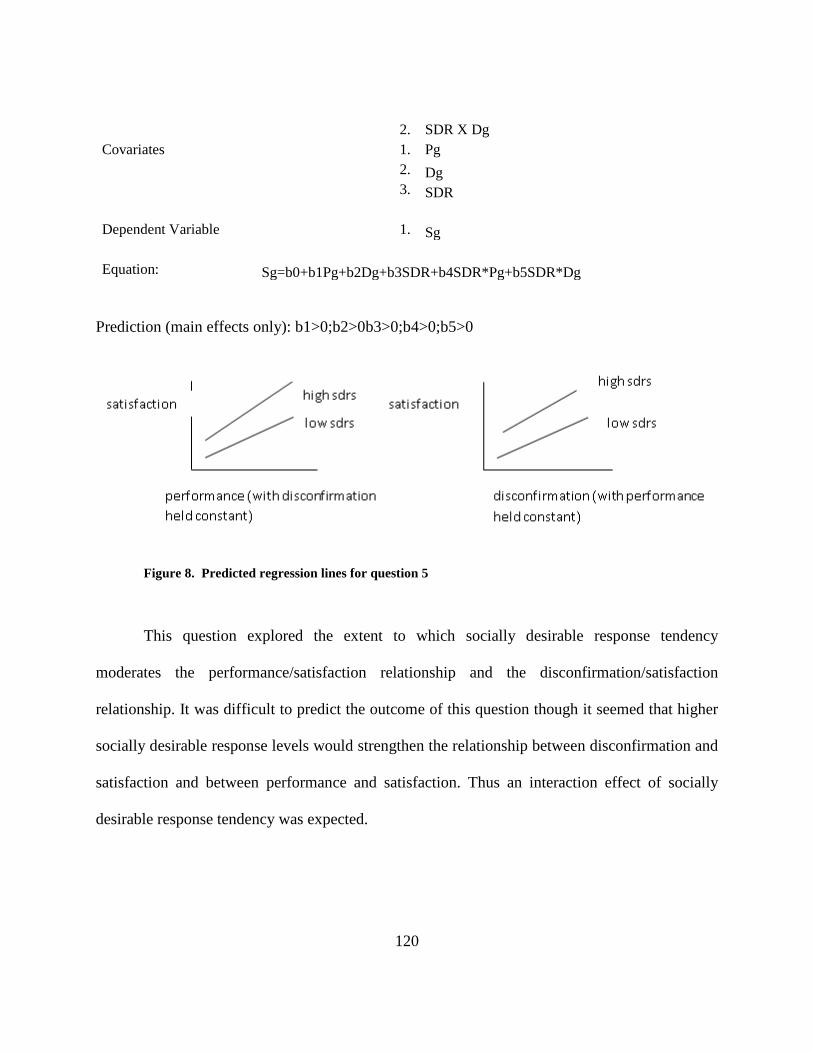
120
2. SDR X Dg Covariates 1. Pg 2. Dg 3. SDR
Dependent Variable 1. Sg
Equation: Sg=b0+b1Pg+b2Dg+b3SDR+b4SDR*Pg+b5SDR*Dg
Prediction (main effects only): b1>0;b2>0b3>0;b4>0;b5>0
Figure 8. Predicted regression lines for question 5
This question explored the extent to which socially desirable response tendency
moderates the performance/satisfaction relationship and the disconfirmation/satisfaction
relationship. It was difficult to predict the outcome of this question though it seemed that higher
socially desirable response levels would strengthen the relationship between disconfirmation and
satisfaction and between performance and satisfaction. Thus an interaction effect of socially
desirable response tendency was expected.

121
3.3.2.6 Sub-Questions:
The following sub-questions explored the equivalence of the single-item measures of overall
performance, overall disconfirmation, and overall satisfaction with the multiple-item measures.
A . Are scores from a single- item overall Performance rating equivalent to the Global APHAP score?
Independent variables:
1. Po1 Dependent Variable
1. Pg
Equation
Po=bo+b1Pg+E Prediction: b1>0
Figure 9. Predicted regression line for sub-question A
B. Are scores from a single-item overall disconfirmation rating equivalent to the APHAP-based global disconfirmation score? Independent Variable 1.Do1 Dependent Variable 1.Dg
Equation Do=bo+b1Dg+E Prediction: b1>0
single item performance
global performance (APHAP)

122
Figure 10. Predicted regression line for sub-question B
C. Are scores from a single-item overall satisfaction rating equivalent to the SADL global
satisfaction score?
Figure 11. Predicted regression line for sub-question C
Independent Variable
1. So1 Dependent Variable
1. Sg
Equation
So=bo+b1Sg+E Prediction:b1>0
single item satisfaction
global satisfaction (SADL)
single item disconfirmation
global disconfirmation

123
4.0 RESULTS AND CONCLUSIONS
4.1 RESULTS
4.1.1 Descriptive statistics: participant demographics
The time elapsed between the hearing aid fitting and mailing of the outcome measurement
instruments to participants ranged from 4-6 weeks. Completed questionnaires from participants
were received across a range from 10- 56 days after mailing, with a mean of 23 days.
Surveys were mailed to 215 potential participants. The response rate was 31%. Data were
analyzed from 67 participants. Missing data from some participants resulted in varied N’s for
individual analyses. The sample included 29 females and 35 males. Data on participant age are
shown in table 14.
Table 14. Age data for participants (n=64)
Mean 70.7 years Median 69.0 years Standard Deviation 10.95 Range 50-93 years

124
Information on participants’ level of education is shown in Figure 12. Note that a
majority of participants reported completing grade 12 or higher, with almost 30% of participants
reporting an advanced degree beyond 4 years of college. The relatively high level of education of
this sample probably represents the patient population at the University Medical Center from
which the hearing aids were fit and purchased. Additionally, it is possible that the relatively high
level of education seen in the sample is more heavily weighted by those individuals who
completed and returned the surveys.
Figure 12. Distribution of participants by highest grade of school completed.
Household income was reported in 12 categories ranging from less than $10,000 per year
to $150,000 or higher per year. As shown in Figure 13, the participant sample was heavily
weighted toward the higher income categories. This weighting likely reflects both the high level

125
of education in the sample and the perception of hearing aids as a relatively high cost consumer
item.
Figure 13. Distribution of participants across categories of household income
4.1.2 Descriptive statistics: measurement instruments
The distribution of responses to individual questions on the APHAP instrument and the SADL
instrument were similar to those found in earlier publications (Cox and Alexander, 1995; Cox
and Alexander, 1999), showing normal distributions and expected variability. Responses on the

126
APHAP-based disconfirmation measure were normally distributed as well. Table 15 shows the
mean, median, standard deviation, and range of scores on each of these instruments.
Table 15. Descriptive statistics for responses across measurement instruments
APHAB Global score
Global discomfirmation
SADL total score
SDRS-5
N Valid Missing
63 5
63 5
64 4
66 2
Mean 5.03 4.28 5.0711 5.51
Median 5.13 4.04 5.0714 4.0000 Std. Deviation .74626 1.069 .80149 6.33006 Range 2.13-6.22 1.89-6.96 3.33-6.47 0-20
4.1.3 Pre-study question: Test-retest reliability on disconfirmation measures
Intraclass correlation coefficients (ICC) were used to assess the test-retest reliability of the
disconfirmation measures. The measures evaluated included the APHAP-based disconfirmation
measure and the single item measures of disconfirmation for fitting, product, and service.
Correlation coefficients, reflecting the relationship between Time 1 and Time 2
administration of the Disconfirmation instruments, are shown in Table 16. Due to missing
responses from some participants, the test re-test data on global disconfirmation were based on
N=26, versus the originally planned sample size 30.

127
Table 16. ICC coefficients on T1-T2 disconfirmation responses
Variable ICC Coefficient
N
Global disconfirmation (mean of APHAP- based items) .76 26 Single item disconfirmation for fitting .70 30 Single item disconfirmation for product .64 30 Single item disconfirmation for service .58 30
Cronbach’s Alpha was used to measure internal consistency reliability of the APHAP-
based disconfirmation items, yielding a coefficient of .87.
4.1.4 Results of analysis on specific research questions
Linear regression analyses were conducted on data relating to each of the main research
questions and the results are described below. In all cases where significant effects were found,
scatter plots of the data were examined and the assumption of linearity appeared to be met.
Further results and explanation of individual analyses follows.
4.1.4.1 Q1: Global disconfirmation predicting satisfaction
Question #1 was designed to determine the extent to which global disconfirmation predicts
satisfaction ratings in first time hearing aid users. This analysis addressed the central research
question being investigated: Does the relationship between disconfirmation and satisfaction in
first time hearing aid purchasers fit the expectancy-disconfirmation model of satisfaction tested
in other consumer and patient care contexts? A bivariate regression analysis was conducted,

128
where hearing aid satisfaction was regressed on disconfirmation and a significant model emerged
with F(1,57) =44.01, p < .01, adjusted r2 = .43). The predictor variable of disconfirmation yielded
a beta of .52.
These results indicate that 43% of the variance in satisfaction is explained by level of
disconfirmation, showing a large effect size (Cohen and Cohen, 1983).
4.1.4.2 Q2: Disconfirmation for product/service predicting satisfaction
Question #2 addressed the contribution of disconfirmation for product and disconfirmation for
service as predictors of hearing aid satisfaction. Based on the moderate correlation (.557) of
these two predictor variables, collinearity diagnostics were run. The resulting tolerance and VIF
(variable inflation factor) values were not consistent with those seen in collinear variables. With
these single item response variables entered into the model together, the model was significant
with F(2,57) =29.207, p <.01, and adjusted R2 = .49. Beta and p values of the variables are shown
in table 17.
Table 17. Beta and p values for predictor variables, question 2
Predictor Variable Beta p value
Disconfirmation product .303 <.001
Disconfirmation service .062 .312

129
Disconfirmation for product significantly contributed to the prediction of satisfaction,
when adjusting for disconfirmation for service. Disconfirmation for service did not significantly
contribute to the prediction of satisfaction, after adjusting for disconfirmation for product.
4.1.4.3 Q3: Influence of response bias on hearing aid measures
Question 3 addressed the influence of response bias on the performance, disconfirmation, and
satisfaction measures. Response bias was represented by the SDRS-5. Responses on the Social
Desirability Response Set (SDRS-5) were skewed towards the lower end of the response range.
Individual regression analyses were run, with each of the measures (APHAP, APHAP-based
disconfirmation, and SADL) regressed on SDRS-5. In each of the three regressions no
significant effect was demonstrated, as shown in table 18.
Table 18. Regression of performance, disconfirmation, and satisfaction on SDRS-5
Predictor Adjusted r2 F value p value
Perceived Performance .006 1.36 .248
Disconfirmation .000 .990 .324
Satisfaction -.004 .773 .383

130
These results did not demonstrate any significant effect of response bias (as measured by the
SDRS-5) on self-report measures of perceived performance, disconfirmation, or satisfaction.
4.1.4.4 Q4: Performance/disconfirmation predicting satisfaction
Question 4 investigated the contribution of perceived performance and disconfirmation on
satisfaction, controlling for socially desirable response set. Collinearity diagnostics were run on
the variables of performance and disconfirmation. Tolerance and VIF values were not consistent
with collinearity. Satisfaction was regressed on performance, disconfirmation, and socially
desirable response set. The resulting model was significant, F(3,54) =22.70, p <.001., adjusted R2
= .53. Beta, p values, and r2 of variables are shown in table 19.
Table 19. Beta and p values for performance, disconfirmation, and response bias
Predictor Variable Beta P value
Perceived Performance .465 <.001
Disconfirmation .362 <.001
Socially Desirable
Responding
-.010 .517
Taken together, socially desirable responding, performance and disconfirmation
accounted for 53% of the variance in satisfaction. After adjusting for all other variables in the
model, performance and disconfirmation each showed a significant contribution to predicting

131
satisfaction. Socially desirable responding did not show a significant contribution to the
prediction of satisfaction.
4.1.4.5 Q5: Interaction of response bias on prediction of satisfaction
This question examined whether the socially desirable response set moderates the influence of
disconfirmation and performance on satisfaction. Satisfaction was regressed on disconfirmation
and perceived performance with and without the variable of socially desirable responding as an
interaction term. When the interaction terms were added into the model the r2 change was .033, a
very small change. Further data exploring a moderating effect of socially desirable responding
on the prediction of satisfaction by perceived performance and disconfirmation is shown in table
20.
Table 20. Beta, t and p values for the interaction term of socially desirable responding
Beta t p value
SDRS x Perceived
performance .048 2.026 .048
SDRS x
Disconfirmation -.011 -.735 .465
SDRS x perceived performance showed a significant interaction, with a small effect.
SDRS x disconfirmation did not show a significant interaction.

132
4.1.4.6 Predicting multi-item questionnaire results from single items
The sub-questions investigated the equivalence of the single item measures of overall
performance, overall disconfirmation, and overall satisfaction with the multiple-item APHAP
and SADL based measures. These questions addressed whether participants’ reports of
performance, disconfirmation, and satisfaction via multiple item instruments could validly be
captured via one single item question for each construct. To answer this question, each of the
multiple item measures was regressed on its related single item measure to see how well one
could predict the other. The results are shown in table 21.
Table 21. Data from regression of single item measures on multiple item measures
Variables R Adjusted r2 F p value beta
global APHAP score regressed on single item performance
.57 .32 26.91 < .001 .03
global disconfirmation regressed on single item disconfirmation
.85 .71 148.89 < .001 .51
global satisfaction regressed on Single item satisfaction
.51 .25 20.85 <.001 .02
For each of the constructs tested above the model was significant. The single item perceived
performance rating accounted for 32% of the variance in the global APHAP score. The single

133
item disconfirmation rating accounted for 71% of the variance in global disconfirmation. The
single item satisfaction rating accounted for 25% of the variance in global satisfaction.
4.2 DISCUSSION
4.2.1 Pre-study question: Test-retest reliability on disconfirmation measures
The pre-study questions were intended to determine whether test-retest reliability on the
APHAP-based disconfirmation instrument and on the single item disconfirmation measures
could be demonstrated. As seen in table 16, responses from time 1 and time 2 on the APHAP-
based disconfirmation were highly correlated (p<.01) on each of the measures tested. Calculation
of the ICC includes analysis of both the relationship between values at Time 1 and Time 2, and
the differences between responses at Time 1 and Time 2. Thus, the large ICC values (Cohen,
1988) demonstrated that responses at each administration were not only highly related, but very
close in actual value. Internal Consistency Reliability on the APHAP-based disconfirmation
measure was high, demonstrating the unidimensional nature of the underlying construct. The
highest correlation was found on the APHAP-based global disconfirmation scores, contributing
to the legitimacy of the instrument by demonstrating test-retest reliability. The single item
disconfirmation responses yielded moderate- large correlations, with the lowest coefficient value
coming from the disconfirmation for service item (r=.58). In addition to the pre-study question,
test retest reliability on the APHAP items was measured. The results showed a large positive
correlation between responses at time 1 and time 2 (r=.80, p>.01) as has been shown previously
134
by Cox and Alexander (1995). Thus, participants largely maintained their responses from test to
retest. These data were taken from the global scores of the multi-item instrument and did not
probe test-retest reliability in specific subscales of the instrument. Of note, the lower correlation
seen in the disconfirmation for service item could indicate that this is a weaker construct in the
hearing aid delivery context studied. In other words, it is possible that patients referred for
hearing aid delivery do not think much about the service component they expect to receive as
part of the hearing aid fitting experience. This could explain why reporting of the
disconfirmation is not as stable as that of disconfirmation for the product or for the overall fitting
experience.
4.2.2 Q1: Global disconfirmation predicting satisfaction
This question addressed the extent to which disconfirmation could predict satisfaction in the
hearing aid purchase context. These results are consistent with those predicted for this question,
providing evidence that the expectancy-disconfirmation model of satisfaction has relevance to
first time hearing aid purchasers. More specifically, the model suggests that one unit of increase
in disconfirmation yields a .5 unit of increase in satisfaction. The r2 value obtained (.43) was
consistent with those published by Wong et al. (2009) across several aspects of hearing aid
service and performance (r2= .32-.76) in Chinese users. This large effect (Cohen & Cohen, 1983)
is similar to that (r2=.31-.73) shown in earlier expectancy-disconfirmation research across
contexts unrelated to hearing aids (Ammentorp et al., 2006; Hudak et al., 2004; Tse & Wilton,
1988). This finding provides a basis upon which to further look towards customer satisfaction

135
models to help us increase our understanding of hearing aid satisfaction. Additionally, this result
gives us empirical evidence of the indirect importance of expectations in successful hearing aid
adoption. Inherent in these results is the notion that level of expectation, and level of perceived
performance, together contribute to the outcome of hearing aid satisfaction.
Some caveats are necessary in interpreting the strong predictive relationship
demonstrated in this question. The analysis in this study did not allow for exploration of
individual contributions of specific aspects of hearing aid disconfirmation. This would require
analysis of the subscale data from the disconfirmation instrument. The subscales may point to
specific areas of hearing aid performance for which appropriate expectations play a more
important role in facilitating satisfaction. Examination of subscale correlations with satisfaction
could be addressed in a future analysis of these data.
Another limitation in this study was that the order of the outcome measures presented in
the survey was not counterbalanced. Thus it is possible that the order of the questions could have
had a systematic effect on the responses. For example, participants were first asked the
performance questions, focusing their attention on how the hearing aid performed across a
variety of specific listening situations. The single item performance questions followed. It is
possible that focusing attention on the specific listening situations could have influenced the
responses on the single item performance questions. The satisfaction instrument followed the
performance questions and the SDRS-5. It is possible that placement of the satisfaction
instrument at the beginning of the survey might have captured higher or lower responses. These
responses would have been free of any prior focused attention on specific listening situations in
which the hearing aid performance was not optimal. In other words, it is possible that focusing

136
the participants’ attention on specific listening situations could have prompted responses that
were higher or lower than if the questions were otherwise ordered.
Use of the subjective disconfirmation approach could have yielded less valid
disconfirmation data, than that obtained using an objective approach. The subjective method
used inherently involves a memory of the expectation, which occurred prior to the hearing aid
purchase. It is not known whether an objective measure of disconfirmation might yield a
different outcome. Similarly, the operationalization of each construct can be questioned, and if
implemented differently could yield a different outcome. A variety of methodological issues can
be addressed in future studies.
This study did not specifically control for the hours of daily use of the hearing aids.
Similarly, there was no assessment of the level of expectations each participant brought to the
hearing aid fitting.
Lastly, the hearing aid delivery model needs to be considered in interpreting these data.
This study was conducted in a university medical center setting, where many of the customers
are referred by a physician to seek hearing aid follow up. The data might look different if
collected from a sample of non-paying hearing aid patients such as veterans who are serviced
through the VA Healthcare System. Similarly, patients in non-medical private practices may
have different expectations which might lead to a different level of disconfirmation and/or
satisfaction.

137
4.2.3 Q2: Disconfirmation for product and service predicting satisfaction
This question addressed the contribution of disconfirmation for product and disconfirmation for
service components of the hearing aid delivery. The single item measures were used to address
the constructs in this question. Together, the disconfirmation for product and disconfirmation for
service accounted for approximately half of the variance in satisfaction. Of these variables, the
disconfirmation for product appears to contribute most significantly to the satisfaction when both
service and product are considered together. The question began to address the interwoven roles
of product and service elements in the hearing aid fitting/purchase. Unlike other consumer and
health service contexts, it is possible that hearing aid purchasers in a medical center venue may
not formulate explicit expectations of the service they will receive. This may be related to the
relatively young and unrecognized profession of Audiology. In other words, a patient referred for
a hearing aid by his/her ENT may not anticipate that a professionally credentialed audiologist
will provide a specific array of services related to the hearing aid. In contrast, he/she probably
anticipates something about the service/affect of his/her dentist or lawn care provider, as has
been shown in the disconfirmation literature (Alford, 1998). It is possible that this outcome
might be different if this study were done in a private practice setting, unrelated to a medical
center referral system. Those settings are likely to be chosen by the customer either based on
advertising or word of mouth, possibly resulting in better developed expectations of service. As
noted in the results of the pre-study questions, it may be that the construct of expectations of
service in the hearing aid delivery context is not as well developed as is disconfirmation for

138
product. As with question #1 there is more to explore regarding the contributions of each of these
predictors in this unusual context of product, service, and healthcare.
4.2.4 Q3-5: Influence and moderating effect of response bias
Questions 3-5 are grouped together here because all are related to assessing the influence and/or
moderating effect of response bias, as measured by socially desirable response set. Does the
socially desirable response tendency result in bias that systematically influences self-report
hearing aid outcome measures? What are the contributions of performance, disconfirmation and
socially desirable response set on satisfaction? How does socially desirable response set
moderate the influence of performance and disconfirmation?
It was expected that the results of question #3, regarding socially desirable responding,
would show that a higher level of response bias was associated with higher ratings on self-report
measures of performance, disconfirmation, and satisfaction. The data did not support this
hypothesis. The results showed no significant effect evident on any of the three self-report
measures. This finding was consistent with results obtained by Cox et al (2007), and seems to
confirm that response bias, defined by this particular instrument, does not diminish validity of
the hearing aid outcome measures used. Of note, Cox et al (2007) used a slightly different
scoring approach when they looked for an influence of SDRS-5 on hearing aid self-report.
However, even with this difference in scoring the current study essentially replicates their
finding of no influence from this particular response bias. There are a few possible
interpretations of this finding. This bias has been demonstrated in self-report instruments in

139
other domains. Perhaps reports of hearing/hearing aid function and/or satisfaction, particularly
after hearing aid purchase, have some immunity to socially desirable responding. This could be
related to a possibly reduced zone of tolerance for hearing aid purchases than that seen in more
typical consumer products. Additionally, interpretation of these results should not discount other
sources of potential response bias that could influence the self-report measures. Other variables
that were not measured in this study (i.e. personality, mental and physical health factors) could
influence these outcomes. This finding did not support the hypothesis for this question, but it
does offer an added level of cautious confidence in the results of self-report measures used in
both clinical and research applications involving hearing aid outcomes.
The results of question #4 addressed the contribution of disconfirmation for product and
disconfirmation for service in predicting satisfaction, controlling for socially desirable
responding. Perceived performance, disconfirmation, and socially desirable responding together
explained over 50% of the variance in satisfaction. However, once perceived performance and
disconfirmation are accounted for, the contribution of socially desirable responding is not
significant. This is not surprising given that there was no effect of socially desirable responding
on any of the measures. The results do show that both perceived performance and
disconfirmation make a unique contribution to satisfaction. The strength of the relationship
appears to be roughly similar for each of these factors, however further analysis would be
necessary to more accurately assess the distinct contribution of each of these variables.
Finally, consistent with the earlier findings related to socially desirable responding, there
is a very weak moderating effect of the SDRS-5 on the prediction of satisfaction by perceived
performance. In other words, for a hearing aid user with high perceived performance, the level of

140
socially desirable responding may have a bigger impact on satisfaction versus those with lower
perceived performance. There was no moderating effect on prediction of satisfaction by
disconfirmation. In general, socially desirable responding does not seem to play a role in
satisfaction formation in the hearing aid context. As noted earlier, other forms of response bias
may play a role and should be investigated in the future. This result can only be interpreted in
the context of American culture. It is possible that a different result could occur if tested in
cultures where individuals are less likely to question authority, or where behavior is more
heavily dictated by social norms than in the United States.
4.2.5 Predicting multi-item questionnaire results from single items
Each of these single item measures had a large effect size, based on Cohen and Cohen (1983).
Responses on the single item question on hearing aid performance serve as a strong predictor of
the global APHAP scores. The single item measure regarding hearing aid disconfirmation is a
strong predictor of the global disconfirmation score. Lastly, responses on the single item
satisfaction question are a strong predictor of the global SADL score. This means that an
increase in the score of the single item measure results in an increase in the global score in each
of the measures. The strong predictive value of the single item measures for the multiple item
measures increases the construct validity of both measures. Cox and Alexander (2001) showed a
high correlation between a single item satisfaction question and the SADL (.76). The reported
results on the satisfaction measures were obtained in a manner similar to the current study,
except that the sample in their study included long time hearing aid users. The correlation for the

141
single item versus multiple item satisfaction measures was somewhat lower (.51) in the current
sample than in their study.
Though these single item measures may capture the overall response level of the multiple
item measures, they cannot provide the precision information useful in both research and clinical
purposes. For example, a new hearing aid user may have one specific listening situation in which
he does not perceive his hearing aid to perform well. This specific situation, and the appropriate
adjustment, would not be identified in a single item rating of product performance. Similarly,
subscale groupings in the multiple item measures will allow for more specific analysis of
predictors of outcomes such as satisfaction.
4.3 CONCLUSIONS
Most prior studies of hearing aid satisfaction have analyzed the relationship between satisfaction
and a number of variables that relate to hearing aid features or factors particular to users. This
project approached the subject by studying users’ internal experiences with hearing aid adoption,
based on a consumer model of satisfaction. Following up on the work of Wong et al (2009), this
study was the first research evaluating the expectancy-disconfirmation model of satisfaction in
first time hearing aid users in the United States. The results of this study are consistent with those
seen in the consumer and healthcare literature, confirming that the expectancy-disconfirmation
model offers a legitimate prospective from which we can further study the components of
hearing aid satisfaction. A disconfirmation instrument, based on the APHAB instrument,

142
demonstrated adequate test-retest reliability and internal consistency to serve as a valid data
collection instrument for hearing aid disconfirmation. This instrument was used to demonstrate
that as participants’ disconfirmation increased in the positive direction, so did satisfaction.
Hearing aid users with high expectations were likely to experience a smaller positive
disconfirmation. Those hearing aid users with smaller positive disconfirmation were likely to
demonstrate lower levels of satisfaction. It appears that disconfirmation of the hearing aid
instrument’s product performance may carry greater influence on satisfaction than does
disconfirmation of the service provided around the fitting. Perceived performance of the hearing
aid and global disconfirmation both seem to make a substantial contribution to satisfaction.
4.3.1 Future questions
This study has shown that the expectancy-disconfirmation model of satisfaction provides a valid
framework in which to further explore, and hopefully improve, hearing aid satisfaction. As such,
a number of questions regarding hearing aid satisfaction can now be addressed using this model.
1. When is the disconfirmation most important for achieving satisfaction in hearing aid users?
For example, is disconfirmation an important predictor of satisfaction in hearing aid users 6
months or a year after purchase?
2. Do certain aspects of the hearing aid experience contribute more or less to the satisfaction
outcome? That is, does disconfirmation as measured in APHAP subscales contribute
differentially to satisfaction?

143
3. Does manipulation of expectation e.g., reducing negative disconfirmation improve
satisfaction. If so, what are the most effective means by which to establish appropriate
expectations?
4. Does the disconfirmation model predict satisfaction in other hearing aid delivery models in
the United States such as the Veterans Affairs system or Vocation Rehabilitation programs,
where patients do not pay for their hearing instruments? Similarly, might the service
component play a larger role in determining satisfaction in a non-medical private practice
setting, where expectations for service may be greater?
The answers to these questions should be of direct value to audiologists and hearing aid
manufacturers in providing pre-fit product and service information to patients and to the public.
Additionally, research within this framework might guide the allocation of hearing aid
dispensing resources in the pursuit of improved patient/customer satisfaction.

144
APPENDIX
PARTICIPANT QUESTIONNAIRE

145
The questions below will ask you first to rate the performance of your hearing aid in a variety of listening situations. Then you will be asked to rate how the performance of your hearing aid compares to your expectations before the hearing aid purchase.
Please mark an X above the description that best describes your everyday experience when you are using your hearing aids. Notice that each choice includes a percentage. You can use this to help you decide on your answer. For example, if a statement is true about 75% of the time, circle “Generally” for that item.
Then you should mark an X above the number that best describes how your hearing compares to your expectation before you were fit with hearing aids. If you have not experienced the situation we describe, try to think of a similar situation that you have been in and respond for that situation. If you have no idea, leave that item blank.
Since getting my hearing aids:
1. A. With my hearing aid(s) on: When I am in a crowded grocery store, talking with the cashier, I can follow the conversation __________ ________ ________ ________ ________ _______ ________ Always (99%) Almost Always (87%) Generally(75%) Half-the-time (50%) Occasionally (25%) Seldom (12%) Never (1%) B. Compared to my expectation, my hearing in the above situation is
_______
(-3) Worse than I expected
_______ (-2)
_______ (-1)
_______ (0)
Just as I expected
_______ (1)
_______ (2)
_______ (3)
Better than I expected
2. A. With my hearing aid(s) on: I miss a lot of information when I’m listening to a lecture __________ ________ ________ ________ ________ _______ ________
Always (99%) Almost Always (87%) Generally(75%) Half-the-time (50%) Occasionally (25%) Seldom (12%) Never (1%)

146
B. Compared to my expectation, my hearing in the above situation is
_______ (-3)
Worse than I expected
_______ (-2)
_______ (-1)
_______ (0)
Just as I expected
_______ (1)
_______ (2)
_______ (3)
Better than I expected
3. A. with my hearing aid(s) on: Unexpected sounds, like a smoke detector or alarm bell are uncomfortable. __________ ________ ________ ________ ________ _______ ________ Always (99%) Almost Always (87%) Generally(75%) Half-the-time (50%) Occasionally (25%) Seldom (12%) Never (1%) B. Compared to my expectation, my hearing in the above situation is
_______ (-3)
Worse than I expected
_______ (-2)
_______ (-1)
_______ (0)
Just as I expected
_______ (1)
_______ (2)
_______ (3)
Better than I expected
4. With my hearing aid(s) on: I have difficulty hearing a conversation when I’m with one of my family at home. __________ ________ ________ ________ ________ _______ ________ Always (99%) Almost Always (87%) Generally(75%) Half-the-time (50%) Occasionally (25%) Seldom (12%) Never (1%) B. Compared to my expectation, my hearing in the above situation is
_______ _______ _______ _______ _______ _______ _______

147
(-3) Worse than I expected
(-2) (-1) (0) Just as I expected
(1) (2) (3) Better than I expected
5. A. With my hearing aid(s) on: I have trouble understanding dialogue in a movie or at the theater. __________ ________ ________ ________ ________ _______ ________ Always (99%) Almost Always (87%) Generally(75%) Half-the-time (50%) Occasionally (25%) Seldom (12%) Never (1%) B. Compared to my expectation, my hearing in the above situation is
_______ (-3)
Worse than I expected
_______ (-2)
_______ (-1)
_______ (0)
Just as I expected
_______ (1)
_______ (2)
_______ (3)
Better than I expected
6. A. With my hearing aid(s) on: When I am listening to the news on the car radio, and family members are talking, I have trouble hearing the news.
__________ ________ ________ ________ ________ _______ ________ Always (99%) Almost Always (87%) Generally(75%) Half-the-time (50%) Occasionally (25%) Seldom (12%) Never (1%) B. Compared to my expectation, my hearing in the above situation is
_______ (-3)
_______ (-2)
_______ (-1)
_______ (0)
_______ (1)
_______ (2)
_______ (3)

148
Worse than I expected
Just as I expected
Better than I expected
7. A. With my hearing aid(s) on: When I am at the dinner table with several people, and am trying to have a conversation with one person, understanding speech is difficult.
__________ ________ ________ ________ ________ _______ ________ Always (99%) Almost Always (87%) Generally(75%) Half-the-time (50%) Occasionally (25%) Seldom (12%) Never (1%) B. Compared to my expectation, my hearing in the above situation is
_______ (-3)
Worse than I expected
_______ (-2)
_______ (-1)
_______ (0)
Just as I expected
_______ (1)
_______ (2)
_______ (3)
Better than I expected
8. A. With my hearing aid(s) on: Traffic noises are too loud. __________ ________ ________ ________ ________ _______ ________ Always (99%) Almost Always (87%) Generally(75%) Half-the-time (50%) Occasionally (25%) Seldom (12%) Never (1%) B. Compared to my expectation, my hearing in the above situation is
_______ (-3)
Worse than I expected
_______ (-2)
_______ (-1)
_______ (0)
Just as I expected
_______ (1)
_______ (2)
_______ (3)
Better than I expected

149
9. A. With my hearing aid(s) on: When I am talking with someone across a large empty room, I understand the words. __________ ________ ________ ________ ________ _______ ________ Always (99%) Almost Always (87%) Generally(75%) Half-the-time (50%) Occasionally (25%) Seldom (12%) Never (1%) B. Compared to my expectation, my hearing in the above situation is
_______
(-3) Worse than I expected
_______ (-2)
_______ (-1)
_______ (0)
Just as I expected
_______ (1)
_______ (2)
_______ (3)
Better than I expected
10. A. With my hearing aid(s) on: When I am in a small office, interviewing or answering questions, I have difficulty following the conversation.
__________ ________ ________ ________ ________ _______ ________ Always (99%) Almost Always (87%) Generally(75%) Half-the-time (50%) Occasionally (25%) Seldom (12%) Never (1%) B. Compared to my expectation, my hearing in the above situation is

150
_______ (-3)
Worse than I expected
_______ (-2)
_______ (-1)
_______ (0)
Just as I expected
_______ (1)
_______ (2)
_______ (3)
Better than I expected
11. A. With my hearing aid(s) on: When I am in a theater watching a movie or play, and the people around me are whispering and rustling paper wrappers, I can still make out the dialogue.
__________ ________ ________ ________ ________ _______ ________ Always (99%) Almost Always (87%) Generally(75%) Half-the-time (50%) Occasionally (25%) Seldom (12%) Never (1%) B. Compared to my expectation, my hearing in the above situation is
_______ (-3)
Worse than I expected
_______ (-2)
_______ (-1)
_______ (0)
Just as I expected
_______ (1)
_______ (2)
_______ (3)
Better than I expected
12. A. With my hearing aid(s) on: When I am having a quiet conversation with a friend, I have difficulty understanding. __________ ________ ________ ________ ________ _______ ________ Always (99%) Almost Always (87%) Generally(75%) Half-the-time (50%) Occasionally (25%) Seldom (12%) Never (1%)

151
B. Compared to my expectation, my hearing in the above situation is
_______ (-3)
Worse than I expected
_______ (-2)
_______ (-1)
_______ (0)
Just as I expected
_______ (1)
_______ (2)
_______ (3)
Better than I expected
13. A. With my hearing aid(s) on: The sounds of running water, such as a toilet or shower, are uncomfortably loud. __________ ________ ________ ________ ________ _______ ________ Always (99%) Almost Always (87%) Generally(75%) Half-the-time (50%) Occasionally (25%) Seldom (12%) Never (1%) B. Compared to my expectation, my hearing in the above situation is
_______ (-3)
Worse than I expected
_______ (-2)
_______ (-1)
_______ (0)
Just as I expected
_______ (1)
_______ (2)
_______ (3)
Better than I expected
14. A. With my hearing aid(s) on: When a speaker is addressing a small group, and everyone is listening quietly, I have to strain to understand.
__________ ________ ________ ________ ________ _______ ________ Always (99%) Almost Always (87%) Generally(75%) Half-the-time (50%) Occasionally (25%) Seldom (12%) Never (1%) B. Compared to my expectation, my hearing in the above situation is

152
_______
(-3) Worse than I expected
_______ (-2)
_______ (-1)
_______ (0)
Just as I expected
_______ (1)
_______ (2)
_______ (3)
Better than I expected
15. A. With my hearing aid(s) on: When I’m in a quiet conversation with my doctor in an examination room, it is hard to follow the conversation.
__________ ________ ________ ________ ________ _______ ________ Always (99%) Almost Always (87%) Generally(75%) Half-the-time (50%) Occasionally (25%) Seldom (12%) Never (1%) B. Compared to my expectation, my hearing in the above situation is
_______ (-3)
Worse than I expected
_______ (-2)
_______ (-1)
_______ (0)
Just as I expected
_______ (1)
_______ (2)
_______ (3)
Better than I expected
16. A. With my hearing aid(s) on: I can understand conversations even when several people are talking. __________ ________ ________ ________ ________ _______ ________ Always (99%) Almost Always (87%) Generally(75%) Half-the-time (50%) Occasionally (25%) Seldom (12%) Never (1%)

153
B. Compared to my expectation, my hearing in the above situation is
_______ (-3)
Worse than I expected
_______ (-2)
_______ (-1)
_______ (0)
Just as I expected
_______ (1)
_______ (2)
_______ (3)
Better than I expected
17. A. With my hearing aid(s) on: The sounds of construction work are uncomfortably loud.
__________ ________ ________ ________ ________ _______ ________ Always (99%) Almost Always (87%) Generally(75%) Half-the-time (50%) Occasionally (25%) Seldom (12%) Never (1%) B. Compared to my expectation, my hearing in the above situation is
_______ (-3)
Worse than I expected
_______ (-2)
_______ (-1)
_______ (0)
Just as I expected
_______ (1)
_______ (2)
_______ (3)
Better than I expected
18. A. With my hearing aid(s) on: It’s hard for me to understand what is being said at lectures or church services. __________ ________ ________ ________ ________ _______ ________ Always (99%) Almost Always (87%) Generally(75%) Half-the-time (50%) Occasionally (25%) Seldom (12%) Never (1%)

154
B. Compared to my expectation, my hearing in the above situation is
_______
(-3) Worse than I expected
_______ (-2)
_______ (-1)
_______ (0)
Just as I expected
_______ (1)
_______ (2)
_______ (3)
Better than I expected
19. A. With my hearing aid(s) on: I can communicate with others when we are in a crowd.
__________ ________ ________ ________ ________ _______ ________ Always (99%) Almost Always (87%) Generally(75%) Half-the-time (50%) Occasionally (25%) Seldom (12%) Never (1%) B. Compared to my expectation, my hearing in the above situation is
_______ (-3)
Worse than I expected
_______ (-2)
_______ (-1)
_______ (0)
Just as I expected
_______ (1)
_______ (2)
_______ (3)
Better than I expected
20. A. With my hearing aid(s) on: The sound of a fire engine siren close by is so loud that I need to cover my ears.
__________ ________ ________ ________ ________ _______ ________ Always (99%) Almost Always (87%) Generally(75%) Half-the-time (50%) Occasionally (25%) Seldom (12%) Never (1%)

155
B. Compared to my expectation, my hearing in the above situation is
_______ (-3)
Worse than I expected
_______ (-2)
_______ (-1)
_______ (0)
Just as I expected
_______ (1)
_______ (2)
_______ (3)
Better than I expected
21. A. With my hearing aid(s) on: I can follow the words of a sermon when listening to a religious sermon. __________ ________ ________ ________ ________ _______ ________ Always (99%) Almost Always (87%) Generally(75%) Half-the-time (50%) Occasionally (25%) Seldom (12%) Never (1%) B. Compared to my expectation, my hearing in the above situation is
_______
(-3) Worse than I expected
_______ (-2)
_______ (-1)
_______ (0)
Just as I expected
_______ (1)
_______ (2)
_______ (3)
Better than I expected
22. A. With my hearing aid(s) on: The sound of screeching tires is uncomfortably loud.

156
__________ ________ ________ ________ ________ _______ ________ Always (99%) Almost Always (87%) Generally(75%) Half-the-time (50%) Occasionally (25%) Seldom (12%) Never (1%) B. Compared to my expectation, my hearing in the above situation is
_______ (-3)
Worse than I expected
_______ (-2)
_______ (-1)
_______ (0)
Just as I expected
_______ (1)
_______ (2)
_______ (3)
Better than I expected
23. A. With my hearing aid(s) on: I have to ask people to repeat themselves in one-on-one conversation in a quiet room. __________ ________ ________ ________ ________ _______ ________ Always (99%) Almost Always (87%) Generally(75%) Half-the-time (50%) Occasionally (25%) Seldom (12%) Never (1%) B. Compared to my expectation, my hearing in the above situation is
_______ (-3)
Worse than I expected
_______ (-2)
_______ (-1)
_______ (0)
Just as I expected
_______ (1)
_______ (2)
_______ (3)
Better than I expected
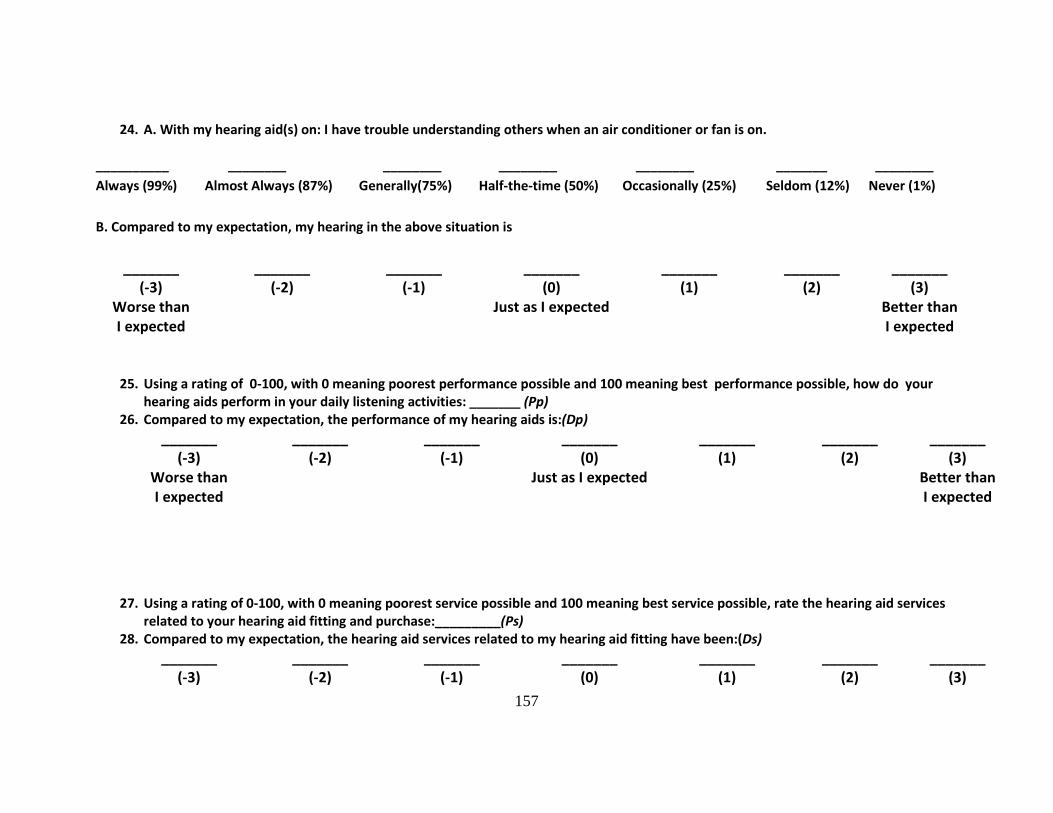
157
24. A. With my hearing aid(s) on: I have trouble understanding others when an air conditioner or fan is on. __________ ________ ________ ________ ________ _______ ________ Always (99%) Almost Always (87%) Generally(75%) Half-the-time (50%) Occasionally (25%) Seldom (12%) Never (1%) B. Compared to my expectation, my hearing in the above situation is
_______ (-3)
Worse than I expected
_______ (-2)
_______ (-1)
_______ (0)
Just as I expected
_______ (1)
_______ (2)
_______ (3)
Better than I expected
25. Using a rating of 0-100, with 0 meaning poorest performance possible and 100 meaning best performance possible, how do your hearing aids perform in your daily listening activities: _______ (Pp)
26. Compared to my expectation, the performance of my hearing aids is:(Dp) _______
(-3) Worse than I expected
_______ (-2)
_______ (-1)
_______ (0)
Just as I expected
_______ (1)
_______ (2)
_______ (3)
Better than I expected
27. Using a rating of 0-100, with 0 meaning poorest service possible and 100 meaning best service possible, rate the hearing aid services
related to your hearing aid fitting and purchase:_________(Ps) 28. Compared to my expectation, the hearing aid services related to my hearing aid fitting have been:(Ds)
_______ (-3)
_______ (-2)
_______ (-1)
_______ (0)
_______ (1)
_______ (2)
_______ (3)

158
Worse than I expected
Just as I expected
Better than I expected
29. On a scale of 0-100, with 0 being the worst possible performance and 100 being the best possible performance, rate the overall performance of your hearing aid fitting: ___________(Po)
30. Compared to my expectation, the overall performance with my hearing aid fitting has been: (Do) _______
(-3) Worse than I expected
_______ (-2)
_______ (-1)
_______ (0)
Just as I expected
_______ (1)
_______ (2)
_______ (3)
Better than I expected
31. Using a rating of 0 to 100, with 0 being not satisfied at all and 100 being completely satisfied, rate your level of satisfaction with your hearing aid fitting:_________(So)
The next group of questions relate to some situations in which you might find yourself. Circle the number that represents how much each statement is TRUE or FALSE for you:
Definitely True
Mostly True
Don’t Know
Mostly False
Definitely True
32. I am always courteous even to people who are disagreeable 1 2 3 4 5 33. There have been occasions when I took advantage of someone 1 2 3 4 5 34. I sometimes try to get even rather than forgive and forget 1 2 3 4 5 35. I sometimes feel resentful when I don’t get my way 1 2 3 4 5 36. No matter who I’m talking to, I’m always a good listener 1 2 3 4 5

159
Listed below are questions on your opinions about your hearing aids(s). For each
question, please circle the letter that is the best answer for you. The list of words to the right gives the meaning of each letter. Keep in mind that your answers should
show your general opinions about the hearing aids that you are wearing now or have most recently worn.
A Not at all B A little C Somewhat D Medium E Considerably F Greatly G Tremendously
37. Compared to using no hearing aid at all, do your hearing aids help you understand the people you speak with most frequently?
A B C D E F G
38. Are you frustrated when your hearing aids pick up sounds that keep you from hearing what you want to hear?
A B C D E F G
39. Are you convinced that obtaining your hearing aids was in your best interests? A B C D E F G
40. Do you think people notice your hearing loss more when you wear your hearing aids? A B C D E F G
41. Do your hearing aids reduce the number of times you have to ask people to repeat? A B C D E F G
42. Do you think your hearing aids are worth the trouble? A B C D E F G
43. Are you bothered by an inability to get enough loudness from your hearing aids without feedback (whistling)?
A B C D E F G
44. How content are you with the appearance of your hearing aids? A B C D E F G
45. Does wearing your hearing aids improve your self-confidence? A B C D E F G
46. How natural is the sound from your hearing aids? A B C D E F G
47. How helpful are your hearing aids on MOST telephones with NO amplifier or loudspeaker? (If you hear well on the telephone without hearing aids, check here )
A B C D E F G
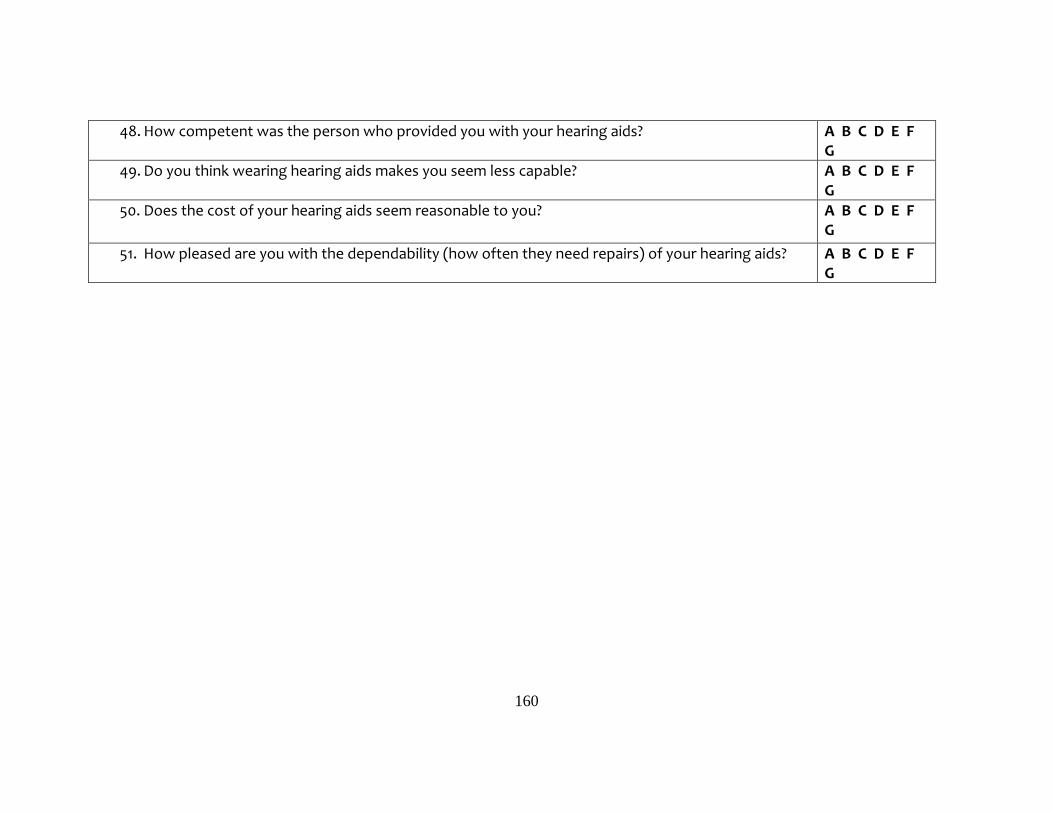
160
48. How competent was the person who provided you with your hearing aids? A B C D E F G
49. Do you think wearing hearing aids makes you seem less capable? A B C D E F G
50. Does the cost of your hearing aids seem reasonable to you? A B C D E F G
51. How pleased are you with the dependability (how often they need repairs) of your hearing aids? A B C D E F G

161
Thank you for your time in answering the survey questions. If you have completed the survey please place it in the stamped envelope provided, and mail it back to us. When we receive your completed survey we will mail you a $10.00 gift card. If you have any questions regarding this research study please call Elaine Mormer at 412-383-6610 or email [email protected].
Age
What is your age? _________
Check the answer below that best describes you:
Sex
What is your sex?
� Male � Female
Education completed
What is the highest grade or year of school you completed?
� Never attended school or only attended kindergarten � Grades 1 through 8(Elementary) � Grades 9 through 11 (Some high school) � Grade 12 or GED (High school graduate) � College 1 year to 3 years (Some college of technical
school) � College 4 years (College graduate) � Graduate School(Advanced Degree)
Household Income What is your total household income? � Less than $10,000 � $10,000 to $19,999 � $20,000 to $29,999 � $30,000 to $39,999 � $40,000 to $49,999 � $50,000 to $59,999 � $60,000 to $69,999 � $70,000 to $79,999 � $80,000 to $89,999 � $90,000 to $99,999 � $100,000 to $149,999 � $150,000 or more

162
BIBLIOGRAPHY
Abrams, H., & Hnath-Chisolm, T. (2000). Outcome Measures and Evidence Based Practice. In H. L. Hosford-Dunn, R. Roeser & M. Valente (Eds.), Audiology Practice Management. New York: Thieme.
Alazri, M. H., & Neal, R. D. (2003). The association between satisfaction with services provided in primary care and outcomes in Type 2 diabetes mellitus. Diabetes Medicine, 20(6), 486-490.
Alford, B. L. (1998). Affect, attribution, and disconfirmation: Their impact on health care services evaluation. healthcare Marketing Quarterly, 15(4), 55-74.
Ammentorp, J., Mainz, J., & Sabroe, S. (2006). Determinants of priorities and satisfaction in pediatric care. Pediatric Nursing, 32(4), 333-340, 348.
Arnold, P., & McKenzie, I. (1998). Rejection of hearing aids: a critical review. Journal of Audiological Medicine, 7(3), 173-199.
Baron-Epel, O., Dushenat, M., & Friedman, N. (2001). Evaluation of the consumer model: relationship between patients' expectations, perceptions, and satisfaction with care. International Journal for Quality in Health Care, 13(4), 317-323.
Batchelor, C., Owens, D. J., Read, M., & Bloor, M. (1994). Patient satisfaction studies: methodology, management and consumer evaluation. International Journal of Health Care Quality Assurance, 7(7), 22-30.
Bentler, R. A., Niebuhr, D. P., Getta, J. P., & Anderson, C. V. (1993). Longitudinal study of hearing aid effectiveness. II: Subjective measures. Journal of Speech and Hearing Research, 36(4), 820-831.
Bitner, M. J. (1990). Evaluating service encounters: The effects of physical surroundings and employee responses. Journal of Marketing Research, 54, 69-82.

163
Boulding, W., Kalra, A., Staelin, R., & Zeithaml, V. A. (1993). A dynamic process model of service quality: from expectations to behavioral intentions. Journal of Marketing Research, 30, 7-27.
Brooks, D., & Hallam, R. (1998). Attitudes to hearing difficulty and hearing aids and the oucome of audiological rehabilitation. British Journal of Audiology, 24, 229-233.
Cacciatore, F., Napoli, C., Abete, P., Marciano, E., Triassi, M., & Rengo, F. (1999). Quality of life determinants and hearing function in an elderly population: Osservatorio Geriatrico Campano Study Group. Gerontology, 45(6), 323-328. doi: 22113
Cadotte, E. R., Woodruff, R. B., & Jenkins, R. L. (1987). Expectations and norms in models of consumer satisfaction. Journal of Marketing Research, 24(3), 305-314.
Cassard, S. D., Patrick, D. L., Damiano, A. M., Legro, M. W., Tielsch, J. M., Diener-West, M., Schein, O. D., Javitt, J. C., Bass, E. B., & Steinberg, E. P. (1995). Reproducibility and responsiveness of the VF-14. An index of functional impairment in patients with cataracts. Archives of Opthomology, 113(12), 1508-1513. doi: 10.1001/archopht.113.12.1508
Chisolm, T. H., Johnson, C. E., Danhauer, J. L., Portz, L. J., Abrams, H. B., Lesner, S., McCarthy, P. A., & Newman, C. W. (2007). A systematic review of health-related quality of life and hearing aids: final report of the American Academy of Audiology Task Force On the Health-Related Quality of Life Benefits of Amplification in Adults. Journal of the American Academy of Audiology, 18(2), 151-183.
Churchill, G. A., & Surprenant, C. (1982). An investigation into the determinants of customer satisfaction. Journal of Marketing Research, 19, 491-504.
Cohen, J. (1988). Statistical power analysis for the behavioral sciences (2nd ed.). Hillsdale, NJ: Erlbaum.
Cohen, J., & Cohen, P. (1983). Applied multiple regression/correlation analysis for the behavioral sciences (2nd ed.). Hilldale, NJ: Erlbaum.
Cox, R., Hyde, M., Gatehouse, S., Noble, W., Dillon, H., Bentler, R., Stephens, D., Arlinger, S., Beck, L., Wilkerson, D., Kramer, S., Kricos, P., Gagne, J. P., Bess, F., & Hallberg, L. (2000). Optimal outcome measures, research priorities, and international cooperation. Ear Hear, 21(4 Suppl), 106S-115S.

164
Cox, R. M., & Alexander, G. C. (1995). The abbreviated profile of hearing aid benefit. Ear and Hearing, 16(2), 176-186.
Cox, R. M., & Alexander, G. C. (1999). Measuring Satisfaction with Amplification in Daily Life: the SADL scale. Ear and Hearing, 20(4), 306-320.
Cox, R. M., & Alexander, G. C. (2000). Expectations about hearing aids and their relationship to fitting outcome. Journal of the American Academy of Audiology, 11(7), 368-382; quiz 407.
Cox, R. M., & Alexander, G. C. (2001). Validation of the SADL questionnaire. Ear and Hearing, 22(2), 151-160.
Cox, R. M., Alexander, G. C., & Beyer, C. M. (2003). Norms for the international outcome inventory for hearing aids. Journal of the American Academy of Audiology, 14(8), 403-413.
Cox, R. M., Alexander, G. C., & Gray, G. A. (2007). Personality, hearing problems, and amplification characteristics: contributions to self-report hearing aid outcomes. Ear and Hearing, 28(2), 141-162. doi: 10.1097/AUD.0b013e31803126a4
Cox, R. M., & Gilmore, C. (1990). Development of the Profile of Hearing Aid Performance (PHAP). Journal of Speech and Hearing Research, 33(2), 343-357.
Day, R. L. (1977). Extending the concept of consumer satisfaction. In W. D. J. Perreault (Ed.), Advances in Consumer Research (Vol. 4, pp. 149-154). Atlanta: Association for Consumer Research.
Demorest, M. E., & Erdman, S. A. (1987). Development of the communication profile for the hearing impaired. Journal of Speech and Hearing Disorders, 52(2), 129-143.
Drew, J. H., & Bolton, R. N. (1991). Effects of Survey Measurement. Journal of Customer Satisfaction, Dissatisfaction and Complaining Behavior, 4, 21-30.
Fishbein, M., & Ajzen, I. (1975). Belief, attitude, intention and behavior: an introduction to theory and research. Reading, MA: Addison- Wesley.
Francis, V., Korsch, B. M., & Morris, M. J. (1969). Gaps in doctor-patient communication. Patients' response to medical advice. New England Journal of Medicine, 280(10), 535-540. doi: 10.1056/NEJM196903062801004

165
Garrity, T. (1981). Medical compliance and the clinical-patient relationship: a review. Social Science and Medicine, 15, 215-222.
Gatehouse, S. (1994). Components and determinants of hearing aid benefit. Ear and Hearing, 15(1), 30-49.
Gatehouse, S. (1999a). Aspects of auditory eology and psychoacoustic function as determinants of benefits from, and candidature for non-linear processing in hearing aids. . In A. N. Rasmussen, P. A. Osterhammel, T. Andersen & T. Poulsen (Eds.), Auditory Models and Non-linear Hearing Instruments (pp. 221-233). Denmark: Holmens Trykkeri.
Gatehouse, S. (1999b). Glasgow hearing aid benefit profile: Derivation and validation of a client-centered outcome measure for hearing aid services. Journal of the American Academy of Audiology, 10, 80-103.
Gatehouse, S. (2000). The Glasgow hearing aid benefit profile: What it measures and how to use it. The Hearing Journal, 53(3), 10-18.
Green, S. (1991). How many subects does it take to do a regression analysis. Multivariate Behavioral Research, 26(3), 449-510.
Hair, J. F., Anderson, R. E., Tatham, R. l., & Black, W. C. (1995). Multivariate Data Analysis (4th ed.). Englewood Cliffs, NJ: Prentice Hall.
Hawes, N. A., Durand, R. M., & Clark, S. R. (1985). Understanding desired benefits of a hearing aid: A consumer behavior perspective. . Journal of the Academy of Rehabilitative Audiology, 18, 112-122.
Hill, O. (1977). The psychological management of psychosomatic diseases. British Journal of Psychiatry, 131, 113-126.
Ho, F. N., Mursch, J. D., Ong, B. S., & Perttula, B. (1997). Consumer satisfaction with OTC drugs: an analysis using the confirmation /disconfirmation model. healthcare Marketing Quarterly, 15 (1), 103-117. doi: 10179061
Homer, C. J., Marino, B., Cleary, P. D., Alpert, H. R., Smith, B., Crowley Ganser, C. M., Brustowicz, R. M., & Goldmann, D. A. (1999). Quality of care at a children's hospital: the parent's perspective. Archives of Pediatric Adolescent Medicine, 153(11), 1123-1129.
166
Hosford-Dunn, H., & Halpern, J. (2000). Clinical application of the satisfaction with amplification in daily life scale in private practice I: statistical, content, and factorial validity. Journal of the American Academy of Audiology, 11(10), 523-539.
Hosford-Dunn, H., & Halpern, J. (2001). Clinical application of the satisfaction with amplifciation in daily life scale in private practice II: Predictive validity of fitting variables. Journal of the American Academy of Audiology, 12(1), 15-36.
Hudak, P. L., Hogg-Johnson, S., Bombardier, C., McKeever, P. D., & Wright, J. G. (2004). Testing a new theory of patient satisfaction with treatment outcome. Medical Care, 42(8), 726-739.
Humes, L. (2003). Modeling and predicting hearing aid outcomes. Trends in Amplification, 7(41), 41-75.
Humes, L. E. (2006). Hearing aid outcome measures in older adults. Paper presented at the Hearing Care for Adults 2006: Proceedings of the First International Adult Conference, Chicago, IL.
Humes, L. E., Wilson, D. L., Humes, L., Barlow, N. N., Garner, C. B., & Amos, N. (2002). A comparison of two measures of hearing aid satisfaction in a group of elderly hearing aid wearers. Ear and Hearing, 23(5), 422-427. doi: 10.1097/01.AUD.0000034779.67274.4A
Jayanti, R. (1996). Affective responses towards service providers: implications for service encounter satisfaction. healthcare Marketing Quarterly, 14(1), 49-65. doi: 10.1300/J026v14n01_05
Jerram, J. C., & Purdy, S. C. (2001). Technology, expectations, and adjustment to hearing loss: predictors of hearing aid outcome. Journal of the American Academy of Audiology, 12(2), 64-79.
Kahneman, D., & Tversky, A. (1979). Prospect Theory: An analysis of decision making under risk. Econometrica, 47, 163-291.
Kargas, S., & Doyle, J. (1996). Patient satisfaction with time use in audiological consultations. International Journal of Audiology, 30(6), 355-361.
Kochkin, S. (1992). Marketrak III identifies key factors in determining consumer satisfaction. Hearing Journal, 45, 39-44.
167
Kochkin, S. (1993a). MarkeTrak III: Why 20 million in U.S. Don't use hearing aids for their hearing loss. Part I. Hearing Journal, 46(1), 20-27.
Kochkin, S. (1993b). MarkeTrak III: Why 20 million in U.S. don't use hearing aids for their hearing loss. Part II. Hearing Journal, 46(2), 26-31.
Kochkin, S. (1993c). MarkeTrak III: Why 20 million in U.S. don't use hearing aids for their hearing loss. Part III. Hearing Journal, 46(4), 36-37.
Kochkin, S. (1996). MarkeTrak IV: 10-year trends in the hearing aid market—has anything changed? Hearing Journal, 49(1), 23-27, 30-34.
Kochkin, S. (2000). MarkeTrak V: Consumer satisfaction revisited. The Hearing Journal, 53(1), 38-55.
Kochkin, S. (2005a). MarkeTrak VII: Hearing loss population tops 31 million people. Hearing Review, 12(7), 16-29.
Kochkin, S. (2005b). MarkeTrak VII:Customer satisfaction with hearing instruments in the digital age. The Hearing Journal, 58(9), 30-37.
Kochkin, S. (2007). MarkeTrak VII: Obstacles to adult non-user adoption of hearing aids. The Hearing Journal, 60(4), 24-51.
Kravitz, R. L. (2001). Measuring patient's expectations and requests. Annals of Internal Medicine, 134(Supplement), 881-888.
Kumar, R. N., Kirking, D. M., Hass, S. L., Vinokur, A. D., Taylor, S. D., Atkinson, M. J., & McKercher, P. L. (2007). The association of consumer expectations, experiences and satisfaction with newly prescribed medications. Quality of Life Research, 16(7), 1127-1136. doi: 10.1007/s11136-007-9222-4
LaVois, M., Nguyen, T., & Attkisson, C. (1981). Artifact in client satisfaction assessment: experience in community mental health settings. Evaluation and Program Planning, 4, 139-150.
Lawler, E. (1971). Pay and organizational effectiveness: a psychological view. New York: Magraw-Hill.

168
Like, R., & Zyzanski, S. J. (1987). Patient satisfaction with the clinical encounter: social psychological determinants. Social Science & Medicine, 24(4), 351-357.
Lin, F. R. (2011). Hearing loss and cognition among older adults in the United States. J Gerontol A Biol Sci Med Sci, 66(10), 1131-1136. doi: 10.1093/gerona/glr115
Linder-Pelz, S. (1982). Social psychological determinants of patient satisfaction: a test of five hypotheses. Social Science and Medicine, 16(577-582).
Linder-Pelz, S. (1982b). Toward a theory of patient satisfaction. Social Science and Medicine, 16(5), 577-582.
Locker, D., & Dunt, D. (1978). Theoretical and methodological issues in sociological studies of consumer satisfaction with medical care. Social Science & Medicine, 12(4A), 283-292.
McLauchlin, R. M. (1992). Hearing aids and hearing aid orientation for adult clients. In R. Hull (Ed.), Aural Rehabilitation (pp. 219-220). San Diego: Singular.
Mormer, E., Kasewurm, J., & Palmer, C. V. (2006). Test Retest Reliability on Patient Expectations American Academy of Audiology Annual Meeting, Minneapolis, MN, April 06. Paper presented at the American Academy of Audiology Annual Convention, Minneapolis, MN.
Mulrow, C. D., Aguilar, C., Endicott, J. E., Tuley, M. R., Velez, R., Charlip, W. S., Rhodes, M. C., Hill, J. A., & DeNino, L. A. (1990). Quality-of-life changes and hearing impairment. A randomized trial. Annals of Internal Medicine, 113(3), 188-194.
Newsome, P. R., & Wright, G. H. (1999). A review of patient satisfaction: 1. Concepts of satisfaction. British Dental Journal, 186(4 Spec No), 161-165.
Newsome, P. R., & Wright, G. H. (2000). Qualitative techniques to investigate how patients evaluate dentists: a pilot study. Community Dentistry And Oral Epidemiology, 28(4), 257-266.
Oliver, R. L. (1977). A theoretical reinterpretation of expectationa nd disconfirmation effects on postexposure product evaluations: experience in the field. In R. L. Day (Ed.), Consumer Satisfaction, Dissatisfaction, and Complaining Behavior (pp. 2-9). Bloomington: Indiana University.

169
Oliver, R. L. (1980). A cognitive model of the antecedents and consequences of satisfaction decisions. Journal of Marketing Research, 17(4), 460-469.
Oliver, R. L. (1993). Cognitive, affective, and attribute bases of the satisfaction response. The Journal of Consumer Research, 20, 418-430.
Oliver, R. L., & DeSarbo, W. S. (1988). Response determinants in satisfaction judgments. The Journal of Consumer Research, 14(March), 495-507.
Olshavsky, R. W., & Miller, J. A. (1972). Consumer expectations, product performance, and perceived product quality. Journal of Marketing Research, 9, 19-21.
Olson, J. (1979). Disconfirmation of consumer expectations through product trial. Journal of Applied Psychology, 64, 179-189.
Pager, C. K. (2004). Expectations and outcomes in cataract surgery: a prospective test of 2 models of satisfaction. Archives of Opthomology, 122(12), 1788-1792. doi: 10.1001/archopht.122.12.1788
Ross, C. K., Steward, C. A., & Sinacore, J. M. (1995). A comparative study of seven measures of patient satisfaction. Medical Care, 33(4), 392-406.
Schum, D. J. (1999). Perceived hearing aid benefit in relation to perceived needs. Journal of the American Academy of Audiology, 10(1), 40-45.
Sherbourne, C. D., Hays, R. D., Ordway, L., DiMatteo, M. R., & Kravitz, R. L. (1992). Antecedents of adherence to medical recommendations: results from the Medical Outcomes Study. Journal of Behavioral Medicine, 15(5), 447-468.
Shuval, J. T. (1992). Social dimensions of health- The Israeli experience. Westport: Preager Publishers.
Sitzia, J., & Wood, N. (1997). Patient satisfaction: a review of issues and concepts. Social Science & Medicine, 45(12), 1829-1843.
Soli, S., & Nilsson, M. (1994). Assessment of communication handicap with the HINT. Hearing Instruments, 45, 12-16.
Solomon, M., Surprenant, C., Czepiel, J., & Gutman, E. (1985). A role theory perspective on dyadic interactions: The service encounter. Journal of Marketing 49, 99-111.

170
Somasundaram, T. J. (1993). Consumers reactions to product failure: The impact of product involvement and knowledge. Paper presented at the Advances in Consumer Research.
Spreng, R., & Page, T. (2003). A test of alternative measures of disconfirmation. Decision Sciences, 34(1), 31-61.
Spreng, R. A., & Chiou, J.-s. (2002). A cross-cultural assessment of the satisfaction formation process. European Journal of Marketing, 36(7/8), 829-839.
Spreng, R. A., & Droge, C. (2001). The impact on satisfaction of managing attribute expectations: should performance claims be understated or overstated. Journal of Retailing and Consumer Services, 8, 261-274.
Spreng, R. A., MacKenzie, S. B., & Olshavsky, R. W. (1996). A reexamination of the determinants of consumer satisfaction. Journal of Marketing Research, 60, 15-32.
Spreng, R. A., & Olshavsky, R. W. (1993). A desires congruency model of consumer satisfaction. Journal of the Academy of Marketing Science, 21 (3), 169-177.
Staniszewska, S., & Ahmed, L. (1999). The concepts of expectation and satisfaction: do they capture the way patients evaluate their care? Journal of Advanced Nursing, 29(2), 364-372.
Stark, P., & Hickson, L. (2004). Outcomes of hearing aid fitting for older people with hearing impairment and their significant others. International Journal of Audiology, 43(7), 390-398.
Steenkamp, J.-B., De Jong, M. G., & Baumgartner, H. (2010). Socially Desirable Response Tendencies in Survey Research. Journal of Marketing Research, XLVII, 199-214.
Strattmann, W. (1975). A study of consumer attitudes about health care. Medical Care, 13(7), 537-548.
Sujan, M. (1985). Consumer knowledge: Effects on evaluation strategies mediating consumer judgements. Journal of Consumer Research, 12, 31-46.
Sukarom, I. (1999). Satisfaction differentiation between goods and services in the context of pharmacy practice. (PhD), University of Iowa, Iowa City.

171
Susman, J. L. (1994). Assessing consumer expectations and patient satisfaction. Passing fad, mission impossible, or 'just what the doctor ordered'? Archives of Family Medicine, 3(11), 945-946.
Sweetow, R. (1999a). Page Ten:Counseling: Its the key to successful hearing aid fittings. The Hearing Journal, 52(3), 10-17.
Sweetow, R. (1999b). Counseling: the secret to successful hearing aid fittings. In R. Sweetow (Ed.), Counseling for hearing aid fittings (pp. 2). San Diego: Singular Publishing Group.
Thompson, A., & Sunol, R. (1995). Expectations as determinants of patient satisfaction; concepts, theory, and evidence. International Journal for Quality in Health Care, 7(2), 127-141.
Thompson, D. A., & Yarnold, P. R. (1995). Relating patient satisfaction to waiting time perceptions and expectations: the disconfirmation paradigm. Academic Emergency Medicine, 2(12), 1057-1062.
Tse, D., & Wilton, P. (1988). Models of consumer satisfaction formation: An extension. Journal of Marketing Research, 25(2), 204-212.
Ventry, I. M., & Weinstein, B. E. (1982). The hearing handicap inventory for the elderly: a new tool. Ear and Hearing, 3(3), 128-134.
Vestergaard, M. D. (2006). Self-report outcome in new hearing aid users: Longitudinal trends and relationships between subjective measures of benefit and satisfaction. International Journal of Audiology, 45, 382-392.
Vroom, V. (1964). Work and Motivation. New York: Wiley.
Walden, B. E., Demorest, M. E., & Hepler, E. L. (1984). Self-report approach to assessing benefit derived from amplification. Journal of Speech and Hearing Research, 27(1), 49-56.
Ware, J. E., Jr., Davies-Avery, A., & Stewart, A. L. (1978). The measurement and meaning of patient satisfaction. Health and Medical Care Services Review, 1(1), 1, 3-15.
Weigand, J., Bodkin, K., Madell, J. R., Rosenfeld, R. M., & Press, I. (2002). By the numbers: A statistical analysis of hearing instrument returns. The Hearing Review.

172
Williams, B. (1994). Patient satisfaction: a valid concept? Social Science & Medicine, 38(4), 509-516.
Wong, L. L. (2004). Hearing aid satisfaction and it's relationship to expectation, performance, benefit, and disconfirmation. Paper presented at the American Auditory Society Annual Meeting, Scottsdale, AZ. Poster Presentation retrieved from
Wong, L. L., Hickson, L., & McPherson, B. (2003). Hearing aid satisfaction: what does research from the past 20 years say? Trends in Amplification, 7(4), 117-161.
Wong, L. L., Hickson, L., & McPherson, B. (2004). Hearing aid expectations among Chinese first-time users: relationships to post-fitting satisfaction. The Australian and New Zealand Journal of Audiology, 26(1), 53-69.
Wong, L. L., Hickson, L., & McPherson, B. (2009). Satisfaction with hearing aids: a consumer research perspective. International Journal of Audiology, 48(7), 405-427. doi: 10.1080/14992020802716760
Woodruff, R. B., Cadotte, E. R., & Jenkins, R. L. (1983). Modeling Consumer Satisfaction Processes Using Experience-Based Norms. Journal of Marketing Research, 20(3), 296-304.
Yi, Y. (1990). A critical review of consumer satisfaction. In V. A. Zeithaml (Ed.), Review of Marketing (Vol. , pp. 68-123). Chicago: American Marketing Association.
Yi, Y. (Ed.). (1993). The determinants of consumer satisfaction: The moderating role of ambiguity (Vol. 20): Association for Consumer Research.
Yuksel, A. (2001). The Expectancy-Disconfirmation Paradigm: A Critique. Journal of Hospitality & Tourism Research, 25(2), 107-131. doi: 10.1177/109634800102500201
Zastowney, T., Roghmann, K., & Hengst, A. (1983). Satisfaction with medical care: replications and theoretical reevaluation. Medical Care, 21, 294.
Zwick, R., Pieters, R., & Baumgartner, H. (1995). On the practical significance of hindsight bias: the case of the expectancy-disconfirmation model of consumer satisfaction. Organizational Behavior and Human Decision Processes, 64 (1), 103-117.
![Proposals to Extend Healthy Life Expectancy in Shizuoka ...€¦ · [Gap between life expectancy and healthy life expectancy in Shizuoka Prefecture] Healthy life expectancy *Source:](https://img.pdfslide.us/doc/110x75/5f427921a09c2479a15262fb/proposals-to-extend-healthy-life-expectancy-in-shizuoka-gap-between-life-expectancy.jpg)