Embed Size (px)
Citation preview

Application of the CERES-Maize Model
for Climate Change Impact Assessment
and Decision Support in Corn Production
Dr. Orlando BalderamaIsabela State UniversityEchague, Isabela Philippines
Paper presented at ICT- Asia Conference and Workshop, 25-26 May, 2015, SEARCA College Los Banos Laguna

Presentation Outline
• Background
• Objectives
• Methodology
• Results and Discussion
• Conclusion
• Way Forward: Development of Farmer Decision Support System for Corn Farmers

Background, Isabela Philippines
Highest Corn Producer, 25% of National Production
Most Area of Corn Farm, 26% of National Area
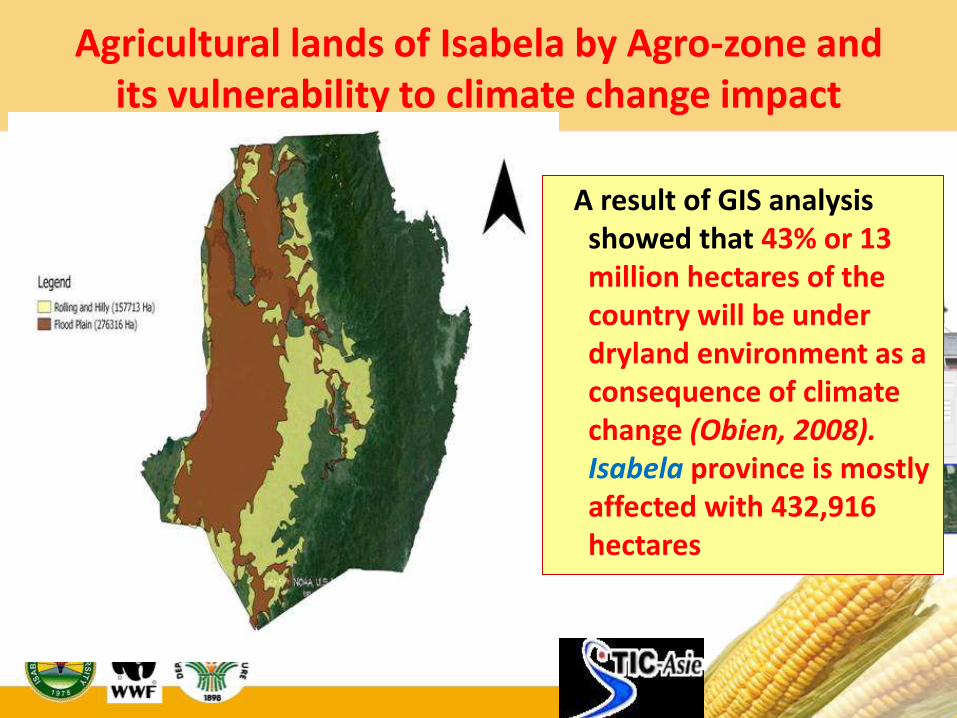
Agricultural lands of Isabela by Agro-zone and its vulnerability to climate change impact
A result of GIS analysis showed that 43% or 13 million hectares of the country will be under dryland environment as a consequence of climate change (Obien, 2008). Isabela province is mostly affected with 432,916 hectares

El Niño in 2010
• 4 billion pesos drought damage in agriculture
• 2 billion pesos in Corn
• Isabela province suffered the biggest

Simulated
Year
% change in Rainfall Increase in Temperature
Dec-
Feb
Mar-
May
Jun-
Aug
Sep-
Nov
Dec-
Feb
Mar-
May
Jun-
Aug
Sep-
Nov
Benchmark
year (1991-
2000)
- - - - - - - -
2020
Projections
3.9 -8.6 5.1 13.5 0.8 0.9 0.9 0.8
2050
Projections
25.1 -29.2 8.7 1.7 2 2.1 2.1 1.9
Climate Change Projection 2020 and 2050, Isabela Philippines
Source: PAGASA, 2011
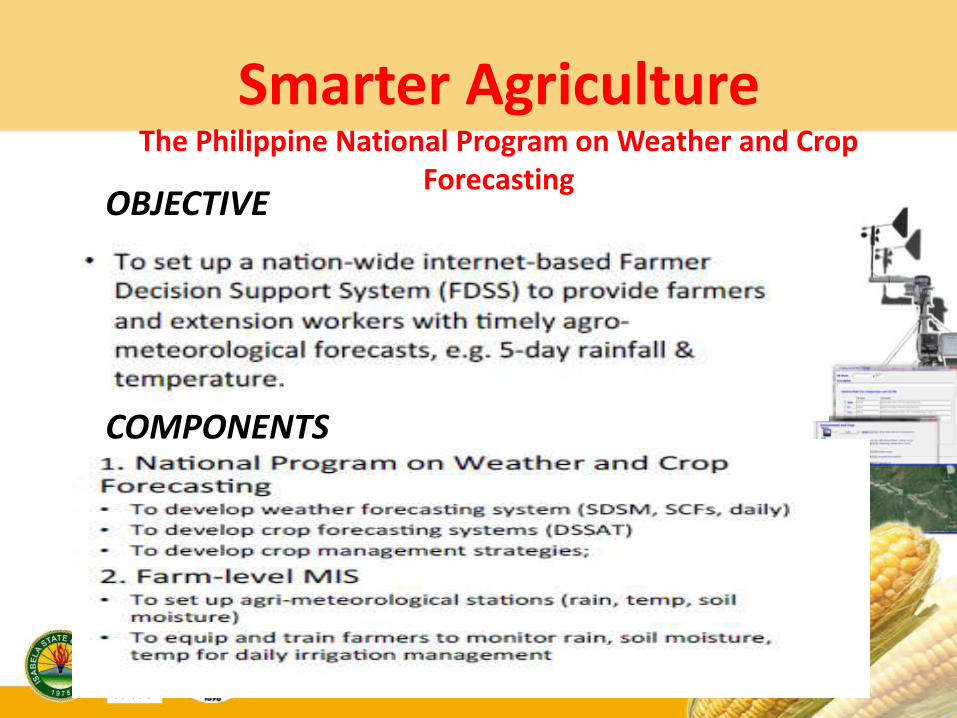
Smarter AgricultureThe Philippine National Program on Weather and Crop
ForecastingOBJECTIVE
COMPONENTS
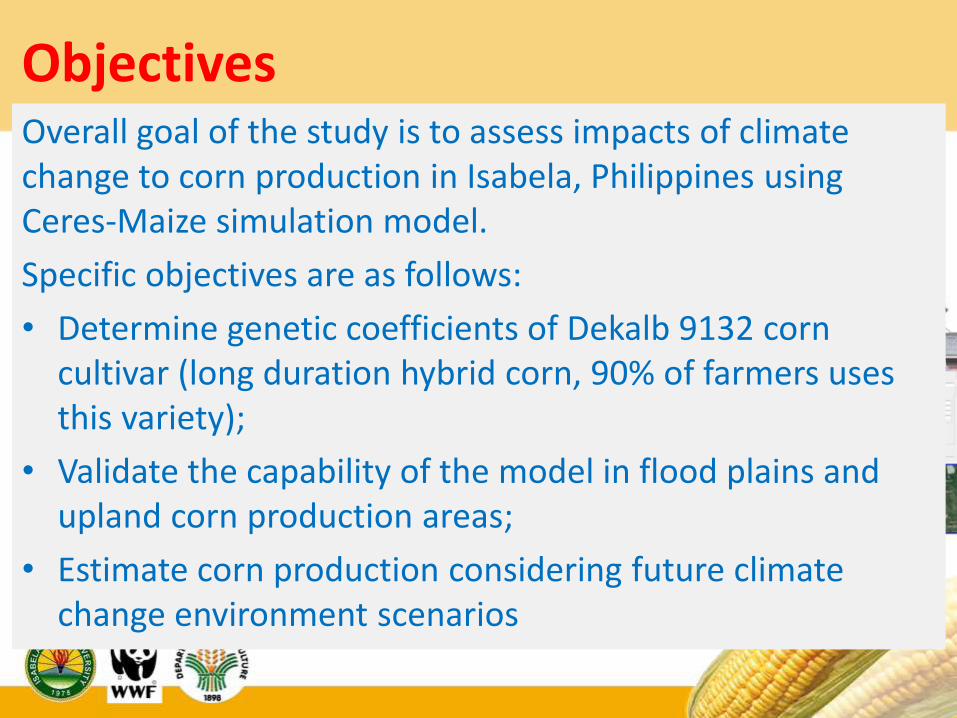
ObjectivesOverall goal of the study is to assess impacts of climate change to corn production in Isabela, Philippines using Ceres-Maize simulation model.
Specific objectives are as follows:
• Determine genetic coefficients of Dekalb 9132 corn cultivar (long duration hybrid corn, 90% of farmers uses this variety);
• Validate the capability of the model in flood plains and upland corn production areas;
• Estimate corn production considering future climate change environment scenarios

Methodology• Site Selection and setting up of field experiment
(dry and wet season)
• Setting up of weather monitoring station
• DSSAT Model Calibration and Validation
• Analysis of production performance under various climate change scenario
• Develop a Farmer Decision Support System Framework

Site and Field Experimental Data
• There were four (4) field sites established in each of the three
agro-zones representing in Isabela to represent flood plain, rolling
and hilly corn areas;
• Automatic weather stations were installed in each site to monitor
daily climate data. The minimum input weather data required to run
the model are the rainfall, minimum and maximum temperature and
solar radiation;
• Soil profile in each site were characterize. The locations of these
field sites were as follows:
1)Villa Imelda - rolling terrain, with rain gauge, humidity, temp,
wind speed & direction, and 3 soil moisture sensors
2)Sindon Bayabo - hilly terrain, with 3 soil moisture sensors
3)Cabisera 10 - flood plain with 3 soil moisture sensors
4)CVRC San Felipe - Flood plain with rain gauge and 3 soil
moisture sensors
Physical and Chemical Properties of Corn Farms in the Project Site
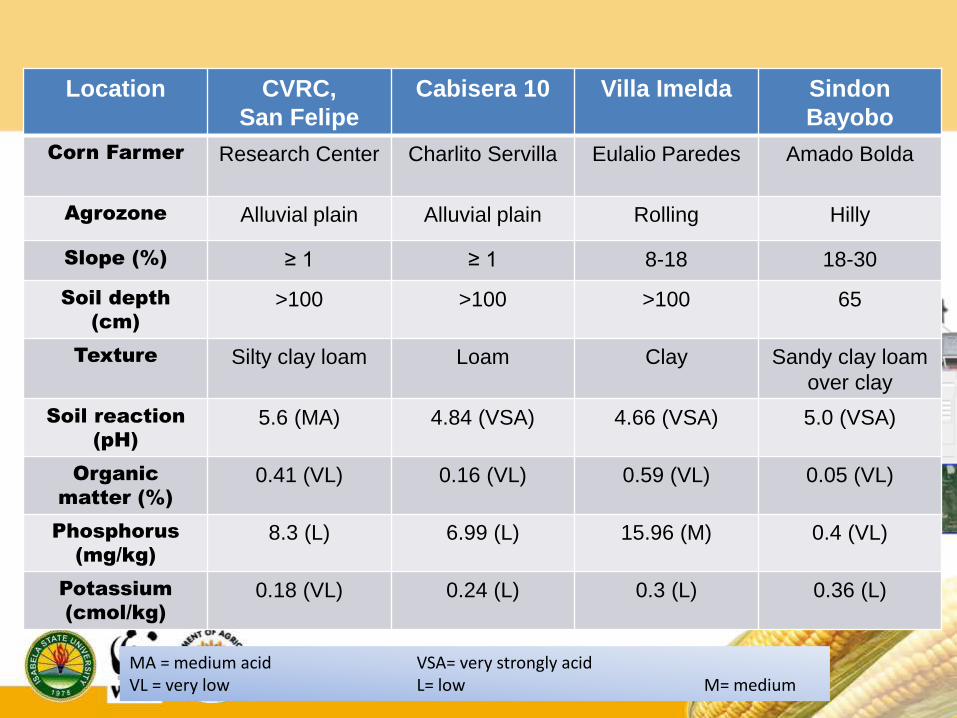
Location CVRC,
San Felipe
Cabisera 10 Villa Imelda Sindon
Bayobo
Corn Farmer Research Center Charlito Servilla Eulalio Paredes Amado Bolda
Agrozone Alluvial plain Alluvial plain Rolling Hilly
Slope (%) ≥ 1 ≥ 1 8-18 18-30
Soil depth
(cm)
>100 >100 >100 65
Texture Silty clay loam Loam Clay Sandy clay loam
over clay
Soil reaction
(pH)
5.6 (MA) 4.84 (VSA) 4.66 (VSA) 5.0 (VSA)
Organic
matter (%)
0.41 (VL) 0.16 (VL) 0.59 (VL) 0.05 (VL)
Phosphorus
(mg/kg)
8.3 (L) 6.99 (L) 15.96 (M) 0.4 (VL)
Potassium
(cmol/kg)
0.18 (VL) 0.24 (L) 0.3 (L) 0.36 (L)
MA = medium acid VSA= very strongly acidVL = very low L= low M= medium

Project Site

Instrumentation and Data Monitoring

Experimental layout for rainfed and irrigated (500 sq.m. at CVRC, San Felipe,
Ilagan City, Isabela)
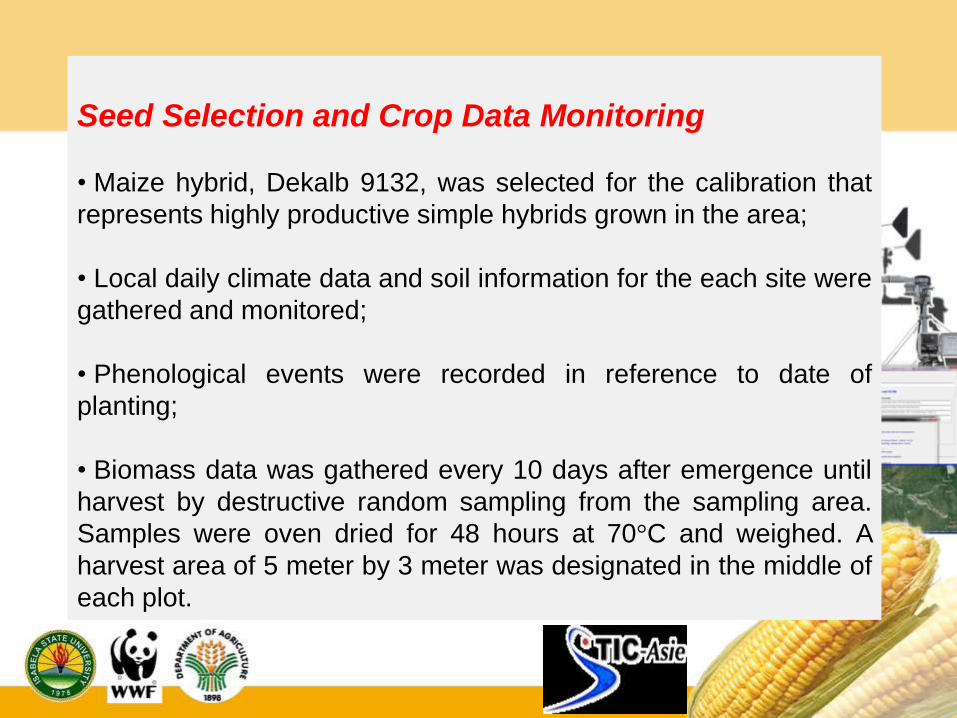
Seed Selection and Crop Data Monitoring
• Maize hybrid, Dekalb 9132, was selected for the calibration that
represents highly productive simple hybrids grown in the area;
• Local daily climate data and soil information for the each site were
gathered and monitored;
• Phenological events were recorded in reference to date of
planting;
• Biomass data was gathered every 10 days after emergence until
harvest by destructive random sampling from the sampling area.
Samples were oven dried for 48 hours at 70°C and weighed. A
harvest area of 5 meter by 3 meter was designated in the middle of
each plot.

Results and Discussion

Definition Variable Unit Coeff.
1 Thermal time from seedling emergence to the end of the juvenile phase
P1 degree days above TBASE during which the plant is not responsive to changes in photoperiod
266.4
2 Extent to which development is delayed for each hour increase in photoperiod above the longest photoperiod at which development proceeds at a maximum rate (which is considered to be 12.5 hours)
P2 expressed as days 0.114
3 Thermal time from silking to physiological maturity
P5 expressed in degree days above a base temperature of 8øC
850.3
4 Maximum possible number of kernels per plant
G2 928
5 Kernel filling rate during the linear grain filling stage and under optimum conditions
G3 mg/day 16.47
6 Phylochron interval; the interval in thermal time between successive leaf tip appearances
PHINT degree days 45
Derivation/Calibration of Crop Coefficient for Dekalb 9132
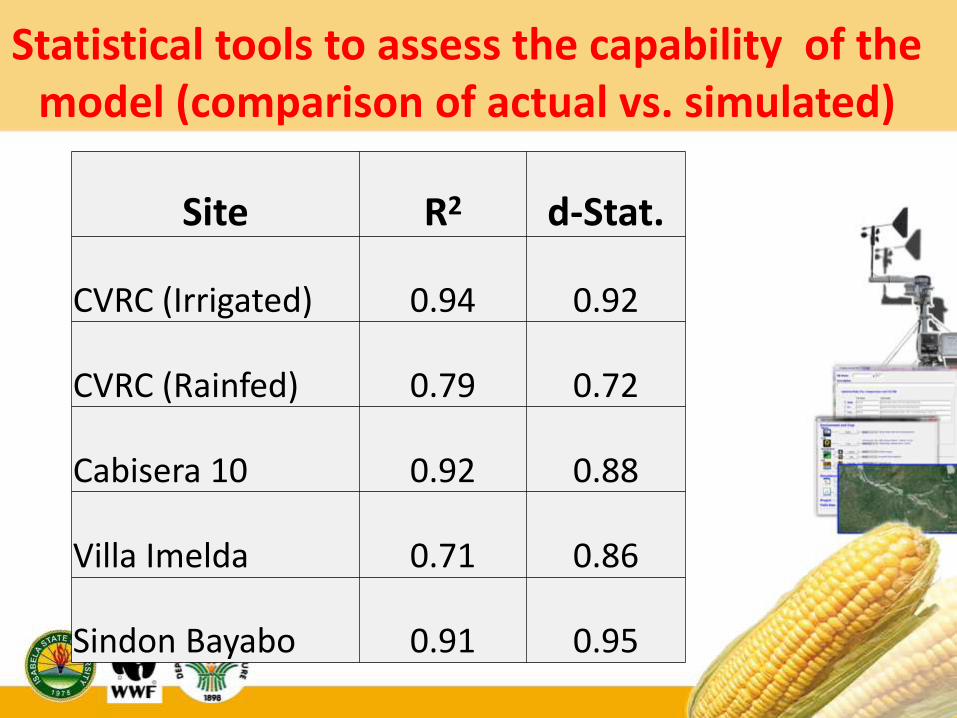
Site R2 d-Stat.
CVRC (Irrigated) 0.94 0.92
CVRC (Rainfed) 0.79 0.72
Cabisera 10 0.92 0.88
Villa Imelda 0.71 0.86
Sindon Bayabo 0.91 0.95
Statistical tools to assess the capability of the model (comparison of actual vs. simulated)
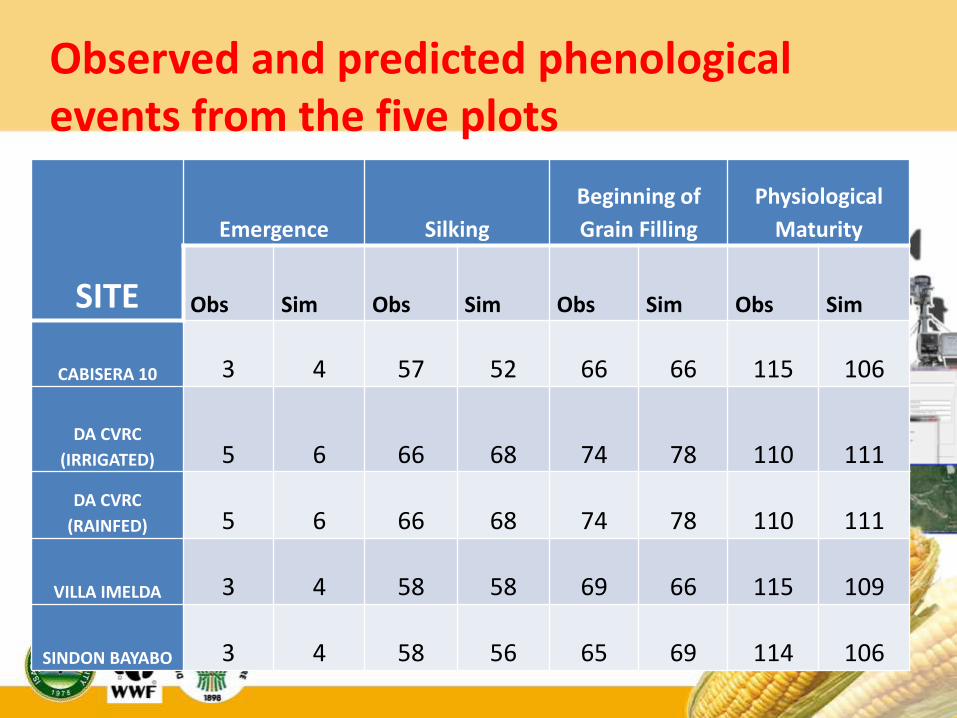
Observed and predicted phenologicalevents from the five plots
SITE
Emergence Silking
Beginning of
Grain Filling
Physiological
Maturity
Obs Sim Obs Sim Obs Sim Obs Sim
CABISERA 10 3 4 57 52 66 66 115 106
DA CVRC
(IRRIGATED) 5 6 66 68 74 78 110 111
DA CVRC
(RAINFED) 5 6 66 68 74 78 110 111
VILLA IMELDA 3 4 58 58 69 66 115 109
SINDON BAYABO 3 4 58 56 65 69 114 106

SITE PLANTING DATE OBSERVED SIMULATED
CVRC IRRIGATED June 12 2014 8800 9163
CVRC RAINFED June 12 2014 8213 8777
CABISERA10 June 2 2014 9867 10202
VILLA IMELDA July 3 2014 5190 5024
SINDON BAYABO June 27 2014 7167 7566
Simulated and observed grain yield during the wet season cropping, kg/ha
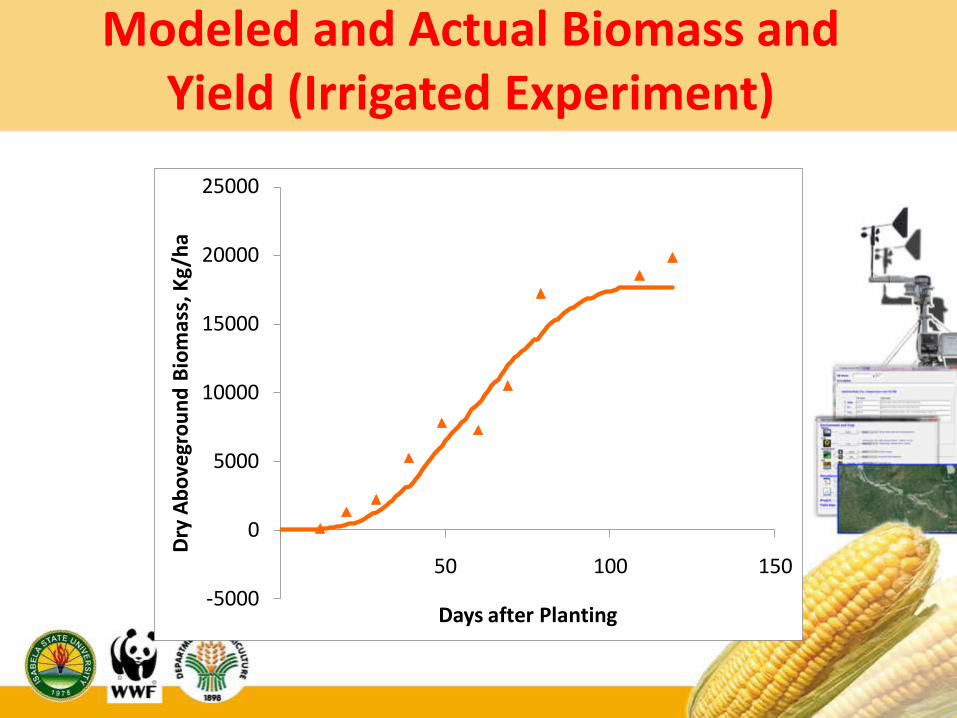
Modeled and Actual Biomass and Yield (Irrigated Experiment)
-5000
0
5000
10000
15000
20000
25000
50 100 150
Dry
Ab
ove
gro
un
d B
iom
ass,
Kg/
ha
Days after Planting

Modeled and Actual Biomass and Yield (Rainfed Experiment)
-1000
0
1000
2000
3000
4000
5000
6000
7000
50 100 150
Dry
Ab
ove
gro
un
d B
iom
ass
, Kg
/ha
Days after Planting

Yield projections for 2014-2015 El Nino for Dec15 and Jan1 Planting (Presented at El Nino Forum, Nov. 2014)
3600
3700
3800
3900
4000
4100
4200
4300
4400
4500
Dec 15 Jan 1
Yie
ld, k
g/h
a
Normal year (1991-2000) 2014-2015 (projected)
Yield projections for Dec 1 and Jan 1 planting dates using normal year (1991-2000) and 2014-2015 projected weather data
0
2000
4000
6000
8000
10000
12000
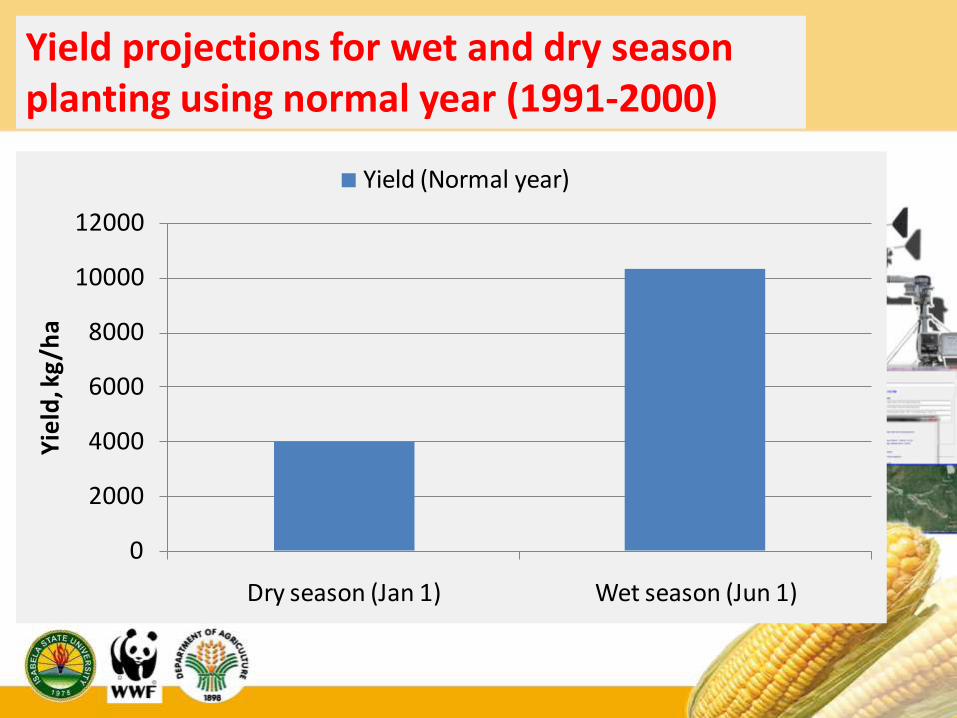
Dry season (Jan 1) Wet season (Jun 1)
Yie
ld, k
g/h
a
Yield (Normal year)
Yield projections for wet and dry season planting using normal year (1991-2000)
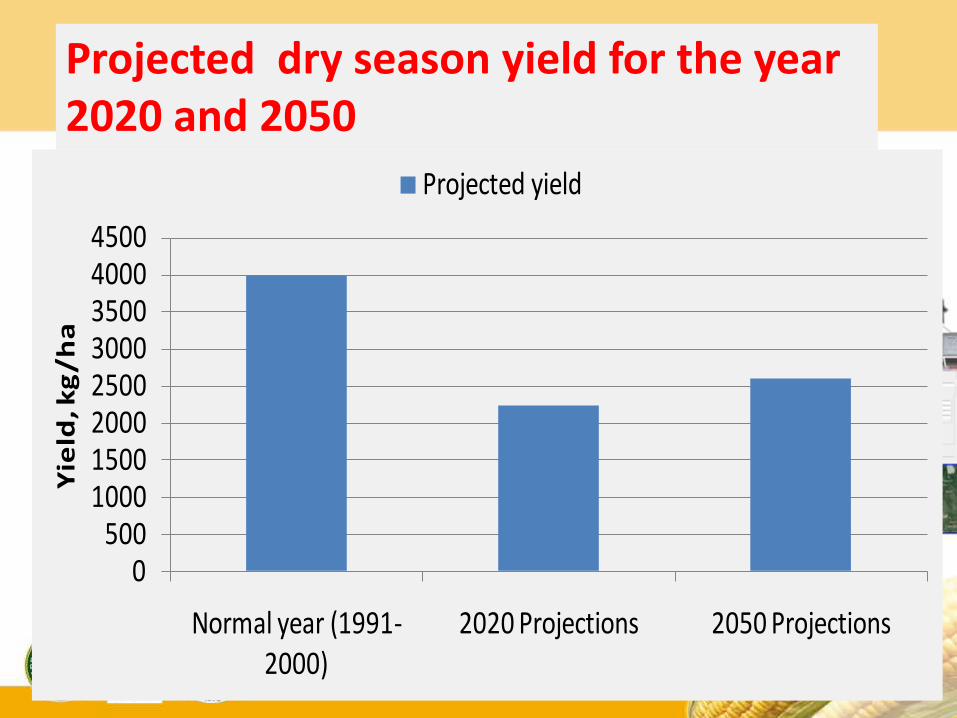
0500
10001500200025003000350040004500
Normal year (1991-2000)
2020 Projections 2050 Projections
Yie
ld, k
g/h
a
Projected yield
Projected dry season yield for the year 2020 and 2050

The irrigated (left) and rainfed (right) plots 50 days after planting (Feb 26, 2014)

The irrigated (left) and rainfed (right) plots during harvest 122 days after
planting (May 9, 2014)

The harvested yield of corn from the irrigated and rainfed plots.

CONCLUSIONS and RECOMMENDATIONS
• Calibration of these coefficients was successful as manifested by close agreement between actual and simulated biomass and phenological events;
• The model predicted the actual corn biomass production and phenological stages as indicated by statistical analysis performed with acceptable error;
• Without intervention, corn yield would be reduced by up to 44% in 2020 and 35% in 2050 due to change in rainfall amount and rise in temperature;
• A roadmap should be develop with institutional plan to develop a farmer decision support system using our R&D result

Development and Application of Farmer Decision Support System (FDSS): Way Forward

Proposed FDSS Framework

FDSS Architecture

Mga impormasyon makukuha sa FDSS by SMS(Goal: Increased yield by at least 30%)
• Pinakamagandangaraw ng pagtatanim
• Pinakamainam nadami at petsa ngpaglalagay ng abono

• Dami at petsa ngpatubig
• Kailan ang pagsibol, pagusbong, paglaking halaman

• Pagtantya ng daming ani


![Maize Cultivar Specific Parameters for Ecision Support ... · 2.1. CERES-Maize Model Description CERES (Crop-Environment-Resource-Synthesis)—Maize module [18] within the DSSAT v](https://img.pdfslide.us/doc/110x75/5ed7afd286e8a75e3f29900e/maize-cultivar-specific-parameters-for-ecision-support-21-ceres-maize-model.jpg)