Embed Size (px)
Citation preview
APPLICATION OF SUSTAINABLE URBAN TRANSPORT INDEX
( S U T I )IN SURABAYA
Wahju Herijanto
Lecturer
Civil Engineering Department
INSTITUT TEKNOLOGI SEPULUH NOPEMBER (ITS)
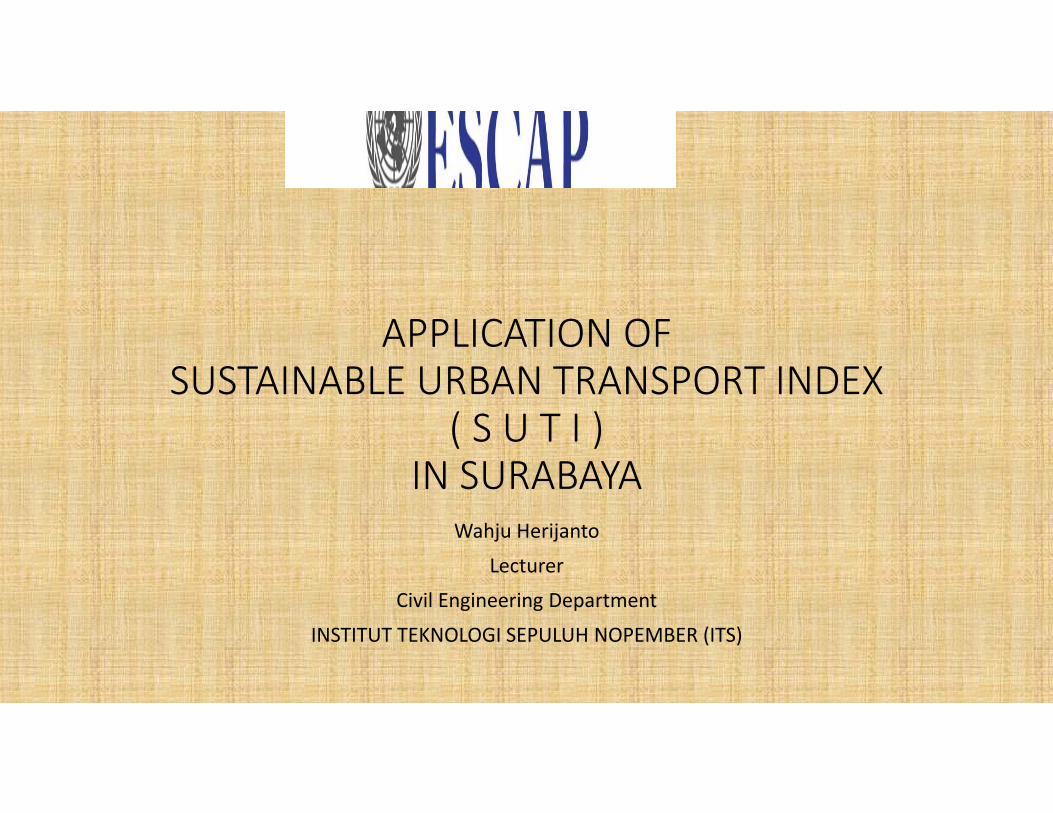
SURABAYA, 2nd of Indonesia
Land‐use.Source: Surabaya C‐map
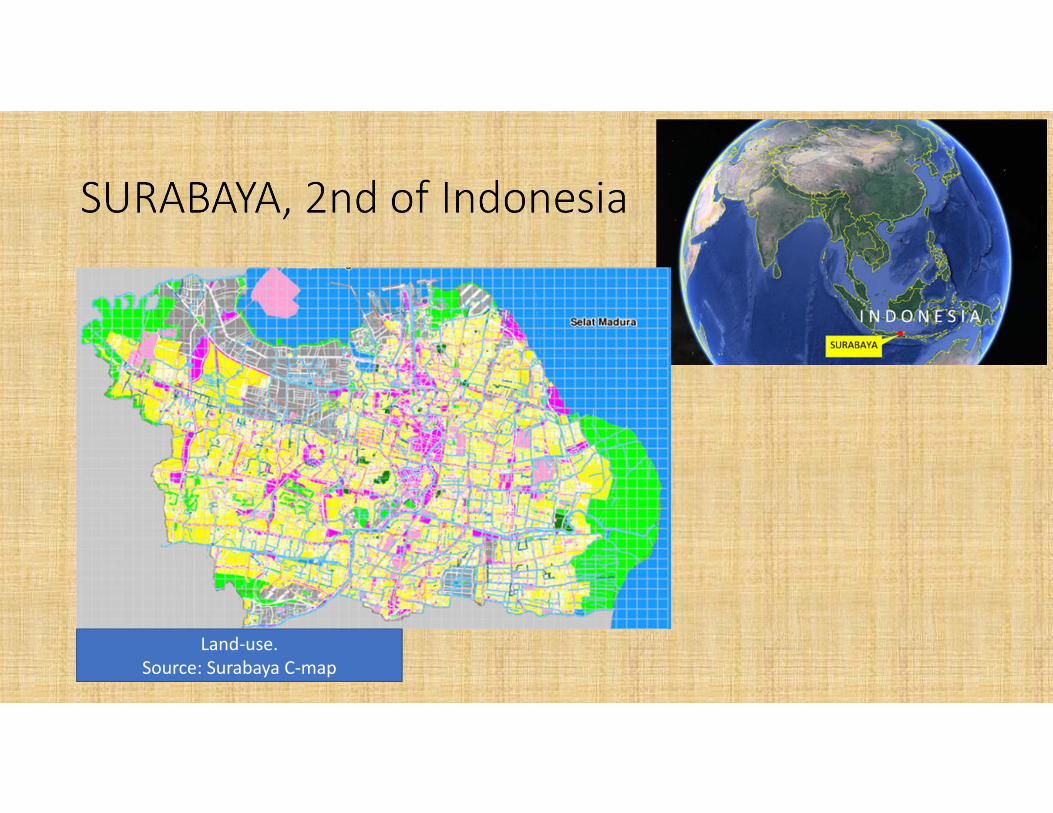
Gate of Surabaya: Purabaya Bus Terminal and Railway Station
Intermodal Bus Terminal with Airport Quality : City Bus; Intercity Bus and Airport Bus
The busiest in South East Asia
Source: losbp in skyscrapercity.com

City Bus: Damri and others
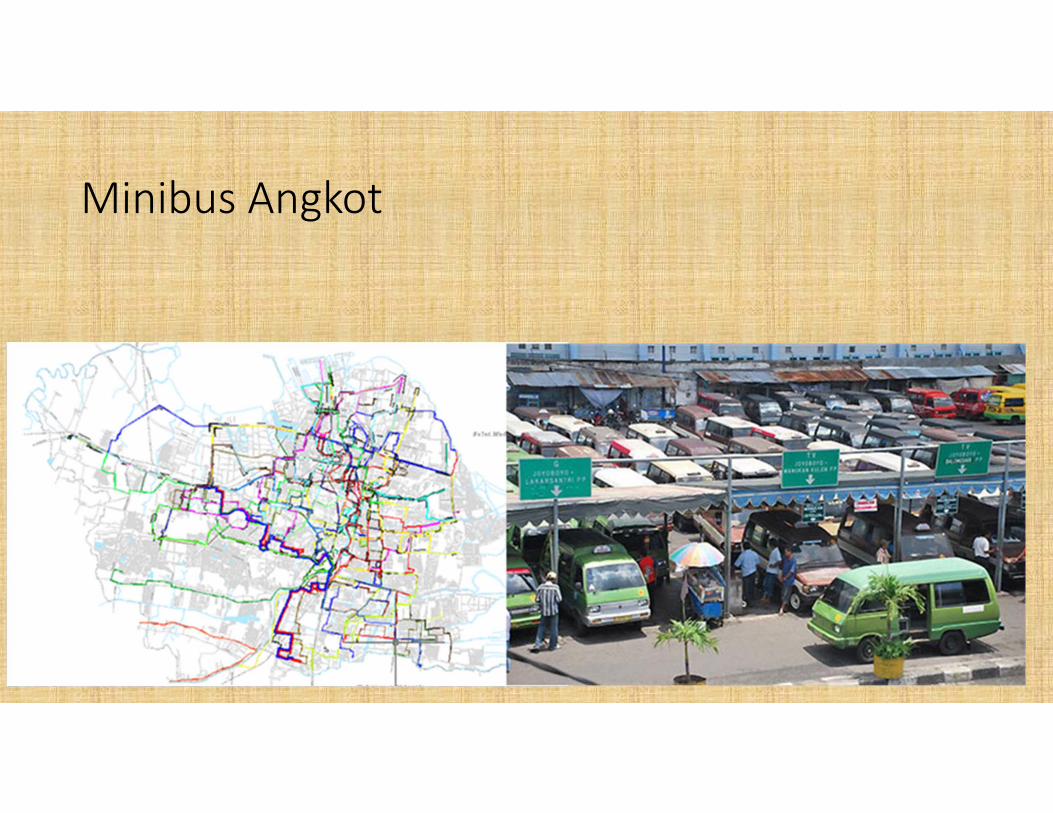
Minibus Angkot
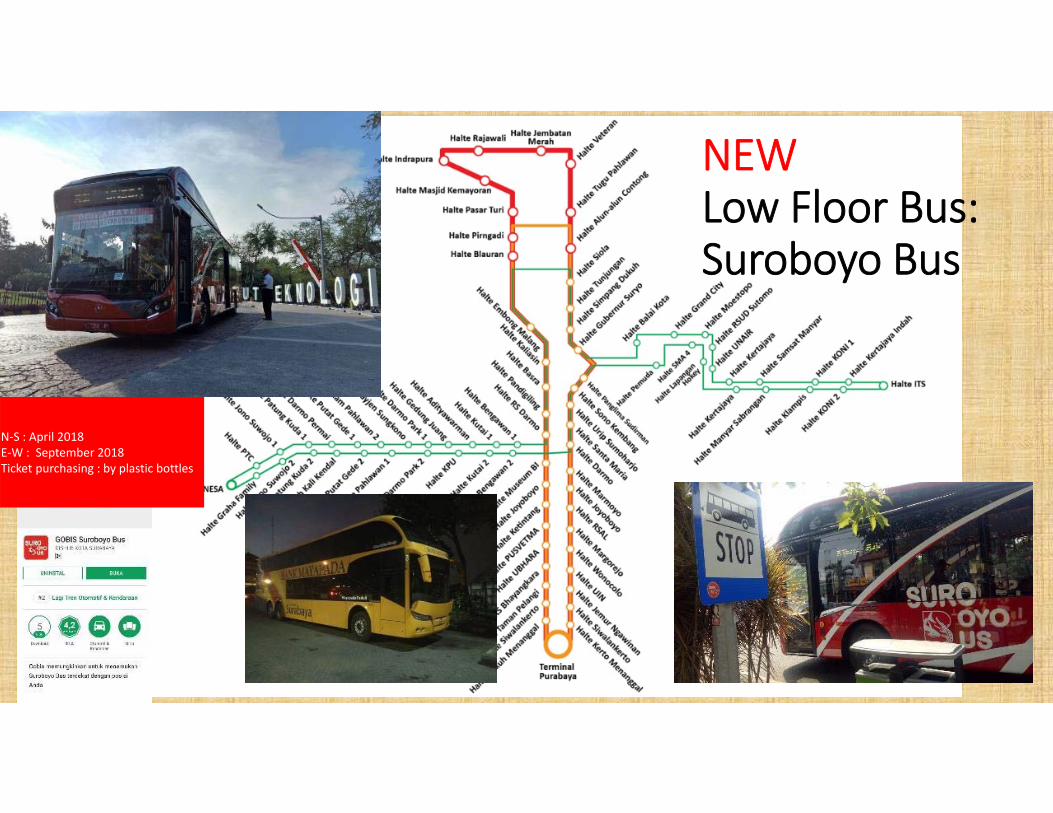
NEWLow Floor Bus:Suroboyo Bus
N‐S : April 2018E‐W : September 2018Ticket purchasing : by plastic bottles
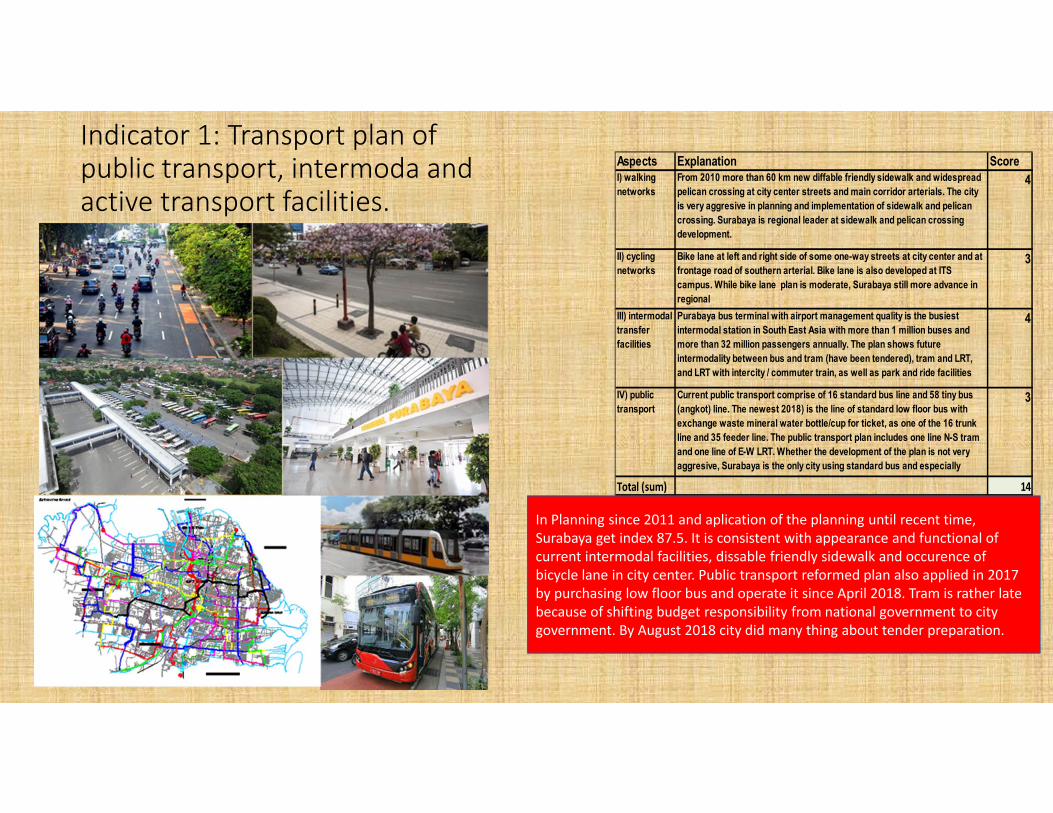
Indicator 1: Transport plan of public transport, intermoda and active transport facilities.
Aspects Explanation ScoreI) walking networks
From 2010 more than 60 km new diffable friendly sidewalk and widespread pelican crossing at city center streets and main corridor arterials. The city is very aggresive in planning and implementation of sidewalk and pelican crossing. Surabaya is regional leader at sidewalk and pelican crossing development.
4
II) cycling networks
Bike lane at left and right side of some one-way streets at city center and at frontage road of southern arterial. Bike lane is also developed at ITS campus. While bike lane plan is moderate, Surabaya still more advance in regional
3
III) intermodal transfer facilities
Purabaya bus terminal with airport management quality is the busiest intermodal station in South East Asia with more than 1 million buses and more than 32 million passengers annually. The plan shows future intermodality between bus and tram (have been tendered), tram and LRT, and LRT with intercity / commuter train, as well as park and ride facilities
4
IV) public transport
Current public transport comprise of 16 standard bus line and 58 tiny bus (angkot) line. The newest 2018) is the line of standard low floor bus with exchange waste mineral water bottle/cup for ticket, as one of the 16 trunk line and 35 feeder line. The public transport plan includes one line N-S tram and one line of E-W LRT. Whether the development of the plan is not very aggresive, Surabaya is the only city using standard bus and especially
i i i i l fl diff bl f i dl b
3
Total (sum) 14
In Planning since 2011 and aplication of the planning until recent time, Surabaya get index 87.5. It is consistent with appearance and functional of current intermodal facilities, dissable friendly sidewalk and occurence of bicycle lane in city center. Public transport reformed plan also applied in 2017 by purchasing low floor bus and operate it since April 2018. Tram is rather late because of shifting budget responsibility from national government to city government. By August 2018 city did many thing about tender preparation.
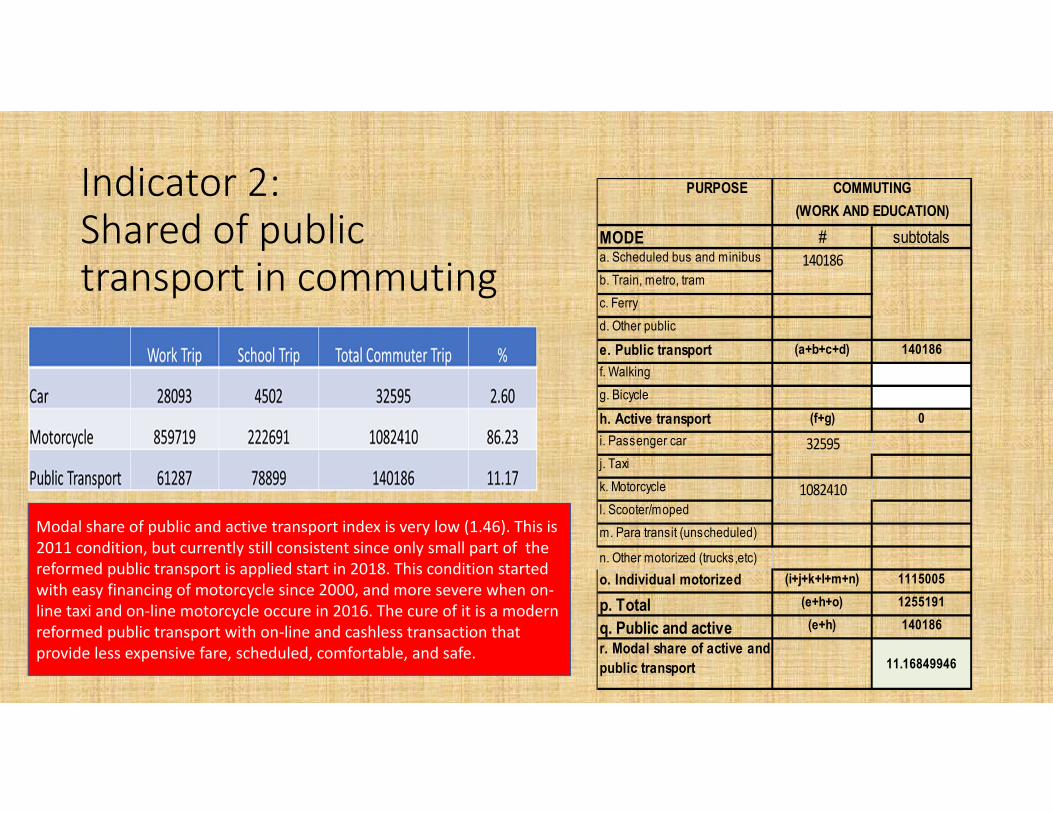
Indicator 2:Shared of public transport in commuting
MODE # subtotalsa. Scheduled bus and minibus 140186b. Train, metro, tramc. Ferry
d. Other public
e. Public transport (a+b+c+d) 140186f. Walking
g. Bicycle
h. Active transport (f+g) 0i. Passenger car 32595j. Taxi
k. Motorcycle 1082410l. Scooter/mopedm. Para transit (unscheduled)
n. Other motorized (trucks,etc)o. Individual motorized (i+j+k+l+m+n) 1115005
p. Total (e+h+o) 1255191
q. Public and active (e+h) 140186
r. Modal share of active and public transport 11.16849946
PURPOSE COMMUTING(WORK AND EDUCATION)
Modal share of public and active transport index is very low (1.46). This is 2011 condition, but currently still consistent since only small part of the reformed public transport is applied start in 2018. This condition started with easy financing of motorcycle since 2000, and more severe when on‐line taxi and on‐line motorcycle occure in 2016. The cure of it is a modern reformed public transport with on‐line and cashless transaction that provide less expensive fare, scheduled, comfortable, and safe.
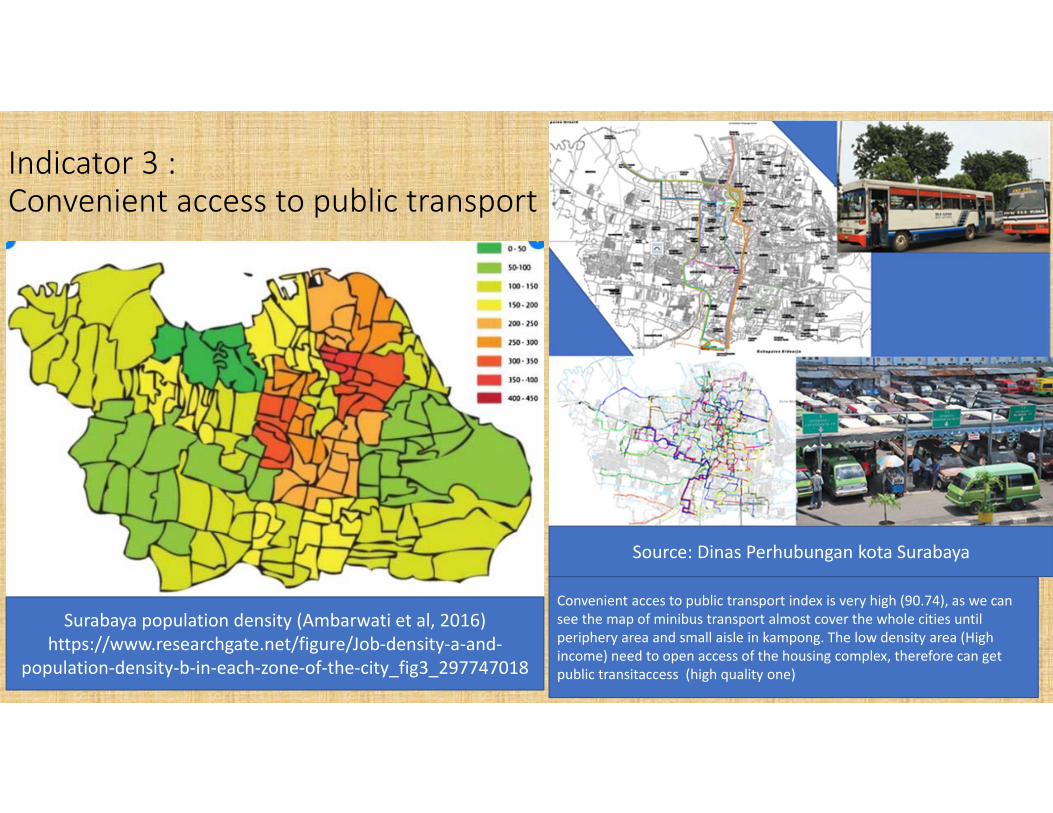
Indicator 3 : Convenient access to public transport
Surabaya population density (Ambarwati et al, 2016)https://www.researchgate.net/figure/Job‐density‐a‐and‐
population‐density‐b‐in‐each‐zone‐of‐the‐city_fig3_297747018
Source: Dinas Perhubungan kota Surabaya
Convenient acces to public transport index is very high (90.74), as we can see the map of minibus transport almost cover the whole cities until periphery area and small aisle in kampong. The low density area (High income) need to open access of the housing complex, therefore can get public transitaccess (high quality one)
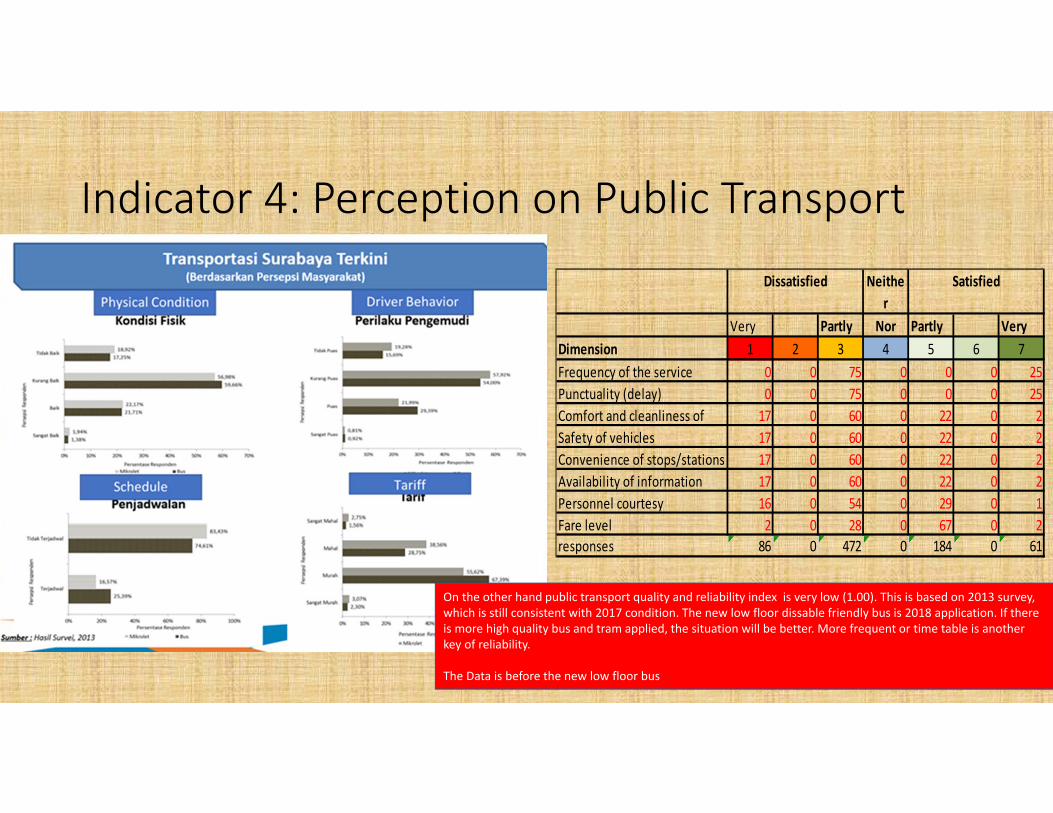
Indicator 4: Perception on Public Transport Neithe
rVery Partly Nor Partly Very
Dimension 1 2 3 4 5 6 7Frequency of the service 0 0 75 0 0 0 25Punctuality (delay) 0 0 75 0 0 0 25Comfort and cleanliness of 17 0 60 0 22 0 2Safety of vehicles 17 0 60 0 22 0 2Convenience of stops/stations 17 0 60 0 22 0 2Availability of information 17 0 60 0 22 0 2Personnel courtesy 16 0 54 0 29 0 1Fare level 2 0 28 0 67 0 2responses 86 0 472 0 184 0 61
Dissatisfied Satisfied
On the other hand public transport quality and reliability index is very low (1.00). This is based on 2013 survey, which is still consistent with 2017 condition. The new low floor dissable friendly bus is 2018 application. If there is more high quality bus and tram applied, the situation will be better. More frequent or time table is another key of reliability.
The Data is before the new low floor bus
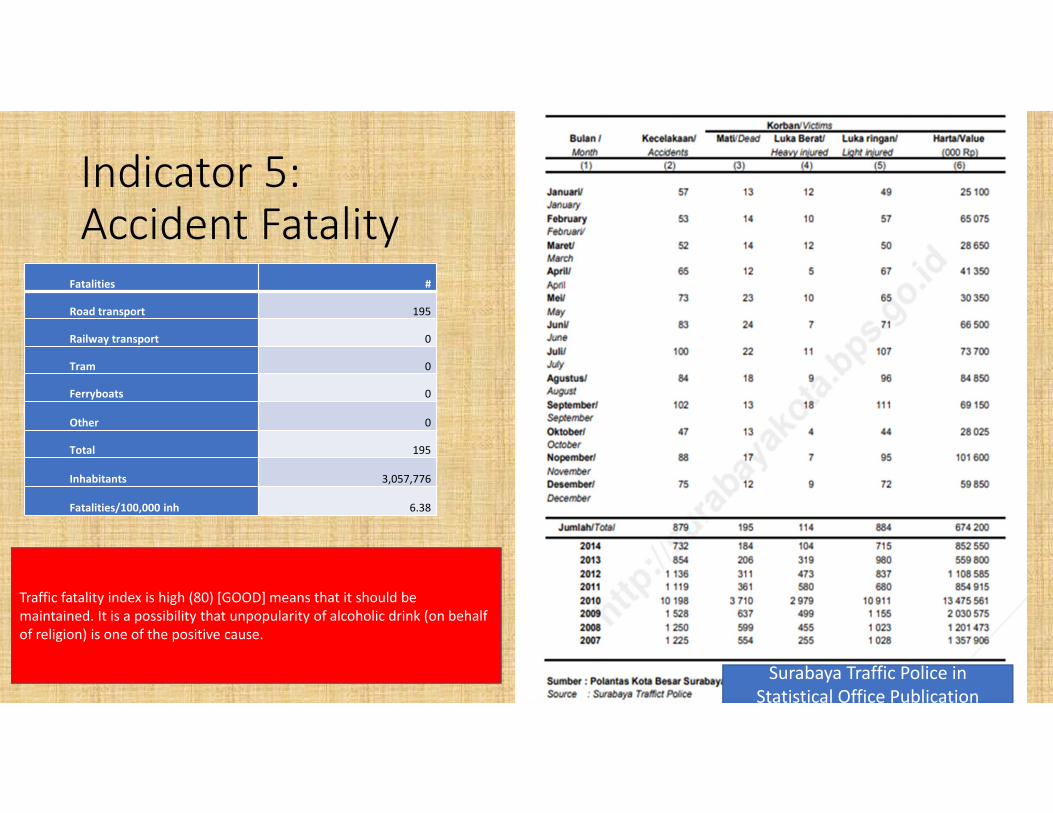
Indicator 5: Accident Fatality
Fatalities #
Road transport 195
Railway transport 0
Tram 0
Ferryboats 0
Other 0
Total 195
Inhabitants 3,057,776
Fatalities/100,000 inh 6.38
Surabaya Traffic Police in Statistical Office Publication
Traffic fatality index is high (80) [GOOD] means that it should be maintained. It is a possibility that unpopularity of alcoholic drink (on behalf of religion) is one of the positive cause.
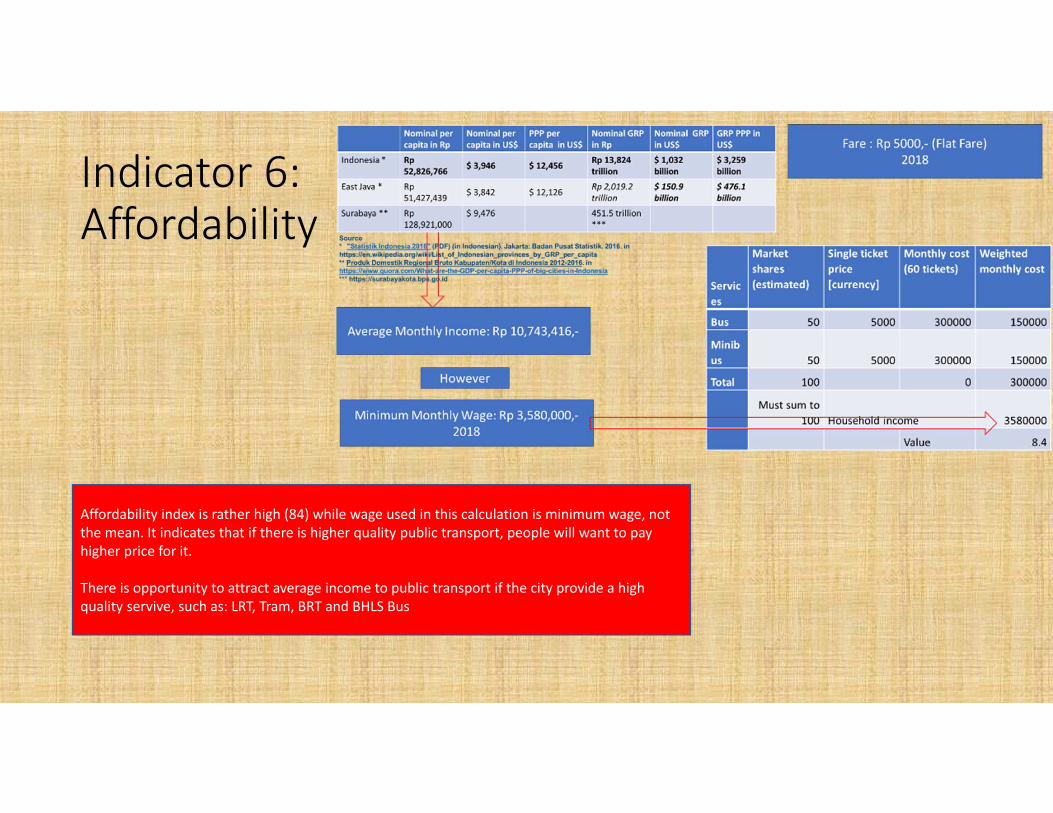
Indicator 6:Affordability
Affordability index is rather high (84) while wage used in this calculation is minimum wage, not the mean. It indicates that if there is higher quality public transport, people will want to pay higher price for it.
There is opportunity to attract average income to public transport if the city provide a high quality servive, such as: LRT, Tram, BRT and BHLS Bus
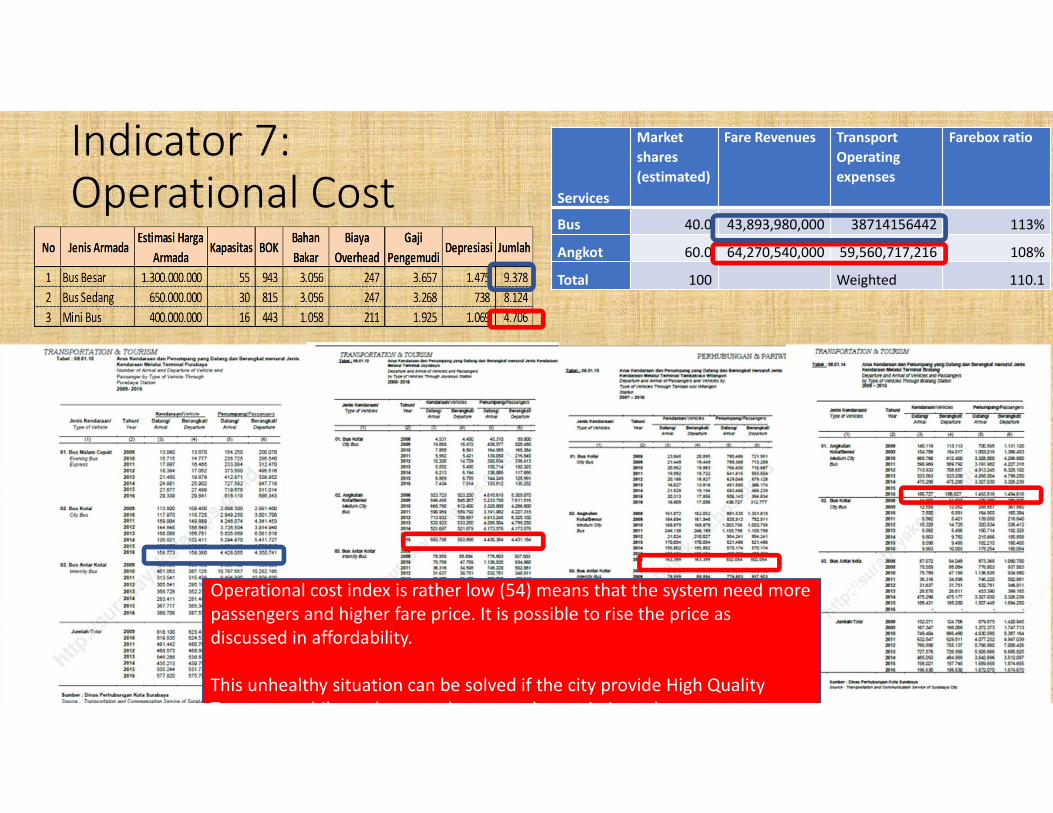
Indicator 7:Operational Cost Services
Market shares (estimated)
Fare Revenues Transport Operating expenses
Farebox ratio
Bus 40.0 43,893,980,000 38714156442 113%
Angkot 60.0 64,270,540,000 59,560,717,216 108%
Total 100 Weighted 110.1
Operational cost index is rather low (54) means that the system need more passengers and higher fare price. It is possible to rise the price as discussed in affordability.
This unhealthy situation can be solved if the city provide High Quality T t hil l d t l t i ti h
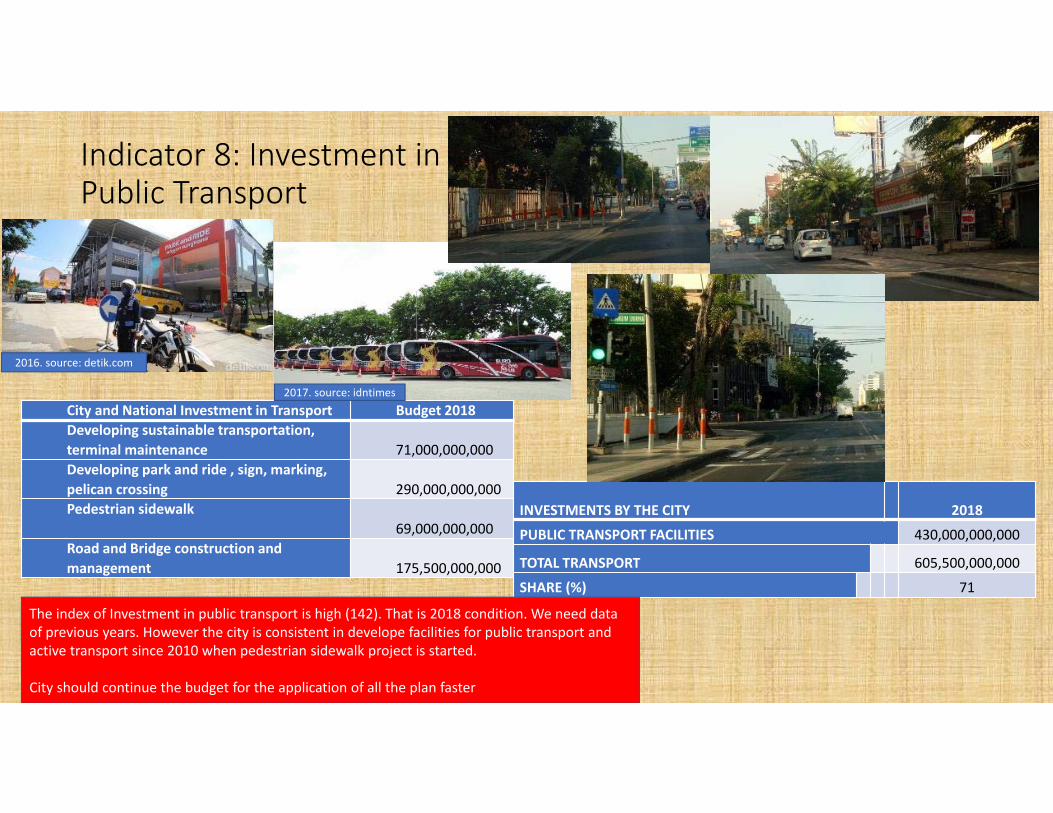
Indicator 8: Investment in Public Transport
City and National Investment in Transport Budget 2018Developing sustainable transportation, terminal maintenance 71,000,000,000 Developing park and ride , sign, marking, pelican crossing 290,000,000,000 Pedestrian sidewalk
69,000,000,000 Road and Bridge construction and management 175,500,000,000
INVESTMENTS BY THE CITY 2018
PUBLIC TRANSPORT FACILITIES 430,000,000,000
TOTAL TRANSPORT 605,500,000,000
SHARE (%) 71
2016. source: detik.com
2017. source: idntimes
The index of Investment in public transport is high (142). That is 2018 condition. We need data of previous years. However the city is consistent in develope facilities for public transport and active transport since 2010 when pedestrian sidewalk project is started.
City should continue the budget for the application of all the plan faster
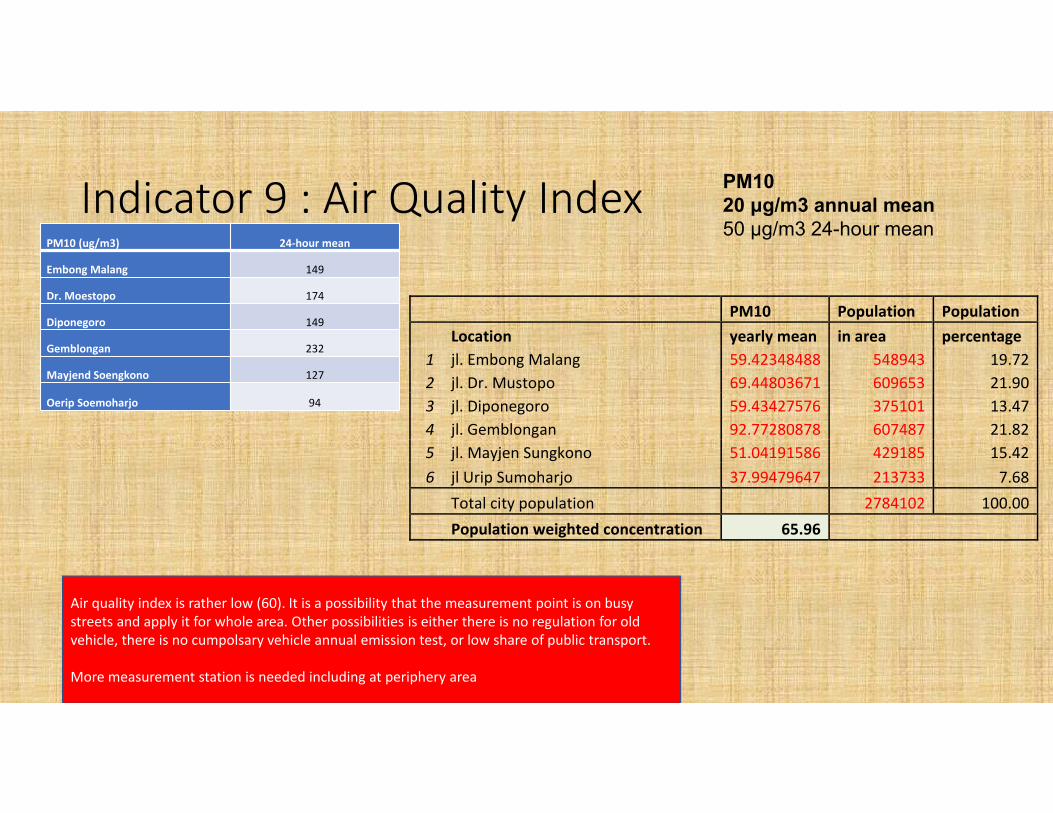
Indicator 9 : Air Quality Index PM10 (ug/m3) 24‐hour mean
Embong Malang 149
Dr. Moestopo 174
Diponegoro 149
Gemblongan 232
Mayjend Soengkono 127
Oerip Soemoharjo 94
PM10 Population Population Location yearly mean in area percentage
1 jl. Embong Malang 59.42348488 548943 19.72 2 jl. Dr. Mustopo 69.44803671 609653 21.90 3 jl. Diponegoro 59.43427576 375101 13.47 4 jl. Gemblongan 92.77280878 607487 21.82 5 jl. Mayjen Sungkono 51.04191586 429185 15.42 6 jl Urip Sumoharjo 37.99479647 213733 7.68 Total city population 2784102 100.00 Population weighted concentration 65.96
Air quality index is rather low (60). It is a possibility that the measurement point is on busy streets and apply it for whole area. Other possibilities is either there is no regulation for old vehicle, there is no cumpolsary vehicle annual emission test, or low share of public transport.
More measurement station is needed including at periphery area
PM10 20 μg/m3 annual mean 50 μg/m3 24-hour mean
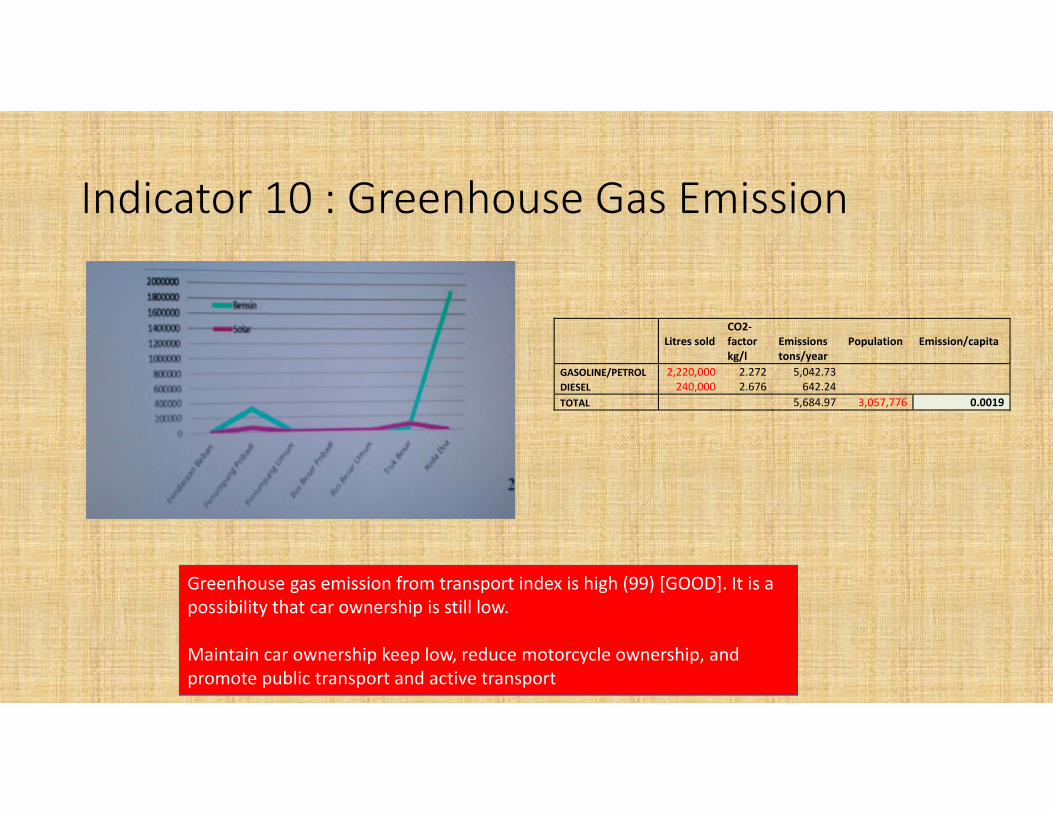
Indicator 10 : Greenhouse Gas Emission
Litres sold CO2‐factor Emissions Population Emission/capita
kg/l tons/year GASOLINE/PETROL 2,220,000 2.272 5,042.73DIESEL 240,000 2.676 642.24 TOTAL 5,684.97 3,057,776 0.0019
Greenhouse gas emission from transport index is high (99) [GOOD]. It is a possibility that car ownership is still low.
Maintain car ownership keep low, reduce motorcycle ownership, and promote public transport and active transport
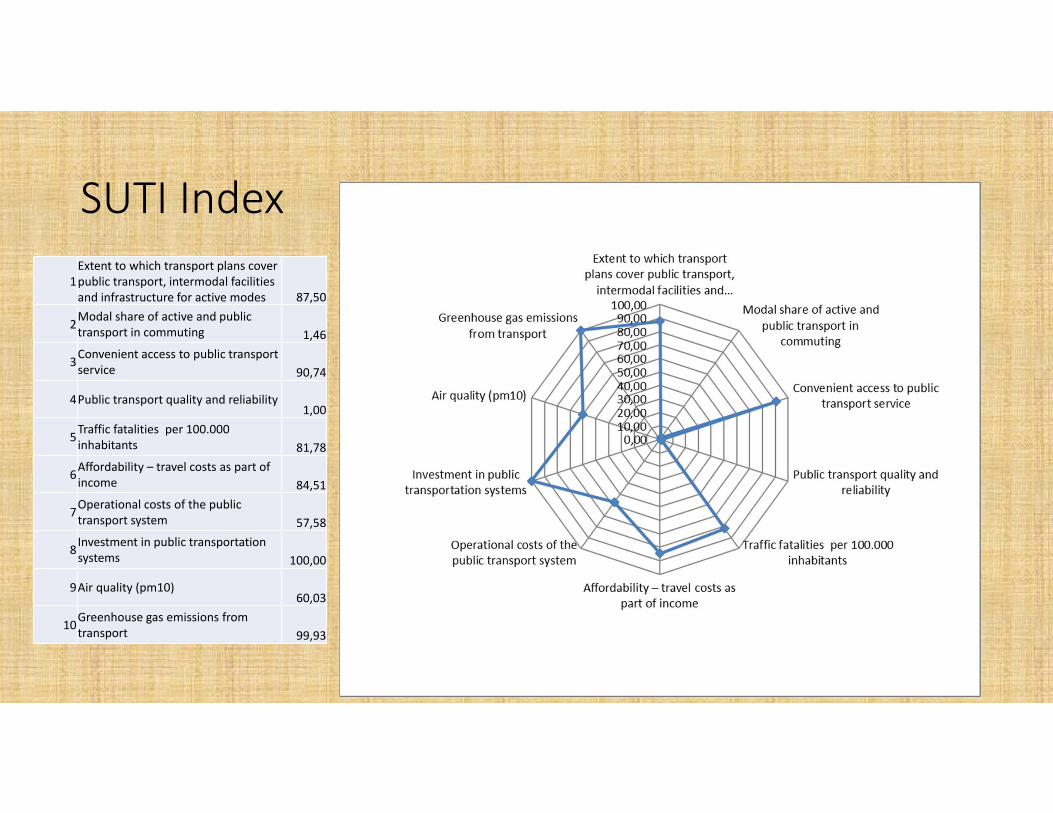
SUTI Index1Extent to which transport plans cover public transport, intermodal facilities and infrastructure for active modes 87,50
2Modal share of active and public transport in commuting 1,46
3Convenient access to public transport service 90,74
4Public transport quality and reliability1,00
5Traffic fatalities per 100.000 inhabitants 81,78
6Affordability – travel costs as part of income 84,51
7Operational costs of the public transport system 57,58
8Investment in public transportation systems 100,00
9Air quality (pm10)60,03
10Greenhouse gas emissions from transport 99,93
Interpretatio
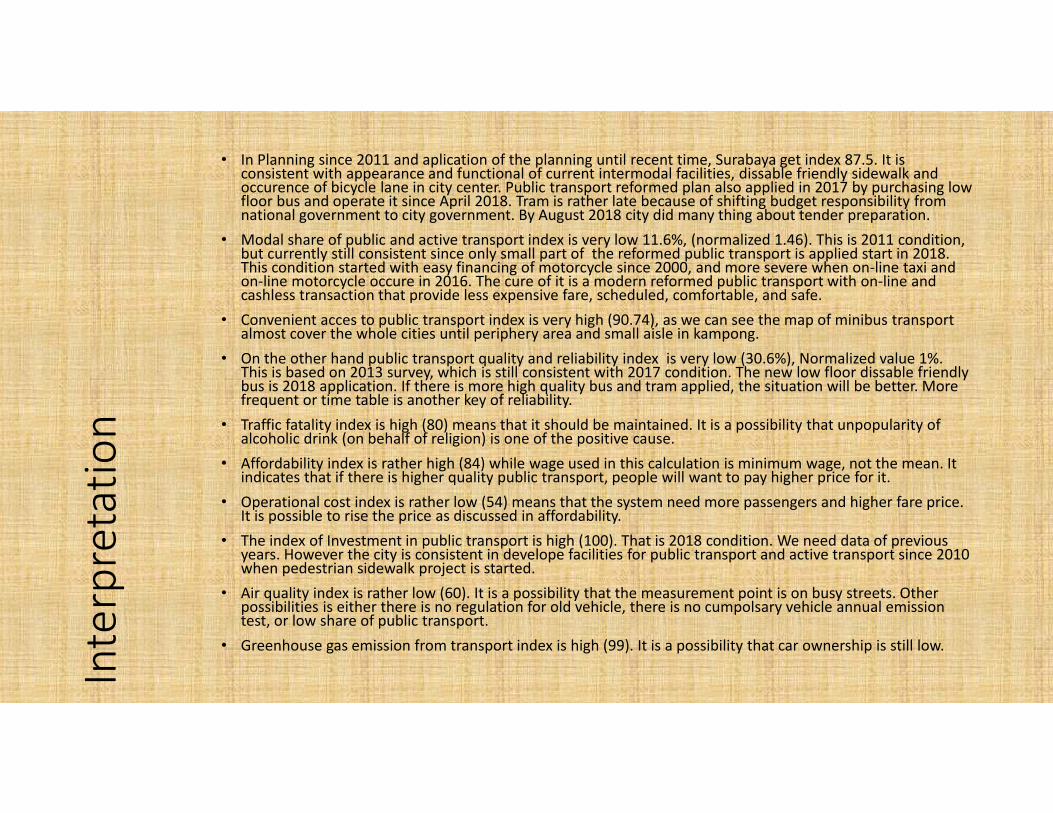
n• In Planning since 2011 and aplication of the planning until recent time, Surabaya get index 87.5. It is
consistent with appearance and functional of current intermodal facilities, dissable friendly sidewalk and occurence of bicycle lane in city center. Public transport reformed plan also applied in 2017 by purchasing low floor bus and operate it since April 2018. Tram is rather late because of shifting budget responsibility from national government to city government. By August 2018 city did many thing about tender preparation.
• Modal share of public and active transport index is very low 11.6%, (normalized 1.46). This is 2011 condition, but currently still consistent since only small part of the reformed public transport is applied start in 2018. This condition started with easy financing of motorcycle since 2000, and more severe when on‐line taxi and on‐line motorcycle occure in 2016. The cure of it is a modern reformed public transport with on‐line and cashless transaction that provide less expensive fare, scheduled, comfortable, and safe.
• Convenient acces to public transport index is very high (90.74), as we can see the map of minibus transport almost cover the whole cities until periphery area and small aisle in kampong.
• On the other hand public transport quality and reliability index is very low (30.6%), Normalized value 1%. This is based on 2013 survey, which is still consistent with 2017 condition. The new low floor dissable friendly bus is 2018 application. If there is more high quality bus and tram applied, the situation will be better. More frequent or time table is another key of reliability.
• Traffic fatality index is high (80) means that it should be maintained. It is a possibility that unpopularity of alcoholic drink (on behalf of religion) is one of the positive cause.
• Affordability index is rather high (84) while wage used in this calculation is minimum wage, not the mean. It indicates that if there is higher quality public transport, people will want to pay higher price for it.
• Operational cost index is rather low (54) means that the system need more passengers and higher fare price. It is possible to rise the price as discussed in affordability.
• The index of Investment in public transport is high (100). That is 2018 condition. We need data of previous years. However the city is consistent in develope facilities for public transport and active transport since 2010 when pedestrian sidewalk project is started.
• Air quality index is rather low (60). It is a possibility that the measurement point is on busy streets. Other possibilities is either there is no regulation for old vehicle, there is no cumpolsary vehicle annual emission test, or low share of public transport.
• Greenhouse gas emission from transport index is high (99). It is a possibility that car ownership is still low.
THANK YOU
Wahju HerijantoLecturer of Civil Engineering Department
INSTITUT TEKNOLOGI SEPULUH NOPEMBEREmail : [email protected]

![EEE 377 – DIGITAL COMMUNICATIONS [PERHUBUNGAN DIGIT]eprints.usm.my/30857/1/EEE377.pdf · EEE 377 – DIGITAL COMMUNICATIONS [PERHUBUNGAN DIGIT] Duration 3 hours [Masa : 3 jam]](https://img.pdfslide.us/doc/110x75/5c903f3e09d3f2907b8b95cf/eee-377-digital-communications-perhubungan-digit-eee-377-digital-communications.jpg)