Embed Size (px)
Citation preview

APPLICATION OF MULTITEMPORAL LANDSAT DATA TO MAP AND MONITOR LAND COVER AND LAND USE CHANGE
IN THE CHESAPEAKE BAY WATERSHED
S. J. GOETZ
Woods Hole Research Center Woods Hole, Massachusetts 02543-0296 USA
E-mail: [email protected]
D. VARLYGUIN, A. J. SMITH, R. K. WRIGHT, S. D. PRINCE, M. E. MAZZACATO, J. TRINGE, C. JANTZ, B. MELCHOIR
Department of Geography University of Maryland, College Park, USA
We have developed approaches to map and monitor land cover and land use change across the Chesapeake Bay watershed, in the mid-Atlantic region of the United States, using multi-temporal, multi-scale image data. Here we provide an overview of the methods and map products, which have relevance to a range of resource management and decision-support applications.
1 Introduction
Multitemporal satellite data provide the capability for mapping and monitoring land cover and land use change, but require the development of accurate and repeatable techniques that can be extended to a broad range of environments and conditions. We have developed approaches to map and monitor land cover and land use change in the Chesapeake Bay watershed (CBW), a region comprised of diverse physiographic provinces and a complex mosaic of land cover types, farming practices and land use management strategies. Our results working in this region have practical implications for application to an even wider range of conditions. Decision-tree classification algorithms and associated decision rules have been developed using a combination of field data, digital Landsat, Ikonos and orthophoto (DOQ) imagery, and supporting geographic information system (GIS) coverages, including planimetric and land use maps contributed by numerous collaborators in the region. We report on the development of these maps and methods, including local-scale to region-wide products useful for a broad range of resource management and decision-support applications.

2
1.1 Image Data Sets and Preprocessing
A total of more than 150 Landsat scenes of the study area were acquired to map the 168,000 km2 CBW near the beginning and end of the 1988 - 2002 time period. Of these, 40 scenes were fully processed for circa 1990 mapping, including leaf-on and leaf-off data, and 60 scenes capturing Spring, Summer and Fall conditions for circa 2000 mapping (Table 1).
Table 1. Landsat-7 ETM+ imagery.
Approximate Time Period
#TM/ETM+ Scenes
1990 leaf-on 20 1990 leaf-off 20 2000 Spring 20
2000 Summer 20 2000 Fall 20
Total 100
Most TM and ETM+ images were acquired as Level 0 data from the USGS EROS Data Center (EDC) and processed to Level 1G. A configuration of data parameters was used to retain as much of the original geometric and radiometric properties as possible. All scenes were then radiometrically calibrated, converted to top-of-atmosphere reflectance, orthographically rectified using USGS 30m digital elevation data sets, corrected for topographic illumination effects, temporally normalized between scenes, and cloud and shadow masked [1]. A software package was developed for this Landsat data processing, and is now being adapted for general use through the Erdas Imagine image processing package [2].
High-resolution Ikonos satellite imagery were also acquired over an 1800 km2 area, primarily Montgomery county Maryland. These precision georeferenced data sets were acquired through the NASA Scientific Data Purchase program. While potentially useful for algorithm training, these images were used primarily for validation purposes. Very high spatial resolution imagery like Ikonos brings with it a whole new set of issues associated with the resolution of individual scene elements [3], nevertheless the images were successfully classified into tree cover maps, making use of forest cover interpreted from aerial photographs as training data. Accuracy of the decision-tree classification of tree cover was over 97%, as assessed with an independent validation sample of some 600,000 point locations [3].
A sample of digital orthophoto (DOQ) images were also acquired throughout the region for validation across a broad range of conditions. The DOQs were selected using a stratified random sample design, resulting in selection of 24 areas of 25 km2 (5x5 km) that were visually interpreted to produce maps of the built environment (i.e., roof, sidewalk, parking lot, etc.).

3
1.2 Classification Approach
A classification and regression tree approach (CART) [4,5,6] was used to classify the multi-temporal imagery based on the spectral information extracted for areas within the training data sets. The land cover type mapping was done using a classification tree and impervious surface area mapping (ISA, e.g., buildings, roads, parking lots) made use of a regression tree approach. The algorithm, in both cases, searches for a dependent variable that, if used to split a population of pixels into two groups, explains the largest proportion of deviation of the independent variable. At each new split in the tree, the same exercise is conducted and the tree is grown until it reaches terminal nodes, each representing a unique set of image areas that are then assigned a specific class based on the training information. In the case of the regression tree approach a continuous variable is output (e.g. proportion impervious between 0-100%). The two approaches differ primarily in the number of terminal nodes that are produced, and the mode in which the node characteristics are applied to produce output image maps. We have developed software to produce output images compatible with Erdas Imagine from the S-Plus CART statistical software.
red<0.0748062
red>0.0748062
137400/2378602
b4over1<2.03307
b4over1>2.03307
13920/1038871
218/74834
red<0.0689247
red>0.0689247
6475/964041
ndvi<0.5603
ndvi>0.5603
2402/815551
ndvi<0.46298
ndvi>0.46298
647/52751
244/7001
403/45753
red<0.0663515
red>0.0663515
1755/762801
990/618321
765/144482
red<0.0718654
red>0.0718654
4073/148491
nir<0.319194
nir>0.319194
1742/93791
710/33261
1032/60532
nir<0.3127
nir>0.3127
2331/54701
639/13841
1692/40862
ndvi<0.0573518
ndvi>0.0573518
37490/1339732
ndvi<0.0155771
ndvi>0.0155771
771/308224
193/285204
578/23024
red<0.0821582
red>0.0821582
6719/1031512
nir<0.208403
nir>0.208403
2634/117872
295/5044
red<0.0781146
red>0.0781146
2321/112832
1495/46453
ndvi<0.628795
ndvi>0.628795
826/66382
485/48822
341/17563
blue<0.130148
blue>0.130148
4085/913642
red<0.0902454
red>0.0902454
2225/735072
1015/180522
1210/554553
red<0.119286
red>0.11928
1860/178572
552/10513
261/5672
Figure 1. Example decision tree used to classify land cover into a number of terminal nodes (classes) following a series of hierarchical binary splits.

4
2 Land Cover Type Mapping
Land cover was mapped into 16 classes approximating a modified Anderson level-2 hierarchical classification scheme [7]. Over 3800 field sites were sampled for training data, including more than 1400 sites visited by us in the Summers of 2000 and 2001. The remainder of the training data were acquired from a host of collaborators and publicly available data sets. All field data were screened for quality and representation of surrounding land cover / use through application of a 90x90m spatial filter.
The map produced from the classification tree algorithm using the field training data (Figure 1) was an improvement on previous land cover maps of the region, particularly with respect to discrimination between agricultural crops and grassland types. Classification errors were comparable between rates of omission and commission, suggesting no systematic biases in the mapping approach [2].
To evaluate the contribution of multi-temporal information for the classification, three independent decision tree runs were performed for: (i) a single peak growing season date, (ii) leaf on – leaf off dates, (iii) multi-temporal (all available) dates. When compared to the single date imagery alone, incorporation of the multi-temporal data into the analysis improved discrimination of specific classes, particularly those dominated by vegetation. Differences among deciduous, evergreen, and mixed forest types as well as among croplands, pastures, and grasslands were improved over single-date and two-date acquisitions. Discrimination of urban and suburban areas, however, did not significantly benefit from multi-temporal image acquisitions.
2.1 Crop Type Mapping
An agricultural crop type map was produced for the state of Maryland using unsupervised classification and iterative cluster labeling based on detailed field level information. Unique access to field-level crop data collected by the USDA National Agricultural Statistical Service (NASS) was granted for the state of Maryland, allowing us to digitize field boundaries from mylar map overlays. Over 300 individual fields were digitized and multispectral data extracted without reference to proprietary field location information. These data provided a valuable training data source for use in classification of specific crop types. Although double-cropping is common in the mid-Atlantic (typically a 2-year 3-crop rotation), use of multitemporal ETM+ imagery permitted discrimination of these multi-cropped areas. Validation using county aggregated statistics compiled from all NASS field samples (over 1200 locations) suggested accuracies in the range of 90-95% [8]. The Maryland crop type map for year 2000 is available from NASS or UMD upon request.

5
Figure 2a. Chesapeake Bay watershed map of land cover. The watershed boundary is depicted in red, and state boundaries in white. The yellow box outlines an area shown in more detail in Figure 2b.
Figure 2b. Land cover map of CBW showing an enlarged segment of Figure 2a over the Baltimore - Washington, D.C. area.

6
3 Urban / Impervious Area Mapping
Identification of impervious surface areas is important for a number of applications including accurate mapping of urban / suburban / commercial land uses, monitoring changes in these areas through time (i.e., exurban sprawl), and establishing links between the built environment and water quality / stream health. Impervious areas can be relatively easily detected with single-date Landsat imagery, although substrates with similar spectral properties, such as bare soil in agricultural fields, required multitemporal imagery and judicious processing for adequate discrimination (and subsequent removal). Our subpixel estimation of ISA was accomplished with a combination of the Landsat imagery and planimetric data acquired for Montgomery county Maryland. The planimetric data were converted from vector to 3m raster data, and then resampled to 30m spatial resolution while calculating proportional impervious cover for each 900m2 cell. These data provided the basis for training the regression tree algorithm. We note that Ikonos imagery could be used for this same purpose, and we have produced Ikonos impervious surface maps with accuracy comparable to the planimetric data, but because we had the planimetric data available we reserved the Ikonos for independent validation.
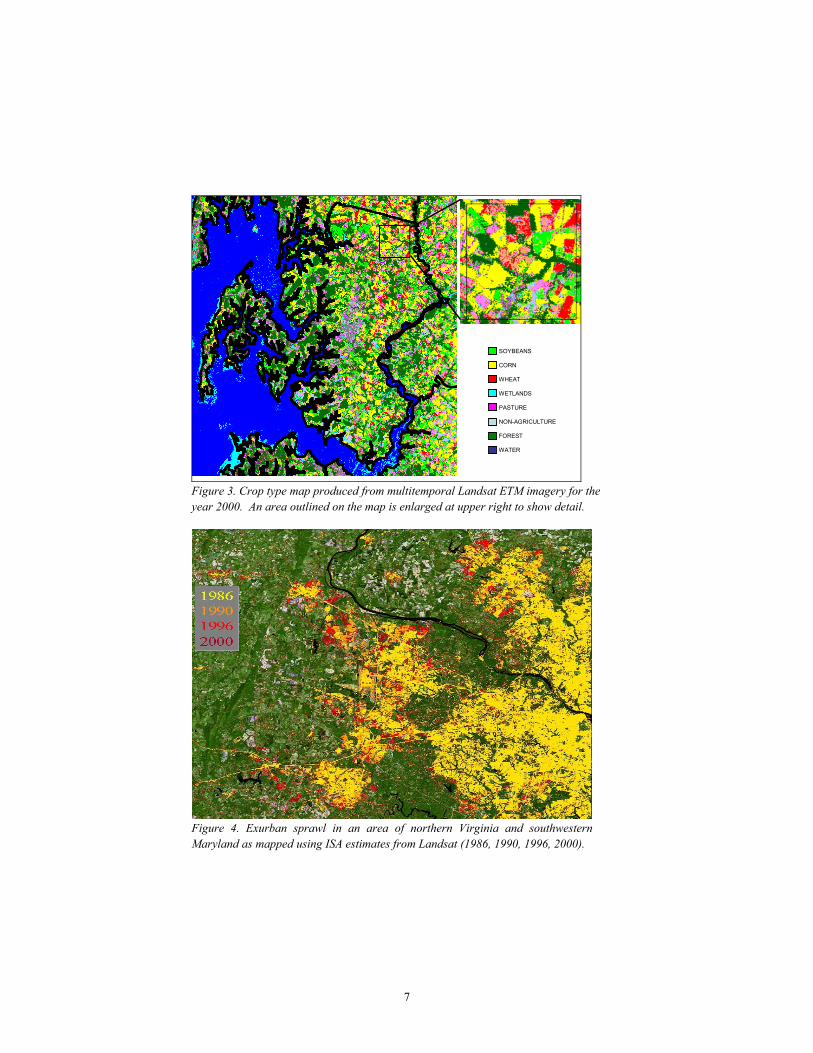
The resulting subpixel Landsat ISA map, as assessed with the Ikonos and DOQ images, had an overall map accuracy of 88%. There was some evidence for systematic commission errors resulting from residual bare or plastic-covered agricultural fields, and beaches [9]. Application of the approach to additional years using leaf-on / off TM imagery produced comparable maps of the Baltimore – Washington DC region for 1986, 1990 and 1996. Specifying developed areas as >10% ISA allowed us to identify areas of change (Figure 4), calculate rates of change through time, and calibrate a spatial predictive model of future land use change under various policy scenarios [10].
4 Conclusion
We have provided an overview of a range of land cover and land use change products developed using multitemporal Landsat image data. The advent of widely available and less expensive Landsat-7 ETM+ has permitted the development of highly accurate land cover map products. Continued availability of comparable data sets will prove invaluable for data continuity and applications to resource management and decision support, with significant societal and economic benefits. Similar advances in very high resolution observational data sets from the commercial sector (e.g., Ikonos and QuickBird) provide valuable synergy with the Landsat data for algorithm development and map product validation.
7
SOYBEANS
CORN
WHEAT
WETLANDS
PASTURE
NON-AGRICULTURE
FOREST
WATER
Figure 3. Crop type map produced from multitemporal Landsat ETM imagery for the year 2000. An area outlined on the map is enlarged at upper right to show detail.
Figure 4. Exurban sprawl in an area of northern Virginia and southwestern Maryland as mapped using ISA estimates from Landsat (1986, 1990, 1996, 2000).

8
Acknowledgments
This work reported here in brief overview was completed as part of the activities of the mid-Atlantic Regional Earth Science Applications Center (RESAC) [11], funded by the NASA Applications Program (NAG1399011) and the US-EPA Chesapeake Bay Program. Additional support for specific aspects of the work were provided by NASA grants NAG1302010 and NAG511149. Further information is available at www.geog.umd.edu/resac.
References
1. Varlyguin, D., R K Wright, S J Goetz, S D Prince (2001). Advances in land cover classification from applications research: a case study from the mid-Atlantic RESAC. Proceedings of the American Society of Photogrammetry and Remote Sensing.
2. Varlyguin, D., S J Goetz, R K Wright (2003). A Landsat data processing software suite designed to operate in the Erdas Imagine environment. Photogrammetic Engineering and Remote Sensing (forthcoming).
3. Goetz, S. J., R. Wright, A. J. Smith, E. Zinecker. 2003. Ikonos imagery for resource management: tree cover, impervious surfaces and riparian buffer analyses in the mid-Atlantic region. Remote Sensing of Environment (in press).
4. Breiman, L., J. Freidman, R. Olshend, and C. Stone (1984). Classification and regression trees. Monterey, CA: Wadsworth.
5. Hansen, M., R. Dubayah, and R.S. DeFries (1996). Classification trees: An alternative to traditional land cover classifiers. International Journal of Remote Sensing, 17(5): 1075-1081.
6. Friedl, M.A. and C.E. Brodley (1997). Decision tree classification of land cover from remotely sensed data. Remote Sensing of Environment, 61(3): 399-409.
7. Anderson, J.R., E. Hardy, J. Roach, and R. Witmer (1976). A land use and land cover classification system for use with remote sensor data. U.S. Geological Survey Profession Paper, 964. Washington, DC. 24 p.
8. Tringe, J., S.J. Goetz, M. Craig (2003). Crop type mapping in the mid-Atlantic region using NASS field statisitics and multi-temporal Landsat imagery. Photogrammetic Engineering and Remote Sensing (forthcoming).
9. Smith, A. J., S. J. Goetz, S. D. Prince, R. Wright, B. Melchoir, E. M. Mazzacato, and C. Jantz. 2003. Estimation of sub-pixel impervious surface area using a decision tree approach, Ikonos and Landsat imagery. Remote Sensing of Environment (forthcoming).
10. Jantz, C.J, S J Goetz, A.J. Smith, M. Shelly (2003). Using the SLEUTH Urban Growth Model to Simulate the Impacts of Future Policy Scenarios on Land Use in the Baltimore-Washington Metropolitan Area, Environment and Planning (B) (in press).
11. Goetz, S.J., S.P. Prince, M.M. Thawley, A.J. Smith, and R. Wright (2000). The Mid-Atlantic Regional Earth Science Applications Center (RESAC): an overview. Available at www.geog.umd.edu/resac and on ASPRS CD-ROM, American Society for Photogrammetry and Remote Sensing (ASPRS) Conference Proceedings, Washington DC.