Embed Size (px)
Citation preview
Application of GPS data on Severe Weather Forecasting
To investigate correlation between PWV and VIL, and hence its role in lightning/damaging winds monitoring/nowcasting
Summer Internship at the Hong Kong Observatory 2006
Law Ka Hei (CUHK/PHY/3)
Supervisor: Linus Yeung
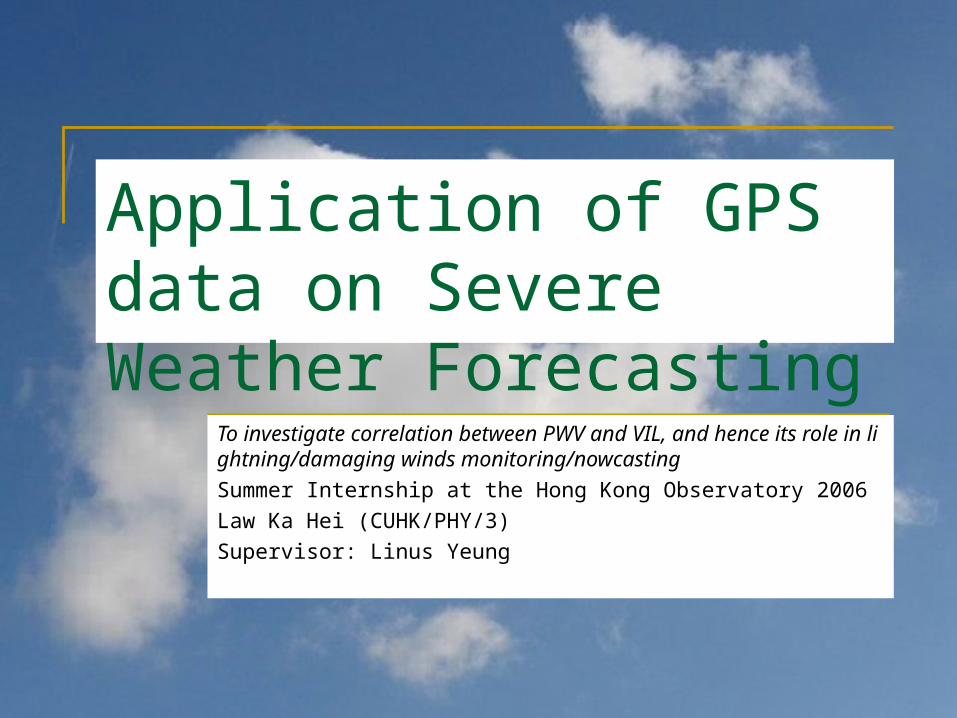
Motivation
Project Goal Use PWV for severe weather nowcasting
PWV - Precipitable Water Vapor Represent amount of water vapor in an atmospher
ic column VIL - Vertically Integrated Liquid
Represent amount of liquid water in an atmospheric column
Highly related to rainfall
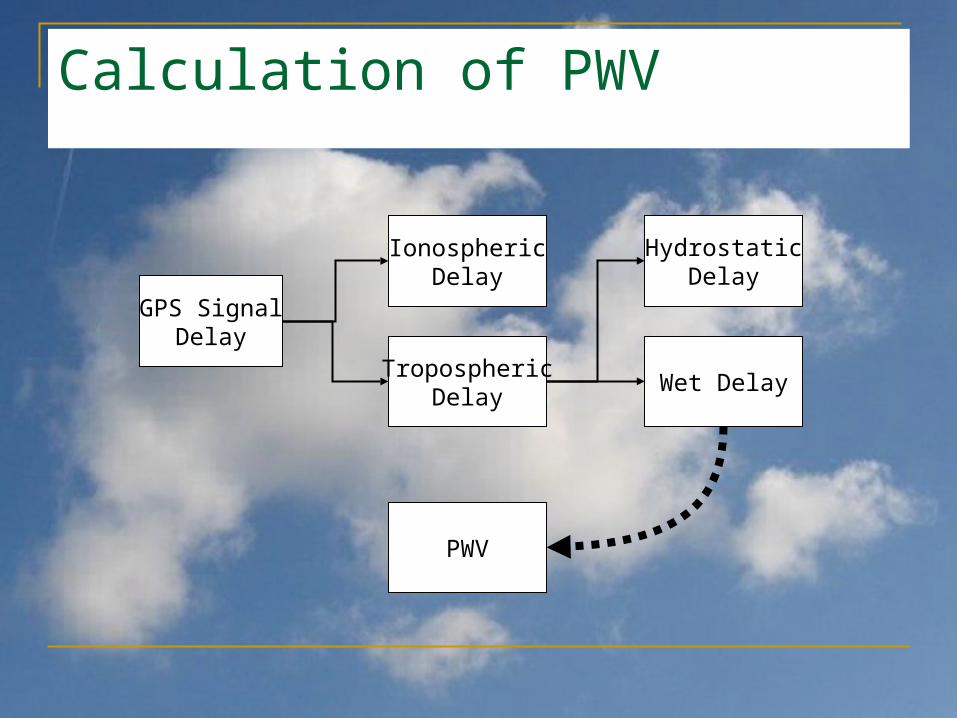
Calculation of PWV
GPS SignalDelay
IonosphericDelay
TroposphericDelay
HydrostaticDelay
Wet Delay
PWV
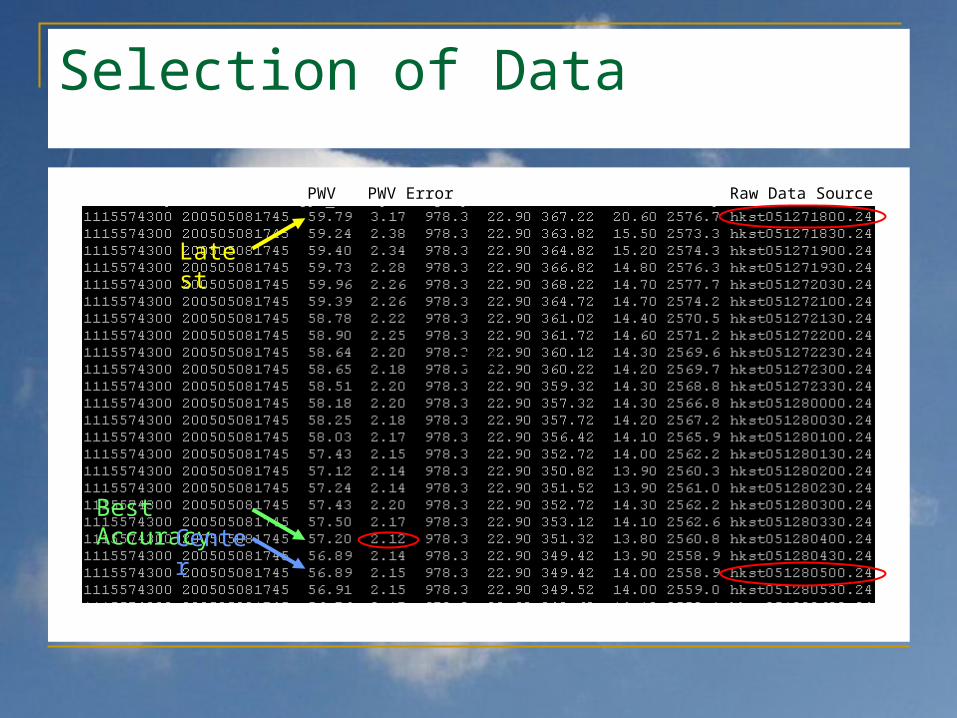
Selection of Data
PWV PWV Error Raw Data Source
Latest
Best AccuracyCenter
04a
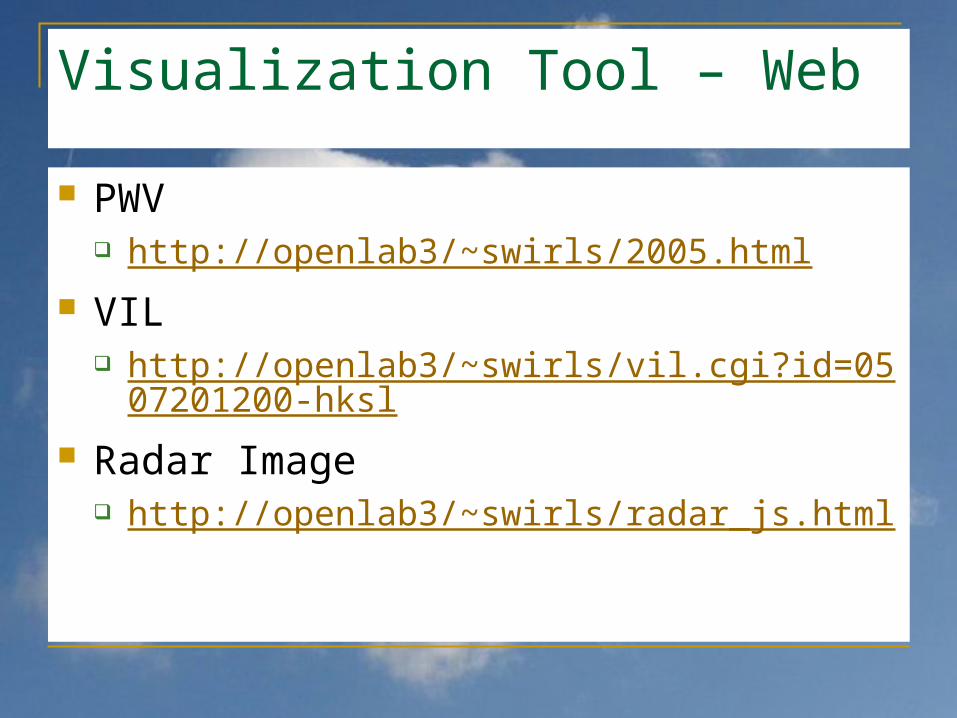
Visualization Tool – Web
PWV http://openlab3/~swirls/2005.html
VIL http://openlab3/~swirls/vil.cgi?id=0507201200-hks
l Radar Image
http://openlab3/~swirls/radar_js.html
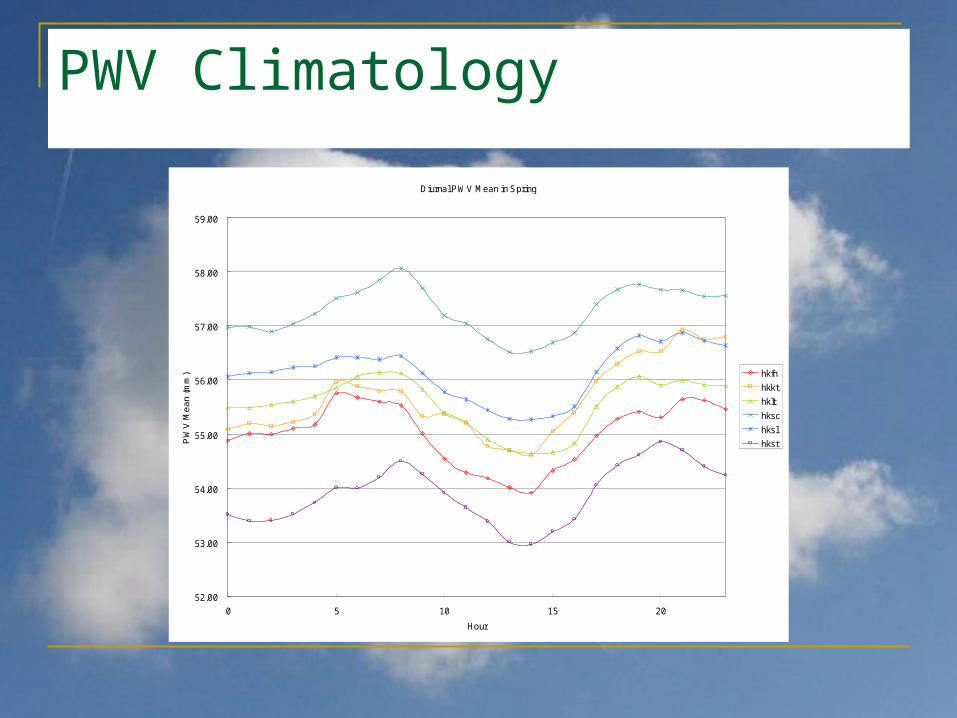
PWV Climatology
Diurnal PWV Mean in Spring
52.00
53.00
54.00
55.00
56.00
57.00
58.00
59.00
0 5 10 15 20
Hour
PW
V M
ea
n (
mm
) hkfn
hkkt
hklt
hksc
hksl
hkst
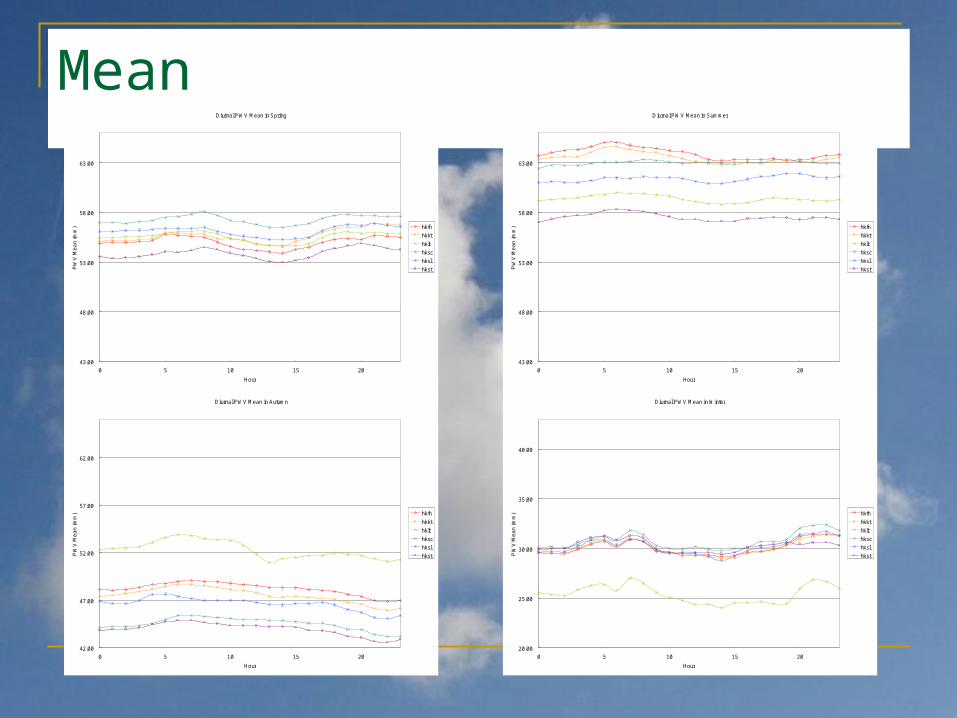
MeanDiurnal PWV Mean in Summer
43.00
48.00
53.00
58.00
63.00
0 5 10 15 20
Hour
PW
V M
ean
(mm
) hkfn
hkkt
hklt
hksc
hksl
hkst
Diurnal PWV Mean in Autumn
42.00
47.00
52.00
57.00
62.00
0 5 10 15 20
Hour
PW
V M
ean
(mm
) hkfn
hkkt
hklt
hksc
hksl
hkst
Diurnal PWV Mean in Winter
20.00
25.00
30.00
35.00
40.00
0 5 10 15 20
Hour
PW
V M
ean
(mm
) hkfn
hkkt
hklt
hksc
hksl
hkst
Diurnal PWV Mean in Spring
43.00
48.00
53.00
58.00
63.00
0 5 10 15 20
Hour
PW
V M
ean
(mm
) hkfn
hkkt
hklt
hksc
hksl
hkst
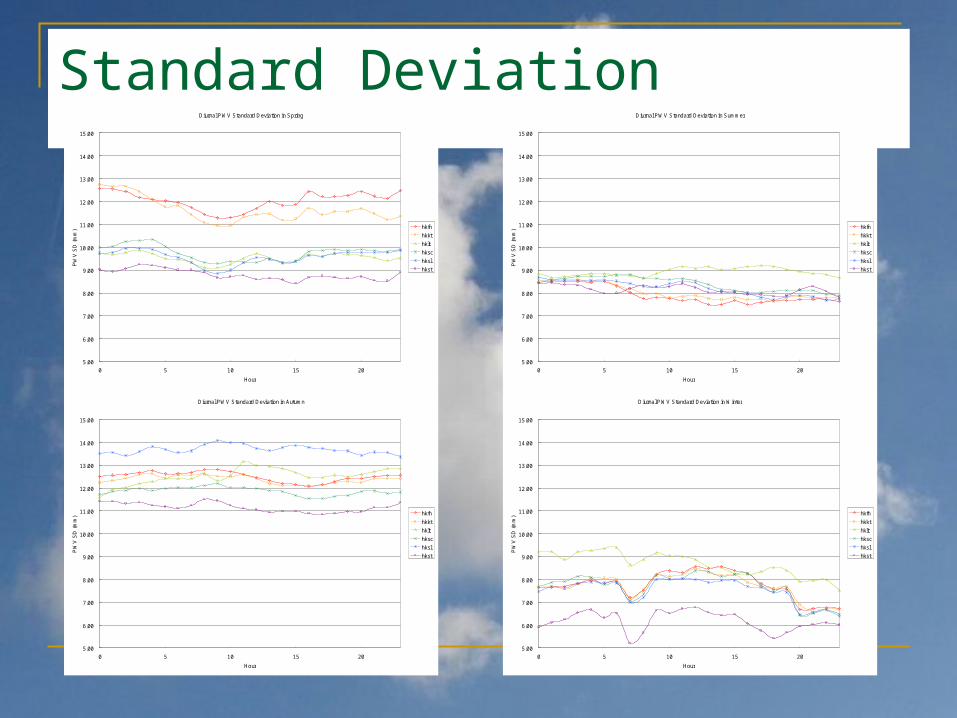
Standard DeviationDiurnal PWV Standard Deviation in Summer
5.00
6.00
7.00
8.00
9.00
10.00
11.00
12.00
13.00
14.00
15.00
0 5 10 15 20
Hour
PW
V S
D (m
m)
hkfn
hkkt
hklt
hksc
hksl
hkst
Diurnal PWV Standard Deviation in Winter
5.00
6.00
7.00
8.00
9.00
10.00
11.00
12.00
13.00
14.00
15.00
0 5 10 15 20
Hour
PW
V S
D (m
m)
hkfn
hkkt
hklt
hksc
hksl
hkst
Diurnal PWV Standard Deviation in Spring
5.00
6.00
7.00
8.00
9.00
10.00
11.00
12.00
13.00
14.00
15.00
0 5 10 15 20
Hour
PW
V S
D (m
m)
hkfn
hkkt
hklt
hksc
hksl
hkst
Diurnal PWV Standard Deviation in Autumn
5.00
6.00
7.00
8.00
9.00
10.00
11.00
12.00
13.00
14.00
15.00
0 5 10 15 20
Hour
PW
V S
D (m
m)
hkfn
hkkt
hklt
hksc
hksl
hkst
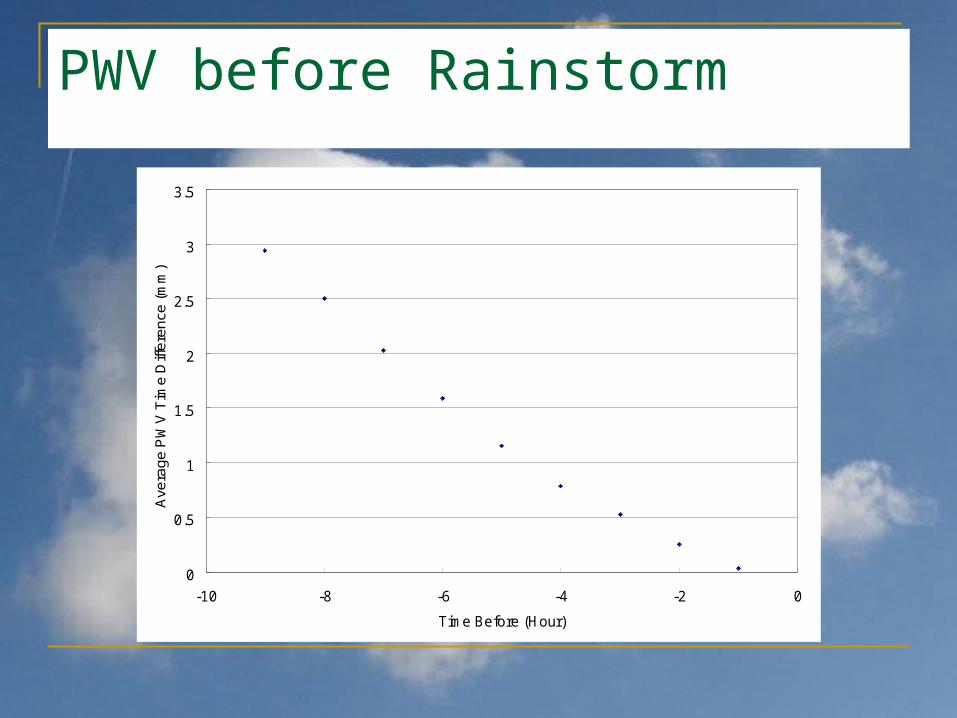
PWV before Rainstorm
0
0.5
1
1.5
2
2.5
3
3.5
-10 -8 -6 -4 -2 0
Time Before (Hour)
Ave
rag
e P
WV
Tim
e D
iffe
ren
ce (
mm
)
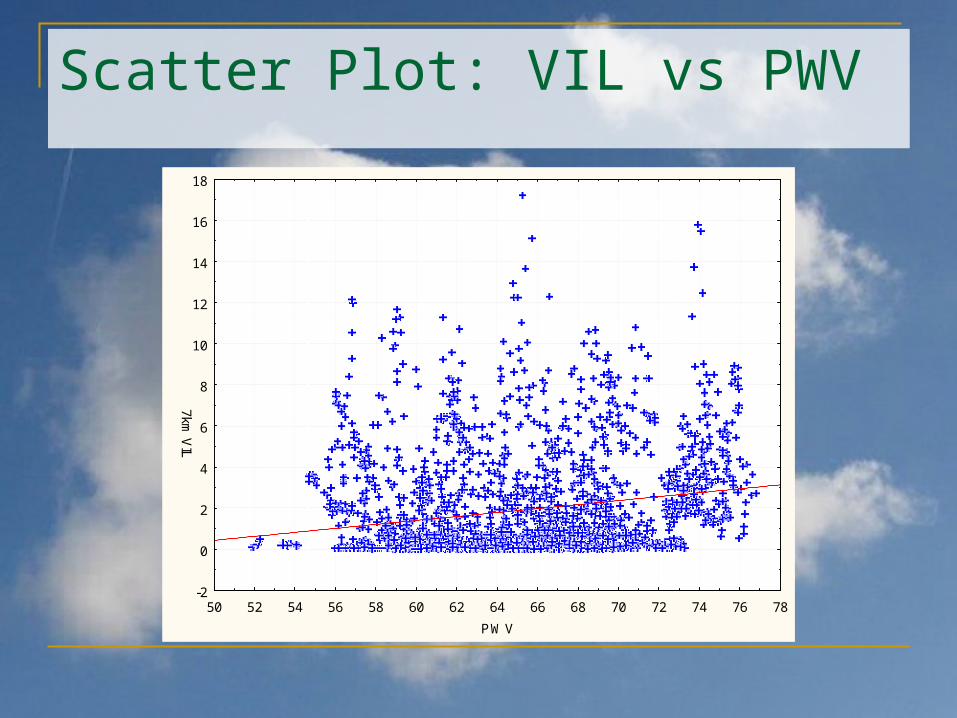
Scatter Plot: VIL vs PWV
50 52 54 56 58 60 62 64 66 68 70 72 74 76 78
PWV
-2
0
2
4
6
8
10
12
14
16
18
7km V
IL
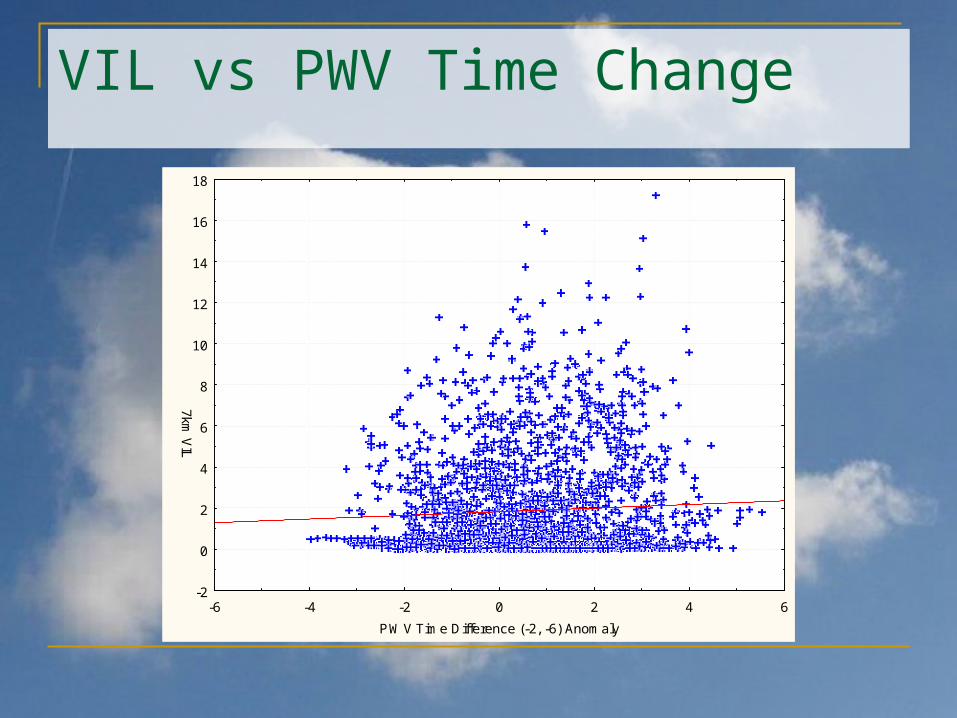
VIL vs PWV Time Change
-6 -4 -2 0 2 4 6
PWV Time Difference (-2, -6) Anomaly
-2
0
2
4
6
8
10
12
14
16
18
7km V
IL

VIL vs PWV Time Change
-5 -4 -3 -2 -1 0 1 2 3 4 5 6
PWV Time Difference (-8, -15) Anomaly
-2
0
2
4
6
8
10
12
14
16
18
7km V
IL

Thank You
Any Questions?