Embed Size (px)
Citation preview

Rusty ThomasCIIT Centers for Health ResearchSOT Colgate Palmolive Lecture
San Diego, 2006
Application of Genomic Technology
to ToxicologyIdentifying Predictive Biomarkers and Assessing the
Impact of Chemicals on Cell Signaling Networks
CIITCenters For Health Research
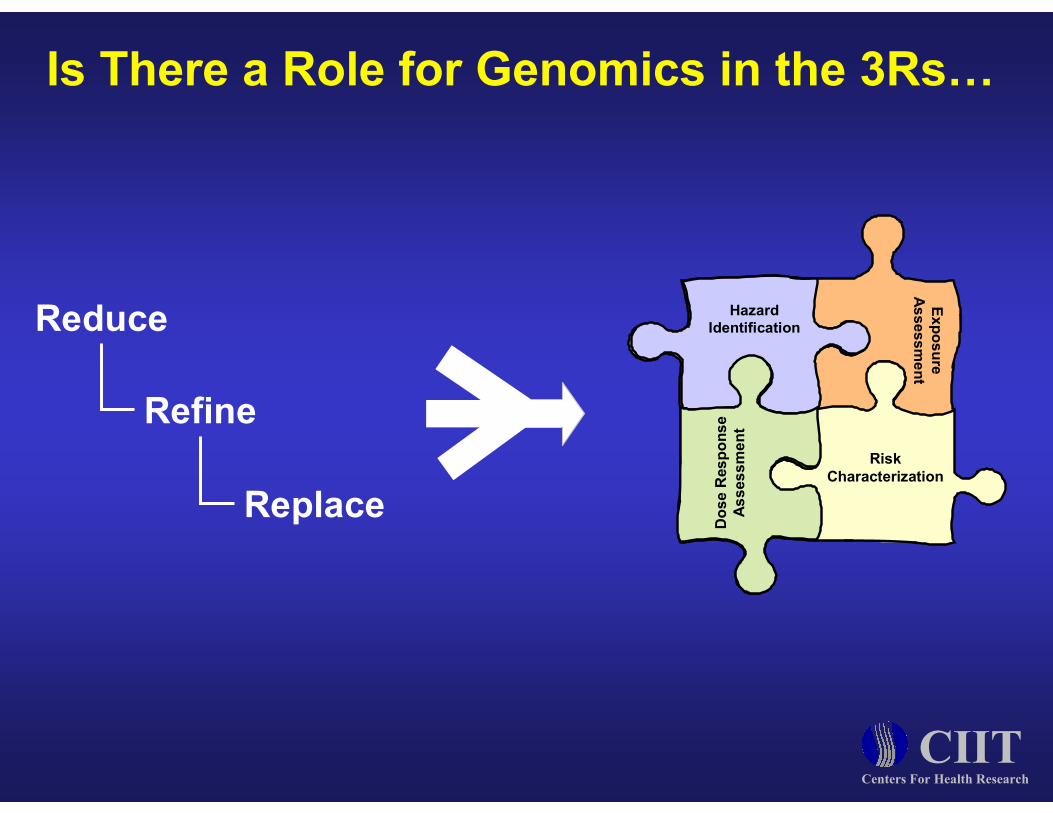
Is There a Role for Genomics in the 3Rs…
CIITCenters For Health Research
Hazard
Identification
Dose Response
Assessment
Risk
Characterization
Exposure
Assessment
Reduce
Refine
Replace
Hazard
Identification
Dose Response
Assessment

Is There a Role for Genomics in the 3Rs…
CIITCenters For Health Research
Hazard
Identification
Dose Response
Assessment
Application of Genomic and Metabonomic Technology to
Identify Biomarkers Predictive of Rodent Cancer
Bioassay
Application of High-Coverage Functional Genomic
Screens to Dissect Cell Signaling Networks

Application of Genomics to Hazard ID
• Two-year rodent bioassays play a central role in evaluating both the carcinogenic potential of a chemical and generating quantitative information on the dose-response behavior for chemical risk assessments.
• Due to the resource-intensive nature of these studies, each bioassay costs $2 to $4 million and takes over three years to complete.
• Since its inception in 1978, the number of chemicals currently tested by the National Toxicology Program (NTP) stands at 530 in long-term studies and 70 in short-term tests.
• Currently, there are approximately 80,000 chemicals registered for commercial use in the United States with 2,000 more added each year.
Background and Significance

CIITCenters For Health Research
Experimental Flow Chart
Chemicals Previously Tested in
Rodent Two-Year Bioassay
Positive for Tumors Negative for Tumors
Subchronic Exposure
Identify Biomarkers
Transcriptomics Metabonomics Proteomics
Validate Biomarkers
Construct Statistical Models

Experimental Design
Feed(FCON)
GavageCorn oil(CCON)
Negative8,187 ppmFeed-Pentachloronitrobenzene(PCNB)
Negative2,000 ppmFeed+
N-(1-naphthyl)ethylenediamine dihydrochloride (NEDD)
Positive240 mg/kgGavage-Benzofuran(BFUR)
Positive2,000 ppmFeed+1,5-Naphthalenediamine (NAPD)
NTP Designation
MTDDose
Exposure Route
GeneticToxChemical

Experimental Design

Experimental Results
CCON FCON NEDD PCNB NAPD BFUR CCON FCON NEDD PCNB NAPD BFUR
CARCNONCARC CARCNONCARC
Liver Gene ExpressionLung Gene Expression
CCON FCON NEDD PCNB NAPD BFUR
CARCNONCARC
Urinary Metabolites

CIITCenters For Health Research
Experimental Results
CCON FCON NEDD PCNB NAPD BFUR10
100
1000
E130013N09Rik
Normalized Expression
CARCNONCARC
Lung
Liver
CARCNONCARC
CCON FCON NEDD PCNB NAPD BFUR0
200
400
600
800
1000
1200
1400
Normalized Expression Ces1

CIITCenters For Health Research
Experimental Results
CCON FCON NEDD PCNB NAPD BFUR0
10
20
30
40
Fold Change in
Gene Expression
CARCNONCARC
Ces1
CCON FCON NEDD PCNB NAPD BFUR0
10
20
30
40
50
Fold Change in
Gene Expression
E130013N09Rik
CARCNONCARC
A.
B.
qRT-PCR Confirmation

• Statistical classification analysis of gene expression data in both the lung and liver samples exhibited 100% predictive accuracy based on three-fold cross-validation.
• Statistical classification analysis of urinary metabolites exhibited 88% predictive accuracy based on three-fold cross-validation.
• The two carcinogenic chemicals used in the study showed common changes despite different chemical structures, genotoxicity categories, and potential modes-of-action.
CIITCenters For Health Research
Application of Genomics to Hazard IDResults and Conclusions

Is There a Role for Genomics in the 3Rs…
CIITCenters For Health Research
Hazard
Identification
Dose Response
Assessment
Application of Genomic and Metabonomic Technology to
Identify Biomarkers Predictive of Rodent Cancer
Bioassay
Application of High-Coverage Functional Genomic
Screens to Dissect Cell Signaling Networks

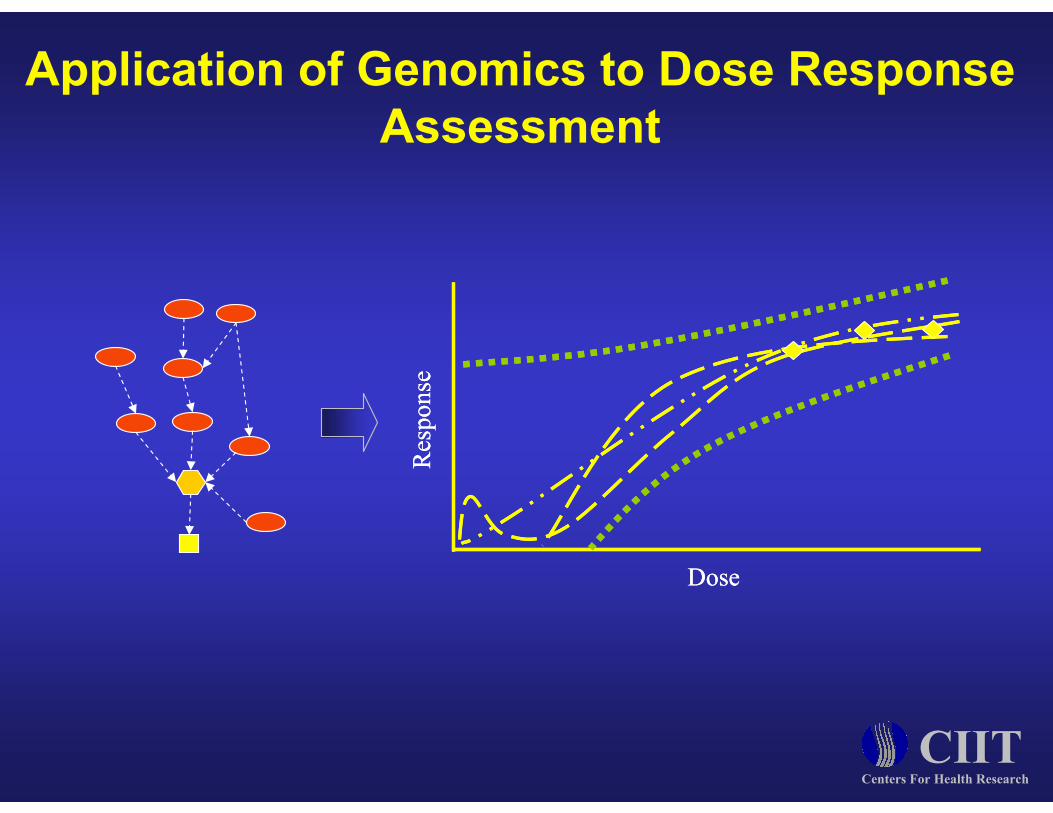
Application of Genomics to Dose Response
Assessment
CIITCenters For Health Research
Lessons from the Industrial Revolution…

Application of Genomics to Dose Response
Assessment
A fundamental understanding of the underlying biology will provide…
– potential molecular targets involved
– logic of the signaling network
– shape of the dose response curve
– how well this response is conserved across species
CIITCenters For Health Research

Examples With Drosophila and MAPK
Signaling
Albert R, Othmer HG. J Theor Biol. 223:1-18, 2003.
Boolean Model of Drosophila Segment
Polarity Gene Expression ODE Model of PDGF Stimulated MAPK
Activation
Increasing
PDGF
Stimulus
Input
Pulse
Growth factor
MAPKKK
MAPKK
MAPKPLA2
AA
PKC
PLA2
AA
PKC
MKPMKP
Bhalla, US et al. Science. 297:1018, 2002. Conolly and Zhang, unpublished data.
CIITCenters For Health Research
Application of Genomics to Dose Response
Assessment
Response
Dose
Response
Dose
CIITCenters For Health Research

How Do We Implement a Functional Genomics
Approach to Dissect These Networks?
CIITCenters For Health Research
Assemble the “Parts List”
Identify How the Pieces Fit Together in Each Subsystem
Understand How the Subsystems Interconnect

How Do We Implement a Functional Genomics
Approach to Dissect These Networks?
CIITCenters For Health Research
Assemble the “Parts List”
Identify How the Pieces Fit Together in Each Subsystem
Understand How the Subsystems Interconnect

Assembling the “Parts List”
Cellular Assay
(Promoter/RE Reporter)Gain of function
Full-length Genes
Stimulus + Full-length
Genes or siRNAs
Loss of function
Two “Functional” Approaches
CIITCenters For Health Research
Anatomy of a Screen: Constructing The Assay

PP
PP
PP
PPPP
PP
Assembling the “Parts List”
Arrayed, full-length gene or
siRNA set in 384-well plates
Gene1 Gene2 Gene3
Gene4 Gene5 Gene6
Transfect genes into
reporter cells Identify hits
Identify components of the
signaling pathway
Anatomy of a Screen

Assembling the “Parts List”Anatomy of a Screen
Movie Showing Robotic
Preparation of Full-length cDNA
library

Assembling the “Parts List”Anatomy of a Screen
Movie Showing Robotic
Screening of Full-length cDNA
library

Preliminary ResultsNFkB Gain-of-Function and Loss-of-Function Screens
Screen Type: Full-length Gene Gain-of-Function
Genes Screened: ~14,000
Screen Type: Full-length GeneLoss-of-Function
Genes Screened: ~14,000
IL-1 TNFα
75 110 61
0
2000
4000
6000
8000
10000
12000
14000
1 2 3 5 10 15 25 50 100 More
Fold Induction
Frequency
86.00%
88.00%
90.00%
92.00%
94.00%
96.00%
98.00%
100.00%
102.00%
Cumulative %

How Do We Implement a Functional Genomics
Approach to Dissect These Networks?
CIITCenters For Health Research
Assemble the “Parts List”
Identify How the Pieces Fit Together in Each Subsystem
Understand How the Subsystems Interconnect

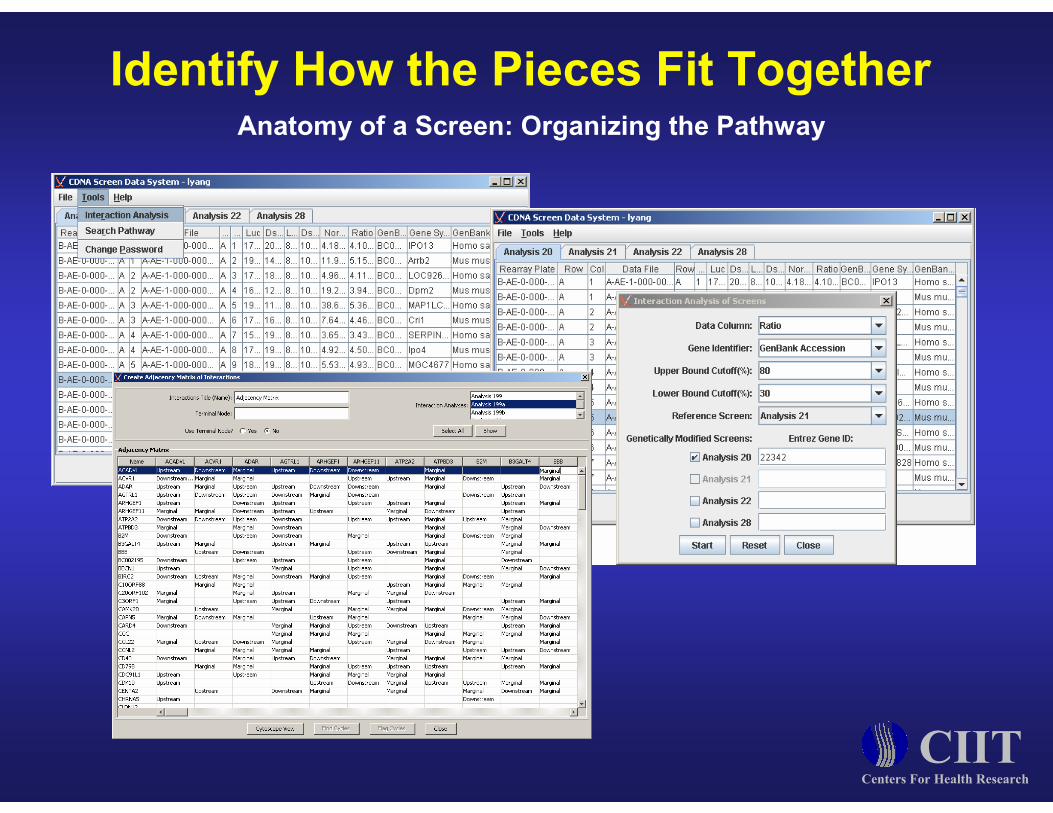
Identify How the Pieces Fit TogetherAnatomy of a Screen: Organizing the Pathway
PP
PP
PP
PP
RNAi Knockdownor
Dominant Negative
Reduced or NoReporter Activity
TTTT
cDNAExpression
PP
P P
PP
PP
PP
ReporterActivity
TTTT
cDNAExpression
RNAi Knockdownor
Dominant Negative

Identify How the Pieces Fit TogetherAnatomy of a Screen: Organizing the Pathway
CIITCenters For Health Research
TRAF2 IKK 1
TRAF2 NFKB 1
NFKB IKK -1
TNF TRAF2 1
TNF IKK 1
NFKB TNF -1
TRAF2 IKK 1
NFKB IKK -1
TNF IKK 1
IKK TRAF2 -1
NFKB TRAF2 -1
TNF TRAF2 1
Individual Screen Matrices Combined Matrix Functional Network
TNF
TRAF2
IKK
NFkB
Identify How the Pieces Fit TogetherAnatomy of a Screen: Organizing the Pathway
CIITCenters For Health Research

Preliminary ResultsFunctional Network Map

Preliminary ResultsTissue Specific Networks
NFkB
Functional
Hits
Intensity is
the
expression
of that gene
in the tissue
(i.e., is it
there?)
79 Human Tissues
*Based on expression data in www.symatlas.org
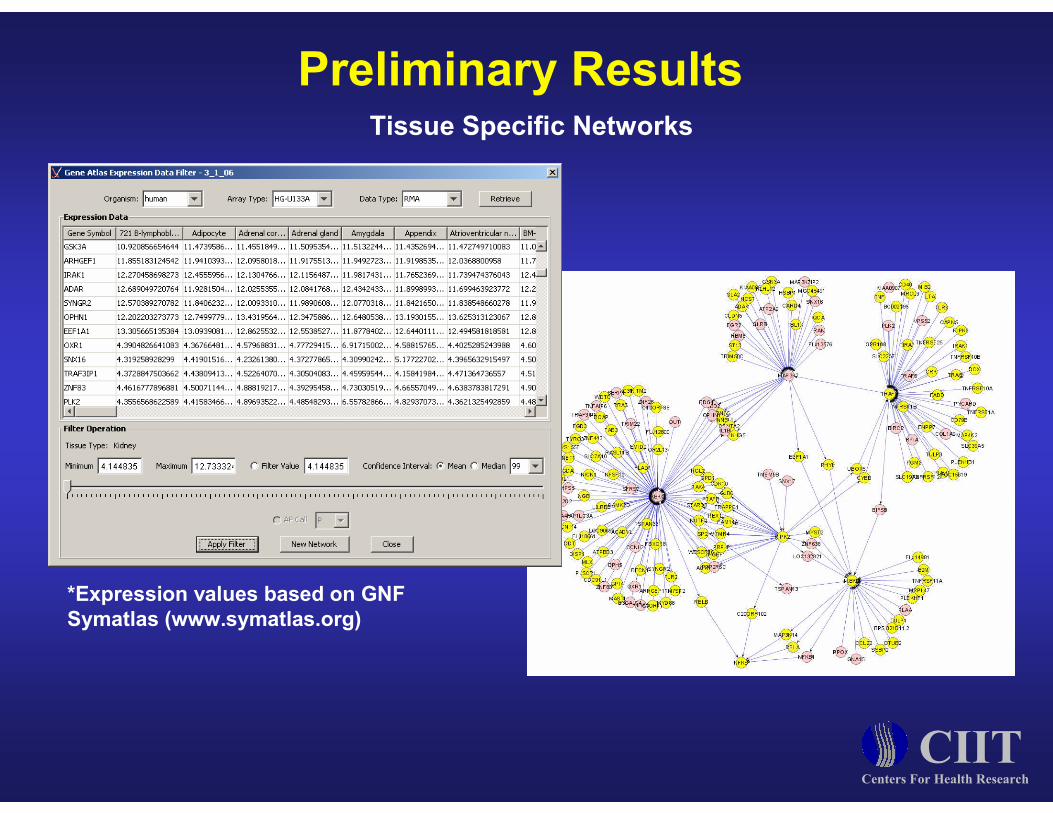
Preliminary ResultsTissue Specific Networks
CIITCenters For Health Research
*Expression values based on GNF
Symatlas (www.symatlas.org)

How Do We Implement a Functional Genomics
Approach to Dissect These Networks?
CIITCenters For Health Research
Assemble the “Parts List”
Identify How the Pieces Fit Together in Each Subsystem
Understand How the Subsystems Interconnect

PP
P P
PP
PPP
P
Upstream Cellular Signaling
Pathway
CIITCenters For Health Research
Primary Expression
Changes
Transcriptional
Alterations
Secondary Expression
Changes
Tertiary Expression
Changes
Understanding How the Subsystems
Interconnect

Understanding How the Subsystems
Interconnect
CIITCenters For Health Research
HSPs
HSF1
Inactive
State
STRESS
Cytoplasm
Nucleus
Denatured
Proteins
Free HSF1
Homotrimers
HSE
Heat Shock Induced
Transcription
Example with the Stress Response Network

Understanding How the Subsystems
InterconnectHSF1 mRNA
siHSF1 #1
HSF1 mRNA
siHSF1 #2 US HS US HS US HS
siHSF1#1 siHSF1#2 siLuc
HSF1 Protein
CIITCenters For Health Research
US siLuc
HS siLuc
US
siHSF1
#1HS
siHSF1
#1
0.0
0.5
1.0
1.5
2.0
2.5
Gene Expression
(Relative to US siLUC)
1.0
0.15 0.09
**
1.89
US siLuc
HS siLuc
US siHSF1
#2HS siHSF1
#2
0.00
0.25
0.50
0.75
1.00
Gene Expression
(Relative to US siLuc)
1.00.89
0.07 0.05
* *

Understanding How the Subsystems
Interconnect
CIITCenters For Health Research
>8 <-8 Fold
Change
Positive HSF1 regulation
Negative HSF1 regulation
No Regulation
4 12 -2 -4Time
(hrs)0.5 2 4 0.5 2 4
200664_s_at DNAJB1
200666_s_at DNAJB1200800_s_at HSPA1A
202581_at HSPA1B117_at HSPA6213418_at HSPA6
204420_at FOSL1
214315_x_at CALR203239_s_at CNOT3210317_s_at YWAHE212553_at KIAA0460218251_at MID1IP1
204494_s_at DKFZP434H132204693_at CDC42EP1206724_at CBX4213038_at IRBDC336564_at IRBDC3203254_s_at TLN1209344_at TPM4211965_at ZFP36L137462_i_at SF3A2
210996_s_at YWHAE209381_x_at SF3A2220748_s_at ZNF580218887_at MRPL2218010_x_at C20orf149
218607_s_at SDAD1
210346_s_at CLK4
214683_s_at CLK1
0.5 2 4
Understanding How the Subsystems
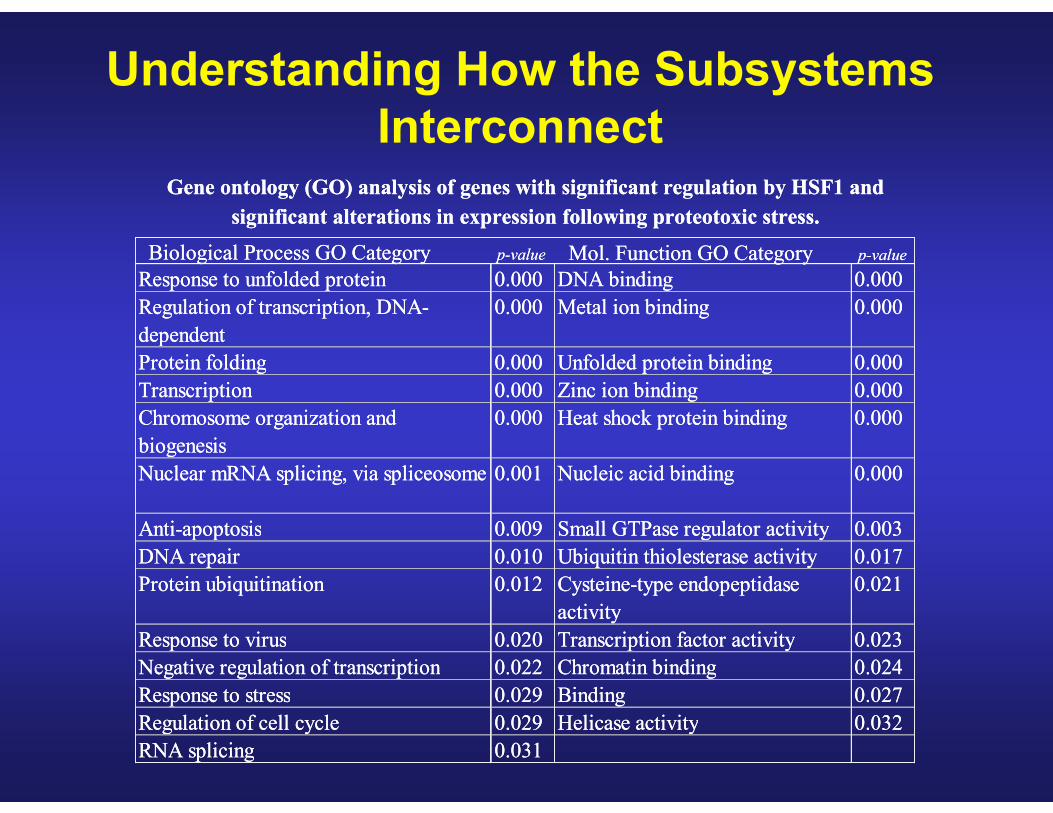
InterconnectGene ontology (GO) analysis of genes with significant regulation by HSF1 and
significant alterations in expression following proteotoxic stress.
Response to unfolded protein 0.000 DNA binding 0.000
Regulation of transcription, DNA-
dependent
0.000 Metal ion binding 0.000
Protein folding 0.000 Unfolded protein binding 0.000
Transcription 0.000 Zinc ion binding 0.000
Chromosome organization and
biogenesis
0.000 Heat shock protein binding 0.000
Nuclear mRNA splicing, via spliceosome 0.001 Nucleic acid binding 0.000
Anti-apoptosis 0.009 Small GTPase regulator activity 0.003
DNA repair 0.010 Ubiquitin thiolesterase activity 0.017
Protein ubiquitination 0.012 Cysteine-type endopeptidase
activity
0.021
Response to virus 0.020 Transcription factor activity 0.023
Negative regulation of transcription 0.022 Chromatin binding 0.024
Response to stress 0.029 Binding 0.027
Regulation of cell cycle 0.029 Helicase activity 0.032
RNA splicing 0.031
Biological Process GO Category Mol. Function GO Category p-valuep-value
Gene ontology (GO) analysis of genes with significant regulation by HSF1 and
significant alterations in expression following proteotoxic stress.
Response to unfolded protein 0.000 DNA binding 0.000
Regulation of transcription, DNA-
dependent
0.000 Metal ion binding 0.000
Protein folding 0.000 Unfolded protein binding 0.000
Transcription 0.000 Zinc ion binding 0.000
Chromosome organization and
biogenesis
0.000 Heat shock protein binding 0.000
Nuclear mRNA splicing, via spliceosome 0.001 Nucleic acid binding 0.000
Anti-apoptosis 0.009 Small GTPase regulator activity 0.003
DNA repair 0.010 Ubiquitin thiolesterase activity 0.017
Protein ubiquitination 0.012 Cysteine-type endopeptidase
activity
0.021
Response to virus 0.020 Transcription factor activity 0.023
Negative regulation of transcription 0.022 Chromatin binding 0.024
Response to stress 0.029 Binding 0.027
Regulation of cell cycle 0.029 Helicase activity 0.032
RNA splicing 0.031
Biological Process GO Category Mol. Function GO Category p-valuep-value

Understanding How the Subsystems
Interconnect
-2
-1
0
1
2
3
4
5
6
7
8
0 0.5 1 1.5 2 2.5 3 3.5 4 4.5
Time (h)
Log2 Gene Expression Ratio
Protein Folding
GO:0006457
-1.5
-1
-0.5
0
0.5
1
1.5
2
2.5
0 0.5 1 1.5 2 2.5 3 3.5 4 4.5
Time (h)
Log2 Gene Expression Ratio
Anti-apoptosis
GO:0006916
-2.5
-2
-1.5
-1
-0.5
0
0.5
0 0.5 1 1.5 2 2.5 3 3.5 4 4.5
Time (h)
Log2 Gene Expression Ratio
DNA Repair
GO:0006281
-3
-2.5
-2
-1.5
-1
-0.5
0
0.5
1
1.5
0 0.5 1 1.5 2 2.5 3 3.5 4 4.5
Time (h)
Log2 Gene Expression Ratio
Nuclear mRNA Splicing
GO:0000398

The Ultimate Goal
CIITCenters For Health Research
Apply Genomic Tools in an Integrated Approach
Response
Dose
Response
Dose
Hazard

The Ultimate Goal
CIITCenters For Health Research
Apply Genomic Tools in an Integrated Approach
Response
Dose
Response
Dose
Hazard

Acknowledgements
• PostdocsTom Halsey
American Chemistry CouncilTodd Page
• Research AssociatesLinda PlutaDana Stanley
• Funding
Longlong Yang• Bioinformatics
CIITCenters For Health Research
NIEHS
John Hogenesch (Scripps)• Collaborators
John Walker (GNF)
Russ Wolfinger (SAS)
• Senior ManagementWilliam GreenleeDave Dorman
Mel Andersen
Jeff MacDonald (UNC)
Tom Kodadek (UTSMS)
Devanjan Sikder (UTSMS)


![[Toxicology] toxicology introduction](https://img.pdfslide.us/doc/110x75/55c46616bb61ebb3478b4643/toxicology-toxicology-introduction.jpg)