Embed Size (px)
Citation preview
ti.S Department ofVeterans Affairs
Journal of Rehabilitation Research andDevelopment Vol . 35 No. 1, January 1998Pages 91-107
CLINICAL REPORT
Application of Fuzzy Logic Techniques for the QualitativeInterpretation of Preferences in a Collective Questionnaire forUsers of WheelchairsRuben Lafuente, MS ; Alvaro Page, PhD; Javier Sanchez-Lacuesta, MS; Lourdes Tortosa, MDInstitute of Biomechanics of Valencia (IBV) 46980-Paterna, Valencia, Spain
Abstract—Active participation of users in the evaluation oftechnical aids is essential, since they are part of the interfacewith the system and constitute a fundamental source of designcriteria . In this study, 88 active users of wheelchairs wereinterviewed by means of a written questionnaire about theiropinion concerning the adaptation of hislher wheelchair to theoffice workplace . A conceptual framework was introducedlinking objective measurements of the user-wheelchair inter-face to the subjective preferences expressed by the user.Discriminant analysis was used in order to select and quantifythe importance of the most significant factors influencing theuser's opinions . Fuzzy logic was introduced for the qualita-tive interpretation of the relationship between those signifi-cant factors, based on an inductive algorithm for generatingfuzzy rules . Fuzzy logic enables a person to model theuncertainty within the subjective formulation of knowledge oropinions . From the results, a mismatch between actualperformance of conventional wheelchairs and requirements ofoffice work became evident. The proposed methods make itpossible to determine reliable rules explaining subjectivepreferences ; thus, they provide a flexible means of interpret-ing user questionnaires and obtaining new design criteria.
Key words : fuzzy logic, qualitative models, questionnaires,wheelchair design.
This material is based upon work supported by the National Institute ofSocial Services of Spain (INSERSO) and Research and DevelopmentPrograms of the Institute for Medium and Small Industries of Valencia(IMPIVA).Address all correspondence and requests for reprints to : Ruben Lafuente, MS,Institute of Biomechanics of Valencia (IBV), P .O . Box 199, 46980-Paterna,Valencia, Spain .
INTRODUCTION
The common interest in design enhancement oftechnical aids for persons with disabilities, aiming atimproving product quality and user level of satisfaction,has led to the development of new evaluation tech-niques . As an illustration, considerable efforts havebeen devoted to the area of the technical assessment ofwheelchairs . Technical standards have been developedsince the mid-1960s due to the concern of consumers,manufacturers, and governments for the safety andavailability of quality products (1), resulting in a set ofwheelchair standards approved by several organizations(ISO, CEN, ANSIIRESNA, and so forth) . Variousprojects have also been undertaken focusing on theergonomics of wheelchair driving (2), as well as on theset-up of a methodology for consumer evaluation ofwheelchairs (3).
Objective evaluation is primarily based on criteriaestablished from domain experts and knowledge ac-quired from controlled experiences . Laboratory experi-ments are an important source of information, but theyare costly due to the instrumentation needed, and aresometimes inaccurate because of the limited number oftest subjects and the difficulty of simulating realconditions . Furthermore, assessment criteria cannot beoptimized, or sometimes even discovered, without theparticipation of users encouraging the detection ofdesign faults and the proposal of new solutions (4) . The
91
92
Journal of Rehabilitation Research and Development Vol . 35 No. 1 1998
same idea appears in the conclusion of a recent studyfunded by the European Community addressing thedevelopment of technological tools and applications forpeople with disabilities and older people (the HEARTproject) : "the need for user representatives to beinvolved in all instances where issues on disability aretreated, in order to influence policies and programmes,such as creating methods for user feed-back on productdevelopment" (5).
Consequently, alternative approaches employinguser surveys may be a proper means to tackle thisproblem. A typical measurement tool for subjectiveassessment in field analyses is a written or oralquestionnaire, in which the preferences of the users,regarding several ergonomic and design topics of thetechnical aid, are studied . Current methods of interpreta-tion are based mainly on descriptive statistics, such astables of contingency, means, variances, and so forth.When the aim is to simultaneously explore severaldesign variables, multivariate statistical methods (i .e .,Logistic Regression or Discriminant Analysis) are themost appropriate.
The advantages of using statistics are the handlingof quantitative data, the good empirical and statisticalfoundation of the methods and their powerful capabilityof generalization . The major drawbacks are the need tocheck relevant a priori conditions in order to be applied(normality, statistical independence, and so forth), andthe expertise required to process results . Moreover,statistics are based on a clear definition of the objects,factors, and categories involved in the study, whichmust be specified without ambiguity . However, whendealing with preferences and opinions, the use ofaccurate linguistic terms is neither adequate to formu-late questions to users, nor the most suitable way ofprocessing their answers . An alternative approach offer-ing a friendlier interface for the formulation of "fuzzy"concepts could be of benefit for the identification ofuser preference in assistive technology.
Fuzzy logic was first introduced by Zadeh (6) as aresult of the logical paradoxes detected in commonengineering applications . Fuzziness measures the extentto which an event may occur or to which an entity maybe classified as something . Fuzzy logic permits vari-ables to belong to more than one set or class, thusenabling computers to cope with vague concepts (e .g .,the temperature of a room might be appropriate, but abit high at the same time) . In this way, the developmentof a complex mathematical model of any technical
system can be replaced by a simpler qualitativerepresentation.
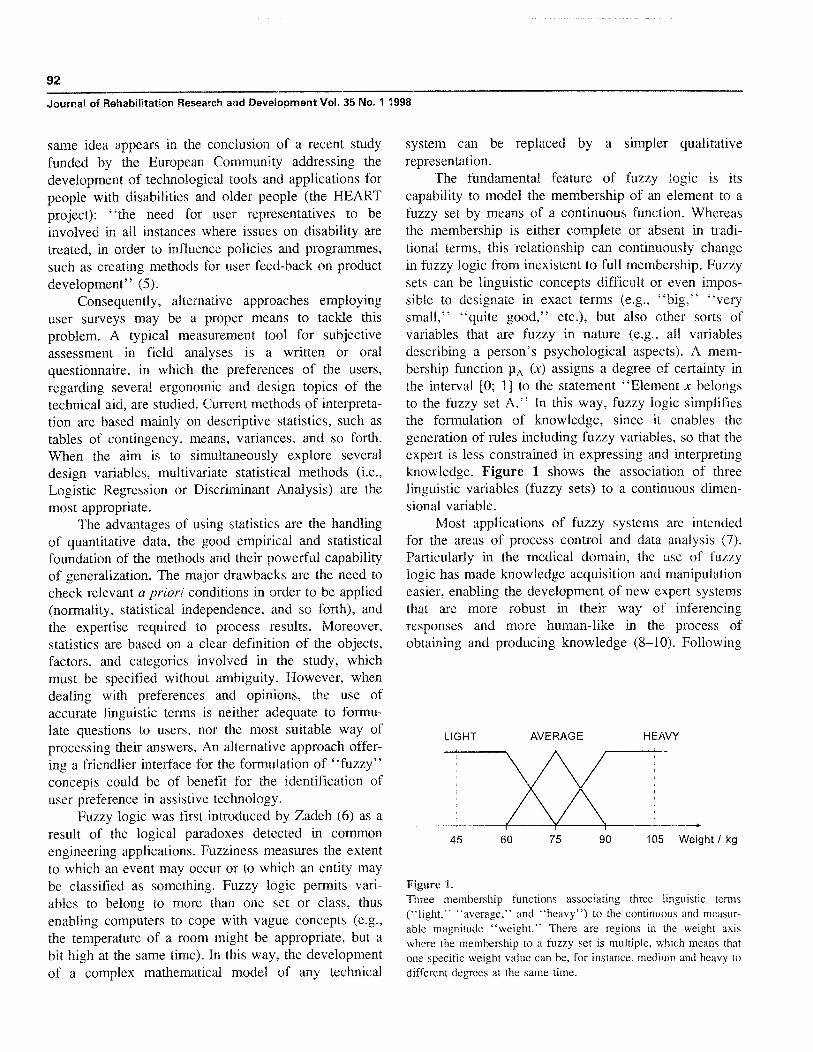
The fundamental feature of fuzzy logic is itscapability to model the membership of an element to afuzzy set by means of a continuous function . Whereasthe membership is either complete or absent in tradi-tional terms, this 'relationship can continuously changein fuzzy logic from inexistent to full membership . Fuzzysets can be linguistic concepts difficult or even impos-sible to designate in exact terms (e .g., "big," "verysmall," "quite good," etc .), but also other sorts ofvariables that are fuzzy in nature (e .g ., all variablesdescribing a person's psychological aspects) . A mem-bership function pA (x) assigns a degree of certainty inthe interval [0; 1] to the statement "Element x belongsto the fuzzy set A ." In this way, fuzzy logic simplifiesthe formulation of knowledge, since it enables thegeneration of rules including fuzzy variables, so that theexpert is less constrained in expressing and interpretingknowledge . Figure 1 shows the association of threelinguistic variables (fuzzy sets) to a continuous dimen-sional variable.
Most applications of fuzzy systems are intendedfor the areas of process control and data analysis (7).Particularly in the medical domain, the use of fuzzylogic has made knowledge acquisition and manipulationeasier, enabling the development of new expert systemsthat are more robust in their way of inferencingresponses and more human-like in the process ofobtaining and producing knowledge (8-10) . Following
45
60
75
90
105 Weight I kg
Figure 1.Three membership functions associating three linguistic terms("light," "average," and "heavy") to the continuous and measur-able magnitude "weight ." There are regions in the weight axiswhere the membership to a fuzzy set is multiple, which means thatone specific weight value can be, for instance, medium and heavy todifferent degrees at the same time.
LIGHT HEAVYAVERAGE
93CLINICAL REPORT: Fuzzy Logic and Technical Aids
this approach, fuzzy expert systems could also beimplemented for the qualitative assessment of technicalaids, since information for their design can be mainlyprovided either by experts or by users.
One particular problem of a fuzzy system is theway of determining its rules . Most systems are designedfrom the experience of domain specialists or from thespecific knowledge found in the literature . Only whenthis special knowledge becomes available, can theapproach lead to a useful fuzzy system. Inductivesystems, on the other hand, generate knowledge rulesdirectly from the information gathered by means ofmeasurements, providing assistance when specificknowledge is either elusive to obtain or too subjective.Inductive systems are designed with the help of atraining algorithm, which tries to match optimally themodel's predictions to the real observations fed into thesystem during training . In this context, neuro-fuzzynetworks (11–13), adaptive clustering techniques (1416), and genetic algorithms (17–19) have been pro-posed. A major drawback of inductive expert systems istheir dependency on the training data set, which makesvalidation with other data necessary.
This article presents a new algorithm for theautomatic generation of fuzzy rules from measuredinformation either of physical origin (e .g ., dimensionsof the technical aid) or of subjective nature (e .g., useropinion) . Here it is applied to the qualitative interpreta-tion of preferences of users of wheelchairs concerningtheir occupational activity at office . A questionnairecarried out among 88 users working in different officeswas used to obtain the data, and the results related tothe functional and ergonomic factors that played a keyrole in global user satisfaction are presented to demon-strate the validity of the proposed methods.
METHODS
The first part of this section describes a question-naire that was used to characterize the user-wheelchairinterface and to obtain user feedback in a field studywhere data were obtained . The second part deals withthe theoretical rationale for wheelchair evaluation thatwas used to create the fuzzy logic model and themethods applied to interpret and test that model . TheGlossary, which follows the Appendix, provides defini-tions of the particular terminology employed throughoutthe text .
Field StudyScope
The questionnaire that was used stemmed from aprevious investigation carried out at the Institute ofBiomechanics of Valencia (20) among active users ofwheelchairs with the aim of determining and quantify-ing the most relevant problems in the user's officeworkplace, particularly regarding accessibility, furnituredesign, and task performance.
The questionnaire was filled in by trained staffwhile the user was working. Due to practical reasons,the measuring process was conducted at the office withthe user seated in his/her wheelchair . That impliedserious limitations and made the determination of somedimensions (e .g ., seat angle) only indirectly possible.The procedure consisted of the following parts:
• a questionnaire of subjective user preferences• measurement of anthropometric dimensions of the
user while seated• measurement of wheelchair dimensions• measurement of other features of the office envi-
ronment.Since the questionnaire was intended for assessing
the occupational conditions of users of wheelchairs,some measurements included in the original formsrelated to furniture design . From the previous study, itcould be concluded that intervention on workplacedesign was not a priority goal in our country, but thatthe basic factor influencing user-satisfaction for officework was the design of the wheelchair itself . Interven-tion on wheelchair design seemed more sensible in thiscontext, thus concentrating on variables that configurethis design while not taking any other environmentalfactor into consideration for this study.
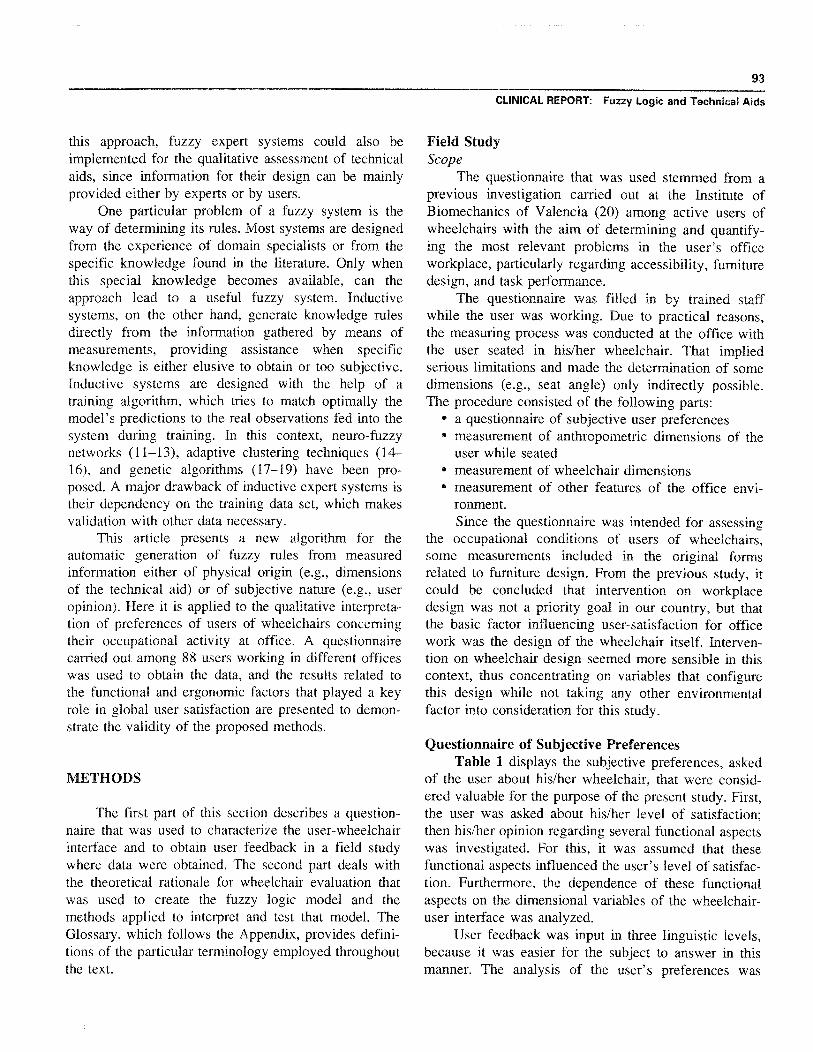
Questionnaire of Subjective PreferencesTable 1 displays the subjective preferences, asked
of the user about his/her wheelchair, that were consid-ered valuable for the purpose of the present study . First,the user was asked about his/her level of satisfaction;then his/her opinion regarding several functional aspectswas investigated . For this, it was assumed that thesefunctional aspects influenced the user's level of satisfac-tion. Furthermore, the dependence of these functionalaspects on the dimensional variables of the wheelchair-user interface was analyzed.
User feedback was input in three linguistic levels,because it was easier for the subject to answer in thismanner . The analysis of the user's preferences was
94
Journal of Rehabilitation Research and Development Vol . 35 No . 1 1998
Table 1.Subjective preference questionnaire.
Preference
Evaluation levels
General satisfaction level regarding the wheelchair
Capability of adjusting the chair according to thedemands of office job
Aesthetic outlook of wheelchair in user's opinion
Seating comfort for office work
Ease of maneuvering the wheelchair
Ease of overcoming small obstacles
Price-quality ratio in user's opinion
Ease of pushing the wheelchair
Feeling of safety during wheelchair use
Wheelchair durability considering frequency of repairs
Totally satisfied, Partially satisfied, Not satisfied at all
Good, Bad
Nice, Average, Ugly
Comfortable, Average, Uncomfortable
Easy, Average, Difficult
Easy, Average, Difficult
Good, Average, Bad
Easy, Average, Difficult
Safe, Average, Unsafe
Good, Average, Bad
carried out only in two levels (a positive and a negativeopinion), because the sample size and sample variabilitydid not allow for a finer categorization in the statisticalanalysis.
Measurements of Users and Wheelchair DimensionsEighty-eight subjects between the ages of 18 and
55 years (average 36 years), from all over the country,were analyzed in the study; 54 were men and 34women. All used manual wheelchairs due to differentpathologies of the users : paraplegia (41 percent),poliomyelitis (23 percent), tetraplegia (13 percent),muscle dystrophy (8 percent), cerebral palsy (5 percent),and other diseases (8 percent).
Most subjects (65 percent) showed normal mobilityin the upper limbs and 75 percent had paralysis in thelower limbs. The functional condition of the subjectsinvestigated was rather satisfactory . A functional ques-tionnaire was administered to each subject regardingseveral activities of daily life, in which the majority (63percent) reached the maximum score of 60 points in thescale .
The sort of occupational activities carried out bythe subjects were always concomitant to the use of adesk and other pieces of office furniture and often alsoof a computer. Fifty-one percent of the subjectsinterviewed reported some kind of body discomfortreferring its origin to their job rather than to theirdisabilities . The dimensions of the subjects were mea-
sured with a Martin anthropometer, but were notincluded in the modeling process.
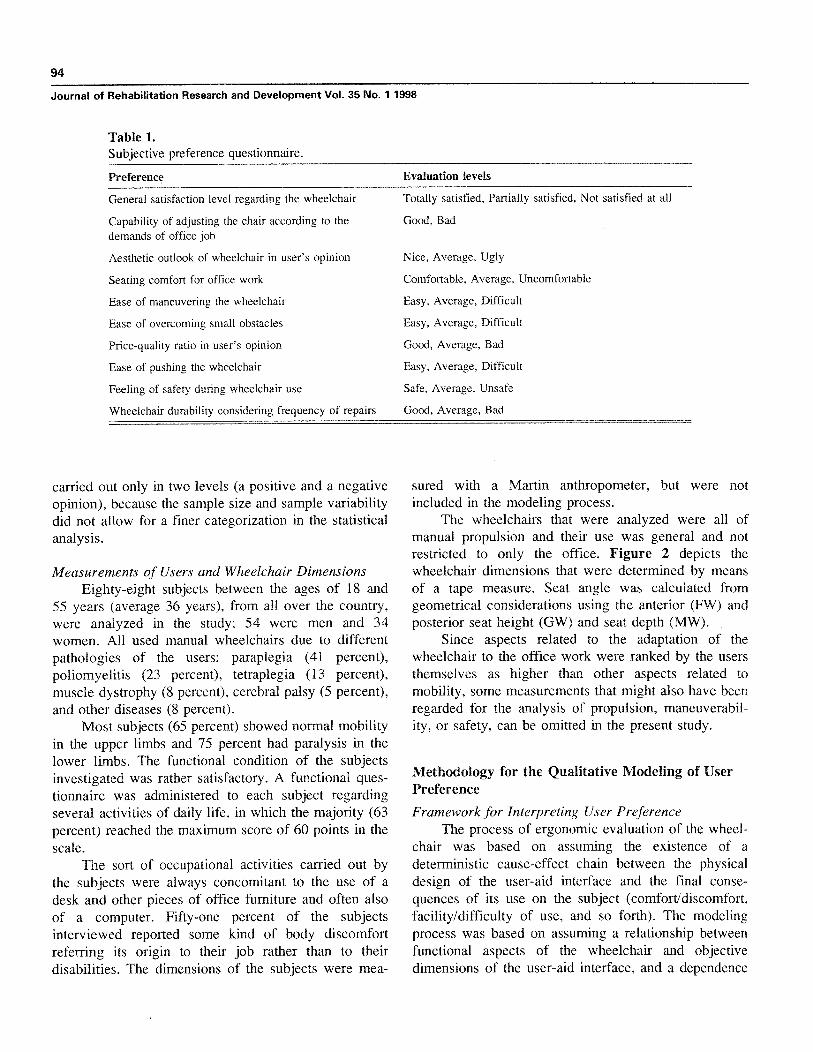
The wheelchairs that were analyzed were all ofmanual propulsion and their use was general and notrestricted to only the office . Figure 2 depicts thewheelchair dimensions that were determined by meansof a tape measure. Seat angle was calculated fromgeometrical considerations using the anterior (FW) andposterior seat height (GW) and seat depth (MW).
Since aspects related to the adaptation of thewheelchair to the office work were ranked by the usersthemselves as higher than other aspects related tomobility, some measurements that might also have beenregarded for the analysis of propulsion, maneuverabil-ity, or safety, can be omitted in the present study.
Methodology for the Qualitative Modeling of UserPreference
Framework for Interpreting User PreferenceThe process of ergonomic evaluation of the wheel-
chair was based on assuming the existence of adeterministic cause-effect chain between the physicaldesign of the user-aid interface and the final conse-quences of its use on the subject (comfort/discomfort,facility/difficulty of use, and so forth) . The modelingprocess was based on assuming a relationship betweenfunctional aspects of the wheelchair and objectivedimensions of the user-aid interface, and a dependence
95
CLINICAL REPORT : Fuzzy Logic and Technical Aids
EW
AW) OVERALL WIDTH EW) OVERALL HEIGHT LW) OVERALL LENGTHBW) SEAT WIDTH FW) SEAT HEIGHT (WITH CUSHION) MW) SEAT DEPTHCW) BACK WIDTH GW) SEAT POSTERIOR HEIGHT (WITH BACK CUSHION)DW) ARMREST DISTANCE (WITH CUSHION) NW) ARMREST LENGTH
HW) FLOOR-BACK HEIGHT PW) REAR WHEEL DIAMETERJW) FLOOR-ARMREST HEIGHT QW) BACK ANGLEKW) FOOTREST HEIGHT
Figure 2.Wheelchair dimensions measured in the questionnaire.
between those functional aspects and the global opinionof the user about his/her technical aid.
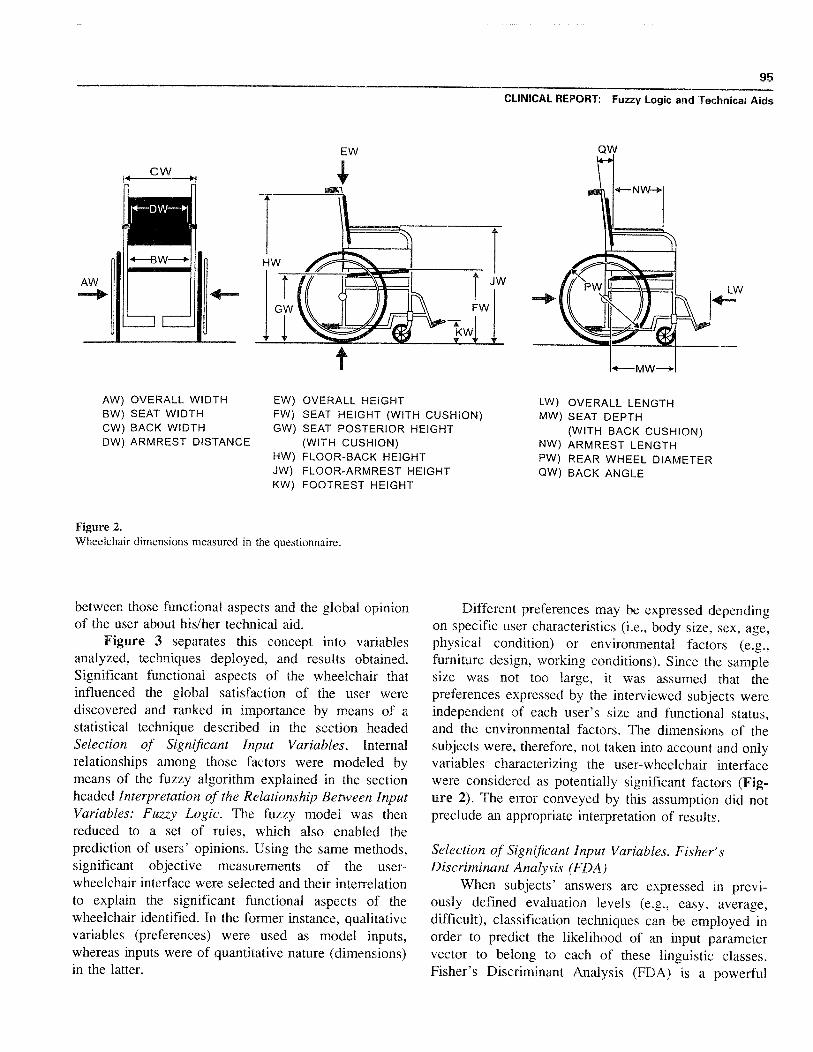
Figure 3 separates this concept into variablesanalyzed, techniques deployed, and results obtained.Significant functional aspects of the wheelchair thatinfluenced the global satisfaction of the user werediscovered and ranked in importance by means of astatistical technique described in the section headedSelection of Significant Input Variables . Internalrelationships among those factors were modeled bymeans of the fuzzy algorithm explained in the sectionheaded Interpretation of the Relationship Between InputVariables : Fuzzy Logic. The fuzzy model was thenreduced to a set of rules, which also enabled theprediction of users' opinions . Using the same methods,significant objective measurements of the user-wheelchair interface were selected and their interrelationto explain the significant functional aspects of thewheelchair identified . In the former instance, qualitativevariables (preferences) were used as model inputs,whereas inputs were of quantitative nature (dimensions)in the latter .
Different preferences may be expressed dependingon specific user characteristics (i .e ., body size, sex, age,physical condition) or environmental factors (e .g .,furniture design, working conditions) . Since the samplesize was not too large, it was assumed that thepreferences expressed by the interviewed subjects wereindependent of each user's size and functional status,and the environmental factors . The dimensions of thesubjects were, therefore, not taken into account and onlyvariables characterizing the user-wheelchair interfacewere considered as potentially significant factors (Fig-ure 2). The error conveyed by this assumption did notpreclude an appropriate interpretation of results.
Selection of Significant Input Variables . Fisher'sDiscriminant Analysis (FDA)
When subjects' answers are expressed in previ-ously defined evaluation levels (e .g ., easy, average,difficult), classification techniques can be employed inorder to predict the likelihood of an input parametervector to belong to each of these linguistic classes.Fisher's Discriminant Analysis (FDA) is a powerful
96
Journal of Rehabilitation Research and Development Vol . 35 No. 1 1998
included as inputs in the subsequent fuzzy modelingprocess.
Assessment of globalsatisfactionEFFECTS A.
CAUSES
: Interpretation ofrelationships
Selection of significant__Discriminant AnalysiA functional aspects
L—__Fuzzy logic'Determination of the
predictive model
election of objective -'jparameters
Interpretation of
r.lDetermination of the')----Fuzzy Iogic--* relationship
predictive model j
Objective parameters ofwheelchair-user
interface
TYPE OF
TECHNIQUE le. RESULTSASSESSMENT
Figure 3.Framework for modeling the preferences of user . A cause-effectchain between objective parameters defining the wheelchair-userinterface and the final opinion of the user is assumed . Globalsatisfaction is assessed in the dependence of several functionalfactors ; significant functional factors are then analyzed in depen-dence of objective dimensions of the wheelchair-user interface.
linear multivariate classification tool used to maximizethe ratio of variability observed between differentclasses and the variability observed within the classes(21,22). The relative importance or discriminationpotential of each input parameter can be estimated bymeans of the absolute value of the standardizeddiscriminant coefficients (SDC) i .
If K is the total number of classes defined and n
the number of inputs, FDA calculates f=min (K— 1,n)projection axes zi (j=1, . .j) of maximum separationbetween the groups. Each projection axis zj represents anew standardized discriminant component, defined by aweighted sum of the original (standardized) parametersxi (i=1, . .,n) as shown in Equation 1.
By applying an iterative variant of Fisher's algorithm,the selection of a reduced subset of discriminantparameters can be optimized . In our study, the subjec-tive preferences considered were grouped in two classesrepresenting two evaluation levels . Five input param-eters resulted significantly in the analyses performedand only the four most discriminant parameters were
Interpretation of the Relationship Between InputVariables : Fuzzy Logic
Each fuzzy system links together several inputs toone output variable . The design of the fuzzy expertsystem consisted of the following steps : 1) fuzzificationof model inputs and model output, 2) application of aninductive algorithm to identify the fuzzy qualitativemodel and interpret the user's preference, and 3)determination of a simplified rule-base enabling themodel prediction.
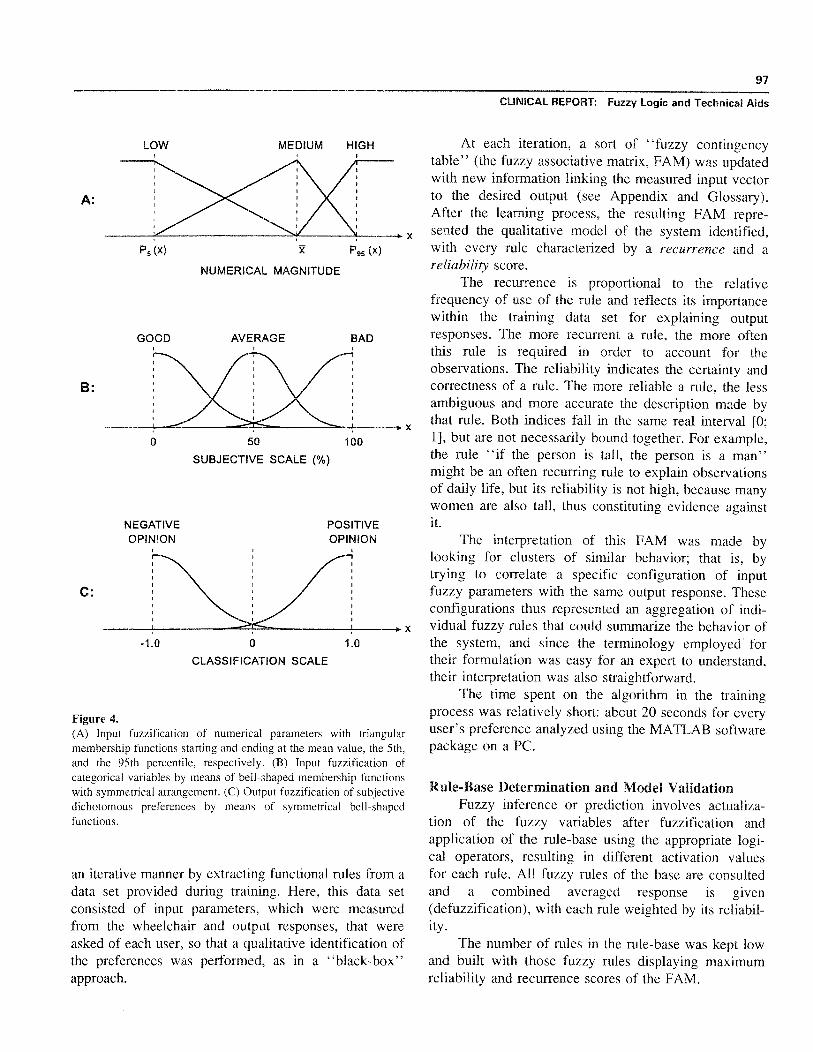
FuzzificationInput fuzzification converts the input and output
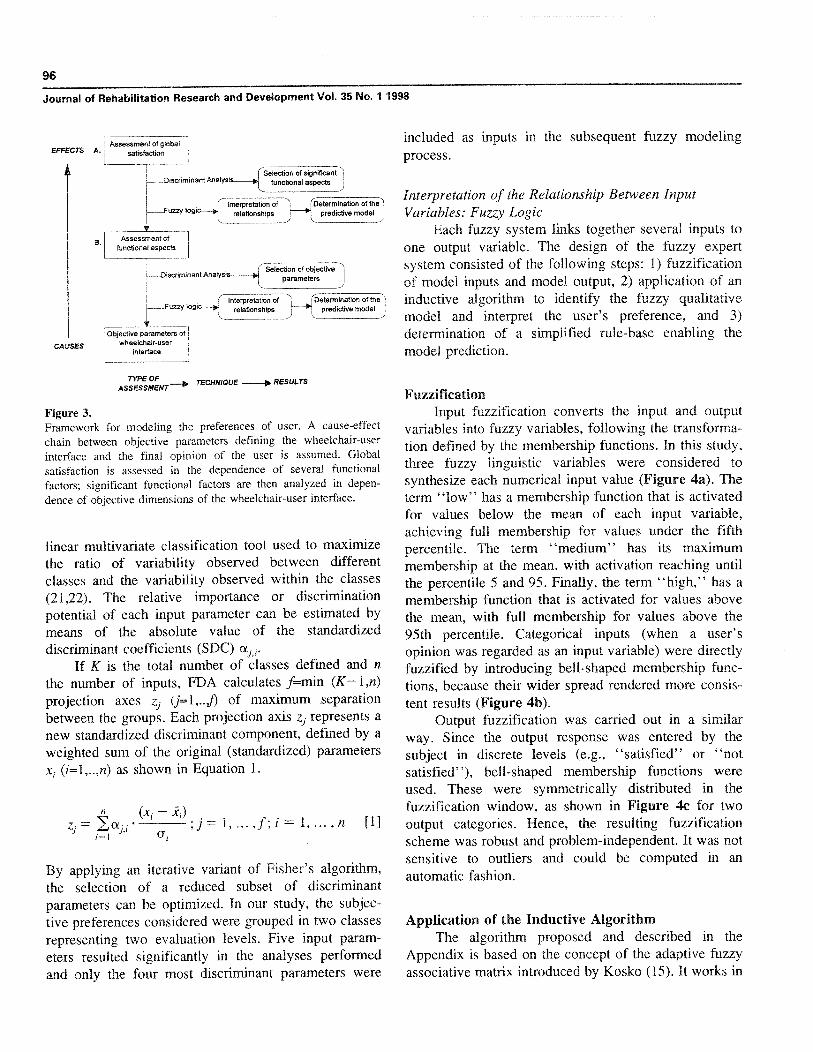
variables into fuzzy variables, following the transforma-tion defined by the membership functions . In this study,three fuzzy linguistic variables were considered tosynthesize each numerical input value (Figure 4a) . Theterm "low" has a membership function that is activatedfor values below the mean of each input variable,achieving full membership for values under the fifthpercentile . The term "medium" has its maximummembership at the mean, with activation reaching untilthe percentile 5 and 95 . Finally, the term "high," has amembership function that is activated for values abovethe mean, with full membership for values above the95th percentile . Categorical inputs (when a user'sopinion was regarded as an input variable) were directlyfuzzified by introducing bell-shaped membership func-tions, because their wider spread rendered more consis-tent results (Figure 4b).
Output fuzzification was carried out in a similarway. Since the output response was entered by thesubject in discrete levels (e .g., "satisfied" or "notsatisfied"), bell-shaped membership functions wereused. These were symmetrically distributed in thefuzzification window, as shown in Figure 4c for twooutput categories . Hence, the resulting fuzzificationscheme was robust and problem-independent . It was notsensitive to outliers and could be computed in anautomatic fashion.
Application of the Inductive AlgorithmThe algorithm proposed and described in the
Appendix is based on the concept of the adaptive fuzzyassociative matrix introduced by Kosko (15) . It works in
Assessment offunctional aspects
B .
1--_Discriminant Analysis
(xi — xr) ,;j = 1,, . . , f ; i = 1,
,n
[1]z .
97
CLINICAL REPORT : Fuzzy Logic and Technical Aids
P 95 (x)
NUMERICAL MAGNITUDE
50
100
SUBJECTIVE SCALE (%)
NEGATIVEOPINION
-1 .0
0
1 .0
CLASSIFICATION SCALE
Figure 4.(A) Input fuzzification of numerical parameters with triangularmembership functions starting and ending at the mean value, the 5th,and the 95th percentile, respectively . (B) Input fuzzification ofcategorical variables by means of bell-shaped membership functionswith symmetrical arrangement. (C) Output fuzzification of subjectivedichotomous preferences by means of symmetrical bell-shapedfunctions.
an iterative manner by extracting functional rules from adata set provided during training . Here, this data setconsisted of input parameters, which were measuredfrom the wheelchair and output responses, that wereasked of each user, so that a qualitative identification ofthe preferences was performed, as in a "black-box"approach.
At each iteration, a sort of "fuzzy contingencytable" (the fuzzy associative matrix, FAM) was updatedwith new information linking the measured input vectorto the desired output (see Appendix and Glossary).After the learning process, the resulting FAM repre-sented the qualitative model of the system identified,with every rule characterized by a recurrence and areliability score.
The recurrence is proportional to the relativefrequency of use of the rule and reflects its importancewithin the training data set for explaining outputresponses . The more recurrent a rule, the more oftenthis rule is required in order to account for theobservations . The reliability indicates the certainty andcorrectness of a rule . The more reliable a rule, the lessambiguous and more accurate the description made bythat rule . Both indices fall in the same real interval [0;1], but are not necessarily bound together . For example,the rule "if the person is tall, the person is a man"might be an often recurring rule to explain observationsof daily life, but its reliability is not high, because manywomen are also tall, thus constituting evidence againstit .
The interpretation of this FAM was made bylooking for clusters of similar behavior ; that is, bytrying to correlate a specific configuration of inputfuzzy parameters with the same output response . Theseconfigurations thus represented an aggregation of indi-vidual fuzzy rules that could summarize the behavior ofthe system, and since the terminology employed fortheir formulation was easy for an expert to understand,their interpretation was also straightforward.
The time spent on the algorithm in the trainingprocess was relatively short: about 20 seconds for everyuser's preference analyzed using the MATLAB softwarepackage on a PC.
Rule-Base Determination and Model ValidationFuzzy inference or prediction involves actualiza-
tion of the fuzzy variables after fuzzification andapplication of the rule-base using the appropriate logi-cal operators, resulting in different activation valuesfor each rule . All fuzzy rules of the base are consultedand a combined averaged response is given(defuzzification), with each rule weighted by its reliabil-ity .
The number of rules in the rule-base was kept lowand built with those fuzzy rules displaying maximumreliability and recurrence scores of the FAM.
LOW MEDIUM HIGH
A:
B:
C :
P 5 (x)
GOOD BADAVERAGE
POSITIVEOPINION
98
Journal of Rehabilitation Research and Development Vol . 35 No . 1 1998
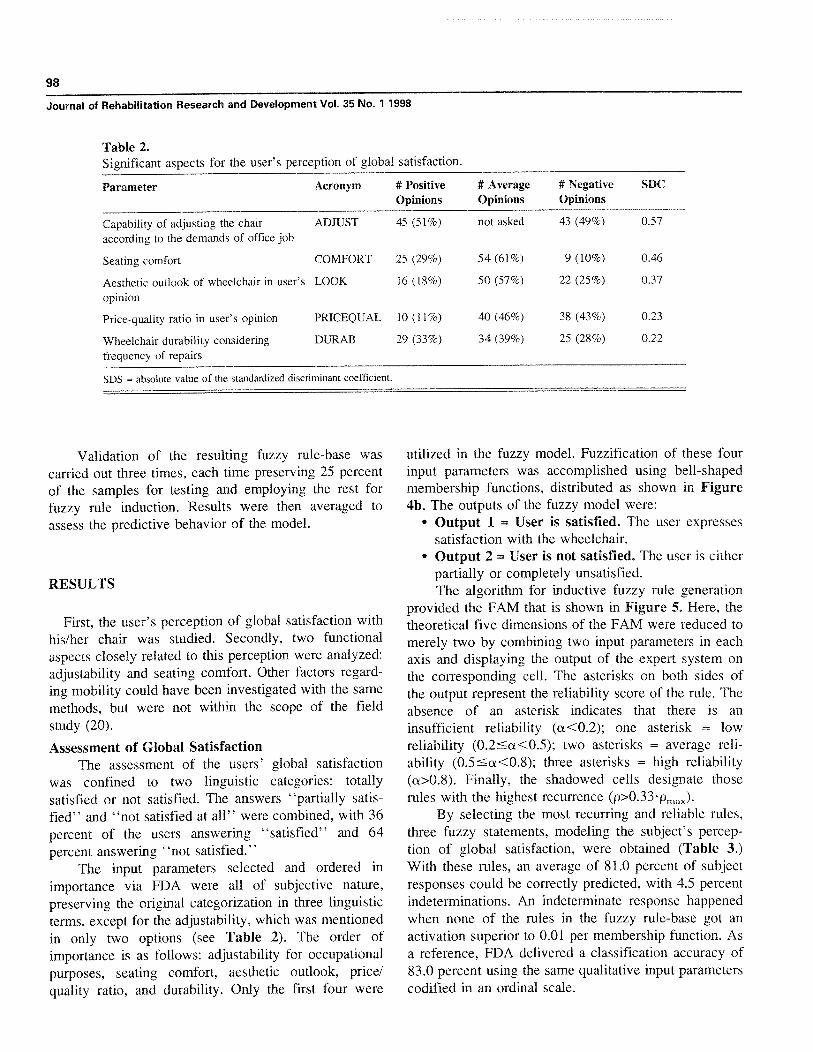
Table 2.Significant aspects for the user's perception of global satisfaction.
Parameter Acronym # PositiveOpinions
# AverageOpinions
# NegativeOpinions
SDC
Capability of adjusting the chairaccording to the demands of office job
ADJUST 45 (51%) not asked 43 (49%) 0 .57
Seating comfort COMFORT 25 (29%) 54 (61%) 9 (10%) 0 .46
Aesthetic outlook of wheelchair in user'sopinion
LOOK 16 (18%) 50 (57%) 22 (25%) 0 .37
Price-quality ratio in user's opinion PRICEQUAL 10 (11%) 40 (46%) 38 (43%) 0 .23
Wheelchair durability consideringfrequency of repairs
DURAB 29 (33%) 34 (39%) 25 (28%) 0 .22
SDS = absolute value of the standardized discriminant coefficient.
Validation of the resulting fuzzy rule-base wascarried out three times, each time preserving 25 percentof the samples for testing and employing the rest forfuzzy rule induction . Results were then averaged toassess the predictive behavior of the model.
RESULTS
First, the user's perception of global satisfaction withhis/her chair was studied. Secondly, two functionalaspects closely related to this perception were analyzed:adjustability and seating comfort. Other factors regard-ing mobility could have been investigated with the samemethods, but were not within the scope of the fieldstudy (20).
Assessment of Global SatisfactionThe assessment of the users' global satisfaction
was confined to two linguistic categories : totallysatisfied or not satisfied . The answers "partially satis-fied" and "not satisfied at all" were combined, with 36percent of the users answering "satisfied" and 64percent answering "not satisfied ."
The input parameters selected and ordered inimportance via FDA were all of subjective nature,preserving the original categorization in three linguisticterms, except for the adjustability, which was mentionedin only two options (see Table 2). The order ofimportance is as follows: adjustability for occupationalpurposes, seating comfort, aesthetic outlook, price/quality ratio, and durability. Only the first four were
utilized in the fuzzy model . Fuzzification of these fourinput parameters was accomplished using bell-shapedmembership functions, distributed as shown in Figure4b . The outputs of the fuzzy model were:
• Output 1 = User is satisfied. The user expressessatisfaction with the wheelchair.Output 2 = User is not satisfied . The user is eitherpartially or completely unsatisfied.The algorithm for inductive fuzzy rule generation
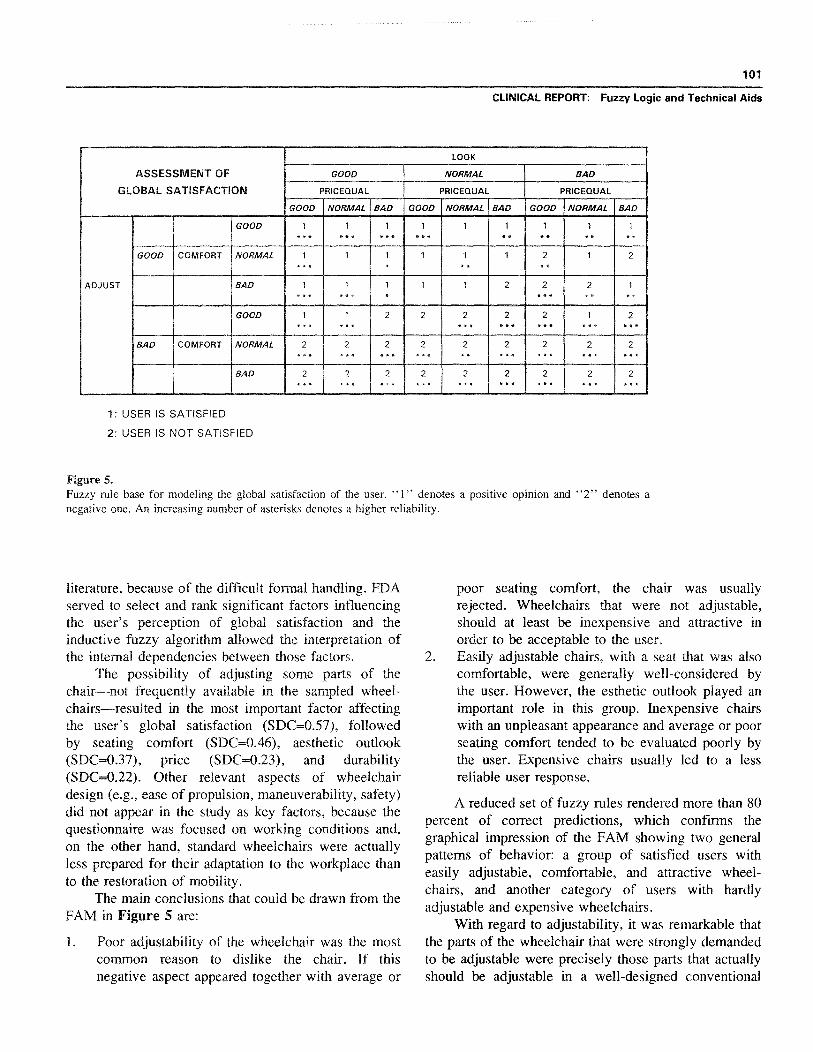
provided the FAM that is shown in Figure 5. Here, thetheoretical five dimensions of the FAM were reduced tomerely two by combining two input parameters in eachaxis and displaying the output of the expert system onthe corresponding cell . The asterisks on both sides ofthe output represent the reliability score of the rule . Theabsence of an asterisk indicates that there is aninsufficient reliability (a<0 .2); one asterisk = lowreliability (0 .2a<0.5); two asterisks = average reli-ability (0 .5 �a<0.8); three asterisks = high reliability(a>0.8) . Finally, the shadowed cells designate thoserules with the highest recurrence (p>0 .33 T r.)).
By selecting the most recurring and reliable rules,three fuzzy statements, modeling the subject's percep-tion of global satisfaction, were obtained (Table 3 .)With these rules, an average of 81 .0 percent of subjectresponses could be correctly predicted, with 4 .5 percentindeterminations . An indeterminate response happenedwhen none of the rules in the fuzzy rule-base got anactivation superior to 0 .01 per membership function . Asa reference, FDA delivered a classification accuracy of83 .0 percent using the same qualitative input parameterscodified in an ordinal scale.
99
CLINICAL REPORT : Fuzzy Logic and Technical Aids
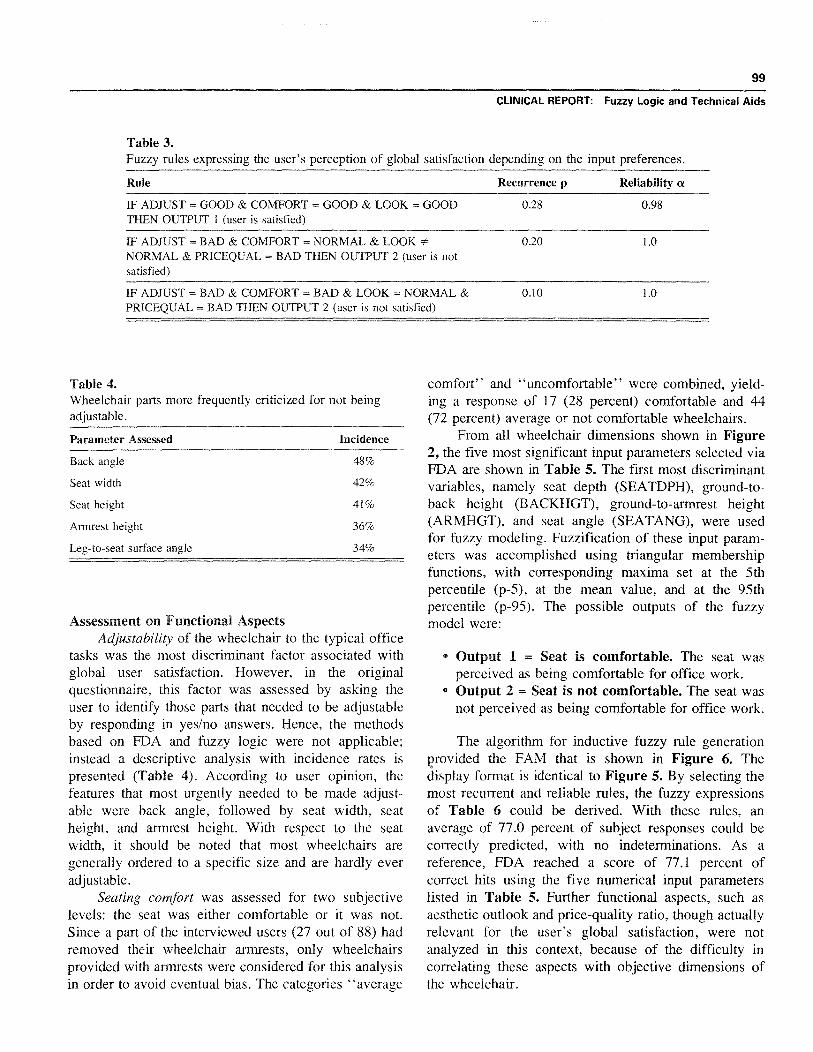
Table 3.Fuzzy rules expressing the user's perception of global satisfaction depending on the input preferences.
Rule Recurrence p Reliability a
IF ADJUST = GOOD & COMFORT = GOOD & OOK = GOODTHEN OUTPUT 1 (user is satisfied)
0 .28 0 .98
IF ADJUST = BAD & COMFORT = NORMAL & LOOKNORMAL & PRICEQUAL = BAD THEN OUTPUT 2 (user is notsatisfied)
0 .20 1 .0
IF ADJUST = BAD & COMFORT = BAD & LOOK = NORMAL &PRICEQUAL = BAD THEN OUTPUT 2 (user is not satisfied)
0 .10 1 .0
Table 4.Wheelchair parts more frequently criticized for not beingadjustable.
Parameter Assessed Incidence
Back angle 48%
Seat width 42%
Seat height 41%
Armrest height 36%
Leg-to-seat surface angle 34%
Assessment on Functional AspectsAdjustability of the wheelchair to the typical office
tasks was the most discriminant factor associated withglobal user satisfaction . However, in the originalquestionnaire, this factor was assessed by asking theuser to identify those parts that needed to be adjustableby responding in yes/no answers . Hence, the methodsbased on FDA and fuzzy logic were not applicable;instead a descriptive analysis with incidence rates ispresented (Table 4) . According to user opinion, thefeatures that most urgently needed to be made adjust-able were back angle, followed by seat width, seatheight, and armrest height . With respect to the seatwidth, it should be noted that most wheelchairs aregenerally ordered to a specific size and are hardly everadjustable.
Seating comfort was assessed for two subjectivelevels: the seat was either comfortable or it was not.Since a part of the interviewed users (27 out of 88) hadremoved their wheelchair armrests, only wheelchairsprovided with armrests were considered for this analysisin order to avoid eventual bias . The categories "average
comfort" and "uncomfortable" were combined, yield-ing a response of 17 (28 percent) comfortable and 44(72 percent) average or not comfortable wheelchairs.
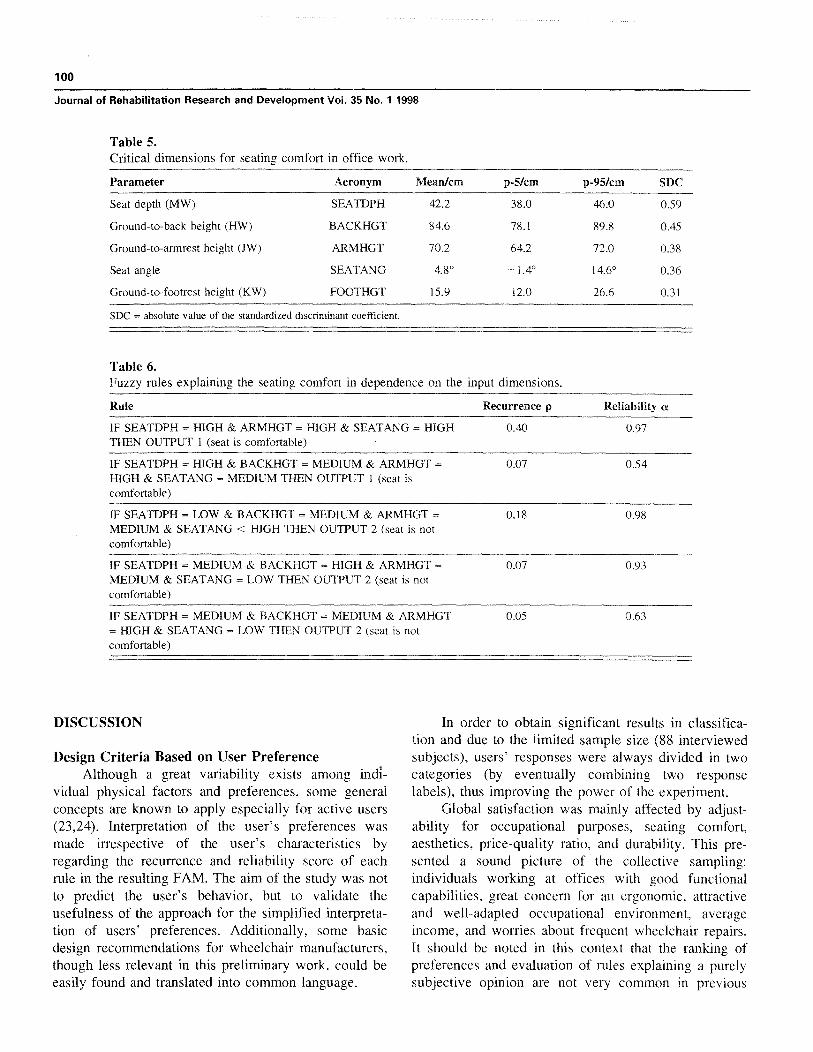
From all wheelchair dimensions shown in Figure2, the five most significant input parameters selected viaFDA are shown in Table 5. The first most discriminantvariables, namely seat depth (SEATDPH), ground-to-back height (BACKHGT), ground-to-armrest height(ARMHGT), and seat angle (SEATANG), were usedfor fuzzy modeling. Fuzzification of these input param-eters was accomplished using triangular membershipfunctions, with corresponding maxima set at the 5thpercentile (p-5), at the mean value, and at the 95thpercentile (p-95) . The possible outputs of the fuzzymodel were:
• Output 1 = Seat is comfortable . The seat wasperceived as being comfortable for office work.Output 2 = Seat is not comfortable . The seat wasnot perceived as being comfortable for office work.
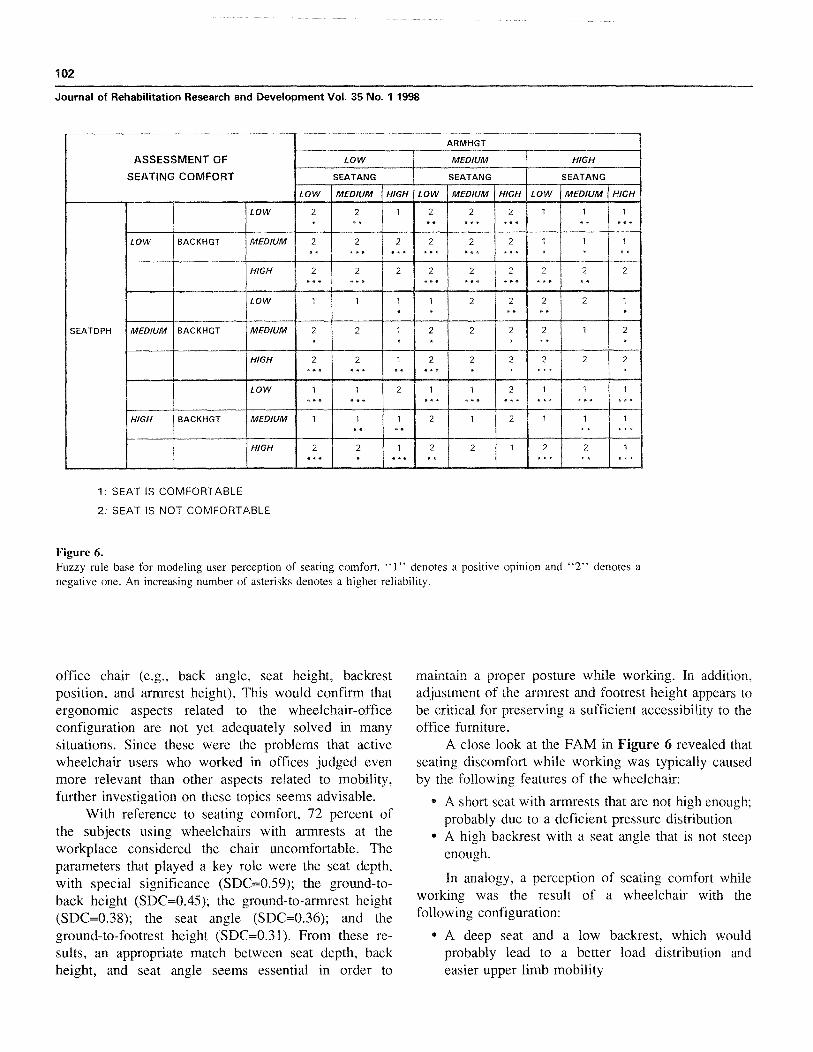
The algorithm for inductive fuzzy rule generationprovided the FAM that is shown in Figure 6. Thedisplay format is identical to Figure 5 . By selecting themost recurrent and reliable rules, the fuzzy expressionsof Table 6 could be derived. With these rules, anaverage of 77.0 percent of subject responses could becorrectly predicted, with no indeterminations . As areference, FDA reached a score of 77 .1 percent ofcorrect hits using the five numerical input parameterslisted in Table 5 . Further functional aspects, such asaesthetic outlook and price-quality ratio, though actuallyrelevant for the user's global satisfaction, were notanalyzed in this context, because of the difficulty incorrelating these aspects with objective dimensions ofthe wheelchair.
100
Journal of Rehabilitation Research and Development Vol . 35 No . 1 1998
Table 5.Critical dimensions for seating comfort in office work.
Parameter
Acronym
Mean/cm
p-5/cm
p-95/cm
SDC
Seat depth (MW)
SEATDPH
Ground-to-back height (HW)
BACKHGT
Ground-to-armrest height (JW)
ARMHGT
Seat angle
SEATANG
Ground-to-footrest height (KW)
FOOTHGT
42 .2
38 .0
46 .0
0 .59
84 .6
78 .1
89 .8
0.45
70 .2
64 .2
72 .0
0 .38
4.8°
-1 .4°
14.6°
0 .36
15 .9
12 .0
26 .6
0.31
SDC = absolute value of the standardized discriminant coefficient.
Table 6.Fuzzy rules explaining the seating comfort in dependence on the input dimensions.
Rule
Recurrence p
Reliability a
IF SEATDPH = HIGH & ARMHGT = HIGH & SEATANG = HIGH
0.40
0 .97THEN OUTPUT 1 (seat is comfortable)
IF SEATDPH = HIGH & BACKHGT = MEDIUM & ARMHGT =
0 .07
0 .54HIGH & SEATANG = MEDIUM THEN OUTPUT I (seat iscomfortable)
IF SEATDPH = LOW & BACKHGT = MEDIUM & ARMHGT =
0 .18
0 .98MEDIUM & SEATANG < HIGH THEN OUTPUT 2 (seat is notcomfortable)
IF SEATDPH = MEDIUM & BACKHGT = HIGH & ARMHGT =
0 .07
0 .93MEDIUM & SEATANG = LOW THEN OUTPUT 2 (seat is notcomfortable)
IF SEATDPH = MEDIUM & BACKHGT = MEDIUM & ARMHGT
0 .05
0 .63= HIGH & SEATANG = LOW THEN OUTPUT 2 (seat is notcomfortable)
DISCUSSION
Design Criteria Based on User PreferenceAlthough a great variability exists among indi-
vidual physical factors and preferences, some generalconcepts are known to apply especially for active users(23,24). Interpretation of the user's preferences wasmade irrespective of the user's characteristics byregarding the recurrence and reliability score of eachrule in the resulting FAM. The aim of the study was notto predict the user's behavior, but to validate theusefulness of the approach for the simplified interpreta-tion of users' preferences. Additionally, some basicdesign recommendations for wheelchair manufacturers,though less relevant in this preliminary work, could beeasily found and translated into common language .
In order to obtain significant results in classifica-tion and due to the limited sample size (88 interviewedsubjects), users' responses were always divided in twocategories (by eventually combining two responselabels), thus improving the power of the experiment.
Global satisfaction was mainly affected by adjust-ability for occupational purposes, seating comfort,aesthetics, price-quality ratio, and durability . This pre-sented a sound picture of the collective sampling:individuals working at offices with good functionalcapabilities, great concern for an ergonomic, attractiveand well-adapted occupational environment, averageincome, and worries about frequent wheelchair repairs.It should be noted in this context that the ranking ofpreferences and evaluation of rules explaining a purelysubjective opinion are not very common in previous
101
CLINICAL REPORT: Fuzzy Logic and Technical Aids
LOOK
ASSESSMENT OF
GOOD
NORMAL
BAD
GLOBAL SATISFACTION
PRICEQUAL
PRICEQUAL
PRICEQUAL
GOOD NORMAL BAD GOOD NORMAL BAD GOOD NORMAL BAD
GOOD
1
1
1
GOOD COMFORT
EMEADJUST
NORMAL
BAD MEMEMEIMEIEMM
ENMBMEIEMMEMMGOOD
NORMAL
BAD
1: USER IS SATISFIED
2: USER IS NOT SATISFIED
Figure 5.Fuzzy rule base for modeling the global satisfaction of the user . "1" denotes a positive opinion and "2" denotes anegative one . An increasing number of asterisks denotes a higher reliability.
literature, because of the difficult formal handling . FDAserved to select and rank significant factors influencingthe user's perception of global satisfaction and theinductive fuzzy algorithm allowed the interpretation ofthe internal dependencies between those factors.
The possibility of adjusting some parts of thechair—not frequently available in the sampled wheel-chairs—resulted in the most important factor affectingthe user's global satisfaction (SDC=0.57), followedby seating comfort (SDC=0.46), aesthetic outlook(SDC=0.37), price (SDC=0.23), and durability(SDC=0.22) . Other relevant aspects of wheelchairdesign (e .g ., ease of propulsion, maneuverability, safety)did not appear in the study as key factors, because thequestionnaire was focused on working conditions and,on the other hand, standard wheelchairs were actuallyless prepared for their adaptation to the workplace thanto the restoration of mobility.
The main conclusions that could be drawn from theFAM in Figure 5 are:
1 . Poor adjustability of the wheelchair was the mostcommon reason to dislike the chair . If thisnegative aspect appeared together with average or
poor seating comfort, the chair was usuallyrejected. Wheelchairs that were not adjustable,should at least be inexpensive and attractive inorder to be acceptable to the user.
2. Easily adjustable chairs, with a seat that was alsocomfortable, were generally well-considered bythe user . However, the esthetic outlook played animportant role in this group . Inexpensive chairswith an unpleasant appearance and average or poorseating comfort tended to be evaluated poorly bythe user. Expensive chairs usually led to a lessreliable user response.
A reduced set of fuzzy rules rendered more than 80percent of correct predictions, which confirms thegraphical impression of the FAM showing two generalpatterns of behavior: a group of satisfied users witheasily adjustable, comfortable, and attractive wheel-chairs, and another category of users with hardlyadjustable and expensive wheelchairs.
With regard to adjustability, it was remarkable thatthe parts of the wheelchair that were strongly demandedto be adjustable were precisely those parts that actuallyshould be adjustable in a well-designed conventional
102
Journal of Rehabilitation Research and Development Vol . 35 No. 1 1998
ARMHGT
ASSESSMENT OF
SEATING COMFORT SEATANG
SEATANG
SEATANG
LOW
MEDIUM HIGH
LOW MEDIUM HIGH LOW MEDIUM HIGH LOW MEDIUM HIGH
MEIIELOW
MED/UM
LOW
El= EIMIMEMEMEMIMEMIMEMIN111
EIRMINEIMMEMNLow
El BACKHGT MEDIUM
MEESE EIMIEMNIMMEENI
MEDIUM
1: SEAT IS COMFORTABLE
2: SEAT IS NOT COMFORTABLE
Figure 6.Fuzzy rule base for modeling user perception of seating comfort . "1" denotes a positive opinion and "2" denotes anegative one . An increasing number of asterisks denotes a higher reliability.
LOW 2 2 2 . 2 . 2
SEATDPH MEDIUM
office chair (e .g ., back angle, seat height, backrestposition, and armrest height) . This would confirm thatergonomic aspects related to the wheelchair-officeconfiguration are not yet adequately solved in manysituations. Since these were the problems that activewheelchair users who worked in offices judged evenmore relevant than other aspects related to mobility,further investigation on these topics seems advisable.
With reference to seating comfort, 72 percent ofthe subjects using wheelchairs with armrests at theworkplace considered the chair uncomfortable . Theparameters that played a key role were the seat depth,with special significance (SDC=0 .59); the ground-to-back height (SDC=0 .45); the ground-to-armrest height(SDC=0 .38); the seat angle (SDC=0 .36); and theground-to-footrest height (SDC=0.31) . From these re-sults, an appropriate match between seat depth, backheight, and seat angle seems essential in order to
maintain a proper posture while working . In addition,adjustment of the armrest and footrest height appears tobe critical for preserving a sufficient accessibility to theoffice furniture.
A close look at the FAM in Figure 6 revealed thatseating discomfort while working was typically causedby the following features of the wheelchair:
• A short seat with armrests that are not high enough;probably due to a deficient pressure distribution
• A high backrest with a seat angle that is not steepenough.
In analogy, a perception of seating comfort whileworking was the result of a wheelchair with thefollowing configuration:
• A deep seat and a low backrest, which wouldprobably lead to a better load distribution andeasier upper limb mobility
103
CLINICAL REPORT : Fuzzy Logic and Technical Aids
• A deep seat and a steep seat angle, provided thatarmrest height was properly set.
If we consider armrest height and seat angle asbeing adjustable, some recommendations could besuggested from the FAM:
• For shorter seats and lower backrests, a sufficientarmrest height should be selected
• For an average seat depth, a high seat angle and alower armrest height are better perceived by theuser
• For deep seats and higher backrests, seat angleshould be set at a steep position and armrest heightshould be adequately chosen for that angle.
Two clusters of reliable and frequent rules could bedistinguished: 1) a group of comfortable wheelchairswith deep seats, lower backrests, high armrests, andsteep seat angles ; and 2) a class of uncomfortable chairswith shorter seats, average armrest height, and lowerseat angles . The few fuzzy rules extracted couldcorrectly model the subject's opinion in 77 percent ofthe cases.
Translation of the linguistic terms "low," "me-dium," and "high" into useful design criteria can beeasily accomplished by considering the fuzzificationscheme of the input dimensions and knowing thedefinition points of each fuzzy set : 5th percentile, meanvalue, and 95th percentile . For example, a typical highseat angle for the sampled population would be anyinclination above 9 .7° (the intersection of fuzzy setsmedium and high for this variable).
Finally, it should be noted that further designcriteria could have been derived from the FAMs bylooking at specific user-wheelchair configurations ; thatis, by studying fuzzy rules in appropriate cell positions.Extra dimensional parameters could have been addedfor modeling each subjective assessment as well . Thismight have led to new insights about optimal design.However, our intention was to keep complexity inlimits, showing a preliminary application of fuzzytechniques . Furthermore, it should be also stated thatgeneralization of these results is only possible withgreat caution, because the collective analyzed is hardlyrepresentative of the global population of wheelchairusers.
Proposed MethodologyThe results presented show that introduction of
fuzzy logic in a field where subjective opinions play a
primary role constitutes an interesting step for adaptingmathematical tools to the human way of reasoning ; thusproviding an efficient way to cope with imperfectinformation (25).
The inductive learning algorithm proposed wasdeveloped starting from several ideas published in thefuzzy literature (14,15,26) . Our major contribution wasthe introduction of two essential concepts : recurrenceand reliability of the fuzzy rules . The algorithm isuniversal and can be employed for modeling any systemin a qualitative fashion in numerous domains ofapplication, either of subjective feelings or of objectivemeasurements.
The accuracy of the prediction of the derivedrule-bases was similar or even better than the classifica-tion accuracy of FDA . Variability of the dimensions andfunctional capabilities of the subject could explain whysome preferences were misclassified . If we take intoaccount that fuzzification always implies a certain lossof information (quantitative are transformed into quali-tative variables), our results demonstrate not only theinterpretability but also the discrimination potential ofthe introduced methods.
The process for obtaining a fuzzy rule-base de-scribing user preference is completely automatic andproblem-independent. No arbitrariness is introducedduring this process, since membership functions aredefined in a standard way from statistical landmarkvalues (percentiles and means), input parameters areselected from among a multiple set of measuredmagnitudes by means of the linear FDA, and the FAMis computed automatically with the help of the algo-rithm. Moreover, working with the techniques proposedis simple even for people not familiar with computersand statistics, since every design stage can be efficientlyautomated . The interpretation of the resulting FAM isstraightforward as well, because the concepts involved(linguistic terms, fuzzy rules, recurrence, reliability) arecomprehensible and not difficult to translate intopractical design criteria.
In this sense, it is important to remark that,although previous knowledge of the concepts involvedis necessary in order to sort out the significant inputparameters with FDA, the selection of fuzzy rules andthe subsequent interpretation of the users' preferencescan be performed without resort to the a prioriknowledge of the human expert . Obviously, this exper-tise is helpful in speeding up the interpretation andmaking it more profitable .
104
Journal of Rehabilitation Research and Development Vol . 35 No. 1 1998
Finally, the mapping of linguistic concepts intomembership functions could be optimized by means ofstrategies based on genetic algorithms or neural net-
works. This sort of technique could better match the
qualitative model to the observations, thus reducing theestimation error.
CONCLUSIONS
The introduced methods consisted of the fuzzifica-tion of the parameters featuring the user-wheelchairinterface in order to discover the rules that modeledpreferences of a collective of users interviewed via aquestionnaire aimed at studying the adaptation of thewheelchair to the office workplace . Fuzzy rules wereautomatically determined by using a self-developedinductive algorithm that rendered an associative matrixwith every rule characterized by its recurrence andreliability score .
The aim of the derived rule-bases was not topredict the behavior of the user in new settings (othersubjects and other wheelchairs), but to extract the
implicit subjective criteria within the collected data thatplayed a role in the user's perception of globalsatisfaction and seating comfort. For this, previousexpertise was helpful for selecting potentially signifi-cant input dimensions and for interpreting the resultingrule-base.
The results reveal a mismatch between actualperformance of standard wheelchairs and the require-ments of work in an office in the sampled collective.Functional aspects criticized by the users agree withessential needs also detected in office workers with nodisability.
The proposed methods provide a flexible tool forwheelchair design based on questionnaires that areuser-friendly . The concept could be also extended to thearea of prescription by considering user characteristicsin the fuzzy model.
APPENDIX
Algorithm for Inductive Fuzzy Rule Generation
The problem of modeling an unknown system by means of fuzzy rules (in our case, the opinion of a person using awheelchair) can be considered as a problem of system identification, with several measured input variables x ;(i=l, . .n) feedingthe system (black box) and with a unique response y representing the response of the system . The fuzzy rule-base modeling thissystem sets up a qualitative model, because no numerical differential equations are used ; instead rules employing linguisticterms are used . Input and output variables may be of an arbitrary nature (quantitative, qualitative, physical, or psychological).
When all relevant input variables have been determined (for instance, by means of FDA), input fuzzification must bespecified and the rule-base generated . The first task must be solved by the designer using his/her a priori knowledge fordefining appropriate membership functions ; in this article, one method is proposed, based on the mean value, and the 5th and95th percentile.
The second task is much more complex and, in many practical cases, is carried out by asking a human expert to formulatehis/her knowledge in the form of heuristic rules (using his/her habitual language) and subsequently converting those rules into afuzzy rule-base . However, this procedure of knowledge acquisition is prone to the subjectivity of the domain expert and issometimes not affordable . We propose an alternative method that stems from the original formulation of the adaptive FAM byKosko (15).
Given a fuzzy system with n quantitative or qualitative input variables x; (i=l, . .,n), each of them distributed into f fuzzysets (linguistic descriptives), and one quantitative or qualitative output variable y again divided into L+ l fuzzy sets, the totalnumber of dimensions in the FAM is n+l, being Co the global set of possible cells of that matrix . The total number Ro ofpossible fuzzy rules is equal to the number of cells in the FAM.
Ro — fl f2 "' fn fn+
[A-1]
As an illustration, we could think about an expert system for evaluating the degree of comfort of wheelchair seats given itsdepth and inclination . Imagine that we had these two inputs (n=2), each one partitioned into three fuzzy sets (fif2 =3), forexample, low, medium, and high, and the output again into two fuzzy sets (f3 =2), and "seat uncomfortable" and "seatcomfortable ." The total number of FAM dimensions would be three and the amount of possible fuzzy rules Ro=18 . The first

105
CLINICAL REPORT : Fuzzy Logic and Technical Aids
rule in the upper left corner of the FAM would correspond to the conjunction of the first fuzzy set per variable, reading : "Whenthe seat's depth is low and the seat's inclination is low the seat is uncomfortable ."
In order to automatically obtain the main rules governing the system, it is necessary to monitor the recurrence p i of eachfuzzy rule (i=1, . .,Ro), as the system intends to reproduce known output responses from given input values . For each realobservation (xk ; Yk), a fuzzy rule subset CRCCo becomes active in order to explain the output . The activation 8, of each rule isthe result of the logical AND of the antecedent's p(ANT) and the consequent's activation p(CONS) . No such activation iscomputed when the fuzzy implication is not fulfilled, that is, when the membership function value of the rule's consequent islower than the rule's antecedent value . Computing the AND operator with the product, the rule's activation is defined asfollows :
p (ANT,.k) ' p(CONS,,k) ; p(ANTi.k) p(CONS, ,k)0
; p(ANTi,k) > p(CONS,,k )
The activation counter p i is incremented at each step k (new observation) by the amount of activation of the rule 8i . Hence,after each iteration the active rules rCCR are updated according to the following law :
[A-2]
; Vri ECR® ; Vri C R
Pi,k = Pi,k + ® Pj,k
[A-3]APi.k
Once all observations have been presented (x k ; yk), k=1, . .,N, an activation pattern is obtained for every cell (rule) in the FAM.We then normalize each activation by the total sum of activations D, resulting in a relative rule activation or recurrence piwith values in the interval [0; 1] :
D= E pi ;Pi=
Pi
[A-4]
Obviously not all rules with the same antecedent can be valid at the same time, because this would imply a logicalcontradiction . From the f„~ 1 rules responding to the same stimulus xk , merely one is valid . Therefore, only that rule among therule set with the same antecedents whose relative activation (recurrence) is maximal is taken into consideration . In any case, thesignificance of that rule clearly depends on the dispersion of activity among the fz ., rules responding to the same antecedent.The more disperse, the less reliable the selected rule will be.
Reliability a, of a rule is expressed by the difference between the highest recurrence and the second highest recurrence,normalized by the sum of recurrences for the same antecedent . The reliability has values in the interval [0 ; 1] shown in formulaA-5 .
Pn, — Psa i = fit] ; Pm `— Ps �- PJ ; i = 1, . . . , Ro
[A-5]
E piJ=1
Therefore, each rule is characterized by two features : its recurrence pi and its reliability a ; in the training data set . Once theFAM matrix has been calculated, it is straightforward to read those rules that better synthesize the phenomenon under study . Asa general recommendation, we select those rules that exhibit the greatest recurrence together with the maximum reliability,avoiding an excessive number in order to facilitate the subsequent interpretation . After selecting those rules, a rule compressionby means of fuzzy logical laws can be carried out (association, distribution, and so forth).
To conclude, a final sentence should be devoted to classification problems such as the one in this paper . Here the outputdoes not need to be defuzzified into a continuous value ; instead, group membership probabilities are desired. After defining eachclass as a fuzzy set, we can consider the membership to these sets proportional to the probability of pertinence to that groupcomputed by the expert system . In this case, normalization of the activities (recurrence) of the rule will be based on the a prioriprobabilities defined for each group . Dividing each activation counter by the total activation sum D, implies the sampling of thepopulation with its actual group proportions. In laboratory experiments, however, the number of samples per category often isnot equivalent to the expected probabilities . If we want to assume equal a priori probabilities for every class, we should thennormalize each rule affecting one output fuzzy set (a classification class) by the total activation sum Dk of this output fuzzy set(k=1 , . .,K), with K being the total number of possible classes .
106
Journal of Rehabilitation Research and Development Vol . 35 No . 1 1998
GLOSSARY
REFERENCES
Qualitative model. A simplified description of a complexreality that uses qualitative knowledge (knowledgethat cannot be expressed by means of numericalterms) in order to predict a physical system's behav-ior.
Fuzzy associative matrix (FAM). A representation of arule-base in conjunctive form; fuzzy rules combineinput variables by means of logical ANDs. The FAMforms a hypercube with as many dimensions as inputvariables, together with one output dimension . Eachcell stands for a hypothetical rule . The number of cellsin each axis depends on the number of fuzzy partitions(linguistic variables) defined for that input.
Fuzzy rule . An IF-THEN rule that explains observations orpredicts a behavior in a qualitative way, built up withfuzzy linguistic variables connected by logical opera-tors (AND, OR, NOT, etc .) . A rule consists of anantecedent expression and a consequent expression.The latter can only be true if the antecedent is alsotrue.
Fuzzy rule-base . A set of fuzzy rules constituting aqualitative model of the behavior of a physical system.
Fuzzy rule activation . The activation of a rule within arule-base depends on its explanatory or predictivepower . It is proportional to the degree of truth of theantecedent when the rule is used for prediction, and isproportional to the degree of truth both of antecedentand of consequent when the rule is used to explain aninput/output observation . Faced with an specific input,only a subset of the rules forming the base is activatedand just this subset accounts for the given response.
Fuzzy implication . Analogous to Boolean implication,saying that the degree of truth of a rule's consequentcan never be less than the degree of truth of thecorresponding antecedent. In fact, this is the definitionof a rule.
Input parameter vector. The vector formed by all signifi-cant parameters featuring a wheelchair-user configura-tion. The parameters can be measured and the wholeset of measured parameter vectors builds up the
15.observation matrix.
Output response . A subjective judgment, expressed incategorical linguistic terms, about a specific feature ofthe wheelchair-user configuration.
Training data set. A set of parameter vectors labeledaccording to their corresponding output response andused to train the fuzzy expert system.
Validation data set . A set of parameter vectors that isindependently and randomly chosen from the wholeobservation matrix and used to test the performance of
19.the fuzzy expert system.
10.
Cooper RA . Manual wheelchair design . In : Rehabilitationengineering, applied to mobility and manipulation . Bristol,UK: Institute of Physics Publ; 1995.
2. Van der Woude LHV, Meijs PJM, Van der Grinten BA, BoerYA. Ergonomics of manual wheelchair propulsion . Commis-sion of the European Communities, COMAC-BME.Amsterdam : IOS Press; 1993.
3. Roebroeck ME, Van der Woude LHV, Rozendal RH.Methodology of consumer evaluation of hand propelledwheelchairs . Commission of the European Communities,COMAC-BME. Milano, Italy : Edizioni Pro Juventute ; 1991.
4. Batavia AI, Hammer G . Toward the development of generalconsumer criteria for the evaluation of assistive devices(technical report) . Washington DC : National RehabilitationHospital ; 1990.
5. Ohlin P, Fagerberg G, Lagerwall T. Technology assistingdisabled and older people in Europe . The HEART study.Stockholm: The Swedish Handicap Institute ; 1995.Zadeh LA . Fuzzy sets . Information Control 1965 ; 8 :338-53.Zimmermann HI . Fuzzy set theory and its applications.Boston : Kluver Publ ; 1991.
8. Adlassnig KP. Fuzzy set theory in medical diagnosis . IEEETrans Syst Man Cybern 1986 ;16(12)Apr :260-5.
9. Watanabe H, Yakowenko WJ, Kim Y-M, Anbe Y, Tobi T.Application of fuzzy discrimination analysis for diagnosis ofvalvular heart disease . IEEE Trans Fuzzy Syst 1994;2(4)Nov :267-76.Duckstein L, Blinowska A, Verroust J . Fuzzy classification ofpatient state with application to electrodiagnosis of peripheralpolyneuropathy . IEEE Trans Biomed Eng 1995;42(8)Aug :786-92.
11 . Horikawa S-I, Furuhashi T, Uchikawa Y . On fuzzy modellingusing fuzzy neural networks with the back propagationalgorithm . IEEE Trans Neural Networks 1992 ;3(5)Sept :801-6.Sun C-T. Rule-base structure identification in an adaptive-network-based fuzzy inference system . IEEE Trans FuzzySyst 1994 ;2(1) Feb :64-73.Fu L . Rule generation from neural networks . IEEE Trans SystMan Cyber 1994;24(8) August :1114-24.Wang L-X, Mendel JM. Generating fuzzy rules by learningfrom examples . IEEE Trans Syst Man Cyber 1992;22(6)Nov/Dec :1414-27.Kosko B . Neural networks and fuzzy systems : a dynamicalsystems approach to machine intelligence, Englewood Cliffs,NJ : Prentice-Hall ; 1992.Yang M-S, Chen C-T. On strong consistency of the fuzzygeneralized nearest neighbor rule . Fuzzy Sets Syst1993 ;60(3):273-81.Goldberg DE . Genetic algorithms in search, optimization andmachine learning . Reading, MA: Addison-Wesley ; 1989.Homaifar A, McCormick E . Simultaneous design of member-ship functions and rule sets for fuzzy controllers using geneticalgorithms . IEEE Trans Fuzzy Syst 1995 ;3(2) May:129-39.Perneel C, Themlin J-M, Renders J-M, Acheroy M . Optimiza-tion of fuzzy expert systems using genetic algorithms and
12.
13.
14.
16.
17.
18.
6.7 .
107
CLINICAL REPORT :
Fuzzy Logic and Technical Aids
neural networks . IEEE Trans Fuzzy Syst 1995 ; 3(3) Aug:30012 .
to buy a wheelchair) . Washington, DC: Paralyzed Veterans ofAmerica ; 1994.
20 . Tortosa
L,
Page
A,
Ferreras
A,
et
al .
Gufa
de 25 . Zadeh LA. Is probability theory sufficient for dealing with
21 .
recomendaciones para el diseno y la seleccion de mobiliariode oficina para usuarios de silla de ruedas . Madrid, Spain:Ministerio de Asuntos Sociales ; 1995.Anderson
TW .
An
introduction
to multivariate
statistical 26 .
uncertainty
in
artificial
intelligence :
a
negative
view .
In:Kanal LN, Lemmer JF, editors . Uncertainty in ArtificialIntelligence. Amsterdam : North-Holland; 1986. p . 103—16.Sakuraba Y, Nakamoto T, Moriizumi T . New method of
22 .methods, 2nd ed . New York : John Wiley & Sons ; 1988.Fisher LD, van Belle G . Biostatistics . New York : John Wiley
learning vector quantization using fuzzy theory . Syst ComputJapan 1991 ;22(13) :93—103.
23 .& Sons Inc . ; 1993.Wilson AB, MacFarland SR . Types of wheelchairs, J Rehabil
24.Res Dev 1990;Clin Suppl 2 :104—16.Axelson P, Minkel J, Chesney D. A guide to wheelchair Submitted for publication May 7, 1996 . Accepted in revised formselection (how to use the ANSURESNA wheelchair standards January 28, 1997 .