Embed Size (px)
Citation preview
M. Kamel and A. Campilho (Eds.): ICIAR 2013, LNCS 7950, pp. 380–388, 2013. © Springer-Verlag Berlin Heidelberg 2013
Application of Enhanced-2D-CWT in Topographic Images for Mapping Landslide Risk Areas
Victor Vermehren Valenzuela1,2, Rafael Dueire Lins2, and Hélio Magalhães de Oliveira2
1 Universidade Estadual do Amazonas, Manaus-AM, Brazil 2 Universidade Federal de Pernambuco, Recife-PE, Brazil [email protected], {rdl,hmo}@ufpe.br
Abstract. There has been lately a number of catastrophic events of landslides and mudslides in the mountainous region of Rio de Janeiro, Brazil. Those were caused by intense rain in localities where there was unplanned occupation of slopes of hills and mountains. Thus, it became imperative creating an inventory of landslide risk areas in densely populated cities. This work presents a way of demarcating risk areas by using the bidimensional Continuous Wavelet Transform (2D-CWT) applied to high resolution topographic images of the mountainous region of Rio de Janeiro.
Keywords: Landslides, LiDAR, DEM, 2D-CWT, spectral power, wavelet, Fourier.
1 Introduction
Landslide is a phenomenon caused by the slipping of solid materials such as soils, rocks, vegetation, and construction debris along the terrain slopes, called hillsides. In general, it occurs in mountainous areas, where the original vegetation was removed. The landslide differs from erosion by the amount of mass transported at great speed. Such a phenomenon in populated areas may cause tragedies yielding losses both of lives and economic.
Unplanned urban occupation in cities of developing countries is a frequent phenomenon, overall in poor areas that become very densely inhabited. Cities in expansion move onto topographically inclined and geologically unstable land, such as the slopes of hills. Brazil, predominantly situated in the tropics, often has summer storms, which sometimes reaches very high pluviometric indices. During such a period, hillsides have the potential risk of landslide. In Brazil, especially in the state of Rio de Janeiro, tragedies caused by landslides on hills and mountainous urban areas have been occurring with alarming frequency in recent years. Unfortunately, they happened with high proportions in the first week of 2011, considered the worst natural accident in Brazil, and in a smaller scale again in the second week of 2013. To worsen such a tragic scenario, these accidents often happen in overcrowded areas inhabited by the poorest population of the city. Thus, the creation of a detailed inventory mapping areas at risk of landslides is the first step towards implementation of public policies for the urban occupation [1]. Traditional methods of mapping
Application of Enhanced-2D-CWT in Topographic Images 381
hillsides include digitization of topographic maps for regular and irregular contours, aerial photo interpretation, and the direct observation in the field of the morphology of the slopes [2]. However, each of these methods has limitations that can affect the accuracy of the resulting map such as resolution, vegetation, rugged terrain, different map drawing criteria, and lack of spatial and temporal patterns [3].
Currently the demand for models of high-resolution ground mapping produced from airborne measurements has increased. Although laser is not a new technology, its use in the acquisition of spatial data is relatively recent. Its use in systems such as LiDAR (Light Detection And Ranging) has shown excellent to acquire a large amount of information in a short time. It is a remote sensing technology with the aim of measuring the distance to a target or object of interest, using laser pulses. It can be used in collecting data for terrestrial digital modeling (DTM) and digital elevation models (DEM) where traditional methods were not adequate, especially in areas of difficult access [4].
Wavelets have lately gained prolific applications throughout an amazing number of areas, especially in Physics and Engineering. Both Continuous and Discrete Wavelet transforms (CWT and DWT, respectively) have emerged as a definitive tool of signal processing analysis and have proven to be superior to classical Fourier analysis in many situations. Wavelet analysis for their ability to examine the signal simultaneously in time and frequency has generated a number of sophisticated methods based on wavelets, and among them those who study the surface morphology of the seas [5] and land [6]. In the latter, despite the normalized power of terrains, the used wavelet made no energy normalization to increase the accuracy in the results. This paper applies the continuous wavelet transform (CWT) with the normalized wavelet to extract the topographical features of slopes from high resolution topographic data of through the power spectral variations within specific spatial frequency ranges and compared with the Fourier transform [7-8].
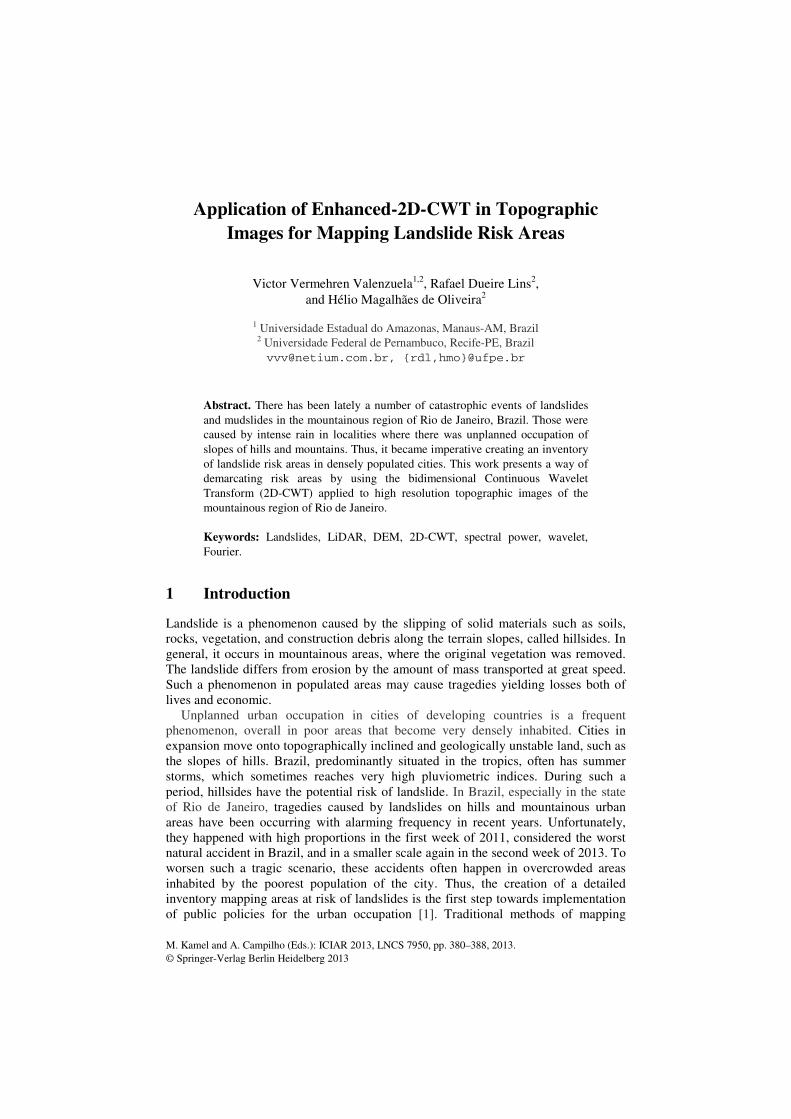
Due to the high latent risk of accidents, the selected area is the mountainous region of Rio de Janeiro - which have available inventory of high-resolution maps DEM obtained by LiDAR in [9]. There are also sites independently detailing the region studied. Figure 1 shows the map of the study areas.
Fig. 1. Map of high resolution DEM of the Mountain Region – Rio de Janeiro obtained with LiDAR, INPE Database, area 22S435 [9]
State of Rio
Zoomed Area
BRAZIL
382 V.V. Valenzuela, R.D. Lins, and H.M. de Oliveira
2 The Algorithm HillShade and Enhanced-2D-CWT
The application of digital image processing in this study is divided into two parts. First, one makes the application of continuous wavelet transform (2D-CWT) to quantify the topographic expressions of deep slopes and geologically unstable areas, mapping their locations in the areas of interest. The 2D-CWT transforms data into spatial frequency-position space, providing information about how the amplitude is distributed on spatial frequency at each position in the image. As the 2D DFT transformed the space domain into the frequency domain, it also provides consolidated information on how the amplitude of the topographic surface is distributed over a frequency spectrum that is used as a reference for comparison of results [10].
The other technique is the shade of hillsides [11], whose goal is to improve the display resolution greatly increasing the perception of a surface for analysis or graphical display. The foundation of this process is to apply the non-weighted gradient between neighboring image points (in this case, a topographic mapping). The result is a collection of vectors pointing in the direction of increasing values of the function F (altimetric values). The equation gradient used in inline functions (from MatLab™ [12], for example) is
ˆ ˆF FF
x yi j
δ δ
δ δ∇ = + (1)
This information is applied to a function that gets the hypothetical illumination surface by determining the illumination values for each cell of a matrix. This is done by creating a position for a hypothetical light source and calculating the illumination values for each cell in relation to its neighboring cells following the azimuth and slope parameters chosen. The function of shading (h) is given below.
255 ((cos( ).cos( )) sin( ).sin( ).cos( ))). zenith slope zenith slope azimuteh += (2)
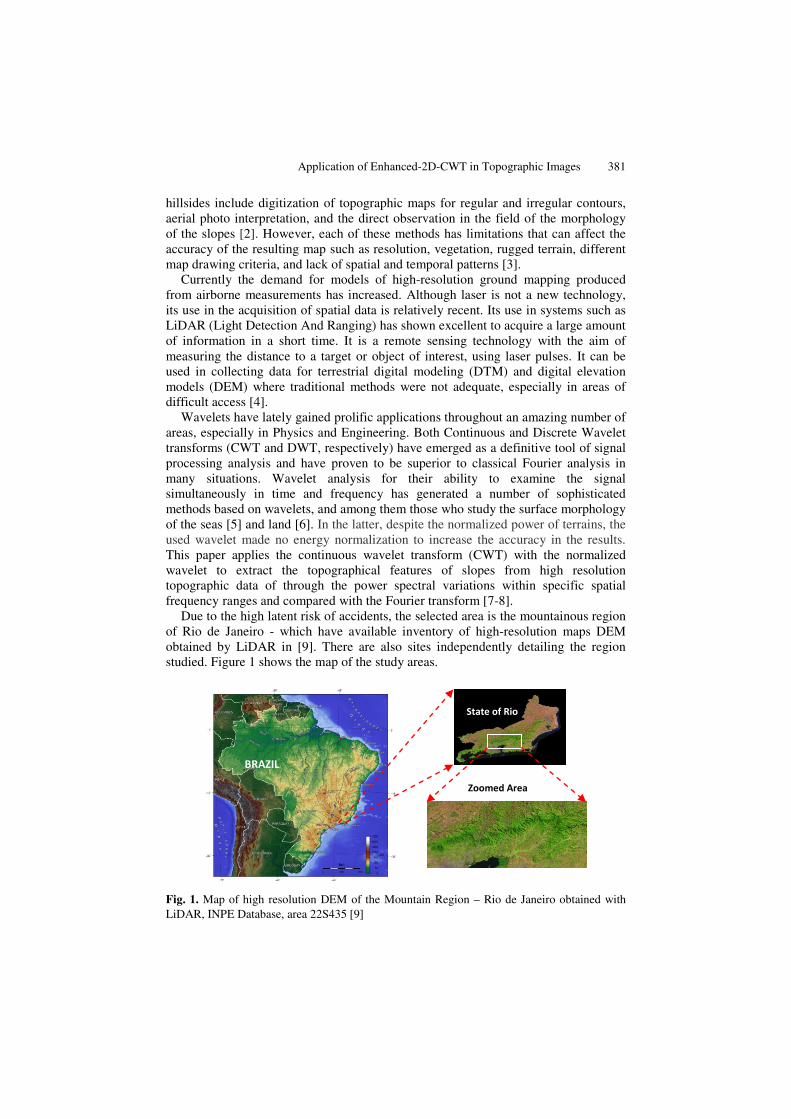
The high resolution DEM map of the region of study with 235º azimuth and elevation 45º is shown in Figure 2.
Fig. 2. Mountain region of Rio de Janeiro (referred in Fig. 1) with application of shading algorithm
Application of Enhanced-2D-CWT in Topographic Images 383
The equation of the 2D CWT of a continuous signal, g (x, y) with respect to wavelet function is defined as [13]
*1 ( , ) ( , ) ,( , , ) absx y x y dx dysCWT a b s g ψ∞ ∞
−∞ −∞= (3)
where ψ represents the family of wavelets with scale parameter s and location (a, b). The 2D-CWT is the convolution of g and ψ, and thus the transform coefficients CWT (a, b, s) provide a measure of the degree of correlation between wavelet ψ and g data at each point. When the value of s is high, ψ is dispersed and takes into account the characteristics of wavelength g; when the value of s is low, ψ is best localized in space and achieves a better correlation with contours g.
The 2D-CWT can also be estimated within a power spectrum calculating its variance on points Na× Nb in each scale of the energy wavelet function [13]:
2 212 ( , , )( ) | |
a bCWT N N CWT a b ss dadbσ = (4)
Equation (4), similarly to the Fourier power spectrum, provides a general measure of how the amplitude topographical features changes with frequency throughout the data set. However, as in Figure 3, a wavelet analysis of a given scale typically a bandpass of frequencies centered on a main frequency. Moreover, the DFT transform analyzes each frequency separately. Thus, this has the effect of smoothing the peaks in the power spectrum wavelet compared to its Fourier similar [14].
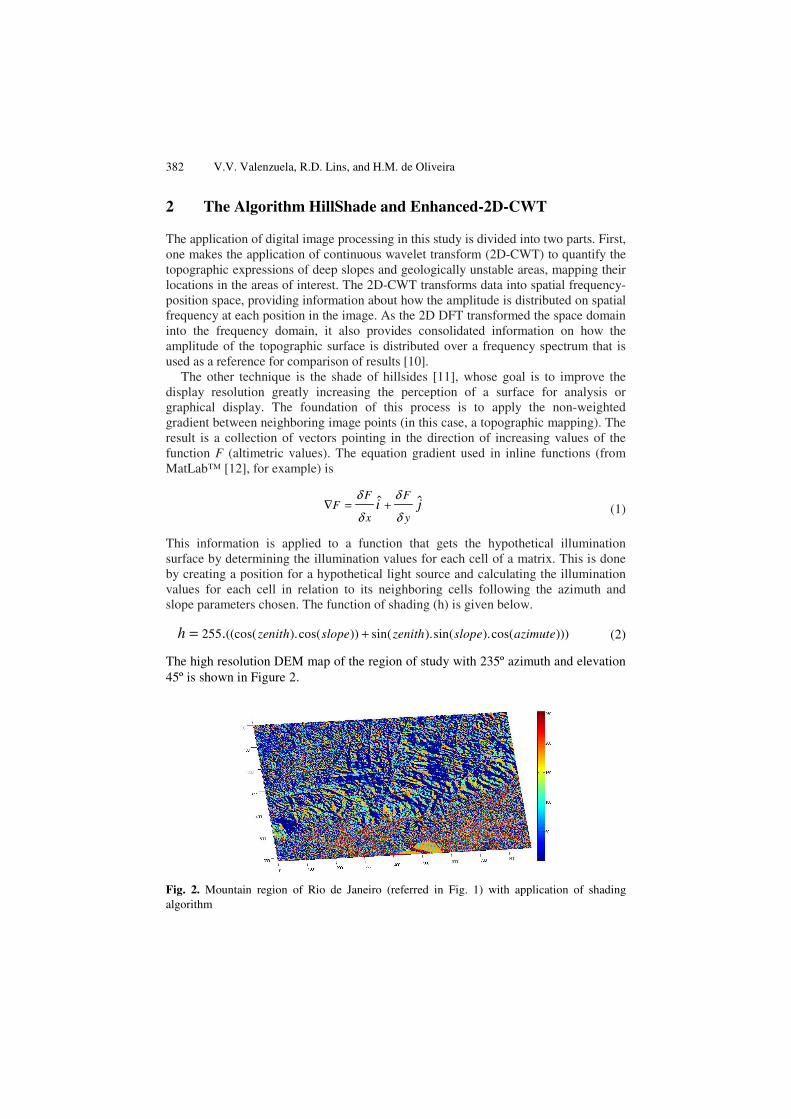
In the analysis, as its shape resembles the contours of the topography, the 2D Mexican Hat wavelet was used as wavelet mother, whose analytical expression is given by the following equations (time and frequency domains). Note that to ensure that wavelet transforms (3) at each scale s are directly comparable with each other and to other series of transformations, the 2D Mexican Hat wavelet was normalized to have unitary energy:
2 2122 2 ( )
2.5071 2( , ) ( ) x y
x y x y eψ − += − − and 2 2
4
52 22 2 ( )
32( , ) 32 ( ) u vu v u v e π
π π − +Ψ = +
(5)
Figure 3 shows the time and frequency domain plots of the normalized 2D Mexican hat wavelet (E=σ2 =s=1).
Fig. 3. (left) 2D Mexican wavelet, (right) its Fourier transform
384 V.V. Valenzuela, R.D. Lins, and H.M. de Oliveira
The Mexican hat is derived by the second derivative of a Gaussian function and has a wavelength 2πs / (5/2) 1/2 times the grid spacing [15]. Performing the convolution of wavelet Mexican 2D with the topographic data one obtains the derived amplitude values and specific wavelengths, including characteristic features of hillsides.
The Fourier analysis of two-dimensional topographic images provides quantitative information on the amplitude, orientation, and shape of periodic information on a range of spatial frequencies [10]. The DFT of a 2D data set f(x, y) with M × N nodes uniformly spaced and their respective power spectrum estimated by the DFT periodogram [16]
( )1 12
0 0
( , ) ( , )M N
j m nk lM N
m nF k l f m n e
π− − − +
= ==
and 2
2 21 | ( , ) |
DFT M Np F k l= (6)
Whereas mapping landslides the periodogram provides a measure of amplitude of topographical features within a DEM in orientations and specific wavelength.
3 Results
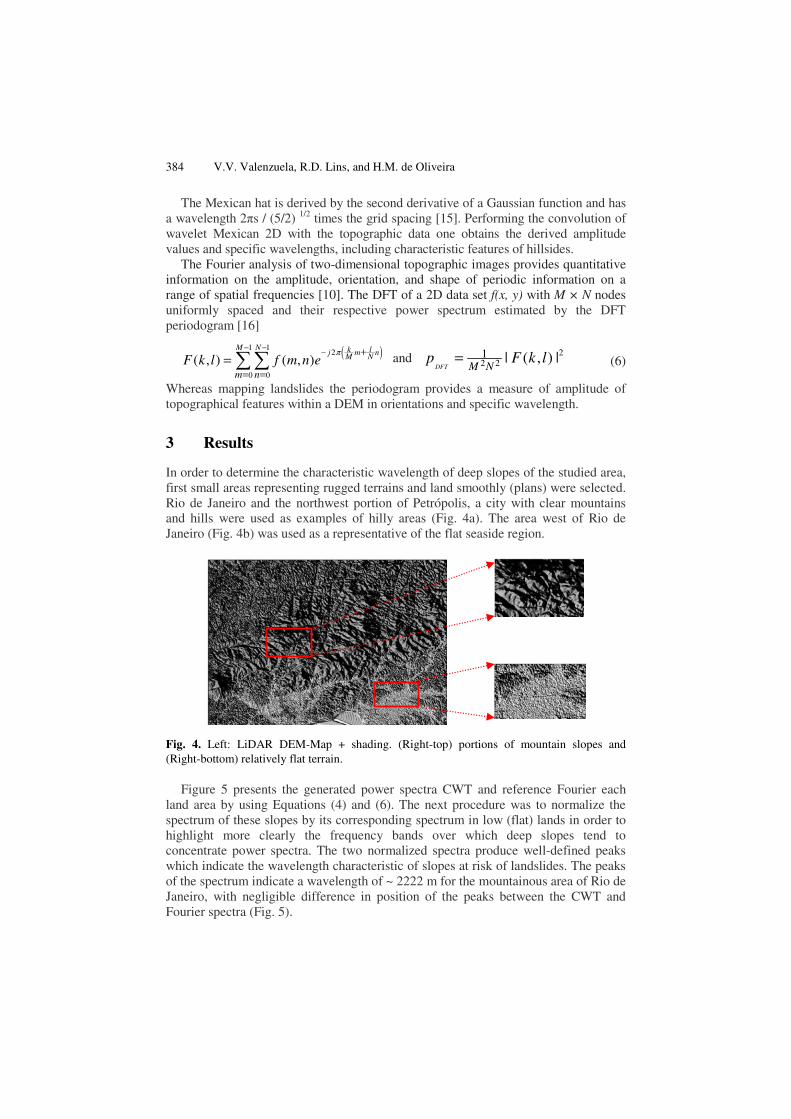
In order to determine the characteristic wavelength of deep slopes of the studied area, first small areas representing rugged terrains and land smoothly (plans) were selected. Rio de Janeiro and the northwest portion of Petrópolis, a city with clear mountains and hills were used as examples of hilly areas (Fig. 4a). The area west of Rio de Janeiro (Fig. 4b) was used as a representative of the flat seaside region.
Fig. 4. Left: LiDAR DEM-Map + shading. (Right-top) portions of mountain slopes and (Right-bottom) relatively flat terrain.
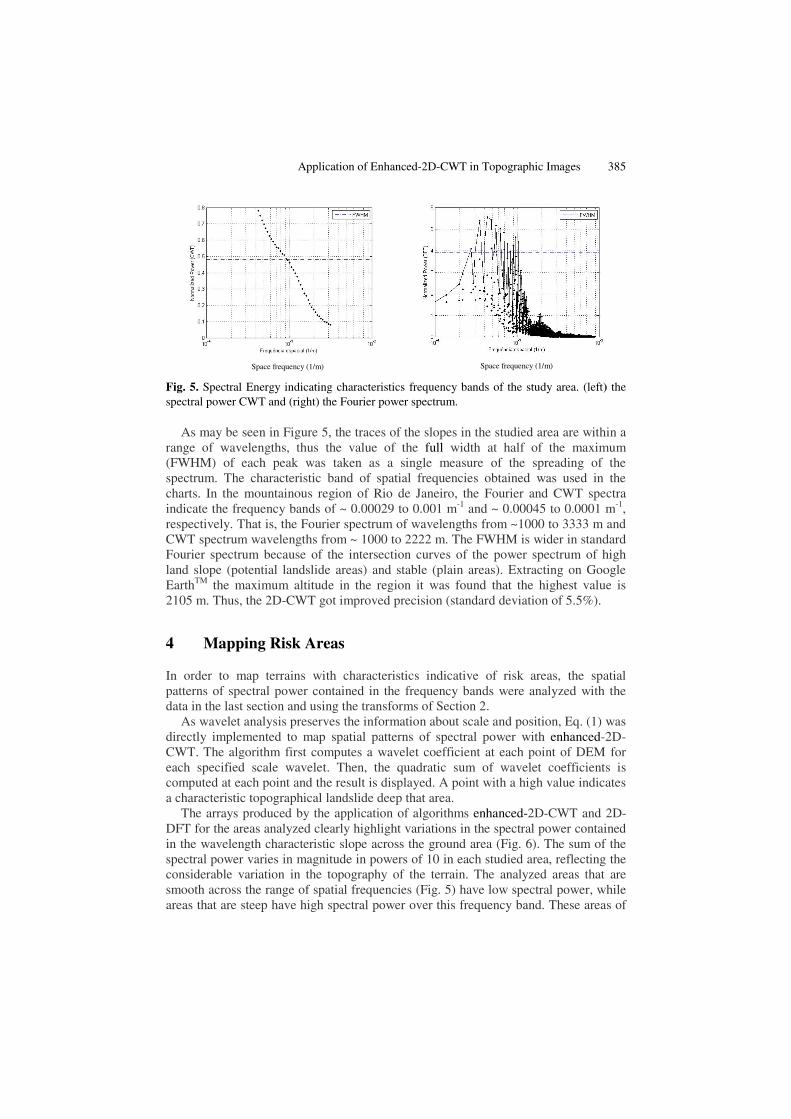
Figure 5 presents the generated power spectra CWT and reference Fourier each land area by using Equations (4) and (6). The next procedure was to normalize the spectrum of these slopes by its corresponding spectrum in low (flat) lands in order to highlight more clearly the frequency bands over which deep slopes tend to concentrate power spectra. The two normalized spectra produce well-defined peaks which indicate the wavelength characteristic of slopes at risk of landslides. The peaks of the spectrum indicate a wavelength of ~ 2222 m for the mountainous area of Rio de Janeiro, with negligible difference in position of the peaks between the CWT and Fourier spectra (Fig. 5).
Ap
Space frequency (1
Fig. 5. Spectral Energy indicaspectral power CWT and (righ
As may be seen in Figurrange of wavelengths, thu(FWHM) of each peak wspectrum. The characteristcharts. In the mountainousindicate the frequency bandrespectively. That is, the FoCWT spectrum wavelengthFourier spectrum because land slope (potential landslEarthTM the maximum altit2105 m. Thus, the 2D-CWT
4 Mapping Risk A
In order to map terrains patterns of spectral power data in the last section and u
As wavelet analysis presdirectly implemented to mCWT. The algorithm first each specified scale wavecomputed at each point anda characteristic topographic
The arrays produced by DFT for the areas analyzed in the wavelength characterspectral power varies in maconsiderable variation in thsmooth across the range of areas that are steep have hig
pplication of Enhanced-2D-CWT in Topographic Images
1/m)
Space frequency (1/m)
ating characteristics frequency bands of the study area. (left)ht) the Fourier power spectrum.
re 5, the traces of the slopes in the studied area are withius the value of the full width at half of the maximwas taken as a single measure of the spreading of tic band of spatial frequencies obtained was used in s region of Rio de Janeiro, the Fourier and CWT specds of ~ 0.00029 to 0.001 m-1 and ~ 0.00045 to 0.0001 mourier spectrum of wavelengths from ~1000 to 3333 m hs from ~ 1000 to 2222 m. The FWHM is wider in standof the intersection curves of the power spectrum of hlide areas) and stable (plain areas). Extracting on Gootude in the region it was found that the highest value
T got improved precision (standard deviation of 5.5%).
Areas
with characteristics indicative of risk areas, the spacontained in the frequency bands were analyzed with using the transforms of Section 2. serves the information about scale and position, Eq. (1) w
map spatial patterns of spectral power with enhanced-2computes a wavelet coefficient at each point of DEM
elet. Then, the quadratic sum of wavelet coefficientsd the result is displayed. A point with a high value indicacal landslide deep that area.
the application of algorithms enhanced-2D-CWT and 2clearly highlight variations in the spectral power contai
ristic slope across the ground area (Fig. 6). The sum of agnitude in powers of 10 in each studied area, reflecting he topography of the terrain. The analyzed areas that spatial frequencies (Fig. 5) have low spectral power, whgh spectral power over this frequency band. These area
385
) the
in a mum
the the
ctra m-1, and
dard high ogle e is
atial the
was 2D-for
s is ates
2D-ined the the are
hile s of
386 V.V. Valenzuela, R.D. Lins, and H.M. de Oliveira
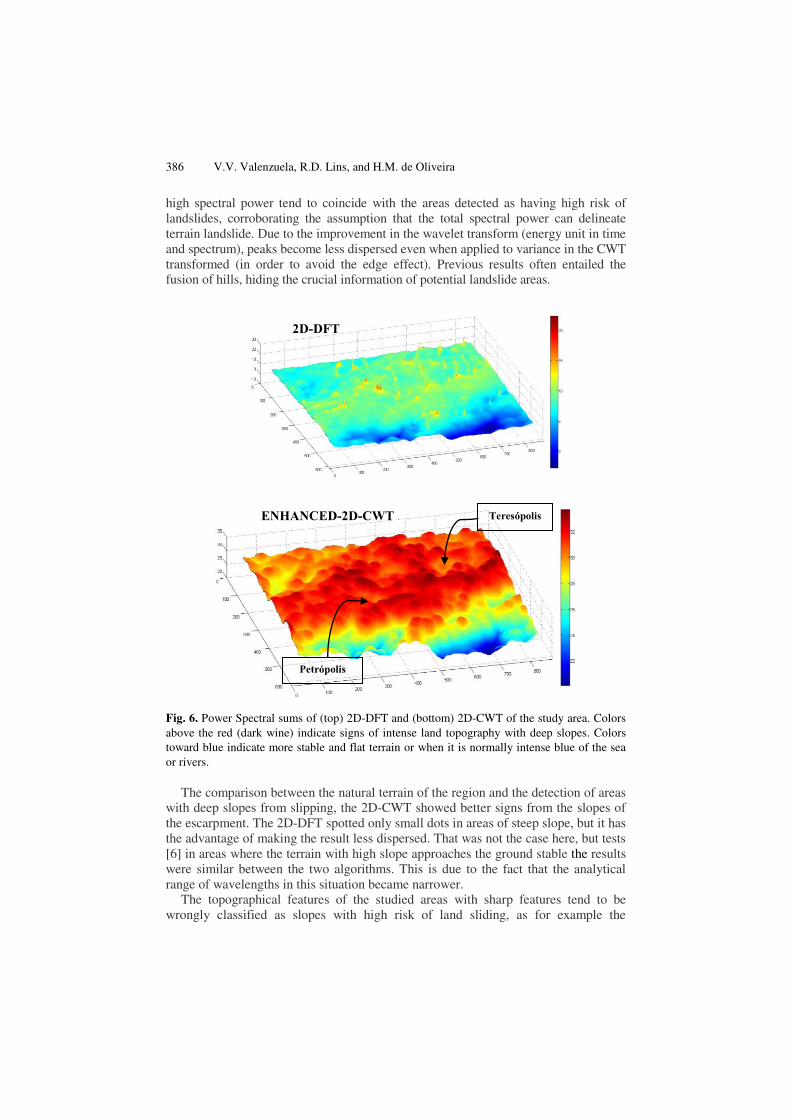
high spectral power tend to coincide with the areas detected as having high risk of landslides, corroborating the assumption that the total spectral power can delineate terrain landslide. Due to the improvement in the wavelet transform (energy unit in time and spectrum), peaks become less dispersed even when applied to variance in the CWT transformed (in order to avoid the edge effect). Previous results often entailed the fusion of hills, hiding the crucial information of potential landslide areas.
Fig. 6. Power Spectral sums of (top) 2D-DFT and (bottom) 2D-CWT of the study area. Colors above the red (dark wine) indicate signs of intense land topography with deep slopes. Colors toward blue indicate more stable and flat terrain or when it is normally intense blue of the sea or rivers.
The comparison between the natural terrain of the region and the detection of areas with deep slopes from slipping, the 2D-CWT showed better signs from the slopes of the escarpment. The 2D-DFT spotted only small dots in areas of steep slope, but it has the advantage of making the result less dispersed. That was not the case here, but tests [6] in areas where the terrain with high slope approaches the ground stable the results were similar between the two algorithms. This is due to the fact that the analytical range of wavelengths in this situation became narrower.
The topographical features of the studied areas with sharp features tend to be wrongly classified as slopes with high risk of land sliding, as for example the
Petrópolis
Teresópolis
2D-DFT
ENHANCED-2D-CWT
Application of Enhanced-2D-CWT in Topographic Images 387
mountain region in the area north of the State of Rio. Those spikes produce high energy spectral peaks in the Fourier analysis are necessary because large amplitudes of sinus and cosines to capture sudden changes in the analyzed data. In other words, any analyzing window that contains an abrupt change in altitude is therefore a sum of spectral energy abnormally high. The analysis with Mexican hat or Airy wavelets also tends to highlight edges because of their high inclination.
5 Conclusions and Lines for Further Work
Maps with inventory risk areas provide valuable information to scientists and policy-making, but its creation remains a time-consuming and subjective. The growing availability of high-resolution DEMs derived from LiDAR offers new opportunities to improve efficiency and objectivity of mapping spatial and temporal patterns of unstable slopes. However, few studies until now have explored LiDAR derived DEM to investigate landslides in resolutions on the scale of meters rather than stripes of kilometers of land.
Both techniques of digital image processing, shading, and 2D-CWT can be used to quantify morphological characteristics using high-resolution topographic data, and map how these characteristics vary spatially. Power spectra produced by 2D-Fourier and 2D-CWT analysis define the characteristic wavelengths of landslide areas within the areas of study. The sum of the power spectrum over a particular band of wavelengths provides a measure of the intensity of the characteristic topographical with risks of slippage at any point in the dataset in hundreds of square kilometers.
The enhanced 2D-CWT applied on the image of areas with big altitude difference between the flat land and areas of steep slopes yielded greater precision in the altimetry mapping of the region.
The approach presented here is wide-ranging and can be used to guide the search of land slide risk areas depending on surface contours. Nevertheless further information, such as the kind of soil and vegetation, existing constructions on it, etc., is also needed to better evaluate the risks involved. In the case of the State of Rio de Janeiro (Brazil) there is already some information that can be used to better evaluate the accident risks involved. Unfortunately, such information is still not incorporated in DEM maps yet.
References
1. Filho, A.R., Cortez, A.T.C.: A problemática socioambiental da ocupação urbana em áreas de risco de deslizamento da Suíça Brasileira. Revista Brasileira de Geografia Física 03, 33–40 (2010)
2. Florenzano, T. G. (Org.).: Métodos e Modelos de Previsão de Movimentos de Massa. Oficina de Textos, São Paulo (2008)
3. Parise, M.: Landslide Mapping Techniques and Their Use in the Assessment of the Landslide Hazard. Phys. Chem. Earth (C) 26(9), 697–703 (2001)
4. Marcos, et al.: LiDAR: Princípios e aplicações florestais. Pesquisa Florestal Brasileira, Colombo 30(63), 231–244 (2010)
388 V.V. Valenzuela, R.D. Lins, and H.M. de Oliveira
5. Chamoli, A.: Wavelet Analysis of Geophysical Time Series. e-Journal Earth Science India 2(IV), 258–275 (2009)
6. Booth, A.M., Roering, J.J., Perron, J.T.: Automated landslide mapping using spectral analysis and high-resolution topographic data: Puget Sound lowlands, Washington, and Portland Hills, Oregon. Geomorphology 109, 132–147 (2009)
7. Lang, W.C., Forinash, K.: Time-frequency analysis with the continuous wavelet transform. Am. J. Phys. 66(9) (1998)
8. Kirby, L.F.: Which wavelet best reproduces the Fourier power spectrum? Computers & Geosciences 31, 846–864 (2005)
9. TOPODATA/INPE – Brazilian Geomorphometrics Database, http://www.dsr. inpe.br/topodata/acesso.php (last accessed on January 10, 2013)
10. Perron, J.T., Kirchner, J.W., Dietrich, W.E.: Spectral signatures of characteristic spatial scales and nonfractal structure in landscapes. Journal of Geophysical Research 113, F04003 (2008)
11. Burrough, P.A., McDonell, R.A.: Principles of Geographical Information Systems, p. 190. Oxford University Press, New York (1998)
12. Tanennbaum, B.: Image Processing ToolboxTM 4 User’s Guide. The MathWork Inc., MA (2012)
13. Addison, P.S.: The Illustrated Wavelet Handbook: Introductory Theory and Applications in Science, Engineering, Medicine and Finance. Institute of Physics Publishing, Bristol (2002)
14. Strang, G.: Wavelet transforms versus Fourier transforms. Bull. Amer. (1993) 15. Torrence, C., Compo, G.P.: A practical guide to wavelet analysis. Bulletin of the American
Meteorological Society 79(1), 61–78 (1998) 16. Proakis, J.G., Manolakis, D.G.: Digital Signal Processing, Principles, Algorithms and
applications, 4th edn. Pearson (2007)

![2'. :XbRdbbX^] )( )* - Harry Bhadeshia · Ra^bb&bTRcX^]P[ PaTP ^U cWT b_TRX\T]' IX\X[Pa[h% cWT T]VX]TTaX]V bcaPX]% T% Xb cWT ... cdP[[h P _^X]c Xb aTPRWTS fWTaT cWT STRaTPbT X] PaTP](https://img.pdfslide.us/doc/110x75/5bfe39fd09d3f23f5d8b8ba1/2-xbrdbbx-harry-rabbbtrcxp-patp-u-cwt-btrxt-ixxpah.jpg)


![User Guide - freesat-content.tangentlabs.co.uk · b^RZTc ^] cWT QPRZ ^U cWT aTRTXeTa P]S P B20AC b^RZTc ^] cWT eXST^ ^a 3E3 aTR^aSTa 2WTRZ cWT aTR^aSTa{b \P]dP[ U^a VdXSP]RT H^d RP]](https://img.pdfslide.us/doc/110x75/5ec417b24eac4d06cc69a8f6/user-guide-freesat-brztc-cwt-qprz-u-cwt-atrtxeta-ps-p-b20ac-brztc-cwt.jpg)