Embed Size (px)
Citation preview

Application of Customer Experience and Business Process Re-
engineering in the Telecommunications Industry
by
RENEILWE KHUTSO SELESHO
25025831
Submitted in partial fulfilment of the requirements for the degree of
BACHELORS OF INDUSTRIAL ENGINEERING
in the
FACULTY OF ENGINEERING, BUILT ENVIRONMENT AND INFORMATION
TECHNOLOGY
UNIVERSITY OF PRETORIA
October 2009

2
Executive summary
Within the telecommunications industry, there are vast management methods invested in
order to provide a competitive edge and loyalty amongst customers. Customer satisfaction
remains the primary goal as a happy customer ensures sustainable profitability and overall
business success. Customer experience encompasses the customers‟ interaction with a
company‟s service and/or process. Due to the growing realisation that customer-focus
should form a large part of a business strategy, the concept of customer experience
emerged as a performance management tool and means to improve business processes.
However, many companies still fail to measure and improve business processes based on
customer experience. This project shows how Business Process Re-engineering and
Customer Experience can couple to bring about impactful change to a cellular network
provider by providing customers with what they want. Five processes are analysed so as to
find out what it is that customers require within these processes. A Quality Function
Deployment model is used to perform calculations that reveal the cell phone repairs process
as the one to give the most profitable return after process re-design. A conceptual repairs
process model will thus reconcile customer requirements and the given business processes.
3
Table of contents
List of figures ........................................................................................................................ 6
List of Tables ........................................................................................................................ 6
1.1 Introduction ..................................................................................................................... 7
1.2 Company background ..................................................................................................... 8
1.3 Problem statement .......................................................................................................... 9
1.4 Aim and objectives of study ............................................................................................. 9
1.5 Project scope ................................................................................................................ 10
1.5.1 Deliverables ........................................................................................................... 10
1.5.2 Research methodology........................................................................................... 10
1.6 Chapter summary .......................................................................................................... 10
2.1 Customer Experience .................................................................................................... 12
2.2 Business Re-engineering .............................................................................................. 14
2.2.1 Process Maps ............................................................................................................ 15
2.2.2 eTOM ......................................................................................................................... 16
2.2.3 Benchmarking ............................................................................................................ 18
2.3 Quality Function Deployment (QFD).............................................................................. 19
2.3.1 Introduction ................................................................................................................ 19
2.3.2 QFD and quality ......................................................................................................... 19
2.3.3 QFD and the customer ............................................................................................... 20
2.3.4 House of Quality ......................................................................................................... 20
2.3.4.1 Customer Needs ..................................................................................................... 21
2.3.4.2 Relative importance ratings of customer needs ....................................................... 21
2.3.4.3 Competitors ............................................................................................................. 21
2.3.4.4 Customer competitive analysis ................................................................................ 21
2.3.4.5 Technical measures ................................................................................................ 22
2.3.4.6 HOQ model ............................................................................................................. 22

4
2.4 Telecommunications industry in South Africa ................................................................ 24
2.5 Chapter summary .......................................................................................................... 26
3.1 Process identification .................................................................................................... 27
3.2 As-Is Review and process map analysis ....................................................................... 27
3.2.1 Staff training process ................................................................................................. 27
3.2.2 Cell phone repairs process ......................................................................................... 28
3.2.3 New contract deals ..................................................................................................... 29
3.2.4 Contract upgrades process ........................................................................................ 30
3.2.5 In-store customer service process .............................................................................. 31
3.3 Customer experience analysis ...................................................................................... 32
3.3.1 Customer survey ........................................................................................................ 32
3.3.2 Descriptive research .................................................................................................. 32
3.3.3 Sampling method ....................................................................................................... 33
3.3.4 Sample distribution ..................................................................................................... 33
3.4 Chapter summary .......................................................................................................... 34
4.1 Quality Function Deployment (QFD) model results ........................................................ 35
4.1.1 Customer satisfaction results ..................................................................................... 37
4.1.2 Competitive evaluation results .................................................................................... 37
4.1.3 Raw score .................................................................................................................. 38
4.1.4 Process performance results ...................................................................................... 39
4.1.3 Importance ranking results ......................................................................................... 39
4.1.4 Process impact ranking .............................................................................................. 40
4.2 Recommendations ........................................................................................................ 40
4.2.1 Handset availability .................................................................................................... 41
4.2.2 Reduced process time ................................................................................................ 41
4.2.2.1 Decentralisation ...................................................................................................... 42
4.2.2.2 Multi-level technical support .................................................................................... 43

5
4.2.2.3 Communication ....................................................................................................... 44
4.3 Re-engineered repairs process representation .............................................................. 44
4.4 Chapter summary .......................................................................................................... 46
APPENDIX A ...................................................................................................................... 51
APPENDIX B ...................................................................................................................... 53
APPENDIX C ...................................................................................................................... 55
APPENDIX D ...................................................................................................................... 57
APPENDIX E ...................................................................................................................... 59

6
List of figures
Figure 1: Traditional functional hierarchy focus. Peppard & Rowland (1995) ....................... 15
Figure 2: BPR organisation view. Peppard & Rowland (1995) ............................................. 15
Figure 3: IDEF0 process map. Peppard & Rowland (1995) ................................................. 16
Figure 4: eTOM Framework (Infratek 2007) ........................................................................ 18
Figure 5: Benchmarking stages. Adapted from Ball, McCulloch, Geringer, Minor & McNett,
2005. ................................................................................................................................... 19
Figure 6: Staff training process map .................................................................................... 28
Figure 7: Cell phone repairs process map ........................................................................... 29
Figure 8: New contract deals process ................................................................................. 30
Figure 9: Contract upgrades process .................................................................................. 31
Figure 10: In-store customer service process ...................................................................... 32
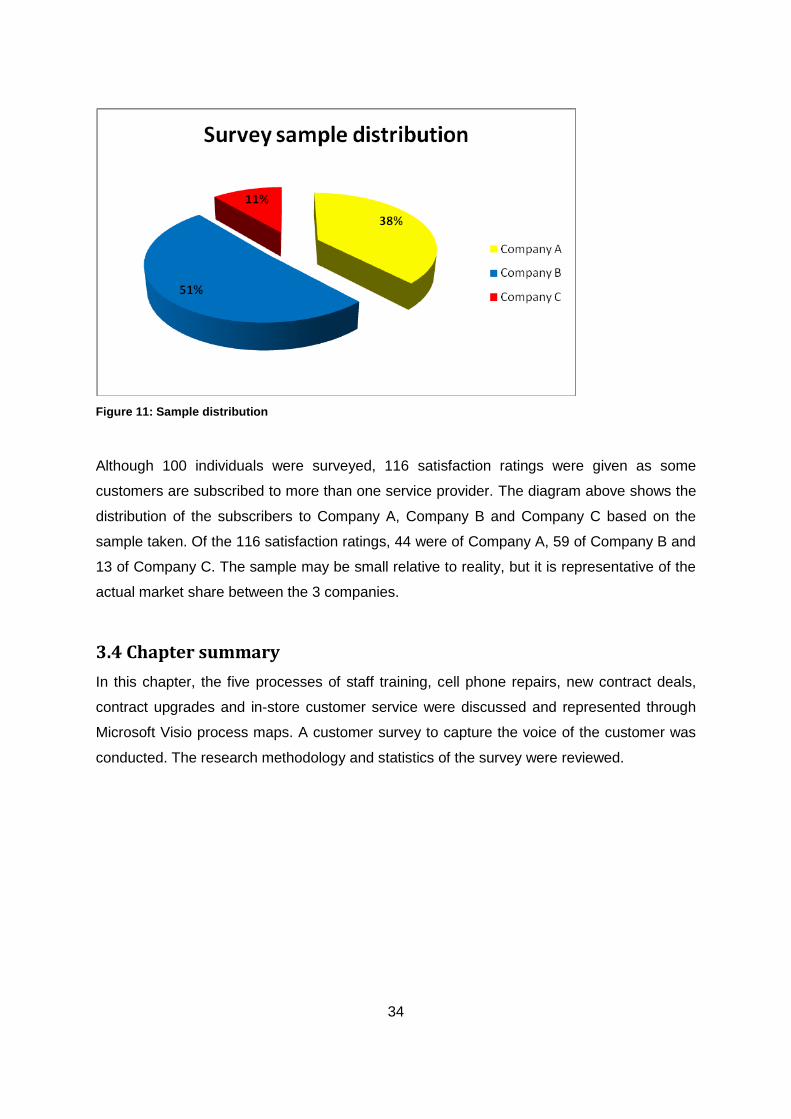
Figure 11: Sample distribution ............................................................................................. 34
Figure 12: Company A satisfaction ratings .......................................................................... 37
Figure 13: Customer satisfaction competitive evaluation ..................................................... 38
Figure 14: Process raw score .............................................................................................. 38
Figure 15: Process performance ......................................................................................... 39
Figure 16: Importance rank ................................................................................................. 40
Figure 17: Repairs process map with decentralisation ........................................................ 43
Figure 18: Repairs process parent diagram ........................................................................ 45
Figure 19: Repairs process child diagram ........................................................................... 46
List of Tables
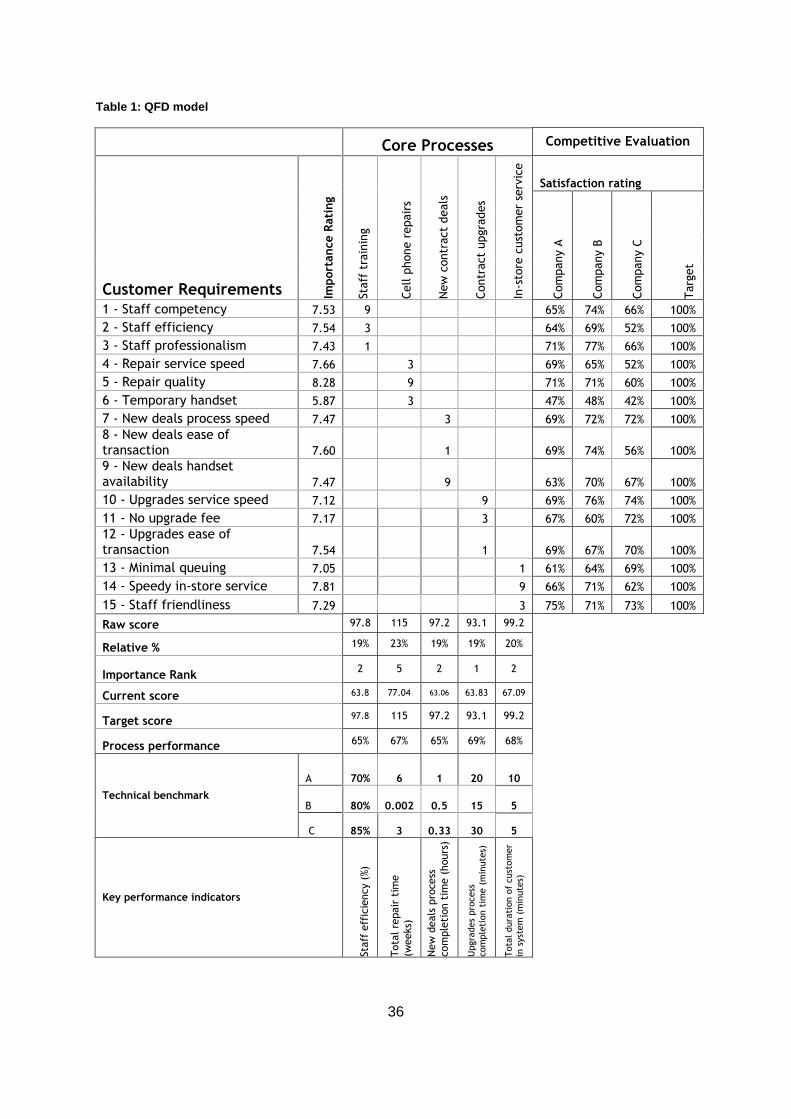
Table 1: QFD model ............................................................................................................ 36
Table 2: Customer survey ................................................................................................... 51
Table 3: Customer requirements importance ratings ........................................................... 53
Table 4: Company A satisfaction ratings ............................................................................. 55
Table 5: Company B satisfaction ratings ............................................................................. 57
Table 6: Company C satisfaction ratings ............................................................................. 59

7
Chapter 1: Introduction and background
1.1 Introduction
Customer experience summarises all the interactions the customer has through the entire
process of service or product provision. Pine and Gilmore explored the concept of customer
experience in their Harvard Business Review article. Here they stated that successful
businesses influence people through engaging, authentic experiences that render personal
value (Pine and Gilmore, 1998). According to Bell (1992), the core of service distinction is a
human feeling. After a service has been delivered, the customer is not left with an object but
with a memory of dazzlement, pleasure, satisfaction, disappointment or victimisation.
It can be concluded that customer experience can be a distinguishing factor between a
successful product and/or service delivery and one where the company has failed dismally.
This is because ultimately, customer satisfaction remains the primary goal of each business.
Customer recruitment and customer loyalty are both determined by customer experience.
Galbreath & Rogers (1999) define Customer Relations Management as “the activities a
business performs to identify, qualify, acquire, develop and retain increasingly loyal and
profitable customers by delivering the right product or service, to the right customer through
the right channel at the right time and the right cost” (Galbreath & Rogers 1999:163).
The importance of customer experience is evident, yet there still remains a huge gap in the
market for the study of customer experience and the subsequently adequate customer
experience management and solutions. Academia and industry are aware of these concepts.
It has also been debated whether Customer Relationship Management is a fad or a
substantial contribution to management. Kotze, Prinsloo and du Plessis (2003) conclude that
“relationship marketing has proven itself as an orientation founded on substance”. In their
New service development literature survey, Smit & du Plessis (2000) conclude that
“customer orientation is a fundamental key success factor in service development”. They
continue to state that “Service quality is to adapt the process to the logic of the customer‟s
behaviour and to achieve a satisfied customer experience”. This study is centralised around
the telecommunications industry. According to Lannon (1995), it is absolutely essential for
cellular service providers to start learning about customer care. Cellular customers do not
change carriers arbitrarily. Soon the day will come when all network services will have to

8
know as much about customer preferences as retailers or entertainment companies do
today.
Slongo (1999) states: “In South Africa, the mobile telecommunications industry has, since its
inception six years ago, primarily focused its strategies on customer acquisition in order to
grow its customer base. However, as the South African customer becomes increasingly
demanding, the industry will have to shift its strategic focus to encompass a retention
strategy, particularly for its most valuable and profitable customers in order to prevent them
from turning to the competition”.
1.2 Company background
The study at hand is on three companies that are amongst South Africa‟s largest
telecommunications companies. The companies in discussion will henceforth be referred to
as Company A, Company B and Company C.
Company A has increased its bounds out of South Africa and is now competitive over Africa
as a whole. Company A‟s vision is “to become the leading provider of communication
services on the African Continent, linking nations by providing an affordable, accessible and
quality service that is a catalyst for economic development.” The company continues to state
that “Company A‟s leadership across African soil has earned it a formidable reputation for
operational and service excellence, technological superiority and an ability to adapt and
evolve to meet ever-changing needs.”
Company B is the largest communications network operator in South Africa. It has the
largest customer base of the three networks and generates the highest revenues. The goal
for Company B is to be the leading telecommunications service provider within Southern
Africa.
Company C is the youngest and smallest of the three networks and makes a claim to
providing above standard products and services to its customers.
This study on customer experience and business process re-engineering is thus relevant to
these competing telecommunications companies that will be focused on.

9
1.3 Problem statement
As stated in section 1.2, “quality service” and “service excellence” are mentioned in the
vision of Company A. Thus customer satisfaction should be expected from its customers.
However, research from hellopeter.com proves that this is not necessarily a reality. Below
are Company A‟s customer complaints indicating dissatisfaction and poor customer
experience:
“The gent who was assisting my husband and I was so impatient with us that we
realised we were wasting our time there. We left the store frustrated and completely baffled
by some of the info he had given us upon much prompting. It was almost as though we
were taking up this person‟s precious time as he was constantly walking away and busy on
his cell phone whilst we were trying to talk to him. His manner of speaking was just so off
hand.”
It is clear that this customer had a negative experience while visiting the store mainly due to
the attitude of the consultant. Another customer had a similar experience:
“I would like to vent my disgust with the appalling service which I‟ve been getting from
Company A. I've been having problems with them since I signed on last September.
Company A has competition and they should consider that a reminder. Their service is
unacceptable; I wish those who still want to join read this.”
These are two of the many complaints from customers in telecommunications industry. This
shows the urgency in which the reconciliation between customer requirements and
expectations and business processes should be addressed.
1.4 Aim and objectives of study
The aim of this study is to design a conceptual model that will align customer requirements
with business processes and reconcile the difference by improving business processes.
Listed below are the objectives of the study.
1. To compile an in-depth literature review on customer experience and business
process engineering.
2. To highlight customer requirements in the telecommunications industry.
3. To analyse business processes within the telecommunications industry.

10
4. To research and identify different tools of measuring customer experience and
subsequently applying the best method.
5. To identify the best tool for aligning customer experience with business processes.
1.5 Project scope
This project encompasses extensive research and model design leading to the above stated
outcomes. The project scope outlines the deliverables and methodology involved.
1.5.1 Deliverables
The following main deliverables will be the outcome of this study.
Literature study review
Customer experience and business process re-engineering conceptual model
Conclusions and recommendations
1.5.2 Research methodology
The project can be divided into six phases namely:
1. Customer data is to be collected and analysed to produce information on customer
requirements directly from the customer‟s point of view. Data collection is to be
done through surveys and interviews.
2. Current customer experience is to be analysed through the method of mystery
shopping as well as onsite business process observation at the respective service
centres.
3. Performance management tools are to be investigated to identify the best tool for
relating customer requirements to internal business processes.
4. Using the information gathered as mentioned above, the actual business process
performance is to be measured and areas of improvement identified.
5. A conceptual model is to be developed to improve customer experience through re-
engineering the internal business processes.
6. Recommendations and means for continuous improvement and development of the
model are to be provided.
1.6 Chapter summary
The top three telecommunications companies in South Africa are the basis of this study with
the focal subject being Company A. Companies B and C will be viewed as secondary

11
subjects with the roles of competitors to Company A. Systematic steps are to be followed
with the desired output of a literature study, business process re-engineering and customer
experience conceptual model and lastly conclusions and recommendations to address the
stated problem. The problem at hand is the need for reconciliation between customer needs
and business processes.

12
Chapter 2: Literature review
2.1 Customer Experience
A customer always has a particular experience when acquiring a service or buying goods.
The experience may be good, bad or indifferent. What is important is a how a company
deals with the management of customer experience (Berry, Carbone & Haeckel, 2002). The
customer‟s subjective view and reaction to contact with a company – directly or indirectly – is
what makes up Customer Experience. Direct contact is the processes of sales and services
while indirect contact with the company is made up of the representation of a company‟s
offering. Customer Experience involves various segments of a business ranging from quality
customer care to advertising, reliability and service and product quality. Unfortunately in
some organisations not all these aspects are seen as contributing to Customer Experience
(Meyer & Schwager, 2007). Meyer and Schwager emphasise how customer dissatisfaction
is rife. This is a critical matter especially since the customer is becoming even more
empowered. The empowerment of the customer is due to the fact that there is now a greater
variety of alternatives available and customers are spoiled for choice in selecting the
channels by which to attain them.
According to Kiska (2002), a CEO can lose up to 40% of its customer base in a year. The
company and its CEO are thus faced with the crucial task of retaining customers and
cultivating a relationship with them. The entire business should therefore be customer-
focused with efforts made to provide the customer with what they want, how they want it and
at a price they are prepared to buy it for (Kiska, 2002). Berry, Carbone & Haeckel (2002)
describe this process as creating value for customers in the form of experience. Companies
can reach this target by clearly comprehending the journey taken by the customer from their
expectations before the experiment to the customers‟ response and analysis after the
experience. With this understanding, companies are able to have a collection of “puzzle
pieces” which, when assembled, result in a picture that satisfies the customer. The level of
customer satisfaction could possibly be to an extent that differentiates the company from its
competition should it be perceived as the preferred choice. The resulting picture makes up
Customer Experience.
The puzzle pieces are made up of two aspects. The first one deals with the actual
performance of a service or good provided by a company. This speaks to the brain or logical
reasoning of the customer. An example of logical interpretation by a customer is whether the

13
customer received the correct service or whether the product works. The second aspect of
Customer Experience addresses the emotions of the customer. All five senses are linked to
the good or service provided. An example would be the tone of the assistant at the call
centre. The heart of the customer is the aspect of customer service that caters to the
emotional factor of the entire customer experience. Customer service can be defined as “the
ability of knowledgeable, capable and enthusiastic employees to deliver products and
services to their internal and external customers in a manner that satisfies identified and
unidentified needs and ultimately results in word of mouth publicity and return business”,
Jooste (2003). Customers‟ memory of their experience is predominantly emotion-based. A
customer may forget the name of the personnel, the location and even the details of the
transaction, but the “feeling” of the experience will remain with them. Sherrie Sherrenie of
Coca Cola Africa described this phenomenon saying “Coca cola does not sell the beverage
to the customer, we sell refreshment.” It is thus the feeling of refreshment that returns
business to Coca Cola. Enthusiasm, passion, empathy, empowerment are examples of
factors that win the heart of the customer (CCS workshop, University of Pretoria 2009). The
emotional aspect comprises of two building blocks, the „mechanics‟ (puzzle pieces from
things) and „humanics‟ (puzzle pieces from people). In business the mechanics are often
given more attention than humanics but in truth they are of equal importance (Berry,
Carbone & Haeckel, 2002).
Meyer and Schwager, in their business review Understanding Customer Experience, define
the events where a customer interacts with a company‟s goods or services directly or
indirectly as “touch points”. Information about an experience is gathered at these touch
points. For each touch point, the gap between the expectations of a customer and the actual
experience of the customer defines the difference between customer satisfaction and the
negative alternative. Expectations are accumulated through past experiences with a
company. The customer naturally compares new experiences with past ones. Other feeders
of expectations are the market, competition and personal circumstances of the customer
(Meyer & Schwager, 2007). Companies ought to listen to the Voice of the Customer so as to
know their expectations and reduce the risk of providing services and goods not needed in
the market. According to Kiska (2002), the telecommunications industry would be far better
off today, had customer feedback solutions been set in place in the past years. He believes
that customer satisfaction measurement has to do with collecting data on the customer‟s
view on the products or services they receive (Kiska, 2002).

14
Customer experience information is collected through three patterns: past patterns, present
patterns and potential patterns. Past patterns try to attain information about the customer‟s
experience right after the actual event. The most popular means of collecting data on past
patterns is through surveys. Present patterns are analysed by investigating the customer‟s
knowledge of alternatives, preferred features and competitiveness. This data is collected
through surveys and interviews. Observing customer behaviour (body language, facial
expression, etc.) reveals potential patterns as opportunities can be identified from there. The
advantage of surveying is that it is low in cost. It is therefore very popular for past and
present patterns. Electronic surveys via email are even more effective as they can be
distributed easily and quickly. Surveys, however, do have limitations. These can be
overcome through focus groups and blogs (Meyer & Schwager, 2007).
According to Meyer and Schwager (2007), many companies know a lot about the various
characteristics by which customers can be classified. Where they lack insight is in the
„thoughts, emotions and states of mind that customers‟ interactions with products, services
and brands induce‟. Without adequate knowledge of Customer Experience the term
“customer satisfaction” will be but a slogan in the organisation and not a reality.
2.2 Business Re-engineering
Business Process Re-engineering (BPR) is a buzzword in business talk. Some have defined
it as restructuring, downsizing and strategic re-focussing of the organisation. The core of
BPR is about redesigning processes. With increasing competitive pressure, organisations
often feel pressured to work harder. The solution is in actual fact to work smarter (Balle,
1995).
The redesigning of processes in order to improve the performance of a business is a
powerful technique for change. Currently, an organisation is comprised of various
departments including Research & Development, Sales, Production, etc. Traditionally
managers focussed on the functional hierarchy in the organisation as depicted below.
R&D Production Sales Customer

15
BPR challenges this way of thinking and instead focuses on a „process‟ view leading to the
customer. The ways in which a product is designed or an order filled are customer-
centralised while disregarding functional boundaries (Peppard & Rowland, 1995).
The core focus of BPR is on minimising the aspects of processes that are non value adding
to a system. Another specific focus is on the process outcome. Organisations with
operations as the basis of their offering have outcomes specifically for the customer. The
customer focus of BPR can thus be said to be outcomes driven. BPR also has a process
focus. The aim is to generate processes that are close to optimal either by starting afresh
with a new design or by redesigning an existing process. According to Peppard & Rowland‟s
business philosophy analysis, the techniques employed by BPR are Process Maps,
Benchmarking, Information Systems/Information Technology and Creativity – out of the box
thinking (Peppard & Rowland, 1995).
2.2.1 Process Maps
In order to fully understand a process, one can create a process map. This allows for easier
readability and comprehension. With tasks plotted onto a map, the way things are done or
the manner in which people work can be seen clearly. The value of process maps lies
greatly in their usability and the actual process of creation. Since maps are graphical and not
narrative, they give a clear view of the processes. Areas of improvement such as resource
wasters are easier identified. The actual map-making process gives the map maker in depth
knowledge of the process being worked on. Steps and tasks in the process that are
unnecessary become evidently obvious to the map maker (Peppard & Rowland, 1995).
Process mapping can be done using Microsoft Visio or the Intergraded Definitions language
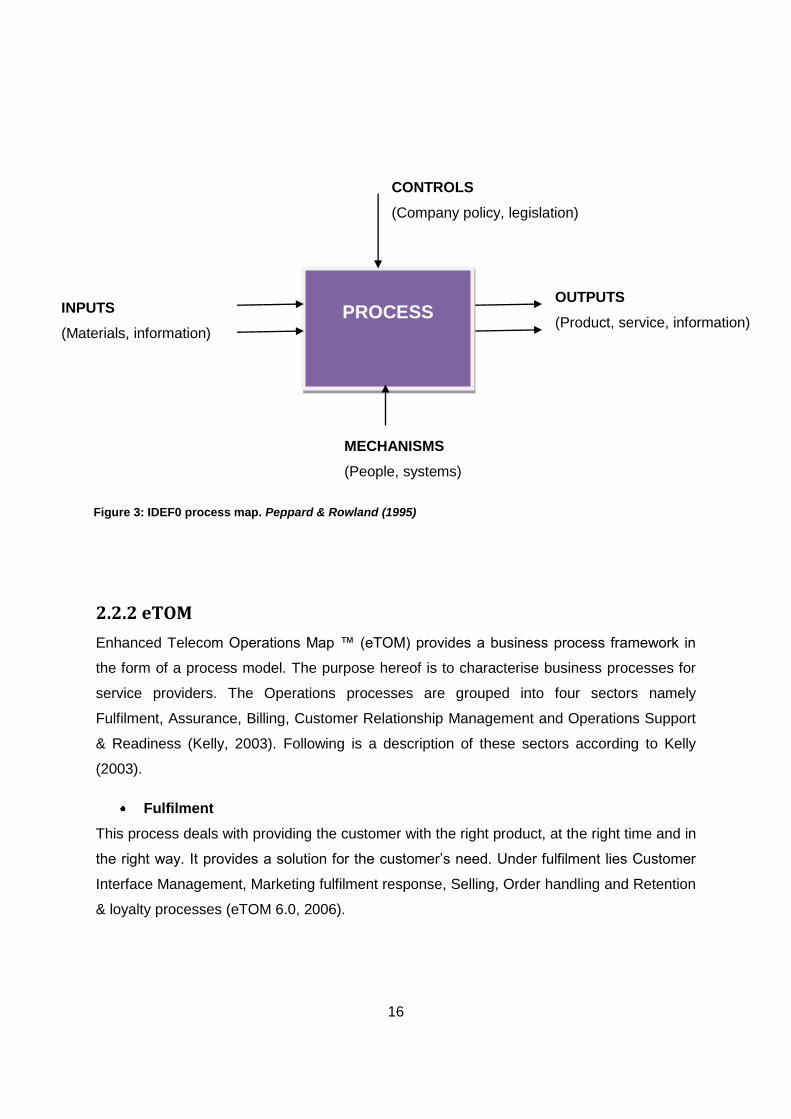
(IDEF). Inputs and outputs of the process are defined together with the mechanism required
and the controls under which the process functions.
Figure 1: Traditional functional hierarchy focus. Peppard & Rowland (1995)
Sales Production R&D Customer
Figure 2: BPR organisation view. Peppard & Rowland (1995)
16
2.2.2 eTOM
Enhanced Telecom Operations Map ™ (eTOM) provides a business process framework in
the form of a process model. The purpose hereof is to characterise business processes for
service providers. The Operations processes are grouped into four sectors namely
Fulfilment, Assurance, Billing, Customer Relationship Management and Operations Support
& Readiness (Kelly, 2003). Following is a description of these sectors according to Kelly
(2003).
Fulfilment
This process deals with providing the customer with the right product, at the right time and in
the right way. It provides a solution for the customer‟s need. Under fulfilment lies Customer
Interface Management, Marketing fulfilment response, Selling, Order handling and Retention
& loyalty processes (eTOM 6.0, 2006).
PROCESS
CONTROLS
(Company policy, legislation)
OUTPUTS
(Product, service, information)
MECHANISMS
(People, systems)
INPUTS
(Materials, information)
Figure 3: IDEF0 process map. Peppard & Rowland (1995)

17
Assurance
This process ensures that activities that are up to the agreed upon Quality of Service for the
customer are performed. Continuous performance monitoring is undertaken to spot any
failures. Data on performance is collected, analysed and the problem is solved as efficiently
as possible. Under Assurance lies the Customer Interface management, Problem handling,
Customer Quality of Service and Retention & loyalty processes (eTOM 6.0, 2006).
Billing
Where the customer is to be billed, this process ensures that correct and timely billing is
made. All information for the customer, payment processes and bill collecting is handled.
Queries and problems regarding billing are resolved on time. The billing process includes
Customer Interface Management, billing and collection management as well as the retention
and loyalty process (eTOM 6.0, 2006).
Operations Support & Readiness
This process caters for the fulfilment, Assurance and Billing processes. This is not a front-
office process but handles the activities that will affect those that are. Operations support &
readiness serves to support the Fulfilment, Assurance and Billing processes (Kelly, 2003).
Customer Relationship Management
Customers as well as their needs need to be known. This is the responsibility of this
process. The relationship a business has with the customer is of great worth and so the
enhancement and retention of that relationship is the goal. Kelly (2003) explains that this
process „is about customer service and support, whether storefront, telephone, web service‟.
The figure below shows the holistic picture of the eTOM Framework from Enterprise
Management up to customer interface.

18
Figure 4: eTOM Framework (Infratek 2007)
2.2.3 Benchmarking
Benchmarking is how organisations grade themselves against other leaders. Self-
assessment against competitors aids in gaining knowledge about a company‟s performance
in the market, but, unlike with benchmarking, it does not give a thorough understanding of
the processes that bring about these differences. In international business study,
benchmarking is said to be a tool that „improves a company‟s performance through the
identification and application of the best practices within and across the company‟s various
operations and sales activities‟ (Ball, Geringer, Minor & McNett, 2005). The figure below
depicts the stages of benchmarking as stated by these authors.

19
Figure 5: Benchmarking stages. Adapted from Ball, McCulloch, Geringer, Minor & McNett, 2005.
2.3 Quality Function Deployment (QFD)
2.3.1 Introduction
Quality Function Deployment (QFD) is a mechanism used to ensure that production design
processes are driven by customer needs (Chan & Wu, 2004). QFD was birthed in Japan
during the 1960‟s when the Japanese government recruited various universities to develop a
system that would ensure that each stage of its construction processes was linked to
satisfying some customer requirement. This tool is a means of listening to the customer to
hear exactly what they want and using this information in a rational system to meet these
requirements as closely as possible with the resources at hand. Through QFD, an
organisation is able to find out what qualities customers desire, what functions are to be
utilised by the organisation to deliver the service or product. Lastly, QFD helps to identify
how to best provide what is required by the customer (Guinta & Praizler, 1993).
2.3.2 QFD and quality
Guinta and Praizler (1993) liken quality to beauty saying „quality, like beauty, is in the eye of
the beholder‟. They describe quality as fulfilling requirements, on time delivery and delivery
20
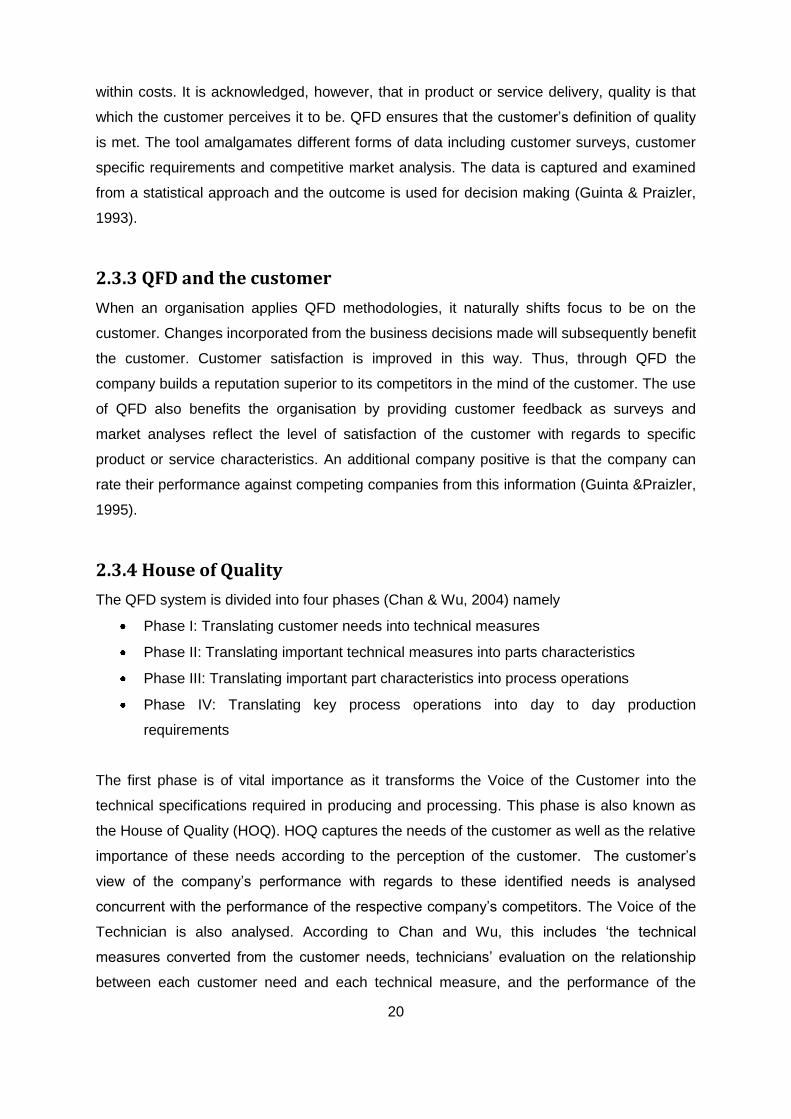
within costs. It is acknowledged, however, that in product or service delivery, quality is that
which the customer perceives it to be. QFD ensures that the customer‟s definition of quality
is met. The tool amalgamates different forms of data including customer surveys, customer
specific requirements and competitive market analysis. The data is captured and examined
from a statistical approach and the outcome is used for decision making (Guinta & Praizler,
1993).
2.3.3 QFD and the customer
When an organisation applies QFD methodologies, it naturally shifts focus to be on the
customer. Changes incorporated from the business decisions made will subsequently benefit
the customer. Customer satisfaction is improved in this way. Thus, through QFD the
company builds a reputation superior to its competitors in the mind of the customer. The use
of QFD also benefits the organisation by providing customer feedback as surveys and
market analyses reflect the level of satisfaction of the customer with regards to specific
product or service characteristics. An additional company positive is that the company can
rate their performance against competing companies from this information (Guinta &Praizler,
1995).
2.3.4 House of Quality
The QFD system is divided into four phases (Chan & Wu, 2004) namely
Phase I: Translating customer needs into technical measures
Phase II: Translating important technical measures into parts characteristics
Phase III: Translating important part characteristics into process operations
Phase IV: Translating key process operations into day to day production
requirements
The first phase is of vital importance as it transforms the Voice of the Customer into the
technical specifications required in producing and processing. This phase is also known as
the House of Quality (HOQ). HOQ captures the needs of the customer as well as the relative
importance of these needs according to the perception of the customer. The customer‟s
view of the company‟s performance with regards to these identified needs is analysed
concurrent with the performance of the respective company‟s competitors. The Voice of the
Technician is also analysed. According to Chan and Wu, this includes „the technical
measures converted from the customer needs, technicians‟ evaluation on the relationship
between each customer need and each technical measure, and the performance of the

21
Neutral Good Very good
relevant companies in terms of these technical measures.‟, (Chan & Wu, 2004). Below is a
description of the elements involved in the HOQ as explained by Chan and Wu (2004).
2.3.4.1 Customer Needs
In the HOQ model, the customer needs are known as the WHATs. These are expressed by
the customer in regular language. Face to face interviews with individuals are cost effective.
Twenty to thirty individual interviews will produce 90-95% of the possible customer needs
(Chan, Kao, NG and Wu, 1999).
2.3.4.2 Relative importance ratings of customer needs
The customer is then required to rate the level of importance of each of the customer needs
under study. The company in question will place focus on the most important customer
needs and invest less in the unimportant ones so as to use resources wisely (Chan, Kao,
NG and Wu, 1999). The scale below is often used in measuring relative importance:
2.3.4.3 Competitors
These are the various competing companies in the same industry or market under study. In
the case of the telecommunications industry in South Africa these would be the companies
possessing the largest market share in the telecom field.
2.3.4.4 Customer competitive analysis
The customer analyses the various competitors‟ performance in the identified customer‟s
needs. For relative importance ratings and competitive ratings many customers need to be
surveyed and only direct surveys should be utilised (Chan, Kao, NG and Wu, 1999). The
scale below is used to measure the relevant performance:
0 9 3 1
No importance Low importance Moderate importance High importance
Figure 5: Relative importance scale. Adapted from Chan & Wu (2004)
1 5 3 2
Very poor Poor
4

22
2.3.4.5 Technical measures
These are also known as the HOWs. These are the methods and technical specifications
derived from the customer needs.
2.3.4.6 HOQ model
Chan & Wu (2004) further elaborate on the steps involved in the QFD model namely:
Step 1: Identify customers and collect their needs (WHATs)
The type of customers needs to be specified as there are internal customers (shareholders,
etc) as well as the external customers (receiving service/product). Collection of customer
needs is to be conducted through surveys, interviews and observation.
Step 2: Determine the relative importance ratings of customer needs
The identified customer needs have differing importance and the customer is given the
platform of ranking them in order of importance. The average relative importance rating for
that particular customer need is then calculated.
Step 3: Identify competitors and customer competitive analysis
It is important for any company wishing to improve to be aware of its competitor and the
performance of the competitor relative to its own performance. Thus, customers are to rate
the relative performance of the various competing companies in the same industry for each
customer need.
Step 4: Determine final importance ratings of customer needs
The highest importance ratings are the most important and focus should be placed on these
as the potential for business improvement lies therein.
Step 5: Generate technical measures (HOWs)
The WHATs are now generated into HOWs by the technical team. These are the customer
needs translated into technical measures.
Step 6: Determine the relationships between HOWs and WHATs
The resulting HOWs are analysed to identify how they can be translated into WHATs.
Figure 6: Customer competitive analysis. Adapted from Chan & Wu (2004)
23
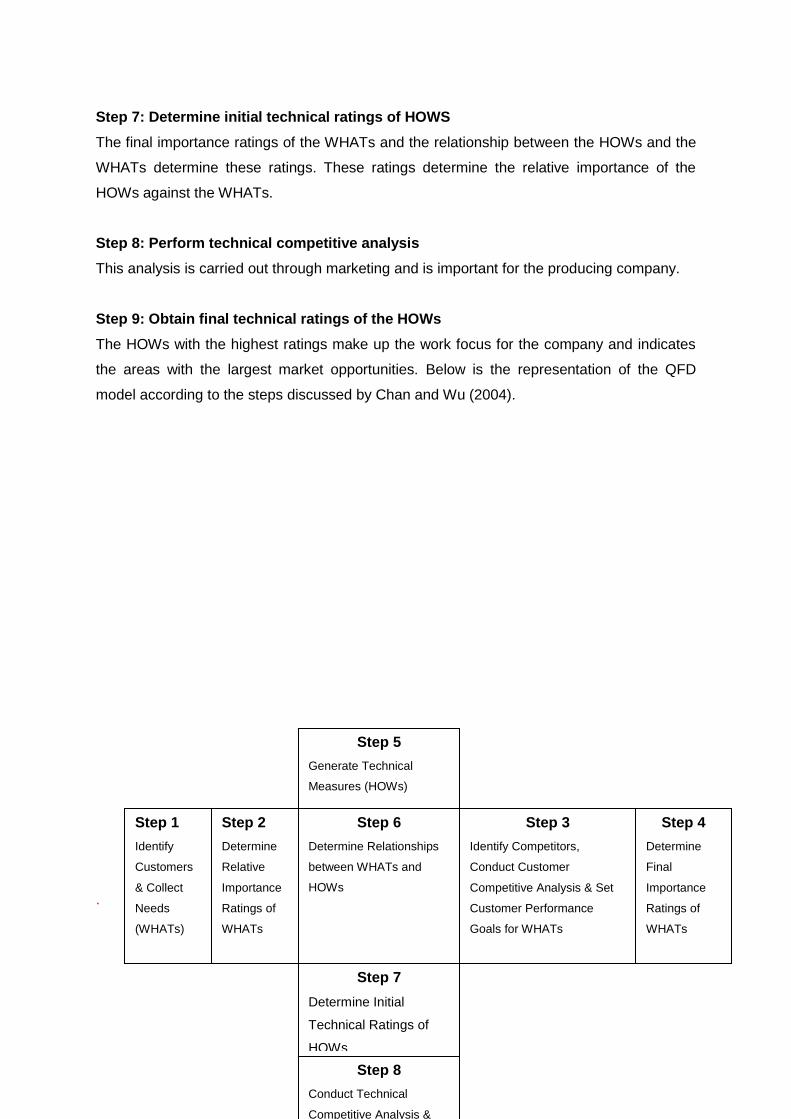
Step 7: Determine initial technical ratings of HOWS
The final importance ratings of the WHATs and the relationship between the HOWs and the
WHATs determine these ratings. These ratings determine the relative importance of the
HOWs against the WHATs.
Step 8: Perform technical competitive analysis
This analysis is carried out through marketing and is important for the producing company.
Step 9: Obtain final technical ratings of the HOWs
The HOWs with the highest ratings make up the work focus for the company and indicates
the areas with the largest market opportunities. Below is the representation of the QFD
model according to the steps discussed by Chan and Wu (2004).
.
Step 1
Identify
Customers
& Collect
Needs
(WHATs)
Step 2
Determine
Relative
Importance
Ratings of
WHATs
Step 6
Determine Relationships
between WHATs and
HOWs
Step 5
Generate Technical
Measures (HOWs)
Step 3
Identify Competitors,
Conduct Customer
Competitive Analysis & Set
Customer Performance
Goals for WHATs
Step 4
Determine
Final
Importance
Ratings of
WHATs
Step 7
Determine Initial
Technical Ratings of
HOWs
Step 8
Conduct Technical
Competitive Analysis &
24
2.4 Telecommunications industry in South Africa
South Africa has three major cellular networks which are referred to in this report as
Company A, Company B and Company C. Other than these three cellular giants, there is
one fixed line network. All four companies are competitors for voice traffic. Quality of service
is thus all the more imperative in this industry as it serves as a differentiator (Bond,
Pampallis and van der Wal, 2002).
Jain (1997) uses Porter‟s five force model to analyse the position of the telecommunications
industry in South Africa. This model highlights five potential competitive forces:
1. The threat of new entrants
2. The threat of substitute goods or services
3. The bargaining power of customers
4. The bargaining power of suppliers
5. The degree of rivalry amongst existing competitors
The threat of potential entrants is the second largest competitive force in the South African
telecommunications market. Company A and Company B were the only two established
network operators for a long period of time. After the introduction of Company C in 2001, the
market share was to be redistributed amongst the three network operators. In order to
solidify substantial share in the market, each company has to invest greatly in delivering
Figure 7: House of Quality - 9-step model (Chan & Wu, 2004)

25
quality service to its customers. The cellular networks traditionally deal through dealerships
and retail stores. Ownership of these service providers is independent. However, since
2001, the companies have begun to buy out these distribution portals so as to be directly in
charge of the customer. This is in line with the global trend of companies working towards
being “customer-centric” organisations (Bond, Pampallis and van der Wal, 2002).
Lovelock (1999) states that high quality service is concurrent with profit, cost savings and
market share. Quality service is, however, intangible and is hard to deliver consistently
(Zeithaml and Bitner, 2000). Research to determine the quality of service in the cellular
outlets in the South African telecommunications environment was conducted using a survey
based on the SERVQUAL model. The model measured customer service according to the
following categories:
1. Tangibles – This includes the physical décor, appearance of the staff and the
communication media of the company.
2. Reliability – The ability for the service provider to provide accurate and dependable
service as it has committed to do.
3. Responsiveness – The staff‟s drive to assist customers and to serve them as quickly
as possible.
4. Assurance – Staff knowledge and professionalism that ultimately generate trust and
confidence within the customers.
5. Empathy – Personalised attentiveness for the customer by the service provider
through care and friendliness.
According to Bond, Pampallis and van der Wal (2002) the results of the research revealed
that in the customer‟s mind, „tangibles‟ and „reliability‟ are two distinct factors but they
perceive „assurance‟, „responsiveness‟ and „empathy‟ as one dimension. Elements of the
„tangibles‟ are the range of handsets and accessories as well as the manner in which
employees are dressed, pamphlets and in-store facility appearance. The remaining three
categories see to the needs of the customer. The results communicated that less emphasis
should be placed on the „tangibles‟ and more on the categories that care for the customer
needs. Thus, speedy service is mandatory for the „responsiveness‟ factor and staff ought to
be knowledgeable to provide „assurance‟ to the customer. Customer expectations and
perceptions need to be met through the five categories.

26
2.5 Chapter summary
In this chapter a more in-depth understanding of Customer Experience and Business
Process Re-engineering was provided. Furthermore, the elements of BPR were discussed.
Research proved Quality Function Deployment to be the tool of choice for this study. QFD
methodology was thus elaborated upon. Lastly, the environment in which the above
mentions subjects and tool are to be placed into context (South African telecommunications)
was reviewed.

27
Chapter 3: Preliminary analysis of the telecommunications industry
The three largest cellular networks in South Africa, Company A, Company B and Company
C were analysed. Company A is the subject of study with Company B and Company C
serving as competitors of Company A. In this way, Company A‟s analysis will be centralised
and relative.
3.1 Process identification
Five processes in the cellular environment were selected namely the Staff Training, Cell
phone Repairs, New Contract Deals, Contract Upgrades and In-store Customer Service
processes. These are amongst the highest most complained about processes and/or
services in the cellular telecommunications environment (hellopeter.com, 2009). There is a
need for improvement as customers have shown dissatisfaction in the above mentioned
processes.
3.2 As-Is Review and process map analysis
Understanding the existing process in the organisation is of utmost importance prior to re-
engineering. However, some authors such as Hammer & Champy (1993) believe that this
will influence the creative process for the re-designer. They believe that for best results one
should assume designing the new process immediately. Whichever approach is used, the
results need to show significant improvement. With this goal in mind, reviewing proves to be
the best starting point. Value-adding processes were identified and process maps created.
The objective is to identify where the process does fail to produce desired results, i.e.
disconnects. The As-Is process of Company A was analysed through observation, mystery
shopping and face to face interviews with a dealerships and owned stores.
3.2.1 Staff training process
This deals with the training process of personnel such that they are well equipped to provide
adequate service as desired by the customer. Training would fall under the Operations
support and readiness within the eTOM framework as discussed in Chapter 2. Training of
staff is divided into two sections namely in-store training and customer care training.
Employees are trained online via the internet based training as well as a training program.

28
These are followed by testing in order to ensure knowledge of the course provided. Upon the
introduction of new systems, the staff receives additional training. A training session can
vary from 30 minutes long up to a full day‟s duration depending on the complexity of the
system. Company A is responsible for the general training of its staff. However, should a
dealer desire further training of his/her staff, more intricate training may be provided. The
process map below shows the sequence of the training from appointment of a new
employee until no further training is required.
AppointmentNew
personnel?
Company internet
based training
E-learning
multiple choice
test
Training
satisfactory to
dealer/
management?
In-store trainingTrial and error Service
ExperienceTrained personnelNew system?
No further training
Yes
No
Yes
No
No
Yes
Figure 6: Staff training process map
3.2.2 Cell phone repairs process
The entire repairs process from handset handover by customer to the handing over of
repaired items back to the customer is to be measured here. This process falls under the
Assurance process in the eTOM framework. Repairing a handset may take a few minutes
should there be an in-store technician available and provided the fault is of minor nature.
However, on average repairing takes a total of 6 weeks. This is due to the fact that faulty cell
phones are sent to the High Volume Repair Centre (HVRC) in order to be fixed. Every two
days, the cellular store has repair phones couriered to the first centralised location and then
to a secondary centralised location before finally being transported to the HVRC. Once a
handset has been assessed and diagnosed, a quote is drawn up. This quote is to be
accepted by the customer before repairing can commence. Customers who are still under

29
warrantee need not pay whereas those out of warrantee are required to settle the bill of
repairs upon collection of a handset from the cellular store. The flow of activities of the repair
process is shown below.
Faulty
handset
In-store
technician?
Handset under
warrantee?
Courier to
Centralised
Location 1
Courier to
Centralised
Location 2
Transport to High
Volume Repair
CenterRepair handset
Accumulate
handsets
Collect
handsets for
48hrs
Return to
Centralised
Location 2
Return to
Centralised
Location 1
Courier to store Notify customer
Warrantee
valid?
Notify customer of
quotation
Return handset to
customer
Collect
handset for 4
days
No
Yes
Quotation
accepted?
Payment of bill if
applicable
Repair handset in-
store
Yes
No
Yes
No
Yes
No
Figure 7: Cell phone repairs process map
3.2.3 New contract deals
This deals with sales and marketing in order to attain a growing customer base. The new
deals process falls under the Selling process within the Fulfilment process. Upon application
for a new cell phone contract, it is the store assistant‟s responsibility to determine the need
of the customer. Customers do communicate what they want; however, professional and
knowledgeable assistance ensures that the customer makes an informed contract package
selection based on what the customer needs. Once the suitable package has been
identified, the customer selects the desired handset. Should it not be available, an order will
be placed at the warehouse. A cellular contract entails monthly billing of the customer. The
preferred billing method is selected. The customer can be billed via email, fax or post. In

30
accordance with the law, credit vetting is mandatory prior activation of a new contract.
Identification documents and payslips are to be presented upon application for a contract.
Once the customer has been approved for credit, the new SIM card is activated. The new
deals process is depicted below.
Determine
customer need
Determine suitable
package
Select suitable
handset
Define billing
preference
Complete
subscriber
agreement
Complete
activation request
Perform credit
vetting
Customer
credit worthyActivate SIM card
Return application
to Company
system for
approval
Wait 24hrs for
contract
approval
Wait 24hrs for
contract
activation
Handset
available in-
store?
Order handset
from warehouse
Customer collects handset
and sim card
Figure 8: New contract deals process
3.2.4 Contract upgrades process
This process falls under the Customer Relationship Management category. An existing
cellular contract holder is notified by the service provider of when the contract is due for an
upgrade. This occurs 4 months prior the expiry date of the current contract. The account
record of each customer is held by the service provider and this serves as a determinant of
whether the customer is legible for an upgrade. In the case that monthly payments have
been consistent and the account is up to date, the upgrades process will only entail updating
the contract package and other relevant information. A customer that is found illegible for an
upgrade will not be permitted to upgrade until cleared. Clearance occurs once account has
been settled.

31
Review customer
account
Account paid
up?
Notify customer of
upgrade via SMS
(4 months prior)
Contact customerCustomer
cleared?
Upgrade not
permissable
Check customer
ID document
Subscriber form
completed by
customer (15-
30min)
Select handset
Handset
available in-
store?
Order handset
from warehouse
Present handset
to customer
Delivery of
handset
No
Yes
Yes
No
Figure 9: Contract upgrades process
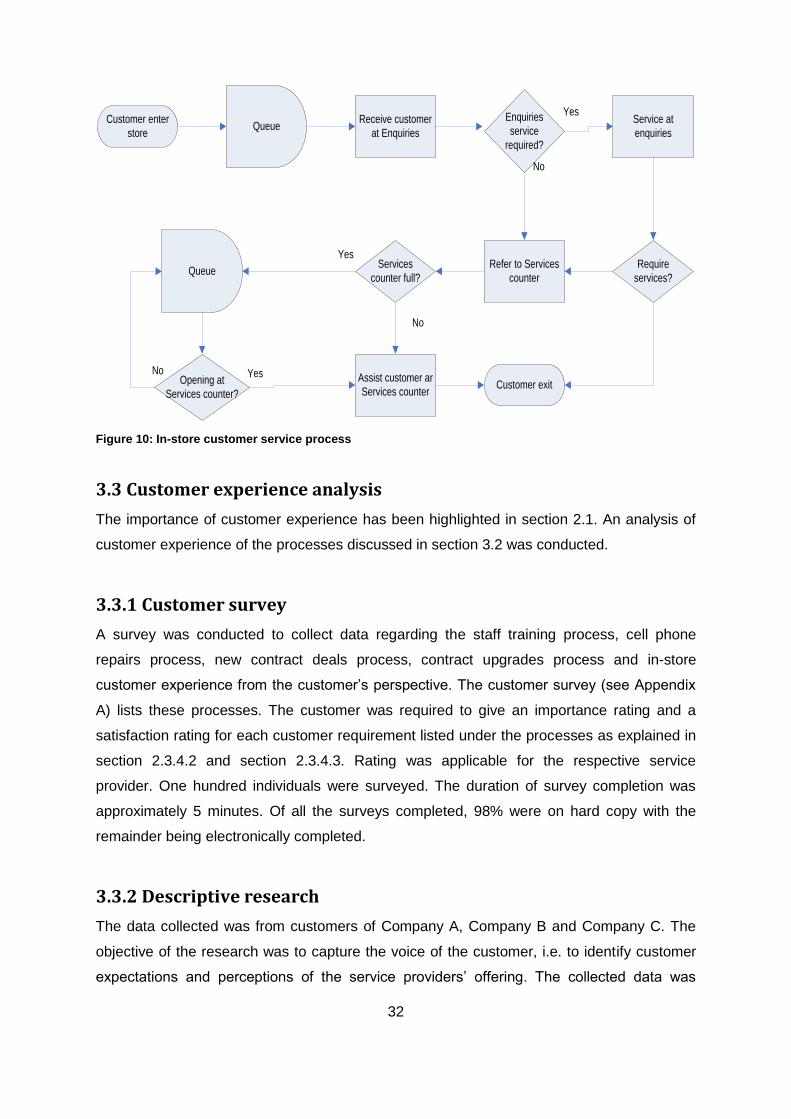
3.2.5 In-store customer service process
Cellular stores are not all identical in architecture and operations but they do have core
similarities. It is also important to note that the actual process of in-store customer service is
dependant on different variables namely reason for customer visit, time of day, number of
staff on duty, etc. The process defined here is generic. Upon entering the store, the
customer sees two counters: the Enquiries and the Services counters. The Enquiries counter
is a standing counter whereas customers are seated at the services counter. The entering
customer is received by the Enquiries assistant. Should the customer desire to perform a
service transaction they will be directed to the Services counter, otherwise they will be
assisted at the Enquiries counter.
32
Customer enter
storeQueue
Receive customer
at Enquiries
Enquiries
service
required?
Service at
enquiries
Require
services?
Refer to Services
counter
Services
counter full?Queue
Opening at
Services counter?
Assist customer ar
Services counterCustomer exit
Yes
No
Yes
No
YesNo
Figure 10: In-store customer service process
3.3 Customer experience analysis
The importance of customer experience has been highlighted in section 2.1. An analysis of
customer experience of the processes discussed in section 3.2 was conducted.
3.3.1 Customer survey
A survey was conducted to collect data regarding the staff training process, cell phone
repairs process, new contract deals process, contract upgrades process and in-store
customer experience from the customer‟s perspective. The customer survey (see Appendix
A) lists these processes. The customer was required to give an importance rating and a
satisfaction rating for each customer requirement listed under the processes as explained in
section 2.3.4.2 and section 2.3.4.3. Rating was applicable for the respective service
provider. One hundred individuals were surveyed. The duration of survey completion was
approximately 5 minutes. Of all the surveys completed, 98% were on hard copy with the
remainder being electronically completed.
3.3.2 Descriptive research
The data collected was from customers of Company A, Company B and Company C. The
objective of the research was to capture the voice of the customer, i.e. to identify customer
expectations and perceptions of the service providers‟ offering. The collected data was

33
entered into a QFD model where calculations were made and information provided so as to
attain the following research objectives:
To identify those processes which are most important to customers and can thus
provide greater profits to the company once improved.
To analyse Company A‟s processes against that of its competitors and subsequently
apply benchmarking where applicable.
To rank the processes according to level of importance and performance.
To identify the most crucial process in Company A, i.e. one that requires immediate
attention in order to apply BPR.
3.3.3 Sampling method
Stratified random sampling was applied in the surveying. The population is taken as all
network subscribers. The elements, being the customers, were divided into 3 groups called
strata. The strata are subscribers to Company A, Company B and Company C respectively.
The more alike the elements in each stratum are, the more accurate the results of the
statistical analysis (Williams, Sweeny and Anderson, 2006). All elements, or customers, in
question are subscribers to a service provider and can thus be considered to be alike.
Simple random sampling was conducted for each stratum. The more homogeneous the
elements within each stratum, the lower the variance will be. A small sample size can then
provide good estimates. The chosen population size of 100 is small relative to the number of
customers of the telecommunications industry. However, based on the above mentioned
statistical principles, the results from this sample size can be regarded reliable (Williams,
Sweeny and Anderson, 2006).
3.3.4 Sample distribution
The sample taken is an infinite sample. The population size (number of network subscribers)
is very large so for practical purposes the sample is considered infinite. Therefore, a simple
random sample of infinite population was taken. According to Williams, Sweeny and
Anderson (2006), requirements for such a sample are that
1. Each selected element must come from the population.
2. Each element is to be selected independently.
The customer survey complies with these requirements as surveyed individuals were
subscribers to service providers. Also, customers were selected independently. In other
words, they were not asked to which network provider they belong to before being surveyed.
In this way, biased selection was eliminated.
34
Figure 11: Sample distribution
Although 100 individuals were surveyed, 116 satisfaction ratings were given as some
customers are subscribed to more than one service provider. The diagram above shows the
distribution of the subscribers to Company A, Company B and Company C based on the
sample taken. Of the 116 satisfaction ratings, 44 were of Company A, 59 of Company B and
13 of Company C. The sample may be small relative to reality, but it is representative of the
actual market share between the 3 companies.
3.4 Chapter summary
In this chapter, the five processes of staff training, cell phone repairs, new contract deals,
contract upgrades and in-store customer service were discussed and represented through
Microsoft Visio process maps. A customer survey to capture the voice of the customer was
conducted. The research methodology and statistics of the survey were reviewed.

35
Chapter 4: Results and recommendations
Data collected from process analyses and customer surveys was used to investigate
customer experience in the telecommunications industry in order to apply Business Process
Re-engineering to Company A where applicable.
4.1 Quality Function Deployment (QFD) model results
As discussed in Chapter 2, the QFD is a tool to ensure that customer needs are the driver
for the design of a company‟s processes. Data collected from customer survey was entered
in the QFD model where calculations were performed to reveal the desired results.
36
Table 1: QFD model
Core Processes Competitive Evaluation
Import
ance R
ati
ng
Sta
ff t
rain
ing
Cell p
hone r
epair
s
New
contr
act
deals
Contr
act
upgra
des
In-s
tore
cust
om
er
serv
ice
Satisfaction rating
Com
pany A
Com
pany B
Com
pany C
Targ
et
Customer Requirements
1 - Staff competency 7.53 9 65% 74% 66% 100%
2 - Staff efficiency 7.54 3 64% 69% 52% 100%
3 - Staff professionalism 7.43 1 71% 77% 66% 100%
4 - Repair service speed 7.66 3 69% 65% 52% 100%
5 - Repair quality 8.28 9 71% 71% 60% 100%
6 - Temporary handset 5.87 3 47% 48% 42% 100%
7 - New deals process speed 7.47 3 69% 72% 72% 100%
8 - New deals ease of transaction 7.60 1 69% 74% 56% 100%
9 - New deals handset availability 7.47 9 63% 70% 67% 100%
10 - Upgrades service speed 7.12 9 69% 76% 74% 100%
11 - No upgrade fee 7.17 3 67% 60% 72% 100%
12 - Upgrades ease of transaction 7.54 1 69% 67% 70% 100%
13 - Minimal queuing 7.05 1 61% 64% 69% 100%
14 - Speedy in-store service 7.81 9 66% 71% 62% 100%
15 - Staff friendliness 7.29 3 75% 71% 73% 100%
Raw score 97.8 115 97.2 93.1 99.2
Relative % 19% 23% 19% 19% 20%
Importance Rank 2 5 2 1 2
Current score 63.8 77.04 63.06 63.83 67.09
Target score
97.8 115 97.2 93.1 99.2
Process performance 65% 67% 65% 69% 68%
Technical benchmark
A 70% 6 1 20 10
B 80% 0.002 0.5 15 5
C 85% 3 0.33 30 5
Key performance indicators
Sta
ff e
ffic
iency (
%)
Tota
l re
pair
tim
e
(weeks)
New
deals
pro
cess
com
ple
tion t
ime (
hours
)
Upgra
des
pro
cess
com
ple
tion t
ime (
min
ute
s)
Tota
l dura
tion o
f cust
om
er
in s
yst
em
(m
inute
s)

37
4.1.1 Customer satisfaction results
The results reveal how satisfied Company A subscribers are with regards to their
requirements. The three processes that showed the lowest satisfaction ratings are temporary
handset availability during the repairs process, handset availability when new contract deals
are being acquisitioned and minimal queuing during in-store customer service as depicted
below.
Figure 12: Company A satisfaction ratings
4.1.2 Competitive evaluation results
All three service providers‟ satisfaction ratings were assessed and compared in order to see
Company A‟s performance in comparison to Company B and Company C. These results are
to be used for benchmarking purposes. The target for the telecommunications industry is
shown so as to tell how far away each company is from reaching the customer satisfaction
target.

38
Figure 13: Customer satisfaction competitive evaluation
4.1.3 Raw score
The raw score is acquired by multiplying the importance rating of each customer requirement
with the relationship value of each process. This result is representative of the process
importance from the customer‟s perspective.
Figure 14: Process raw score

39
4.1.4 Process performance results
The satisfaction ratings interpret how each process is performing. The discrepancy between
the current score and the industry target score also reveals relative process performance.
Figure 15: Process performance
It is important to note that a process with a high performance measurement does not
necessarily mean that that process does not require improvement. For example, a process
may show a relatively good performance rating but be unimportant to the customer.
Improving this process would be an unwise use of resources.
4.1.3 Importance ranking results
Once all processes have been allocated a raw score, it is possible to rank the five processes
under study according to importance. Importance interprets how customers value each of
the processes. This rating can therefore not be ignored as it is in essence the voice of the
customer. For Company A to pursue a customer-centric focus, it is in its best interest to note
the process importance ratings and employ them in decision making. The cell phone repairs
process is by far the most important process.

40
Figure 16: Importance rank
4.1.4 Process impact ranking
Importance ratings and performance rankings were cross analysed in order to rank the
processes in order of their impact. Impact speaks on the magnitude of the positive effect the
particular process can have on the business should it be improved. The importance ranking
from highest to lowest is as follows:
1. Cell phone repairs process
2. In-store customer service process
3. Staff training and new contract deals processes
4. Contract upgrades processes
The cell phone repairs process will thus provide greater impact to the business through
improved customer experience and subsequently business success.
4.2 Recommendations
The greatest dissatisfaction customers have in the repairs process is that temporary
handsets are rarely available to them during the repairs process followed by the fact that
they have to wait for long periods of time before receiving their repaired handset.

41
4.2.1 Handset availability
Currently, Company A only meets this customer requirement at 47%. Company B is the best
performer of the three companies in this regard but is only better by a percentage.
Benchmarking against Company B would thus not result in great improvement since all three
companies are well below the target of 100%. The target value of 100% was chosen for
superior customer experience. The reasons for not having sufficient temporary handsets
available in-store at all times are that it is an additional cost and the number of repairs for a
given period cannot be foreseen. This makes it difficult to measure a safe level of temporary
handset inventory. The following are recommended to resolve this matter:
1. The repair log history is to be analysed so as to identify patterns of how often cell
phones are brought in for repairs.
2. Once the repair frequency has been reviewed, a safety inventory level for temporary
handsets can be determined.
3. Company A is then to provide this safety level to its dealerships and stores. Although
expense will be higher, the cost will not be a waste since resource allocation would
be based on a calculated customer need.
A customer with a temporary handset while his/her phone is being repaired will be
inconvenienced to a lesser degree. Therefore, should the repair process be prolonged, the
customer will be happier for longer and not as frustrated or impatient as he/she would be
had a handset been available for use.
4.2.2 Reduced process time
The average duration of Company A‟s repairs process is currently 6 weeks. Company A
customers prove less dissatisfied with the repairs duration than those of Company B and C.
None the less, the process is 31% away from reaching the superior satisfaction target. The
reasons for the long repair period are:
1. Repairs are being performed at the repair centre if there is no technical staff available
in-store.
2. Repairs take place at centralised locations as shown in the repairs process map in
Chapter 2. Centralising allows for more technical staff, technology and parts to be
available for the handset repair, but this is at the cost of time and great
inconvenience to the customer.

42
3. Shortage of cell phone spare parts. Where spares are short, they need to be ordered
from the warehouse. Thus the repair process may encompass labour hours as well
as waiting time while the required parts are being transported.
4. A lack of communication with the customer leaves the customer impatient and
unsatisfied when the repair process is stretching beyond expectation. This alone is
sufficient to lose customer base.
The matter of prolonged repairing is a serious one as, in worse cases the entire process may
take as long as 12 weeks. A contract customer pays a monthly fee for 24 months. Should
repairs take up to 3 months, the customer would have forfeited the 12.5% value of which
they are entitled to outside of the warrantee.
4.2.2.1 Decentralisation
Centralising repairs at specific locations results in task-overloading. A decentralised repair
system where faulty handsets need not be transported to the large but few locations will
result in a more efficient repair service. The High Volume Repair Centre thus need not be
the final destination of all handsets to be repaired. Technical staff as well as technology and
software resources can be spread out in smaller quantities to more locations. This
automatically decreases logistics cost and time – a fundamental contributor to a prolonged
process. The conceptual re-engineered repairs process map with decentralisation is shown
in the diagram below.

43
Faulty
handset
In-store
technician?
Handset under
warrantee?
Courier to
Centralised
Location
Repair handsetAccumulate
handsets
Collect
handsets for
48hrs
Courier to store Notify customer
Warrantee
valid?
Notify customer of
quotation
Return handset to
customer
Collect
handset for 4
days
No
Yes
Quotation
accepted?
Payment of bill if
applicable
Repair handset in-
store
Yes
No
Yes
No
Yes
No
Figure 17: Repairs process map with decentralisation
4.2.2.2 Multi-level technical support
The repair process varies in complexity and therefore duration as handsets have faults of
different depth of severity. Unfortunately if a technical team is not available in-store, all
handsets submitted for repairs are sent to the repair centre. Handsets could thus be sent
away for 6 weeks to repair a process that required far less time to fix. A recommendation is
to have an in-store technician to assess a faulty handset before it is booked in for
transportation. The in-store technician need not be an expert in the field as hiring highly
skilled professionals for all cellular stores may be costly. The technician could be of a lower
level of skill. Sufficient technical knowledge to diagnose a faulty handset is however a
mandatory requirement. Should the fault be minor, the technician is able to operate on the
handset in-store, thus cutting logistics cost and process time. An additional advantage to in-
store assessment is that handsets can be sorted according o fault. This increases efficiency
of the repairs process whether it takes place in-store or away.

44
4.2.2.3 Communication
An aggravator of the repairs process customer dissatisfaction is that customers are not
aware of the steps involved in the process and are oblivious of the stage in which their
handsets are at. Instead of waiting for the customer to contact the store complaining of the
process duration, a customer liaison team is to be commissioned to keep track of the
handset repair progress using a repair reference number and keeping the customer updated
on regular intervals. For this to be efficient the communication between repair departments
needs to be seamless. The call centre, dealership, service centre and the High Volume
Repair Centre is to use an information system that will allow easy tracking of current handset
location and the repair progress.
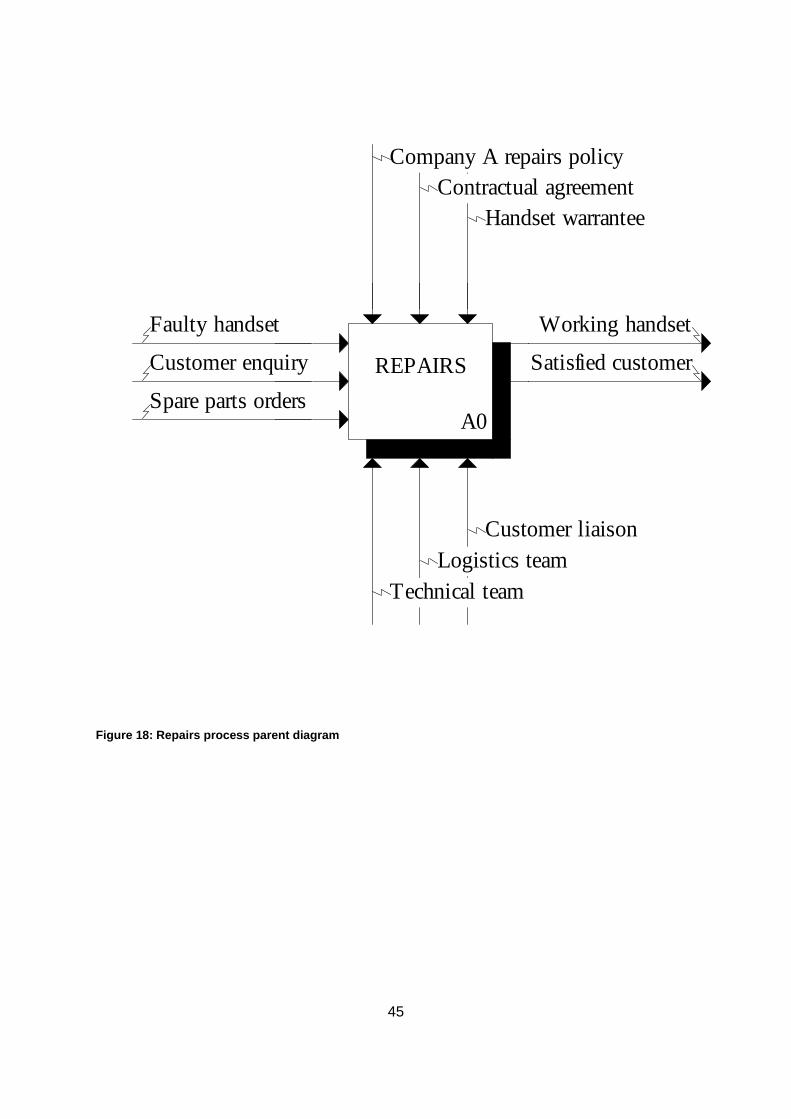
4.3 Re-engineered repairs process representation
The IDEF model below shows the activities of the repairs process with the respective inputs
and outputs as explained in the recommendations in section 4.2. The mechanisms and
controls required by the process have also been identified.
45
Figure 18: Repairs process parent diagram
REPAIRS
A0
Faulty handset
Customer enquiry
Spare parts orders
Working handset
Satisfied customer
Company A repairs policy
Contractual agreement
Handset warrantee
Technical team
Logistics team
Customer liaison
46
I1
O1
I2
I3
O2
M1
C1 C2C3
M2 M3
TECHNICAL
A3
COMMUNICATION
A2
LOGISTICS
A1
Faulty handset
Delivery request
Working handset
Customer enquiry
Satisfied customer
Informed customer
Spare parts orders Parts transportation
Handset transportation
Technical team
Company A repairs policy
Contractual agreement
Handset warrantee
Logistics team
Customer liaison
Figure 19: Repairs process child diagram
4.4 Chapter summary
The subjects of Customer Experience and Business Process Re-engineering have been
applied to five business processes of telecommunications Company A. A customer survey
served as input for a Quality Function Deployment model which produced results that
identified the cell phone repairs process as one that would provide the greatest impact after
improvement. It is thus concluded that implementing decentralisation, multi-level technical
support and communication would reduce the repairs process time and cost. These
recommendations are seen as alternatives but all can be implemented should resources be
sufficient and available.

47
Chapter 5: Project summary and conclusion
The importance of customer experience is often underestimated. This project revealed how
imperative this subject and full understanding thereof is for business success. Industries of
high competition such as that of cellular telecommunications ought to have customer
satisfaction as the skeleton around which business processes are built. This ensures happy
and loyal customers with a sustainable customer-supplier relationship. It is important to note
that the industry is dynamic, more so when there are other parties combating for a big piece
of the market pie. In order to stay afloat, Business Process Re-engineering is often required
to ensure relevance to the market.
This report tracks Company A‟s progress in the BPR process for improvement of the staff
training, cell phone repairs, new contract deals, contract upgrades and in-store customer
service processes. An As-Is analysis of these processes was done. Once the concepts of
customer experience and BPR were reviewed a tool to provide strategic direction in the BPR
process was identified and explained: the Quality Function Deployment tool. The building of
the QFD model required data from customers of Company A. A customer survey was thus
conducted. This survey revealed what customers want from the five processes, how
important these requirements are to them as well as how satisfied they are with their service
provider‟s respective performance. This data was entered into the QFD model and
subsequent calculations ranked the five processes in order of impact based on importance
and performance. The repairs process proved to be the one to produce greater impact once
improved.
The As-Is repairs process was thus reassessed and a To-Be process concept model
created. The outlined recommendations for the repairs process are
1. Decentralise repair centres so as to cut logistics cost and time. Decentralisation
would also prevent process overloading and thus provide greater efficiency of
operations.
2. Employ multi-level technical support for in-store servicing in order to by-pass the
repairs logistics cycle where applicable.
3. Develop an information system and commission a customer liaison team that will use
the information system to track the location and progress of a handset in repairs. The

48
customer liaison to team is to keep the customer informed and updated on regular
intervals.
Implementation of BPR into Company A would not be an easy task as change is often
resisted. But the pressure for differentiation within the industry outweighs the traditional
comfort zone. Customer experience and BPR have shown how an organisation can be
strategic about selecting areas of improvement and re-designing the business process to
align with customer needs. In this way, the gap between business processes and customer
requirements is closed.

49
6. References
1. Anderson, DR, Sweeney, DJ, Williams, TA, 2006, Contemporary Business Statistics
with Microsoft Excel, Thomson South-Western, Ohio.
2. Ball, D, McCulloch, W, Geringer, J, Minor, M, McNett, J, 2005, International Business.
The challenge of global competition, McGraw-Hill, Irwin.
3. Balle, M 1995, The Business Process Re-engineering action kit, Kogan Page Limited,
London.
4. Berry, LL, Carbone, LP, Haeckel, SH, 2002, „Managing the total customer
experience‟, MIT Sloan management review, vol.43, no.3, MIT.
5. Bond, C, Pampallis, A, van der Wal, RWE, 2002, „Service quality in a cellular
telecommunications company: a South African experience‟, Managing Service
Quality, vol. 12, no. 5, pp. 323-335.
6. Chan, L.K., Kao, H.P., NG, A and Wu, M.L., (1999). Rating the importance of
customer needs in quality function deployment by fuzzy and entropy methods, int. J.
Prod. Res., vol. 37, no. 11, 2449 */- 2518
7. Chan L.K. and Wu, M.L. (2004), A systematic approach to quality function deployment
with a full illustrative example. Department of Management Sciences
8. Dube, K., 2009, [Personal communication], 20 May.
9. Enhanced Telecom Operations Map (eTOM) Business Process Framework Release
6.0 viewed 10 August, 2009, http://www.amdocs.com/public/etom6.pdf.
10. eTOM Framework viewed June, 2009, http://infratek.com.tr/en/images/etom-
framework.pngJooste, CJ, 2003, Product Management, New Africa Books, SA.
11. Galbreath, J, Rogers, T, 1999, „Customer relationship leadership: a leadership and
motivation model for the twenty-first century business‟, The TQM Magazine, vol.11,
no.3, pp. 161-171, MCB UP Ltd.
12. Guinta, L, Praizler, N, 1993, The QFD Book. The team approach to solving problems
and satisfying customers through Quality Function Deployment, AMACOM Books,
N.Y.
13. Hammer, M, Champy, J, 1993, Reengineering the Corporation: A manifesto for
Business Revolution, Nicholas Brealey Publishing, NY.
14. Jain, SC, 1997, Marketing Planning and Strategy, 5th ed., South-Western College
Publications, Cincinnati, OH.
15. Kelly, MB, 2003, „The Telemanagements Forum‟s Enhanced Telecom Operations
Map (eTOM)‟, Journal of Network and Systems Management, vol.11, no.1.
50
16.
17. Kiska, J, 2002, Customer Experience management: Using technology to build an
unshakable customer supplier relationship’, CMA.
18. Kotze, TG, Prinsloo, M, Du Plessis, PJ, 2003, Customer Management: Fad or
science?, College of Economic and management Sciences, University of South
Africa.
19. Lovelock, GH, 1996, Services Marketing, 3rd ed., Prentice-Hall, Upper Saddle River,
NJ.
20. Makgato, NOT, 2009, [Personal communication], 24 May.
21. Meyer, C, Schwager, A, 2007, „Understanding customer experience‟, Harvard
Business Review, reprint R0702G, Garvard Business School Publishing Corporation.
22. MTN complaints, viewed May, 2009, http://www.hellopeter.com.
23. Peppard, J, Rowland, P, 1995, The essence of Business Process Re-Engineering,
Prentice Hall, New York.
24. Pine, BJ, Gilmore, JH, 1998, „Welcome to the experience economy‟, Harvard
Business Review, Reprint 98407, Harvard.
25. Sherrenie, S, 2009, CCS Workshop, University of Pretoria.
26. Smit, DNE, Du Plessis, PJ, 2002, New service development: a literature survey,
College of Economic and management Sciences, University of South Africa.
27. Zeithaml, VA, Bitner, MJ, 2000, Services Marketing: Integrating Customer Focus
across the firm, 2nd ed., McGraw-Hill, NY.

51
Appendices
APPENDIX A
Table 2: Customer survey
Staff training
REQUIREMENT IMPORTANCE
RATING SATISFACTION RATING
Company A Company B Company C
Staff knowledge
Staff competency
Staff efficiency
Staff professionalism
Cell phone repair process
REQUIREMENT IMPORTANCE
RATING SATISFACTION RATING
Company A Company B Company C
Speed
Quality
Cost effectiveness
In-store service
Temporary handset
New contract deals process
REQUIREMENT IMPORTANCE
RATING SATISFACTION RATING
Company A Company B Company C
Speed
Ease of transaction
Handset availability
Contract upgrades
REQUIREMENT IMPORTANCE
RATING SATISFACTION RATING
Company A Company B Company C
Speed
No upgrade fee
Ease of transaction
In-store customer service
REQUIREMENT
IMPORTANCE RATING
SATISFACTION RATING
Company A Company B Company C
No queues
Quick service
Knowledgeable assistance
Professionalism
Friendliness

52
APPENDIX B
Table 3: Customer requirements importance ratings
No. Sta
ff c
om
pete
ncy
Sta
ff e
ffic
iency
Sta
ff p
rofe
ssio
nalism
Speed o
f re
pair
s
Quality
of
repair
s
Tem
pora
ry h
andse
t
New
deals
speed
New
deals
ease
of
transa
cti
on
Handse
t availabilit
y
Upgra
de s
peed
No u
pgra
de f
ee
Upgra
de e
ase
of
transa
cti
on
No/s
hort
queues
Quic
k i
n-s
tore
serv
ice
Fri
endliness
1 9 9 9 9 9 5 9 5 5 9 9 5 5 9 9
2 9 3 3 9 9 9 3 3 9 3 9 3 1 3 9
3 3 9 9 9 9 3 9 9 9 9 3 9 0 9 3
4 6 9 9 9 9 5 7 9 9 9 7 9 7 7 9
5 9 9 9 9 8 3 7 3 9 8 9 8 9 7 8
6 6 8 8 7 9 0 8 6 2 3 8 9 3 7 4
7 9 9 3 3 9 9 3 9 9 3 3 9 3 9 3
8 4 9 9 9 9 3 9 9 9 9 3 9 0 9 3
9 3 3 5 5 5 5 5 5 5 5 5 5 4 5 5
10 9 7 7 7 9 6 7 9 9 9 9 9 7 8 9
11 3 9 9 9 9 3 9 9 3 9 9 3 9 9 9
12 7 6 8 8 7 8 6 8 8 5 6 6
13 7 8 8 9 8 4 8 8 8 9 9 7
14 9 7 6 8 9 5 7 8 5 8 8 7 6 7 7
15 8 8 8 6 8 5 7 6 8 8 7 6 4 6 5
16 9 9 3 9 9 9 9 9 9 9 9 7 9 7 9
17 8 6 9 9 9 5 5 7 9 9 7 6 8 9 8
18 7 9 5 9 9 7 4 9 9 9 9 9 9 9 9
19 9 9 9 9 9 9 3 9 9 3 3 3 9 9 9
20 7 8 8 8 9 6 7 9 8 5 6 8 4 6 9
21 7 6 9 5 4 8 7 6 8 7 7 8 8 8 7
22 5 5 5 9 9 9 9 9 9 1 1 1 9 9 9
23 9 9 7 8 9 4 8 9 9 9 1 9 3 7 9
24 8 7 8 7 8 8 9 8 9 9 8 9 7 8 8
25 7 6 5 9 7 6 9 7 8 9 9 7 9 8 6
26 7 9 5 8 9 5 7 5 8 6 5 8 7 6 5
27 9 9 9 9 9 7 9 9 9 9 4 9 6 9 9
28 9 9 7 7 9 8 9 9 9 9 5 9 7 7 9
29 9 9 9 9 9 3 9 9 9 3 3 9 9 9 9
30 8 8 9 6 9 6 7 8 8 7 8 8 8 8 9
31 3 0 1 1 9 0 1 9 3 1 3 9 0 3 3
32 3 3 5 7 9 5 9 9 9 6 7 8 5 8 9

53
33 9 9 9 9 9 5 9 9 5 9 9 9 9 9 9
34 5 6 7 5 5 7 9 7 8 7 6 4 7 9 5
35 8 8 8 5 6 7 9 9 9 8 9 9 7 8 9
36 5 5 5 9 9 9 5 5 5 5 5 5 6 7 8
37 8 9 5 9 9 6 8 9 9 9 9 9 9 9 9
38 9 8 9 9 9 9 9 9 9 9 9 9 9
39 9 9 9 9 9 8 7 4 6 8 7 7 6 5 8
40 5 8 7 9 9 7 9 9 9 9 9 9 8 9 5
41 9 7 6 9 9 8 6 6 9
42 8 9 9 9 8 5 8 8 5 7 8 6 6 6 8
43 9 9 3 9 9 1 3 9 9 3 3 9 9 9 3
44 6 5 7 5 5 6 7 8 7 8 8 9 8 7 5
45 8 8 9 8 9 6 8 9 7 8 7 8 9 9 8
46 6 8 7 7 5 6 9 8 6 7 8 6 7 8 8
47 7 6 7 7 7 7 8 7 6 6 7 6 6 6 7
48 9 9 9 9 9 9 9 9 9 9 9 9 9 9 9
49 9 9 3 9 9 9 9 9 9 9 9 9 9 9 9
50 9 9 9 9 9 8 9 9 8 7 9 9 9 9 7
51 9 8 9 7 8 7 8 6 6 7 8 9 8 8 8
52 8 8 9 8 9 5 6 8 9 7 8 8 5 6 9
53 9 9 9 9 9 9 9 9 9 9 9 9 9 9 9
54 6 6 7 8 4 3 5 4 6 6 7 5 1 1 4
55 7 8 9 5 9 8 6 6 7 8 9 7 6 8 8
56 9 8 6 7 9 7 9 9 9 7 8 9 9 9 7
57 8 8 8 5 6 6 7 7 6 7 7 7 7 7 7
58 8 8 8 9 9 9 8 8 8 8 8 8 9 9 9
59 9 3 3 9 9 1 1 9 3 0 3 9 3 9 3
60 8 7 6 6 8 7 6 9 8 8 8 9 7 8 8
61 9 3 9 3 9 3 3 9 3 3 3 9 9 3 3
62 1 1 9 1 9 1 1 1 9 1 3 1 9 9 9
63 9 9 9 3 9 1 9 3 1 3 9 3 9 9 9
64 8 9 6 9 9 8 7 7 9 3 5 7 7 8 8
65 9 9 9 9 9 9 9 9 9 9 9 9 9 9 9
66 9 9 8 9 9 8 9 7 9 8 9 9 9 9 9
67 7 7 7 9 9 9 8 8 8 8 8 8 9 9 9
68 3 9 9 7 8 9 9 8 7 9 9 8 8 9 9
69 8 5 6 3 5 8 9 6 5 9 8 5 7 8 8
70 8 8 6 7 8 6 9 5 6 6 8 7 8 9 9
71 7 3 7 8 9 6 8 8 7 5 6 8 9 9 8
72 5 7 9 5 9 5 8 7 7 9 9 8 4 5 8
73 8 7 8 9 9 6 7 8 9 6 7 9 9 8 7
74 9 8 7 9 7 8 7 8 9
75 9 7 9 7 8 6 6 8 8 8 8 9 8 7 7
76 9 9 7 6 7 5 7 8 8 9 7 5 7 7 6
77 9 8 8 7 8 8 8 8 8 8 8 8 9 8 9

54
78 9 8 9 9 9 6 9 9 7 8 9 9 8 9 8
79 9 9 9 9 9 7 9 8 7 9 9 9 7 7 9
80 9 9 9 6 8 6 9 9 9 7 9 9 6 8 7
81 9 9 9 9 9 9 9 9 9 9 9 9 9 9 9
82 8 9 7 8 9 7 7 8 9 6 8 8 9 9 8
83 9 8 9 9 9 4 9 7 4 8 2 7 9 9 7
84 9 9 8 7 9 7 9 9 8 9 7 8 6 8 7
85 8 5 7 8 9 2 6 9 8 6 9 8 6 5 7
86 8 9 9 8 9 1 9 8 8 9 7 8 6 7 8
87 9 9 9 9 9 7 9 9 9 9 9 9 7 9 7
88 7 8 8 7 9 7 9 9 8 8 9 9 9 9 7
89 9 7 8 9 9 8 7 8 7 7 9 8 9 8 5
90 9 7 9 7 8 5 7 7 9 7 9 9 9 7 9
91 9 8 9 9 5 1 9 7 6 4 9 9 5 9 5
92 9 9 7 9 8 2 6 8 8 7 9 8 8 9 5
93 7 6 9 8 7 6 7 6 9
94 9 9 8 9 9 7 9 8 9 7 9 8 8 9 6
95 9 8 9 9 9 5 9 9 5 9 8 9 9 9 9
96 7 9 6 8 9 1 8 7 9 9 8 7 7 9 5
97 7 9 6 8 9 1 8 7 9 9 8 7 7 9 5
98 3 9 9 9 9 3 9 3 3 9 3 3 9 9 3
99 3 9 3 9 3 9 9 3 9 9 9 3 9 9 3
100 7 6 9 9 9 7 8 8 6 9 7 9 7 9 8
AVE 7.53 7.54 7.43 7.66 8.28 5.87 7.47 7.60 7.47 7.12 7.17 7.54 7.05 7.81 7.29

55
APPENDIX C
Table 4: Company A satisfaction ratings
No
.
Staf
f co
mp
ete
ncy
Staf
f e
ffic
ien
cy
Staf
f p
rofe
ssio
nal
ism
Spe
ed
of
rep
airs
Qu
alit
y o
f re
pai
rs
Tem
po
rary
han
dse
t
Ne
w d
eal
s sp
ee
d
Ne
w d
eal
s e
ase
of
tran
sact
ion
Han
dse
t av
aila
bili
ty
Up
grad
e s
pe
ed
No
up
grad
e f
ee
Up
grad
e e
ase
of
tran
sact
ion
No
/sh
ort
qu
eu
es
Qu
ick
in-s
tore
se
rvic
e
Frie
nd
line
ss
1 2 3 5 3 5 4 2 3 3 4 5 4 3 4 4
2 4 3 4 4 4 4 3 3 3 5 5 5 4 4 5
3 4 5 5 4 5 5 3 4 4 5 4 4 2 3 5
4 3 3 3 4 4 3 4 3 3 4 3 3 3 4 4
5 3 4 1 5 4 2 1 3 2 1 6 6 4 4 4
6 2 5 3 5 4 4 3 4 4 3 3 4 4 4 5
7 3 3 3 3 3 1 3 3 2 3 2 2 3 3 5
8 4 3 4 3 3 3 4 3 3 3 3 3 4 4 4
9 3 1 5 5 3 1 2 1 3 2 1 4 1 3 5
10 2 3 2 2 1 1 3 2 2 3 2 3 3 2 3
11 3 3 5 4 5 1 3 4 3 3 4 5 5 4 1
12 4 3 4 2 3 2 4 3 2 3 4 3 3 4 3
13 4 4 4 4 4 3 4 4 4 4 3 4 5 4 4
14 4 3 2 5 4 3 5 4 3 4 3 3 3 4 4
15 3 2 3 2 2 2 2 3 3 1 1 4
16 3 3 2 3 4 2 2 2 3 3 4 2 1 3 3
17 3 5 5 4 4 1 5 4 2 4 3 4 3 4 5
18 3 4 4 4 4 4 4 4 4 4 3 4 4 4 4
19 3 3 4 4 3 1 4 4 4 4 2 4 3 3 3
20 5 3 3 5 5 5 5 3 3 3 5 3 1 2 5
21 4 3 4 2 4 1 3 3 3 2 4 1 2 2 3
22 3 3 4 4 3 1 4 4 5 4 2 4 3 3 3
23 5 5 5 5 5 4 5 5 3 5 4 5 5 4 3
24 4 4 5 3 3 3 5 4 3 5 3 4 3 5 4
25 3 3 3 2 1 1 2 3 4 1 4 3 4 4 4
26 4 4 4 3 2 1 2 3 1 3 2 1 2 3 4
27 3 4 3 3 4 3 3 4 3 4 3 3 3 3 3
28 3 3 2 4 3 1
29 4 3 5 2 4 1 2 2 3 3 3 3 2 2 3
30 4 3 3 3 4 1 3 3 4 3 3 3 3 4 4

56
31 1 1 1 1 1 1 4 3 4 3 4 4 3 3 3
32 1 2 1 3 1 1 2 1 1 2 1 3 1 1 1
33 2 2 4 3 4 3
34 3 1 2 2 3 1 3 3 3 4 1 1 1 1 3
35 3 1 5 3 4 2 3 3 4 2 1 3 1 2 4
36 5 5 5 4 4 4 5 5 5 5 5 5 5 4 3
37 2 3 3 3 4 3 5 5 3 4 4 4 4 4 3
38 5 5 5 5 5 5 5 5 5 5 5 5 5 5 5
39 4 5 4 4 5 3 5 5 4 5 5 4 5 4 4
40 2 2 4 3 4 1 4 3 2 3 4 2 2 2 3
41 3 3 3 1 1 3 3 3 3 3 3 4 1 4
42 1 2 3 3 3 3 3 4 3 4 4 3 3 4
43 5 4 3 4 5 3 4 5 4 4 3 2 4 5 5
44 5 3 4 5 4 4 5 3 4 5 5 4 5 4
Av 3.3 2.9 3.5 3 3.4 2.1 4 4 3.5 3.6 3.4 3.2 3.2 3.1 3.4

57
APPENDIX D
Table 5: Company B satisfaction ratings
No
.
Staf
f co
mp
ete
ncy
Staf
f e
ffic
ien
cy
Staf
f p
rofe
ssio
nal
ism
Spee
d o
f re
pai
rs
Qu
alit
y o
f re
pai
rs
Tem
po
rary
han
dse
t
New
dea
ls s
pee
d
New
dea
ls e
ase
of
tran
sact
ion
Han
dse
t av
aila
bili
ty
Up
grad
e sp
ee
d
No
up
grad
e fe
e
Up
grad
e e
ase
of
tran
sact
ion
No
/sh
ort
qu
eues
Qu
ick
in-s
tore
ser
vice
Frie
nd
lines
s
1 3 3 3 2 3 2 3 3 3 3 3 3 3 3 3
2 3 3 3 4 3 3 4 4 3 4 3 4 3 3 3
3 2 2 4 5 4 2 4 5 1 4 3 2 5 4 2
4 3 3 4 4 5 1 3 2 2 3 3 2 1 1 2
5 5 4 4 4 3 5 3 3 2 5 2 3 1 3 5
6 3 2 1 2 4 1 3 5 2 3 3 2 2 3 2
7 5 4 4 4 4 1 5 5 5 5 3 4 4 4 4
8 2 2 2 2 2 2 2 2 3 1 1 2 2 4 2
9 3 4 3 4 2 1 3 4 4 3 2 2 3 3 2
10 4 4 5 5 4 4 4 4 3 4 5 4 5 4 5
11 4 3 3 3 3 3 3 3 1
12 3 3 4 4 4 3 2 4 5
13 4 4 5 5 4 3 3 5 4 5 4 3 5 4 3
14 4 4 5 4 4 3 4 3 4 5 3 5 5 3 5
15 5 5 4 3 3 2 4 4 3 4 2 3 4 3 2
16 3 4 5 4 5 4 5 4 5 5 4 5 3 4 4
17 3 3 4 2 2 3 4 3 2 3 2 3 3 3 2
18 4 3 5 1 2 2 4 4 3 4 5 3 3 2 4
19 4 4 4 2 4 1 4 4 4 4 2 3 2 3 5
20 3 3 3 4 2 2 3 4 2 5 5 4 3 4 1
21 3 3 4 2 4 2 4 4 4 4 3 5 3 3 4
22 3 4 5 4 5 1 5 4 4 5 5 5 4 4 5
23 4 4 4 3 5 4 3 4 3 3 3 3 3 4 4
24 3 3 4 2 3 4 2 4 3 3 3 4
25 3 2 4 1 2 1 4 4 5 4 4 2 4 4 3
26 4 4 4 5 5 2 5 5 5 4 4 4 4 4 4
27 3 4 4 2 1 1 4 1 3 4 4 2 4 4 4
28 3 3 3 4 4 3 3 3 3 4 3 4 3 4 4
29 4 3 5 2 3 1 4 3 3 2 3 2
30 4 3 5 3 4 1 2 4 3 4 2 4 2 2 3
31 4 4 4 3 4 1 3 4 4 3 3 3 3 4 4

58
32 3 4 3 4 5 3 5 4 4 5 1 3 3 4 3
33 4 3 3 2 4 4 5 3 4 2 4 4 3 2
34 5 5 5 4 4 4 4 4 5
35 4 4 4 3 4 2 4 4 4
36 3 4 3 1 3 1 5 4 4 3 3 4 4 5 4
37 4 4 4 5 4 1 3 4
38 3 4 3 2 3 1 1 2 1 2 2 1 5 5 5
39 4 4 4 3 4 4 4 4 4 3 2 3 2 4 3
40 4 5 4 4 5 4 3 4 4 4 4 4 4 4 5
41 5 4 5 3 2 1 3 4 4 4 3 4 4 5 4
42 5 4 4 3 4 4 3 3 4 4 3 3 1 3 2
43 4 2 4 5 5 1 2 1 4 2 1 4 2 4 4
44 4 5 5 3 3 1 5 5 5 5 4 5 3 3 3
45 4 4 4 2 3 3 5 5 5 5 3 4 2 3 3
46 3 4 5 4 3 3 4 3 4 3 2 4 1 2 5
47 3 3 4 4 4 2 2 3 2 3 3 3 2 4 4
48 5 5 4 2 4 3 5 5 5 5 4 3 2 4 5
49 3 2 4 3 3 1 4 4 4 4 3 4 4 4 3
50 4 3 3 3 3 1 4 4 2 3 1 2 4 3 3
51 5 5 5 5 5 4 5 5 5 4 4 4 5 5 4
52 2 1 1 1 1 3 2 1 5 3 3 3 1 1 4
53 3 3 3 3 2 1
54 5 3 4 5 5 5 5 5 5
55 4 4 4 5 4 1 4 5 5 2 3 4 5 4 2
56 4 4 4 4 5 2 4 4 2 4 3 5 4 5 4
57 5 1 3 3 4 3 4 3 3 4 4 3 3 4
58 4 2 2 2 4 5 3 4 3 4 5 4 5 4 5
59 5 4 4 5 3 4 5 3 4 5 5 4 5 4 5
Av 3.71
3.46
3.83
3.25
3.56
2.39
3.62
3.70
3.49
3.80
2.98
3.36
3.21
3.55
3.57
% 74 69 77 65 71 48 72 74 70 76 60 67 64 71 71
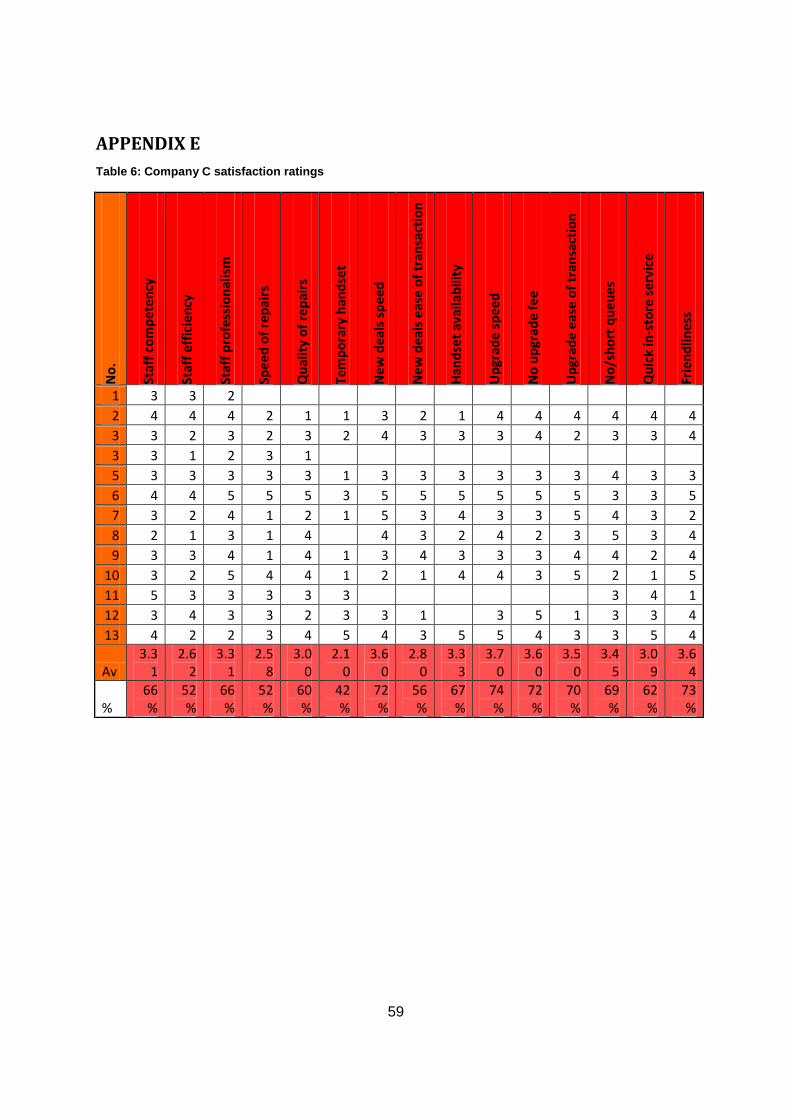
59
APPENDIX E
Table 6: Company C satisfaction ratings
No
.
Staf
f co
mp
ete
ncy
Staf
f e
ffic
ien
cy
Staf
f p
rofe
ssio
nal
ism
Spee
d o
f re
pai
rs
Qu
alit
y o
f re
pai
rs
Tem
po
rary
han
dse
t
New
dea
ls s
pee
d
New
dea
ls e
ase
of
tran
sact
ion
Han
dse
t av
aila
bili
ty
Up
grad
e sp
eed
No
up
grad
e fe
e
Up
grad
e e
ase
of
tran
sact
ion
No
/sh
ort
qu
eues
Qu
ick
in-s
tore
ser
vice
Frie
nd
lines
s
1 3 3 2
2 4 4 4 2 1 1 3 2 1 4 4 4 4 4 4
3 3 2 3 2 3 2 4 3 3 3 4 2 3 3 4
3 3 1 2 3 1
5 3 3 3 3 3 1 3 3 3 3 3 3 4 3 3
6 4 4 5 5 5 3 5 5 5 5 5 5 3 3 5
7 3 2 4 1 2 1 5 3 4 3 3 5 4 3 2
8 2 1 3 1 4 4 3 2 4 2 3 5 3 4
9 3 3 4 1 4 1 3 4 3 3 3 4 4 2 4
10 3 2 5 4 4 1 2 1 4 4 3 5 2 1 5
11 5 3 3 3 3 3 3 4 1
12 3 4 3 3 2 3 3 1 3 5 1 3 3 4
13 4 2 2 3 4 5 4 3 5 5 4 3 3 5 4
Av 3.3
1 2.6
2 3.3
1 2.5
8 3.0
0 2.1
0 3.6
0 2.8
0 3.3
3 3.7
0 3.6
0 3.5
0 3.4
5 3.0
9 3.6
4
% 66%
52%
66%
52%
60%
42%
72%
56%
67%
74%
72%
70%
69%
62%
73%


![Customer Retention [Infographic] Customer Experience](https://img.pdfslide.us/doc/110x75/55b6dceebb61eb0c598b46c8/customer-retention-infographic-customer-experience.jpg)