Embed Size (px)
Citation preview

ENGINEERING AND PROCESS DEVELOPMENT
Taylor (11) and Koffolt, Duncan, and Withrow (16). His method of calculating theoretical plates may account for this variation.
Some of the data of Furnas (11) for ring packings were not used because they did not agree with other results or cannot be recon- ciled with the work of other investigators-for example, height of equivalent theoretical plate is lower with a/&nch rings as the packed height is increased, and is lower with 1-inch than with 3/8-in~h rings.
For systems such as ethyl alcohol-water or methanol-water, where a varies widely with composition, the average a was ob- tained by a graphical integration method similar to that used by Koffolt, Duncan, and Withrow (16) to evaluate m, the slope of the equilibrium curve.
The author’s data on methanol-water, used to evaluate the ef- fect of column diameter, were obtained a t 40 to 1 reflux ratio rather than total reflux.
Koffolt and Withrow (16) and Furnas ( 1 1 ) present a large amount of data obtained a t low reflux ratios, but th’e results show very high values at low vapor-liquid ratios. The reason for this is unknown. Colburn and Pigford (7) suggest that liquid and vapor compositions are so close together that poor distribution at the ends of the column results in low efficiency.
Another explanation might be that with low reflux ratios the operating line is very close to the equilibrium curve. The as- sumption of a straight operating line may not be valid, and if the operating line actually curves toward the equilibrium curve the true number of theoretical plates would be much greater than if a straight operating line is assumed, and hence the values for height of equivalent theoretical plate would be lower.
literature Cited
w
(1) Aston, J. G., Lobo. W. E.. and Williams. B.. IND. ENG. CHEM., 39, 718 (1947).
Berg, L., and Popovac, D. O., Chem. Eng. Progr., 45,683 (1949). Bowman, J. R., IND. ENG. CHEM., 39, 745 (1947). Bragg, L. B., Ibid., 33, 279 (1941). Cannon, M. R., Manning, R. E., and Heinlein, A. C., C h m .
Colburn, A. P., and Chilton, T. H., IND. ENG. CHEM., 27, 255
Colburn, A. P., and Pigford, R. L., “Chemical Engineers’ Hand-
Eng. PTOgT., 47, 344 (1951).
(1 935).
book.” 3rd ed.. New York. McGraw-Hill Book Co.. 1950. Deed, D. W., Schutz, P. W., and Drew, T. B., IND. ENG. CHEM.,
Fisher, A. W., and Bowen, R. J., Chem. Eng. Progr., 45, 359 39, 766 (1947).
(1949).
ENG. CHEM., 39, 714 (1947).
Engrs., 36, 135 (1940).
New York, McGraw-Hill Book Co., 1950.
(1 951).
Forsythe, W. L., Stack, T. G., Wolf, J. E., and Conn, A. L., IND.
Furnas, C. C., and Taylor, M. L., Trans. A m . Inst. Chem.
Gilliland, E .R., “Elements of Fractional Distillation,” 4th ed.,
Hawkins, J. E., and Brent, J. A,, IND. ENG. CHEM., 43, 2611
Heinlein, A. C., M. S. thesis, Pennsylvania State College, 1949. Kirschbaum, E., “Distillation and Rectification,” pp. 313, 315,
Koffolt, J. H., Withrow, J. R., and Duncan, D. N., Trans. Am.
McCabe, W. L., and Thiele, E. W., IND. ENG. CHEM., 17, 605
Manning, R. E., M.S. thesis, Pennsylvania State College, 1949. Myles, M., Wender, I., Orchin, M., and Feldman, J., IND. ENQ.
Peters, M. S., Ph.D. thesis, Pennsylvania State College, 1951. Ryan, J. F., M.S. thesis, Pennsylvania State College, 1950. Sherwood, T. K., and Holloway, F. A. L., Trans. Am. Inst.
Sprague, E., and Fletcher, J., Dow Corning Corp., private com-
Struck, R. T., and Kinney, C. R., IND. ENG. CHEM., 42,77 (1950). Weimann, M., Chem. Fabrik, 6 , No. 40, 411 (1933).
316, New York, Chemical Publishing Co., 1948.
Inst. Chan. Engrs., 38, 259 (1942).
(1925).
CHEM., 43,1452 (1951).
Chem. Engrs., 36, 39 (1940).
munica tion.
RECEIVED for review June 14, 1952. ACCEFTED bugust 26, 1953. Prasented at the Meeting-in-Miniature, New Jersey Section, AMERICAN CHEMICAL SOCIETY, Newark, N. J., January 1961.
Application of Computing Machines Exchange Column Calculations
ASCHER OPLER f i e Dow Chemicol Co., Pittrburg, Calif.
HIS report represents the results of an intensive exploration T of the possibilities of applying digital computing machines to the mathematical treatment of ion exchange column perform- ance. Using a simple, slow speed, punched card operated computer, several different types of calculation were programmed and typical ion exchange problems were solved. This report should be interpreted as indicative of the potentialities of applying computing machines to this problem rather than as an exhaustive study.
Rosen and Winsche (18) and Rose, Lombardo, and Williams (19, 17) previously have applied computing machines to similar problems. Rosen and Winsche used an analog computer in in- vestigating the performance of a coIumn whose feed concentra- tion is a sinusoidal function of time. Rose, Lombardo, and Wil- liams described a finite difference method for calculating the per- formance of adsorption columns. Recent books have reviewed mathematical treatment of adsorption and ion exchange ( 4 , IO, 16).
Although the equations, examples, and discussions will be re- stricted to ion exchange, in all cases the techniques may be modi-
to
fied for use in adsorption column calculations. Chromatography, selective adsorption, and similar phenomena may be treated by each of the methods described.
Computing machines can play a large role in extending the num- ber of practical problems that can be treated mathematically. They may be applied to various theoretical and empirical equa- tions for the purpose of obtaining large quantities of numerical solutions; applications to the equilibrium plate and the kinetic treatment are illustrated. These machines are useful in connec- tion with a finite difference technique that requires the machine to operate as an analog of the column. The probabilistic Monte Carlo method may also be handled by automatic computing ma- chines and may ultimately lead to the most complete treatment of parameters.
With one minor exception, all calculations reported here were performed on the 602-A calculating punch of the International Business Machines Co. Other supplementary machines were used in originating and manipulating the more than 50,000 punched cards involved in this study. The 602-A was pro- grammed using both the standard wire-programming method, the
December 1953 I N D U S T R I A L A N D E N G I N E E R I N G C H E M I S T R Y . 2621

ENGINEERING AND PROCESS DEVELOPMENT
use of control panels, and the card-programming method devel- oped in this laboratory by the author. This latter method, which uses an instruction code on each card, proved useful in carrying out complex programs. Wire-programming proved most suitable for operations that were relatively simple and for probability calculations. The work described here was limited by the speed and capacity of the machine to problems of modest length and complexity. The extension to more difficult, longer problems on a high speed computing machine should be straight- forward.
Results of Equilibrium Stage Treatment Prove Adaptable to Machine Computation
Using a set of simplifying assumptions, blayer and Tompkins ( 1 3 ) have derived equations for ion exchange column perform- ance. Their assumptions are:
A column may be considered to be a vertical array of discrete, uniform layers or plates containing equal masses of adsorbent.
Equal unit volumes of developer are added in discontinuous stepwise fashion displacing previously fed volumes to succes- sively lower plates.
In the special case treated by these authors
Flow and Darticle size are such that eauilibrium occurs on each plate.
A linear isotherm relates the equilibrium on any plate, that is
The top plate contains 1.000 unit of ion A a t the start of the q * / c * = C.
operation.
Under these conditions the concentration of A in the nth unit volume leaving plate p is given by
(n + p - l)! c-1 (n - l)! p ! (1 + C ) " + P Cn,p = (1)
and the concentration of ion A on the exchange resin is given by
(72 + p - I)! 0 ( n - l)! p ! (1 + CP+p q71.p =
These two formulas may be evaluated rapidly and accurately using a punched card calculator. In general, one would wish to calculate a column profile a t any instant ( n + p constant), an elution curve for a column p plates long ( p constant), or the con- centration history of the nth volume as it passes from plate to plate (n constant) As is typical of computing machine applica- tions, an entire set of functions is calculated as a single operation
To evaluate Equations 1 and 2, they are rearranged to loga- rithmic (base 10) form
log C n , p = log (n + p - l)! - log (n - l)! -
log qn p = log (a + p - 1)' - log (n - l)! - log p ! + (n - 1) log c - (n + p ) log ( I + C) (3)
Iogp! + n l o g C - ( n + p j l o g i l + C j (4)
This may be considered equivalent to operations of the type
X - Y - Z +EG - F H (5 )
which may be performed by the 602-A machine in one operation For any calculation log C and log (1 + C ) are placed in internal storage. The punched cards carry (n - I), ( p ) , (n - 1 + p ) , and the logarithm of the factorial of each of these 3 parameters. As no punched card tables of log (n!) were reported available, a deck was prepared here. Values to log IOO! were keypunched from a table. Stirling's approximation to n! ( = n n e n c n ) was transposed to log (n!) = n log n + 1/z log 2 n + n log e and this was evaluated for 100<n<500. An accurate punched card table of nl has since become available (19). As each card passes through the machine, both log c and log q are evaluated using Equations 3 and 4. The cards are then merged with an optimum interval punched card table of antilogarithms and the corre-
Table I. Elution Calculated Using Mayer and Tompkins Equilibrium Stage Treatment
( p = 39, c = 1)
n
15 16 17 18 19 20 21 22 23 24 25 26 27 28 29 30 31 32 33 34 35 36 37 38 39 40 41 42 43 44 45
c n , p
0.00013 0,00024 0.00041 0.00068 0.00107 0,00164 0.00242 0,00346 0,00480 0.00647 0.00849 0,01087 0 01358 0.01661 0.0198'i 0.02329 0 02679 0.O3025 0.03356 0 03661 0 03930 0,04154 0,04328 0.04445 0 04505 0 ,04604 0.04447 0.04338 0,04184 0,03989 0.03762
n
46 47 48 49 50 51 52 53 54 55 56 57 68 59 60 61 62 63 64 65 66 67 68 69 70 71 72 73 74 75 76
Cn,p
0.0351 1 0.03245 0.02968 0.02689 0.02415 0,02149
0.01896 0.01659 0.01440 0.01240 0.01060 0.00982 0.00757 0,00633 0.00525 0.00433 0.00355 0.00289 0.00234 Q.00188 0.00150 0.00119 0.00114 0,00074 0.00058 O.OO046 0.00035 0,00027 0.00020 0.00015 0.00012
sponding c and p values located and punched automatically. The results are listed in the desired order by the tabulating machine. Table I gives the reeults of euch a calculation when C = I, and the column consists of 39 equilibrium plates. In accordance with Mayer and Tompkins, emax occurs when p = n / C and is close to the expected value
Using this method, a considerable number of these calculations were made for purposes of comparing the method with other calculating procedures.
Numerical Evaluation of Kinetic Solution I s Carried Out for Various Operating Conditions
Computing machines have been used also to construct solutions to various ion exchange problems employing the results obtained by the kinetic approach of Thomas (2f, 29) and others (2 , 6, $0, 26). In nonmathematical terms, an equation for conservation of a component in a section of a column is derived and converted to a form using dimensionless variables that are proportional to the mass of resin upstream and the volume of solution down- stream. An equation describing the equilibrium and kinetic re- lations in the system is then substituted in the above to arrive a t a set of partial differential equations describing the behavor of the system. In many cases it ispossible to solve these equa- tions for certain boundary conditions, such as the saturation of an initially empty column.
To illustrate, the recent work of Vermeulen and Hiester (6, 7, 84) will be considered. Using second-order reaction kinetics as a model for the mechanism, they obtain expressions that de- scribe column performance in terms of four variables:
T = the equilibrium parameter controlling the symmetry or 1 For bulk exchange T = - K
For trace exchange, how- asymmetry of the elution curve. where K is the equilibrium constant. ever, T approaches 1.0.
s = the column capacity parameter, related to p . t = the solution capacity Darameter, related to n. 2' = the memory factor, in elution of an incompletely satu-
rated column representing the solution capacity during the saturation period.
, I N D U S T R I A L A N D E N G I N E E R I N G C H E M I S T R Y Vol. 45, No. 12 2622

ENGINEERING AND PROCESS DEVELOPMENT
The solutions involve expressions of the following form. to which these authors assign the symbol Jz,y
I , represents a modified Bessel function of the first kind of
The following are some of the results derived in terms of J
Saturation of an empty column under trace or other condi-
zeroth order and imaginary argument.
values:
tions when T = 1 (linear isotherm)
C/C, = J8.f (7)
( 8 )
Elution of a partially saturated column
cic, = J B , T+ 1 - Js. t
Saturation of an empty column when r # 1 (nonlinear isotherm)
(9)
Similar combinations may be used to construct solutions for other boundary value problems.
Vermeulen and Hiester gave a small graph of c/c, when r = 1 (Zd), and a set of plots of (k - 1) against s for various levels of
c/c, at r = 0, 0.5, 1, 2, and 10 ( 6 ) . While these enable one to obtain elution curves graphically, automatic computing machines may also be used to construct solutions directly from punched card tables of J values. Brinkley, Edwards, and Smith ( 3 ) have recently prepared a table of ( I - J) for use in the related prob- lem of nonsteady state heat transfer through a bed packed with spheres. These values are given to six decimal places for a wide range of s and t . A copy of this set of punched cards was secured through the courtesy of S. R. Brinkley and rearranged in the form most suitable for these calculations. Substitution into Equa- tions 7 , 8, and 9 has been made in a straightforward manner. In the case of Equation 9, the use of floating decimal operation- calculation with numbers in decimal form along with the corre- sponding power of 10-simplifies the handling of large exponen- tiah. Tables 11, 111, and IV are examples of results obtained with these equations.
Finite Difference Method of Simulating Column Performance Is Developed
The stepwise treatment of Rose, Lombardo, and Williams (12 , 17) makes use of two of the most important capacities of an automatic computing machine-the ability to make large num- bers of calculations rapidly and to store a large number of param- eters and constants. In their treatment of adsorption columns, they divide the column length into arbitrary segments holding unit weight of adsorbent. For each increment of time, the machine calculates the change and the new composition on each
The machine is given the initial values and a method for pro- ceeding from one place in position and time to the next, and the calculation is performed automatically. Such a treatment by manual calculating methods would be too laborious to be practi- cal but is entirely feasible with modern machine methods. Two initial-value cases were used as illustrations-saturation of an initially empty column, and elution of an incompletely saturated one.
This method has been modified and extended to ion exchange problems. The analogy between the machine operation and the processes that occur during a column separation was em- phasized. Since the particular machine employed in this work lacked adequate storage facilities, the punched cards themselves served to store the needed information. Each card represented
e segment-cf. the equilibrium plates of Mayer and Tompkins (IS).
one particular position on a column a t one increment of time. The following is a list of some of the many analogies between ma- chine and ion exchange column operation
COLUMN MACHINE
servation relations. Conservation of any component
in any portion of column as maintained.
entire column is maintained.
Numerical totals must obey con-
Conservation of component for Value corresponding to initial column loading plus feed must equal sum of values in card deck less total of eluted ma- terial.
Equilibrium relations control the Equations describing the equi- ultimate performance that can librium are used by the ma- be obtained from a column at slow flow.
Usually equilibrium is only par- tially attained during unit contact time.
A t blow flow rates, longer con- tacts lead to greater attain- ment of equilibrium.
The feed solution may vary in concentration with time.
When a resin has reached its capacity, i t can accept no more ions.
chine at every step.
Xachine calculates equilibrium but allows only a given fraction of completion to occur.
Slow flow is simulated by oc- currence of repeat cards that call for further equilibration steps.
The feed concentration as a function of time is punched on a set of cards. This may be constant or vary from card to card.
q,,,p is stored in a counter in- structed so that its value must never exceed q m .
-
Table II. Saturation of Initially Empty Column Calculated Using Kinetic Treatment
8 = 39,c - 1 c / c , t c / c o
08 09 10 11 12 13 14 15 16 17 18 19 20 21 22 23 24 25 26 27 28 29 30 31 32 33 34 35 36
0.000000 0.000020 0.000038 0.000080 0.0001 15 0.000162 0.000226 0.000521 0.000925 0.001669 0.002806 0.004656 0.007353 0.011165 0,016455 0.032951 0.023508
0,044881 0.059672 0.077653 0.099067 0.124095 0.152662 0,184697 0,220001 0,268360 0,299195 0.342015 0.386415
37 38 39 40 41 42 43 44 45 46 47 48 49 50 52 54 56 58 00 62 64 66 68 70 72 74 76 78
0.431793 0.477392 0.522612 0.567065 0.610162 0.651358 0.690487 0,72711 1
0.76 0.792256 1097
0.820661 0.846 173
0.868930 0.889064 0.922064 0.946589 0.964330 0,976659 0.985182 0,990771 0.994352 0.996640
0.998060 0.998825 0,999816 0,999693 0.999830
0.999849
During the course of this study, over 50 different types of cal- culations were performed using a wide variety of initial boundary conditions, equilibrium isotherms, and kinetic and diffusional mechanisms. Several calculations will show the bmic simplicity of the method. In using this analog treatment, i t is seldom nec- essary to combine the equations, as each factor-material bal- ance, saturation, and kinetics-is given as a piecewise instruction. In the calculations described, certain parameters are canceled by being made equal to unity. This is a consequence of the small size and capacity of the machine employed. These restrictions can be removed in using a machine of greater capacity.
Figure 1 is offered as an aid in visualizing the over-all nature of the calculating procedure employed. This diagram may also
December 1953 I N D U S T R I A L A N D E N G I N E E R I N G C H E M I S T R Y 2623

ENGINEERING AND PROCESS DEVELOPMENT
TYPICAL SECTION
Figure 1. Schematic Representation of Two-Dimensional Mesh Employed in Finite Difference Approximation to Partial Differential Equations of Ion Exchange Column
Performance
Heights of dots above p,n plane represent coccentrations; sections per- pendicular to plane represent different presentations of results of ob-
served or calculated column performance
be used in conjunction with stepwise methods, and should help clarify mass-transfer relationships. Consider the column as consisting of a vertical array of points spaced A p apart. At in- tervals of time spaced An, unit volume of solution is added and contacts the first point. As the second unit is added, i t displaces the .first unit into the second point down the column, ,4 third unit is added displacing the two units previously added, and so on. At each contact of volume number n with each position p , ~ " . ~ and pn,p are to be calculated. If one considers the time of introduction of each unit volume as a horizontal coordinate, and position ae a vertical one, a useful diagram may be drawn. These two coordinates are related to the dimensionless param- eters of mass transfer treatments which are proportional at any point to the mass of adsorbent upstream and the volume of solution downstream. The vertical boundary represents the initial column conditions and the horizontal one the feed as a function of introduction time. A horizontal section represents elution of a column of length p and a vertical one the concentra- tion history of the nth unit volume while traversing the column. On the diagram, an axis passing through points where n = p/f may be regarded as the time axis and the section perpendicular to i t as isochrones or column profile gradients at constant time Tp constant). Furthermore, sections radiating from the origin at angles tan-' are lines of constant throughput a8
measured in bed volumes, Table V has been arranged in the manner described.
To calculate the changes in composition of any point in the mesh, one needs the point immediately above (descending liquid) and the point immediately to the left (previou8 status of the
(9
resin). One begins with the two points (1,O and 0 , l ) and calculates the point (1,l). From here one may proceed horizontally-as was done by Lombardo-or vertically as in this study.
Prototype Linear Calculation. A column is to be saturated with an ion A present in all cases in sufficiently low concen- tration that a linear isotherm applies. Furthermore, the par- ticle size and flow rates are so slow that equilibrium may be con- sidered to have occurred a t every point. The column is ini- tially loaded with resin in the B form and a solution of constant composition 0.1N in A is added in unit volumes a t intervals of one unit of time An. The equations that apply are material balance
Z C ~ - I , ~ + mqp, f t - l = l C n f p + mq,., (10) and equilibrium
C*n,p = (9) when 1 = 1.0 and m = 1.0
leading to
when c*n,p 0.5 (cp - ~ , n + q p , n - I ) = q * n , p (12)
c = 1.0
This, then, is the formula for proceeding from two known points ( p - 1,n) and (n - 1 , p ) to a new point ( n , p ) .
I n carrying out the calculation, a group of cards carrying the factor 0.1000 represents ionic concentration of A in each unit volume of feed solution. Another group carrying 0.0000 rep- resents the milliequivalents of A on each unit of resin. Proceed- ing in a systematic manner, each of the mesh points is evaluated numerically. Table V gives the values of c a t each value of
Table 111. Elution of Incompletely Saturated Column Calculated Using Kinetic Treatment
T - 5, s = 39, c - 1
t c/co
12 13 14 15 16 17 18 19 20 21 22 23 24 2.5 26 27 28 29 30 31 32 33 34
35 36 37 38 39 40 41 42 43 44 45 46 47 48 49 50 55 60 65 70 75 80 85 90
Table IV. Saturation of Column When Second-Order Reaction Kinetics Control
t c/co t c/co
8 = 4 0 , r = 5
22 23 24 25 26 27 28 29 30 31 32 33 34 35
0.000080 0.000143 0,000252 0,000439 0.0007E7 0,001297 0,002203 0.003720 0.006244 0.010420 0.017282 0.028459 0.046429 0.074753
0.118054 0.181393 0.268228 0.377358 0.500419 0.732333 0.881972 0.953330 0.982504
0.993548 0.997663 Of999182 0.999692 0.999897 0.999999
2624 I N D U S T R I'A L A N D E N G I N E E R I N G C H E M I S T R Y Vol. 45, No. 12

L1
i 0001063 88000 S E W @%8$?2 O O ~ Q . ?N l?? 9399.
-00000 00000
O n "ggg &Egg 89999 . ? ? . e 00000 00000
p and n. Each value is listed from a single card. By properly manipulat- ing the cards, the resulta can be arranged in forms representative of an elu- tion curve, a column pro- file, a concentration his- tory, and/or a curve showing the concentra- tion a t thesame through- put-measured in bed volumes-for v a r i o u s l e n g t h columns. This versatility is one of the advantages of this type of calculation.
This may be considered the prototype calcula- tion, for i t represents the simplest possible case of ion exchange. The cal- cu la t ions subsequently described may be viewed as extensions of the pro- totype to more complex cases.
N o n e q u i l i b r i urn Case, Film DifEusion Con t r ol 1 in g, Rapid Flow Rate. In the case in which the attainment of equilibrium is most strongly limited by the rate of diffusion of ions through the liquid film surrounding each parti- cle of resin, the follow- ing kinetic relationship has been shown to apply by Boyd, Adamson, and Myers (I, 8 ) and others (6, 11, 80).
'% = k; ( c - c * ) (13 ) dT
This states that the rate of change of ion A on the resin is proportional to the difference between the actual solution con- centration of A and the c o n c e n t r a t i o n of the bounding film that iR assumed to be a t equilib- rium w i t h t h e r e s in surface.
In carryingout the cal- culation, Equation 10 was used for material balance relationship and Equation 13 was trans- formed to its finite dif- ference equivalent
Since AT = 1 in this
case we have arrived at a method of finding the difference between the concentration a t one point and the next. In most cases, the machine proceeded in three steps:
1. From qn- l .P , the equilibrium value c " - , , ~ * was calcu-
2. The value of (cn,*--l - cn-lap*) was calculated and multi-
3. The quantity Aq was added to qPvR - 1 and, using the mate-
lated according to the equilibrium relations specified.
'plied by k; to obtain the transferred quantity.
rial balance Equation 10, new values of cn ,p and qn ,p were found
Table VI lists the results for such a calculation under conditions of elution of a column which had been treated with five unit volumes of a solution 0.1N in A, and then eluted with B solution of the same normality. The equilibrium isotherm was assumed to be that represented by Equation 11. The results are listed in the form equivalent to an elution curve..
Icj is taken as 0.8.
Table VI. Elution of Partially Saturated Column with External Diffusion Controlling Rate
(ki = 0.8, T = 5, C - 1, p = 25) n c n , p n C n , p
ENGINEERING AND PROCESS DEVELOPMENT
22 23 24 25 26 27 28 29 30 31 32 33 34 35 36 37 38
0.2092 0.2197 0.2271 0.2311 0.2319 0.2296 0.2243 0.2166 0.2067 0.1952 0,1825 0.1688 0.1548 0.1406 0.1266 0.1130 0.1001
Film DiBusion Case, Slow Flow Rate. IQ these calcula- tions, the case of slow flow is simulated by permitting the con- tact between c and q to last for times Z/f wherefis the linear flow rate. For the maximum rate A p / A n , f ie taken w 1.0. For example, i f f = 0.6 (flow rate halved), the calculations described above are repeated once again. The value of c* used now is c ; , ~ * , the equilibrium value after the first transfer a t point n,p. All of these operations are carried out automatically, and only the results of the second dalculation are listed as in Table VII.
Table VII. Elution of Band of 1.0 Unit Concentration Adsorbed on First Plate at Flow Rate of f = 0.5
(Film diffuaion is rate-controlling with k; - 0.8, C = 1, p = 12)
1 2 3 4 5 6 7 8 9 10
11 12 13 14 15 16 17 18 19 20 21 0.0101
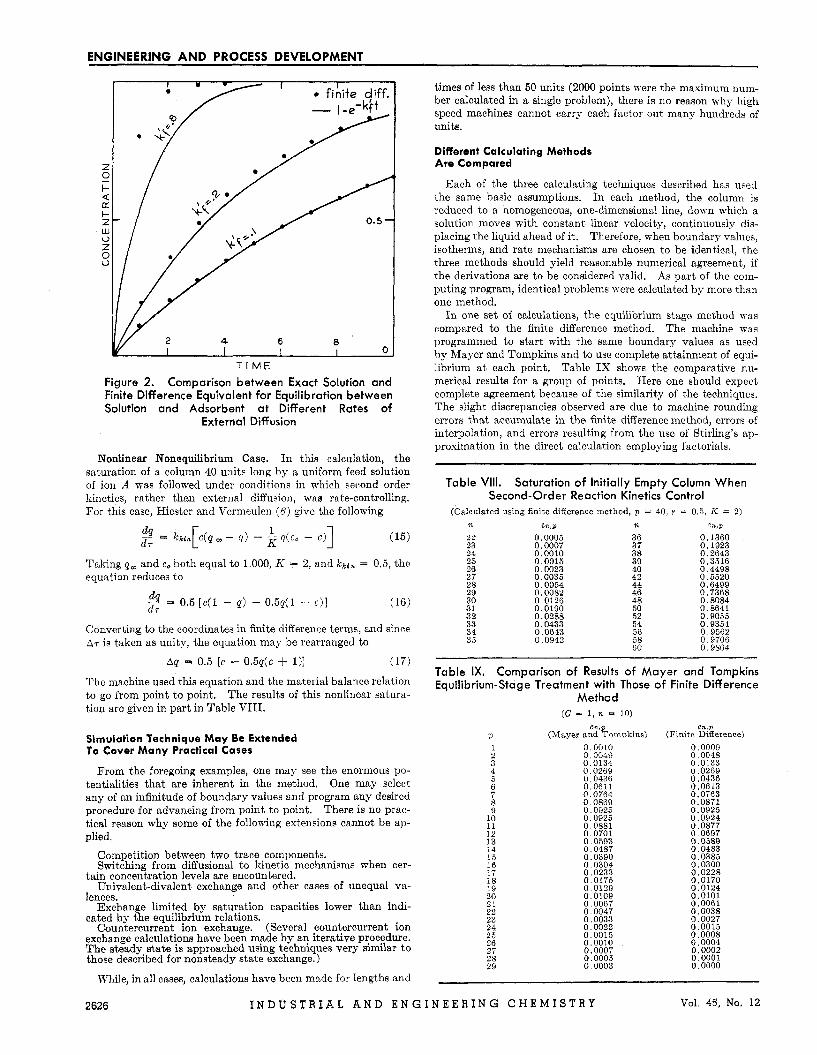
Since, upon integration, we obtain q = 1 - e - k f r , i t is of some interest to compare the results obtained by finite values of A r to that by using infinitesimals dT. When k; is small, Aq is relatively small and agreement is relatively good. Figure 2 compares the equilibration arrived a t by finite difference methods when k = 0.1 and by direct evaluation of (1 -
In the case of slow flow, the prpcess may be simplified using single contacts and modifying k$. The correct k j may be found by reading the ordinate on Figure 2 corresponding to the abscissa for contact time. In the examp!e shown in Table VII, identical results were obtained by using k/ = 0.96 with single contacts.
ENGINEERING AND PROCESS DEVELOPMENT
T I M E
Figure 2. Comparison between Exact Solution and Finite Difference Equivalent for Equilibration between Solution and Adsorbent at Different Rates of
External Diffusion
Nonlinear Nonequilibrium Case. In this calculation, the saturation of a column 40 units long by a uniform feed solution of ion A was followed under conditions in which second order kinetics, rather than external diffusion, was rate-controlling. For this case, Hiester and Vermeulen (6) give the following
Taking q m and co both equal to 1.000, K = 2, and kkin = 0.5, the equation reduces to
2 = 0.5 [ c ( l - p) - 0.5p(1 - c ) ] d r
Converting to the coordinates in finite difference terms, and since AT is taken as unity, the equation may be rearranged to
Ap = 0.5 [C - 0.5q(c $. I)] (17)
The machine used this equation and the material balance relation to go from point to point. The results of this nonlinear satura- tion are given in part in Table VIII.
Simulation Technique M a y Be Extended To Cover M a n y Practical C a s e s
From the foregoing examples, one may see the enormous po- tentialities that are inherent in the method. One may select any of an infinitude of boundary values and program any desired procedure for advancing from point to point. There is no prac- tical reason why some of the following extensions cannot be ap- plied.
Competition between two trace components. Switching from diffusional to kinetic mechanisms when cer-
tain concentration levels are encountered. Univalent-divalent exchange and other cases of unequal va-
lences. Exchange limited by saturation capacities lower than in&-
cated by the equilibrium relations. Countercurrent ion exchange. (Several countercurrent ion
exchange calculations have been made by an iterative procedure. The steady state is approached using techniques very similar to those described for nonsteady state exchange.)
While, in all cases, calculations have been made for lengths and
times of less than 50 units (2000 points were the maximum num- ber calculated in a single problem), there is no reason why high speed machines cannot carry each factor out many hundreds of units.
Different Calculating Methods Are Compared
Each of the three calculating techniques described has used the same basic assumptions. In each method, the column is reduced to a homogeneous, one-dimensional line, down which a solution moves with constant linear velocity, continuously dis- placing the liquid ahead of it. Therefore, when boundary values, isotherms, and rate mechanisms are chosen to be identical, the three methods should yield reasonable numerical agreement, if the derivations are to be considered valid. As part of the com- puting program, identical problems were calculated by more than one method.
In one set of calculations, the equilibrium stage method was compared to the finite difference method. The machine was programmed to start with the same boundary values as used by blayer and Tompkins and to use complete attainment of equi- librium a t each point. Table I X shows the comparative nu- merical results for a group of points. Here one should expect complete agreement because of the similarity of the techniques. The slight discrepancies observed are due to machine rounding errors that accumulate in the finite difference method, errors of interpolation, and errors resulting from the use of Stirling’s ap- proximation in the direct calculation employing factorials.
Table VIII. Saturation of Initially Empty Column When Second-Order Reaction Kinetics Control
(Calculated using finite difference method, p = 40, r = 0.5, K = 2) n Cn,p n cn,p
22 23 24 25 26 27 28 29 30 3 1 32 33 34 35
0.0005 0.0007 0.0010 0.0015 0,0023 0.0036 0.0054 0.0082 0.0126 0,0190 0.0288 0.0433 0.0643 0,0942
36 37 38 39 40 42 44 46 48 50 52 54 56 58 60
0,1360 0.1923 0.2643 0.3516 0.4498 0.5520 0.6499 0,7368 0.8084 0.8641 0,9055 0.9364 0 I 9562 0,9706 0.9804
Table IX. Comparison of Results of Mayer and Tompkins Equilibrium-Stage Treatment with Those of Finite Difference
Method (C = 1, n 10)
cn,p C n ! P P (Mayer and Tompkins) (Finite Difference) 1 2 3 4 5 6 7 8 9
10 11 12 13 14 15 10 17 18 19 20 21 22 23 24 25 26 27 28 29
0.0010 0,0049 0.0134 0,0269 0,0486 0,0611 0.0764 0,0869 0.0925 0.0925 0.0881 0.0701 0.0593 0,0487 0.0390 0.0304 0,0233 0.0175 0.0129 0,0109 0,0067 0.0047 0.0033 0.0022 0.0015 0.0010 0.0007 0.0005 0,0003
0,0009 0,0048 0.0133 0.0269 0.0436 0.0613 0,0763 0.0871 0.0925 0.0924 0,0877 0 0697 0.0589 0.0483 0.0385 0,0300 0,0228 0.0170 0.0124 0.0101 0.0061 0,0038 0,0027 0,0015 0,0008 0.0004 0,0002 0.0001 0.0000
2626 I N D U S T R I A L A N D E N G I N E E R I N G CHEMISTRY Vol. 45, No. 12
ENGINEERING AND PROCESS DEVELOPMENT
As one might expect, it is somewhat more difficult to compare the mass transfer method with the finite difference method. The following treatment was suggested by J. B. Rosen.
The finite difference solution as outlined may be considered a numerical solution of the partial differential equations of column performance with neglect of differences higher than the first. To estimate the magnitude of this error, Taylor's formula may be applied to the basic differential equation dc/dp = dq/dn. This yields an equation giving the finite difference in c in terms of partial derivatives.
A crude estimate of the error (neglecting interaction terms and derivatives higher than the second) a t point n , p is given by
1 c6 1 < f 1 laverme when A p is taken as 1
and similarly
when An is taken as 1
Thus, according to the magnitude of the second derivatives, there is a maximum mesh size that must not be exceeded if the error is to fall below prescribed limits. For example,,in the case of film diffusion, slow flow (see also Figure 2) as kf increases, the second derivative becomes larger, and therefore An and A p must become smaller.
In the case of a linear isotherm, the second derivative,
vanishes and the first difference type of approximation is more valid. Table X compares the results obtained for a column of length n = 19 when saturated under conditions where linear kinetics apply.
Monte Carlo Methods Are Capable of Treating Problems Of Column Diameter and Nonuniform Flow
Developments in high speed computing and in probability theory have made possible the development of a technique called the Monte Carlo method (14, 16). Instead of a single re- sult, one obtains a large number of solutions to a problem using an initial distribution of random numbers and probability theo- rems equivalent to the rigorous statement of the problem. From the mean and distribution of the results, one can find the solution and its variance. This has led to two general techniques. In one, the Monte Carlo method is used to solve difficult prob- lems in their mathematical form-e.g., multiple integrals of high order, large matrices, certain partial differential equations, and eigen-value problems (6, 26). Another version, sometimes re- ferred to as the analog technique (8, g), requires the setting up of probability models of a physical process. Variables with ran- domly distributed values represent the particles involved in the process. After the particles transverse the analog, the distribu- tion of their individual histories is studied and thus the behavior of the system explored. Such techniques have been applied to multiple scattering of neutrons and diffusion with complex barriers (8, 9).
The possible application of these two techniques to the prob- lems of ion exchange has been investigated. Thus far, no suc- cessful Monte Carlo procedure has been devised for solving the partial differential equations of mass transfer. The advantage offered by this method of solution would be the possibility of a direct solution in three dimensions-representing time, column length, and width-thus clarifying phenomena related to column width, such as coning and wall effect.
The analog technique appears to offer considerably greater promise at the present time. At this point, the close relation be- tween the finite difference method described above and the Monte
Carlo method should become apparent. The finite difference method may be considered an analog one-dimensional Monte Carlo treatment in which the particle (unit volume) takes a random walk with probability 1.0 of advancing to the next step in l/f chances.
Although several three-dimensional random walks inside of a cylindrical mesh were carried out, most calculations made in- volved only two dimensions-Le., physical dimensions, length and width. A column was represented by a rectangular array of mesh points-circular symmetry was assumed along any diam- eter. Just as in the finite difference method, a single unit volume was followed as it transversed the column. The principal dif- ferences were: .
One additional boundary was involved-the horizontal distribution of the feed solution across the top of the column Variations in this boundary showed the effects of nonuniform distribution of the influent solution.
The volume under study could move downward, 40, the right or left, or remain stationary with varying probabilities, which could be remembered by the calculating machine. The linear flow rate was taken into consideration in fixing the magni- tude of these probabilities in any particular set of conditions.
Contact with the walls produced a reflection of the liquid to a mesh point determined by the angle of contact.
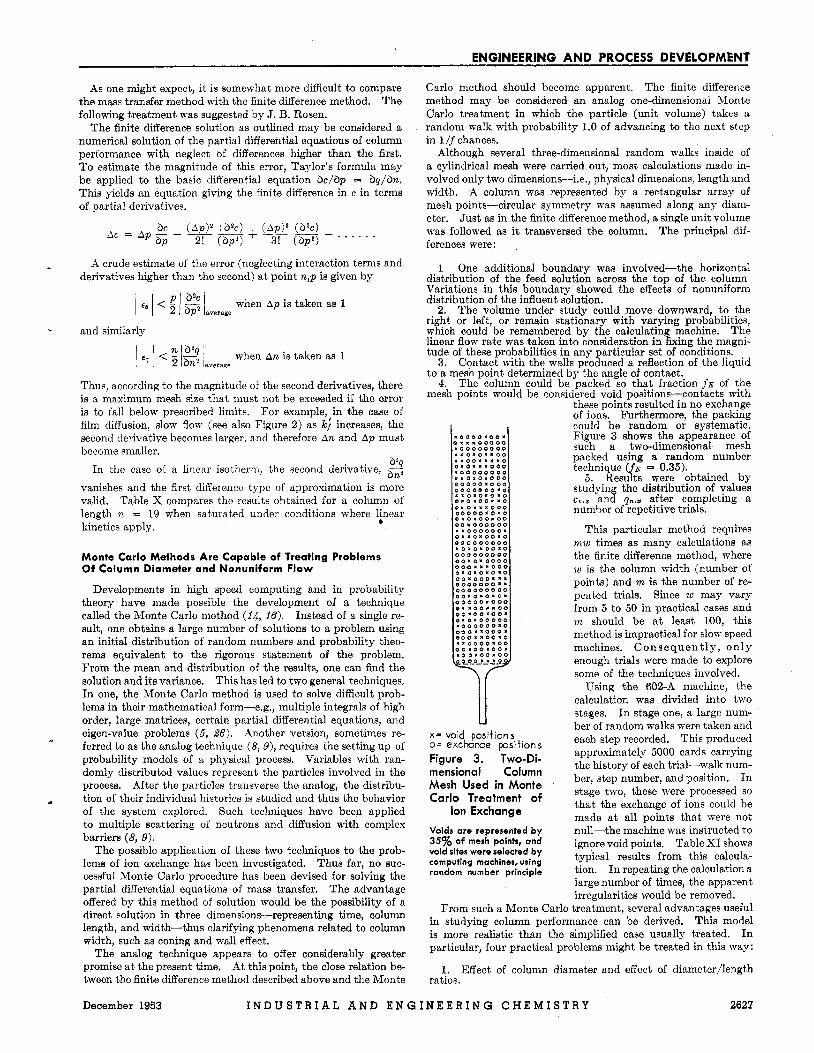
The column could be packed so that fraction f E of the mesh points would be considered void Dositions-contacts with
1
2.
3.
4.
r O O O O l O O f 0 . I. 0 0 0 0 0 . 0 0 0 0 0 0 0 0 1 1 . I O . O . . O O . . 0 0 1 I I . O 0 . 0 " I s 0 0 0 " 0 0 0 0 0 0 0 0 I I O x 0 . 0 0 0 0 0 0 0 0 . 0 0 0 0 0 0 0 0 0 0 . 0 . . 0 " 0 . 0 . 0 0 . 0 . 0 0 . . 0 0 . 0 . . x 0 0 0 0 0 0 0 0 . 0 . 0 0 " 0 " 0 0 . 0 0 0 0 . 0 0 0 0 0 0 . " 0 0 0 0 0 0 . e " * 0 . 0 0 . 0 0 0 0 0 0 0 0 0 0 . O X O . 0 0 . 0 e 0 0 0 0 0 0 0 0 0 0 . 0 . 0 0 0 0 0 0 0 . X " 0 0 0 O " O . 0 . 0 . 0 0 0 " 0 0 0 8 X * 0 0 0 0 0 0 0 0 0 0 0 0 0 0 0 0 0 0 . 0 " O ' O . 0 0 0 0 0 . 0 0 0 O."OO""OO 0 0 . 0 0 " 0 0 . 0 . 0 . 0 0 0 0 0 . 0 0 0 0 0 0 " 0 O e O " X O O 0 " 8 0 0 " 0 0 . 0 . . o o o o . 0 0 0 0 S 0 0 ~ 0 0 . .O OLOO.OO
U X = void positions o= exchanqe positions Figure 3. Two-Di- mensional Column Mesh Used in Monte Carlo Treatment of
ion Exchange
Voids are represented by 35% of mesh points, and void sites were selected by computing machines, urlng random number principle
these pointk resulted in no exchange of ions. Furthermore, the packing could be random or systematic. Figure 3 shows the appearance of such a two-dimensional mesh packed using a random number technique (.f~ = 0.35).
5. Results were obtained by studying the distribution of value8 cn,= and p,,, after completing a number of repetitive trials.
This particular method requires mw times as many calculations as the finite difference method, where w is the column width (number of points) and m is the number of re- peated trials. Since w may vary from 5 to 50 in practical cases and m should be a t least 100, this method is impractical for slow speed machines, C o n s e q u e n t l y , o n l y enough trials were made to explore some of the techniques involved.
Using the 602-A machine, the calculation was divided into two stages, In stage one, a large num- ber of random walks were taken and each step recorded. This produced approximately 5000 cards carrying the history of each trial-walk num- ber, step number, and position. In stage two, these were processed so that the exchange of ions could be made a t all points that were not null-the machine was instructed to ignore void points. Table XI shows typical results from this calcula- tion. In repeating the calculation a large number of times, the apparent irregularities would be removed.
From such a Monte Carlo treatment, several advantages useful in studying column performance can be derived. This model is more realistic than the simplified case usually treated. In particular, four practical problems might be treated in this way:
1. Effect of column diameter and effect of diameter/length ratios.
December 1953 I N D U S T R I A L A N D E N G I N E E R I N G C H E M I S T R Y 2627

ENGINEERING AND PROCESS DEVELOPMENT
Table X. Comparison of Results of Kinetic Treatment with Finite Difference Method
(Saturation of initially empty column, C = 1, p = 19) Cn,p C n , p
n (Mass Transfer) (Finite Difference) 1 2 3 4 5 6 7 8 9
10 11 12 13 14 15 16 17 18 19 20
0.0000001 0.00002 0.0001 0.0004 0.0015 0,0038 0.0081 n man 0,0284 0,0466 0.0719 0.1047 0.1453 0.1934 0.2477 0,3073 0.3704 0,4352 0,5001 0,8634
0.0000 0.0000 0.0001 0.0004 0,0012 0.0033 0.0073 0,0144 0,0261 0,0438 0.0680 0,1002 0.1405 0,1885 0.2434 0.3037 0.3679 0,4339 0.4999 0.6642
Table XI. Three Examples of Random Walks Down Two- Dimensional Mesh
[(Zc)n,p represents total quantity of A on any one horizontal section of column]
P ( 2 c ) w (.=)4,P ( Z C ) 5 , P
1 2 3 4 5 6 7 8 9
10 11 12 13 14 15 16 17 18 19 20 21 22 23 24 25 26 27 28 29 30 31 32 33 34 35 36 37 38 39
0.04879 0.04111 0.07534 0.02782 0.05684 0.01249 0.00911 0.00935 0.01536 0.01659 0.00482 0.00785 0.01268 0.00693 0.00416 0.00694 0.00999 0.00116 0,00126 OI0O122 0.00210 0,00081 0.00056 0.00188 0,00178 0,00135 0.00109 0.00100 0.00154 0,00066 0.00009 0.00041 0,00009 0,00034 0,00071 0,00020 0.00019 0.00016 0.00011
0,06927 0,08088 0.10232 0.03576 0.03475 0.04652 0.01674 0.00975 0.01743 0.01064 0.00839 0.01265 0.00768 0.00898 0.00786 0,00777 0.00697 0.00176 0.00146 0.00147 0,00148 0.00255 0.00066 0.00382 0,00155 0.00401 0.00268 0.00268 0.00198 0.00174 0.00248 0.00045 0.00067 0.00083 0.00083 0,00068 0,00059 0,00064 0,00054
2. Effect of channeling-see Figure 3 for channelin in a The interaction of channeys and
3. Effect of coning-different concentration gradients across
4. Effect of the hydrodynamic spreading of a front in passing
randomly packed column. walls should be considered.
a horizontal section (23).
through thr column in the absence of exchange.
Applications Include Facilitating Separation Unit Designs and Clarifying Some Basic Relations
At the present time, engineering design methods for ion exchange separation columns lag far behind the corresponding methods for distillation column separations. The use of auto- matic computing machines can assist in bridging the gap in several ways. Where the simplifying assumptions of the kinetic treatment can be made, tables of solutions for equations with the most used boundary conditions can be prepared, covering a wide range of K values and flow rates. For more unusual cases, the
finite difference method can be uPed to prepare such useful tables. If desired, the tables may be converted to graphs by the automatic plotting machines now available.
I n work of a more theoretical nature, it is usual to explain elu- tion curves on the basis of some assumed mechanism. Using ma- chine methods, each assumption of the postulated mechanism may be examined and its effect on the elution curve examined. The finite difference method ma, be used, or the Monte Carlo method where it is warranted. It is believed that a thorough investigation of ion exchange, using the latter method, may go far to clarify a number of unsolved problems.
Acknowledgment
The writer acknowledges the valuable assistance of David J. Pye in guiding this program and in preparation of this manuscript. Many members of the Research Department and Tabulating Department of The Dow Chemical Co. have provided much as- sistance and advice. The contribution of Theodore Vermeulen and Nevin K. Hiester in the form of helpful discussion and the loan of a manuscript in advance of puhlication is sincerely appre- ciated.
Nomenclature and Units
c = concentration in the solution, meq. per ml co = concentration in the solution entering the column, meq.
e* = concentration of solution in equilibrium with resin of coil-
C = the distribution coefficient = for a lineal, isotheim,
f~ = fraction of column not occupied by adsorbent f = h e a r flow rate = A p / A n , cm. per minute 10 = Bessel function of first kind. zero order of imaginary argu-
J = a function defined in Equation 6, dimensionless K = equilibrium constant for A + BR 4 B + AI?, di-
per ml.
centration q*, meq. per ml. C *
P dimensionless
ment, dimensionless
dimensionless k: = constant proportional to external diffusion coefficient.
min.-’ 2 m n = traversal number, dimensionless An = increment of time between additions of fluid, minutes p = plate number, dimensionless A p = increment of distance between plates, cm. p = concentration on the adsorbent, meq. per gram q* = concentration on the adsorbent in equilibrium with solu-
tion of concentration c*. meq. per gram q m = concentration on adsorbent a t ultimate capacity, meq. per
gram T = equilibrium parameter of Vormeuien and Hiester, dimen-
sionless s = column capacity parameter of Vermeulen arid Hiester,
= volume of solution at a point. ml. = mass of resin a t a point, grams
dimensionless t = solution capacity parameter of Vermeulen and Hiester,
dimensionless T = memory parameter of Vermeulen and Hiester, dimension-
less 7 = time, minutes A, B, x, y, u, X , Y , 2, E , F , G. and H are arbitrary symbols.
literature Cited
(1) Boyd, G. E., Adamson, A. W., and Myers, L. S., J r , , J . Am. Chem. SOC., 69, 2836 (1947).
(2) Boyd, G. E., AIyers, L. S., Jr., and Adamson, A. K., Ibid., 69, 2849 (1947).
(3) Brinkley, S. R., Jr., Edw-ards, H. E., and Smith, R. W., Jr., “Mathematical Tables and Other -4ids to Computation,” Vol. VI, p. 40, 1952.
(4) Cassidy, H. G., “Adsorption and Chromatography,” S o w York, Intersoienoe Publishers, 1951.
( 5 ) Forsythe, G. E., and Liebler, R. d., .Wathematical Tables and Other A i d s to Computation, 4, 127 (1950).
( 6 ) Hiester, N. I<., and Vermeulen, T., C’hen. Eng. Progr., 45, 505 (1952).
Vol. 45, No. 12 2628 I N D U S T R I A L A N D E N G I N E E R I N G C H E M I S T R Y

ENGINEERING AND PROCESS DEVELOPMENT
(7) Hiester, N. K., and Vermeulen, T., J . Chem. Phys., 16, 1087
( 8 ) Kahn, H., Nucleonics, 6, So . 5, 27; No. 6, 60 (1950). (9) King, G . W., IND. ENG. CHEM., 43, 2475 (1951).
(1 948).
(lo) Kunin, R., and Myers, R. J., “Ion Exchange Resins,” New York,
(11) Lapidus, N., and Amundson, N. R., J . Phys. Chem., 56, 373
(12) Lombardo, R. J., Ph.D. thesis, Pennsylvania State College,
(13) Mayer, S. W., and Tompkins, E. R., J . Am. Chem. SOC., 69,2866
(14) IMetropolis, N., and TSlam, S., J . Amer. Stat. Assoc., 44, 335
(15) Kaohod, F. C., “Ion Exchange,” New York, Academic Press,
(16) Natl. Bur. Standards, Appl ied Mathematics Series 12.
John Wiley & Sons, 1950.
(1952).
1951.
(1947).
(1949).
1949.
I
(17) Rose, A., Lombardo, R. J., and Williams, T. J., IND. ENG.
(18) Rosen, J. B., and Winsche, W. E., J . Chem. Phys., 18, 1578
(19) Salner, H. E., Natl. Bur. Standards, Applied Mathematics Series
(20) Selke, W. A., and Bliss, H., Chem. Eng. Progr., 46, 509 (1950). (21) Thomas, H. C., Ann. AT. Y . Acad. Sci., 49, 161 (1948). (22) Thomas, H. C., J. Am. Chem. Soc., 66, 1664 (1944). 123) Trueblood, K. N., and Malmberg, E. W., J . Am. Chem. SOC., 72,
(24) Vermeulen, T., and Hiester, N. K., IND. ENG. CHEM., 44, 636
(25) Walter, J. E., J . Chem. Phys., 13, 229 (1945). (26) Wasow, W., J . Research Natl. Bur. Standards, 46, 65 (1951).
RECEIVED for review November 28, 1952.
CHEM., 43, 2454 (1951).
(1950).
16.
4027 (1950).
(1 952).
ACCEPTED July 17, 1953.
Evaluation of Packed Distillation Columns T. J, WALSH’, G. H. SUGIMURA2, AND T. W. REYNOLDS lewis Flighf Propulsion loborofory, Nofional Advisory Cornmiffee for Aeronautics, Cleveland, Ohio
HE National Advisory Committee for Aeronautics, Lewis T Flight Propulsion Laboratory, has been engaged in the prep- aration of pure hydrocarbons for several years in order to obtain correlations of molecular structure with engine performance and with other physical and chemical properties of the compounds. In the purification process to obtain these hydrocarbons, distil- lation is extremely important. Distillation to obtain maximum purity of a compound often requires the greater part of the total
1 Present address, Case Institute of Technology, Cleveland, Ohio. * Present address, Loa Angeles, Calif.
VENT
WATER ROTAMETER
0 CONDENSER
ERMOCOUPLE COOLING WATE
PRODUCT RECEIVER
LE TRANSFORMER
220 VOLT A.C.
THERMOCOUPLES EN
PACKING SUPPORT CON
FILLER HOLE
THERMOCOUPLE
Figure 1. Stainless Steel Distillation Column
time required for the complete synthesis of the compound. Puri- fication of commercial starting materials also requires consider- able time. Consequently, it is important to know the operating characteristics of the distillation equipment, not only a t atmos- pheric pressure but also a t reduced pressures, in order to obtain the most efficient performance for any required separation.
In order to determine separating ability, pressure drop, and throughput relations of the various distillation columns and the characteristics of the packings used a t this laboratory, this inves- tigation was conducted under the various operating conditions commonly used.
Operations of Glass and Steel Packed Columns are Observed at Atmospheric and Reduced Pressures
Stainless Steel Columns. A typical diagram of the stainless steel stills is shown in Figure 1. All of the columns are basically the same but differ in the type of packing used and in the diam- eter of the column. The stills are housed in an air-conditioned constant temperature room. The still pots have capacities of 10 or 20 gallons. Each still has an over-all height of 37 feet with a packed height of 30 feet. Heat is supplied to the still pots by three resistance elements wound concentrically beneath the pot and connected so as to give continuous control of from 0 to 5 kw. input. The column of each still is enclosed in a thin metal jacket which is wound with three sections of asbestos- and glass-covered resistance wire. Each section is controlled by a separate vari- able transformer and has a capacity of 2 kw. Thermocouples are located on the metal jacket a t the center of each section of winding. Packing in each column is supported a t the pot flange by a sieve cone with a perforated area equal to the cross-sectional area of the column.
Throughput is calculated from the heat pickup of the condenser water. For this purpose, the water rate is metered with a rotam- eter and the temperature of the water into and out of the con- denser is measured. From these data and the latent heat of the test mixture the throughput may be calculated.
Pressure drop is determined by measuring the pressure in the still pot vapor space, the top of the column being open to the a b mosphere. The manometer lines are flushed with nitrogen to prevent condensation in the line.
Glass Columns. A typical glass column used in the Lewis Flight Propulsion Laboratory is shown in Figure 2. The height
December 1953 I N D U S T R I A L A N D E N G I N E E R I N G C H E M I S T R Y 2629