Embed Size (px)
Citation preview
Application of beam elements to spot-welded thin-wall structure dynamics
H. Andou1, T. Katayama2, T. Koizumi2, N. Tsujiuchi2 & S. Enoki3 1Test & Validation Department, Shin Caterpillar Mitsubishi Ltd 2Department of Mechanical Engineering, Doshisha University, Japan 3Robust Engineering Inc., Japan
Abstract
This paper introduces a new approach to analyse the dynamics of spot-welded thin-wall structures with the aid of beam elements. The study is focused on a cabin structure for hydraulic excavators. The cabin main frame consists of complex shape section profiles manufactured by spot welding of sheet metal parts. In order to be able to predict the overall stiffness and vibration behavior of the cabin structure from the early concept design stage, a simplified beam model is proposed. At first, tests and analyses of twisting and impact conditions are performed on the spot-welded profiles to determine their stiffness and damping ratio with high accuracy. Then, the torsional stiffness and damping ratio derived by the proposed analytical procedure based on the experimental data are applied into the beam elements of the simplified cabin model. In order to validate the simplified cabin model, static load and impact tests are done on the actual cabin structure. The agreement between the calculated results and the experimental data confirms that the simplified beam model of the cabin and the proposed procedure can be used from the early design stage to calculate the overall deformation of spot-welded thin wall structures.
1 Introduction
The main frame of a hydraulic excavator cabin is designed using various profiles with complex shape section, manufactured by spot-welding of sheet metal parts. When the layout of the cabin on the chassis is established, the overall deformation of the cabin must be known in order to decide the clearances between the cabin and the surrounding components. However, the analysis
© 2005 WIT Press WIT Transactions on Modelling and Simulation, Vol 41, www.witpress.com, ISSN 1743-355X (on-line)
Computational Methods and Experimental Measurements XII 327
model must be generated from early design data when the detailed panel structures have not yet been designed and typically only the shapes of the profiles cross-sections (Figs.1 and 2) are decided. Therefore, in the concept design stage the deformation of the cabin has to be estimated based on a simplified beam model instead of a detailed shell model. In order to accurately predict deformation using the simplified beam model, one must determine the torsional stiffness and damping ratio of the thin-wall profiles. Thus, first twisting and impact test and analyses of the spot-welded thin-wall profiles are performed. Then, the torsional stiffness and damping ratio of each profile are derived by a proposed procedure based on the experimental data. Finally, by comparing the predicted and actual results, it is verified that the proposed procedure for identification of torsional stiffness and damping ratio of spot-welded thin-wall structures can be successfully used to estimate the cabin overall deformation from the early design stage.
2 Approach to establish the simplified cabin model
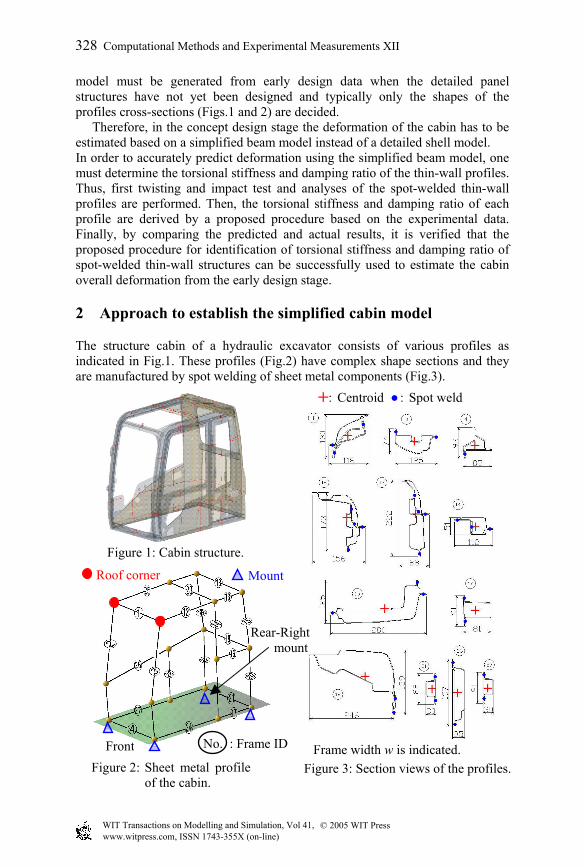
The structure cabin of a hydraulic excavator consists of various profiles as indicated in Fig.1. These profiles (Fig.2) have complex shape sections and they are manufactured by spot welding of sheet metal components (Fig.3).
Figure 1: Cabin structure.
+: Centroid ●: Spot weld
Figure 3: Section views of the profiles. Frame width w is indicated.
Figure 2: Sheet metal profileof the cabin.
No. : Frame ID
Roof corner Mount
Front
Rear-Right mount
© 2005 WIT Press WIT Transactions on Modelling and Simulation, Vol 41, www.witpress.com, ISSN 1743-355X (on-line)
328 Computational Methods and Experimental Measurements XII
In this paper, the torsional stiffness and damping ratio of those thin-wall profiles are formulated by the presented procedure and applied into the simplified cabin model. The simplified model is validated comparing the static and dynamic displacement with the experimental results.
3 Torsional stiffness of spot-welded profiles
Theoretical expressions [1] of the torsional stiffness for thin-walled spatial structures are presented as follows: Open section profile ∑=
iiiopen tsGGJ 3
31 (1)
Close section profile stGAGJ close
24= (2)
where G : modulus of transverse elasticity, J : polar moment of inertia of area, A : area enclosed between the midlines of the plates thickness for the closed section part, excepting the flange portion, t : plate thickness, s : length of the midlines of the plate thickness. With the above expressions, the spot-welded profiles torsional stiffness may be estimated roughly. The experiments and analyses are performed to evaluate the torsional stiffness of the spot-welded profiles more accurately.
3.1 Measurement of the torsional stiffness for spot-welded profiles
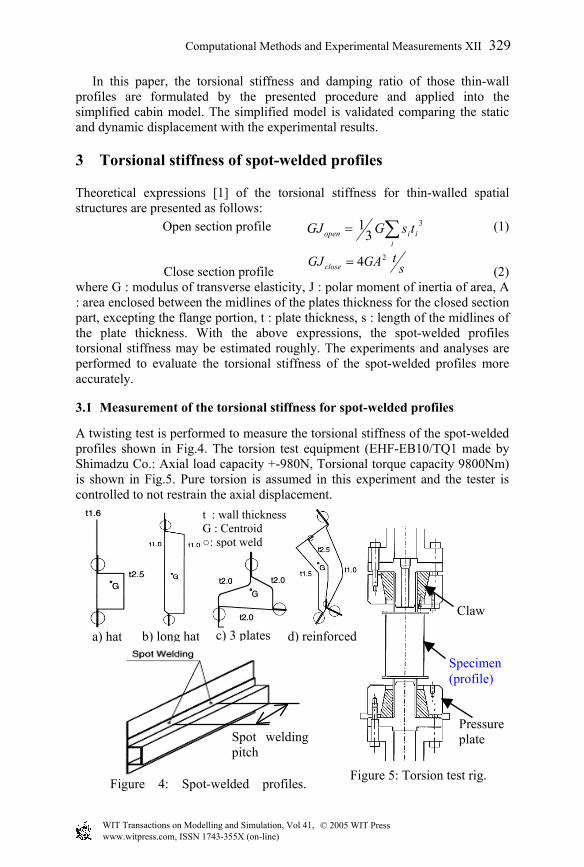
A twisting test is performed to measure the torsional stiffness of the spot-welded profiles shown in Fig.4. The torsion test equipment (EHF-EB10/TQ1 made by Shimadzu Co.: Axial load capacity +-980N, Torsional torque capacity 9800Nm) is shown in Fig.5. Pure torsion is assumed in this experiment and the tester is controlled to not restrain the axial displacement.
Claw
Specimen (profile)
Pressure plate
Figure 5: Torsion test rig.
Spot welding pitch
Figure 4: Spot-welded profiles.
a) hat b) long hat c) 3 plates d) reinforced
t : wall thickness G : Centroid ○: spot weld
© 2005 WIT Press WIT Transactions on Modelling and Simulation, Vol 41, www.witpress.com, ISSN 1743-355X (on-line)
Computational Methods and Experimental Measurements XII 329
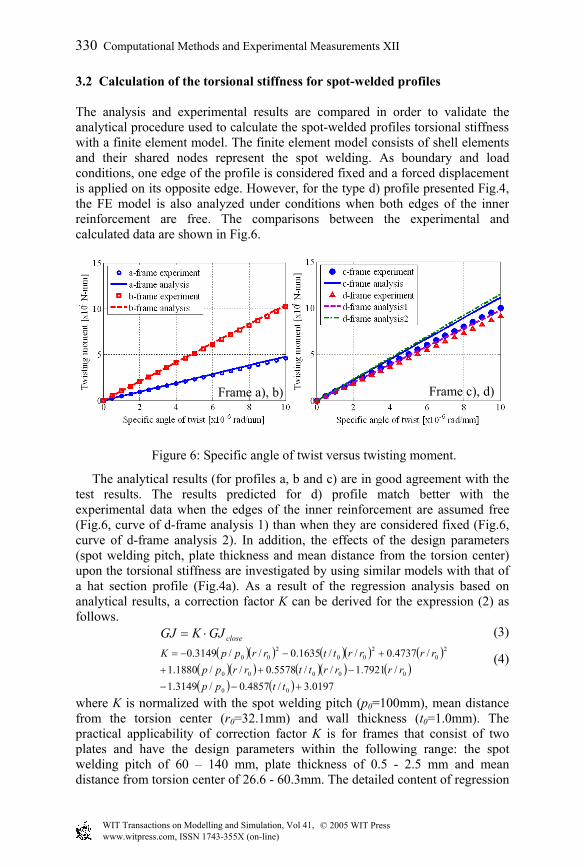
3.2 Calculation of the torsional stiffness for spot-welded profiles The analysis and experimental results are compared in order to validate the analytical procedure used to calculate the spot-welded profiles torsional stiffness with a finite element model. The finite element model consists of shell elements and their shared nodes represent the spot welding. As boundary and load conditions, one edge of the profile is considered fixed and a forced displacement is applied on its opposite edge. However, for the type d) profile presented Fig.4, the FE model is also analyzed under conditions when both edges of the inner reinforcement are free. The comparisons between the experimental and calculated data are shown in Fig.6. The previous section has considered.... The analytical results (for profiles a, b and c) are in good agreement with the test results. The results predicted for d) profile match better with the experimental data when the edges of the inner reinforcement are assumed free (Fig.6, curve of d-frame analysis 1) than when they are considered fixed (Fig.6, curve of d-frame analysis 2). In addition, the effects of the design parameters (spot welding pitch, plate thickness and mean distance from the torsion center) upon the torsional stiffness are investigated by using similar models with that of a hat section profile (Fig.4a). As a result of the regression analysis based on analytical results, a correction factor K can be derived for the expression (2) as follows.
closeGJKGJ ⋅= (3)
( )( ) ( )( ) ( )( )( ) ( )( ) ( )( ) ( ) 0197.3/4857.0/3149.1
/7921.1//5578.0//1880.1/4737.0//1635.0//3149.0
00
00000
20
200
200
+−−−++
+−−=
ttpprrrrttrrpp
rrrrttrrppK (4)
where K is normalized with the spot welding pitch (p0=100mm), mean distance from the torsion center (r0=32.1mm) and wall thickness (t0=1.0mm). The practical applicability of correction factor K is for frames that consist of two plates and have the design parameters within the following range: the spot welding pitch of 60 – 140 mm, plate thickness of 0.5 - 2.5 mm and mean distance from torsion center of 26.6 - 60.3mm. The detailed content of regression
Figure 6: Specific angle of twist versus twisting moment.
Frame a), b) Frame c), d)
© 2005 WIT Press WIT Transactions on Modelling and Simulation, Vol 41, www.witpress.com, ISSN 1743-355X (on-line)
330 Computational Methods and Experimental Measurements XII
analysis is omitted in this paper because of the large amount of data [2][3]. The torsional stiffness of the profiles is calculated employing the above expressions (3), (4) into FE analysis.
4 Stiffness validation of the simplified cabin model
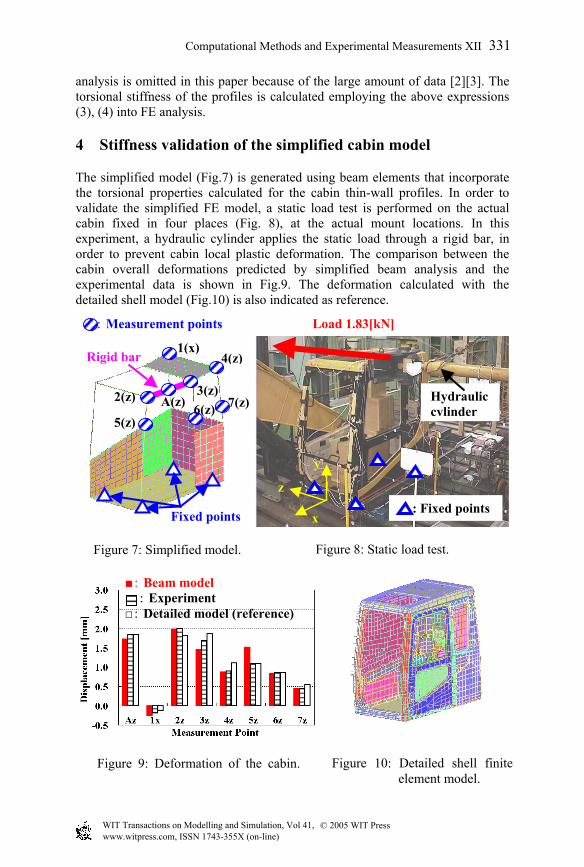
The simplified model (Fig.7) is generated using beam elements that incorporate the torsional properties calculated for the cabin thin-wall profiles. In order to validate the simplified FE model, a static load test is performed on the actual cabin fixed in four places (Fig. 8), at the actual mount locations. In this experiment, a hydraulic cylinder applies the static load through a rigid bar, in order to prevent cabin local plastic deformation. The comparison between the cabin overall deformations predicted by simplified beam analysis and the experimental data is shown in Fig.9. The deformation calculated with the detailed shell model (Fig.10) is also indicated as reference.
Figure 9: Deformation of the cabin.
:■ Beam model : Experiment :□ Detailed model (reference)
Figure 10: Detailed shell finiteelement model.
� �
� : Fixed points x
y
z
Figure 8: Static load test.
Hydraulic cylinder
Load 1.83[kN]
Fixed points
: Measurement points
A(z) 2(z) 3(z)
4(z)1(x)
7(z)6(z) 5(z)
Figure 7: Simplified model.
Rigid bar
© 2005 WIT Press WIT Transactions on Modelling and Simulation, Vol 41, www.witpress.com, ISSN 1743-355X (on-line)
Computational Methods and Experimental Measurements XII 331
The cabin overall deformation estimated with the simplified beam model is in quite good agreement with the experiment (Fig.9). However, the displacement at the measurement point 5(z) (Fig. 7) differs from the experimental data and results of the detailed analysis since the reinforcement for the door latch, which is installed on this pillar, is not considered in the simplified model. The agreement between the predicted deformation by the simplified beam analysis and the experimental data confirms that the estimated torsional stiffness of the spot-welded profiles is correct. Thus, the proposed method for identification of thin-wall profile torsional stiffness is validated and the cabin overall static deformation can be estimated by using the simplified beam model.
5 Damping ratio of the spot-welded profiles
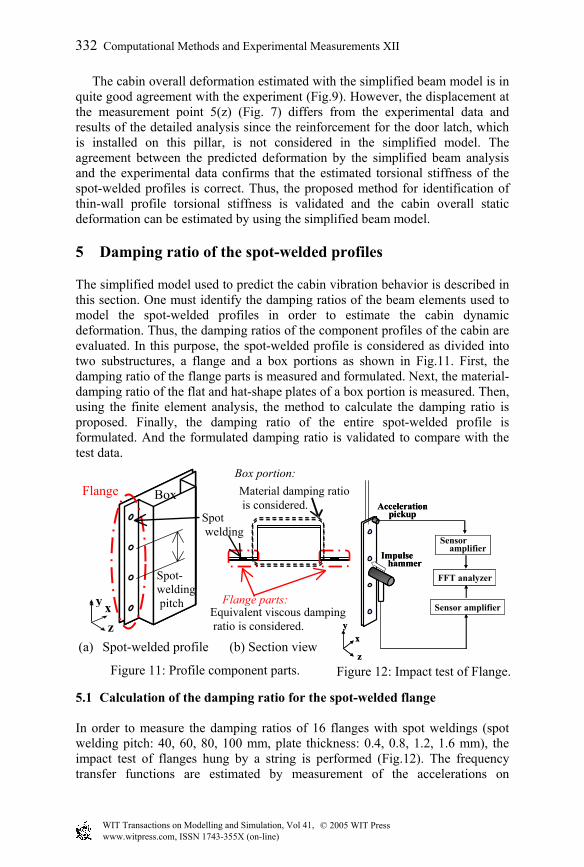
The simplified model used to predict the cabin vibration behavior is described in this section. One must identify the damping ratios of the beam elements used to model the spot-welded profiles in order to estimate the cabin dynamic deformation. Thus, the damping ratios of the component profiles of the cabin are evaluated. In this purpose, the spot-welded profile is considered as divided into two substructures, a flange and a box portions as shown in Fig.11. First, the damping ratio of the flange parts is measured and formulated. Next, the material- damping ratio of the flat and hat-shape plates of a box portion is measured. Then, using the finite element analysis, the method to calculate the damping ratio is proposed. Finally, the damping ratio of the entire spot-welded profile is formulated. And the formulated damping ratio is validated to compare with the test data. 5.1 Calculation of the damping ratio for the spot-welded flange In order to measure the damping ratios of 16 flanges with spot weldings (spot welding pitch: 40, 60, 80, 100 mm, plate thickness: 0.4, 0.8, 1.2, 1.6 mm), the impact test of flanges hung by a string is performed (Fig.12). The frequency transfer functions are estimated by measurement of the accelerations on
x
Figure 11: Profile component parts.
(a) Spot-welded profile
Sensor amplifier
Sensoramplifier
FFT analyzer
xy
z
Accelerationpickup
Impulsehammer
Sensor amplifier
Sensoramplifier
FFT analyzer
xy
z
Accelerationpickup
Impulsehammer
Figure 12: Impact test of Flange.
y
z
Flange Material damping ratio is considered.
Flange parts:
Box portion:
Box
Equivalent viscous damping ratio is considered.
Spot welding
Spot-welding pitch
(b) Section view
© 2005 WIT Press WIT Transactions on Modelling and Simulation, Vol 41, www.witpress.com, ISSN 1743-355X (on-line)
332 Computational Methods and Experimental Measurements XII
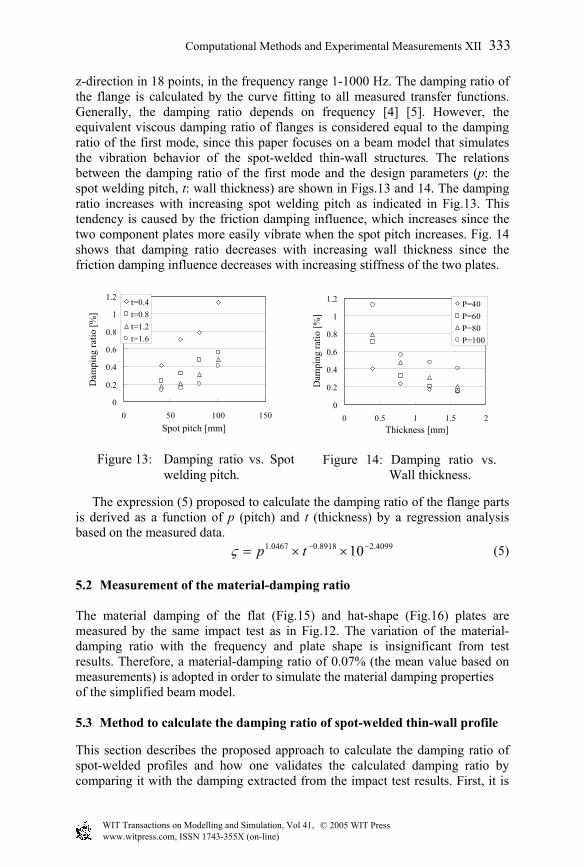
z-direction in 18 points, in the frequency range 1-1000 Hz. The damping ratio of the flange is calculated by the curve fitting to all measured transfer functions. Generally, the damping ratio depends on frequency [4] [5]. However, the equivalent viscous damping ratio of flanges is considered equal to the damping ratio of the first mode, since this paper focuses on a beam model that simulates the vibration behavior of the spot-welded thin-wall structures. The relations between the damping ratio of the first mode and the design parameters (p: the spot welding pitch, t: wall thickness) are shown in Figs.13 and 14. The damping ratio increases with increasing spot welding pitch as indicated in Fig.13. This tendency is caused by the friction damping influence, which increases since the two component plates more easily vibrate when the spot pitch increases. Fig. 14 shows that damping ratio decreases with increasing wall thickness since the friction damping influence decreases with increasing stiffness of the two plates.
The expression (5) proposed to calculate the damping ratio of the flange parts is derived as a function of p (pitch) and t (thickness) by a regression analysis based on the measured data.
4099.28918.00467.1 10−− ××= tpς (5) 5.2 Measurement of the material-damping ratio The material damping of the flat (Fig.15) and hat-shape (Fig.16) plates are measured by the same impact test as in Fig.12. The variation of the material-damping ratio with the frequency and plate shape is insignificant from test results. Therefore, a material-damping ratio of 0.07% (the mean value based on measurements) is adopted in order to simulate the material damping properties of the simplified beam model. 5.3 Method to calculate the damping ratio of spot-welded thin-wall profile This section describes the proposed approach to calculate the damping ratio of spot-welded profiles and how one validates the calculated damping ratio by comparing it with the damping extracted from the impact test results. First, it is
Spot pitch [mm]
Dam
ping
ratio
[%]
0
0.2
0.4
0.6
0.8
1
1.2
0 50 100 150
t=0.4t=0.8t=1.2t=1.6
Thickness [mm]
Dam
ping
ratio
[%]
0
0.2
0.4
0.6
0.8
1
1.2
0 0.5 1 1.5 2
P=40P=60P=80P=100
Figure 13: Damping ratio vs. Spotwelding pitch.
Figure 14: Damping ratio vs.Wall thickness.
© 2005 WIT Press WIT Transactions on Modelling and Simulation, Vol 41, www.witpress.com, ISSN 1743-355X (on-line)
Computational Methods and Experimental Measurements XII 333
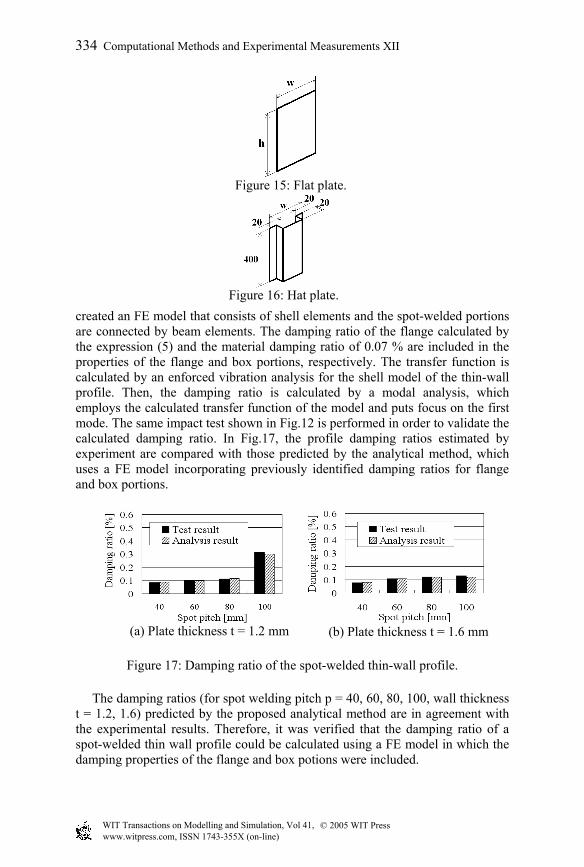
created an FE model that consists of shell elements and the spot-welded portions are connected by beam elements. The damping ratio of the flange calculated by the expression (5) and the material damping ratio of 0.07 % are included in the properties of the flange and box portions, respectively. The transfer function is calculated by an enforced vibration analysis for the shell model of the thin-wall profile. Then, the damping ratio is calculated by a modal analysis, which employs the calculated transfer function of the model and puts focus on the first mode. The same impact test shown in Fig.12 is performed in order to validate the calculated damping ratio. In Fig.17, the profile damping ratios estimated by experiment are compared with those predicted by the analytical method, which uses a FE model incorporating previously identified damping ratios for flange and box portions. The damping ratios (for spot welding pitch p = 40, 60, 80, 100, wall thickness t = 1.2, 1.6) predicted by the proposed analytical method are in agreement with the experimental results. Therefore, it was verified that the damping ratio of a spot-welded thin wall profile could be calculated using a FE model in which the damping properties of the flange and box potions were included.
Figure 15: Flat plate.
Figure 16: Hat plate.
Figure 17: Damping ratio of the spot-welded thin-wall profile.
(a) Plate thickness t = 1.2 mm (b) Plate thickness t = 1.6 mm
© 2005 WIT Press WIT Transactions on Modelling and Simulation, Vol 41, www.witpress.com, ISSN 1743-355X (on-line)
334 Computational Methods and Experimental Measurements XII
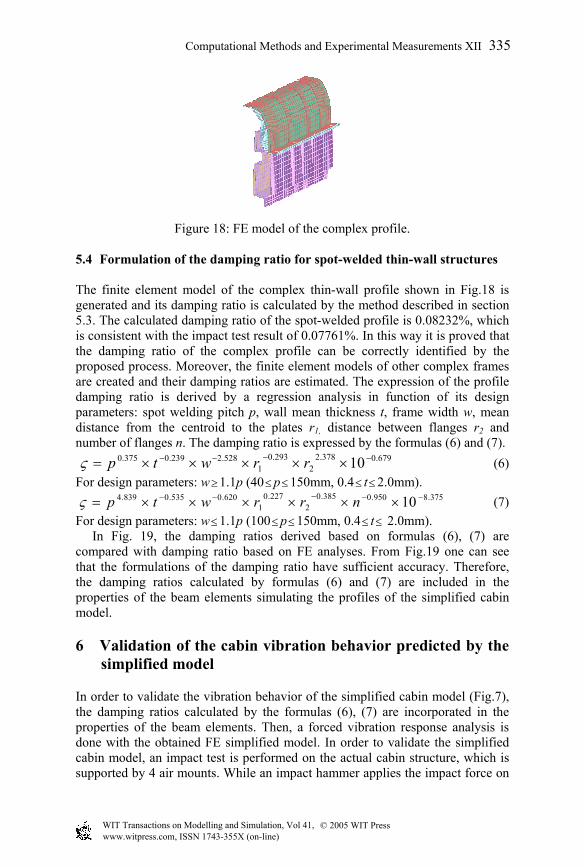
Figure 18: FE model of the complex profile.
5.4 Formulation of the damping ratio for spot-welded thin-wall structures The finite element model of the complex thin-wall profile shown in Fig.18 is generated and its damping ratio is calculated by the method described in section 5.3. The calculated damping ratio of the spot-welded profile is 0.08232%, which is consistent with the impact test result of 0.07761%. In this way it is proved that the damping ratio of the complex profile can be correctly identified by the proposed process. Moreover, the finite element models of other complex frames are created and their damping ratios are estimated. The expression of the profile damping ratio is derived by a regression analysis in function of its design parameters: spot welding pitch p, wall mean thickness t, frame width w, mean distance from the centroid to the plates r1, distance between flanges r2 and number of flanges n. The damping ratio is expressed by the formulas (6) and (7).
679.0378.22
293.01
528.2239.0375.0 10 −−−− ×××××= rrwtpς (6) For design parameters: w≥1.1p (40≤p≤150mm, 0.4≤ t≤2.0mm).
375.8950.0385.02
227.01
620.0535.0839.4 10 −−−−− ××××××= nrrwtpς (7) For design parameters: w≤1.1p (100≤p≤150mm, 0.4≤ t≤ 2.0mm). In Fig. 19, the damping ratios derived based on formulas (6), (7) are compared with damping ratio based on FE analyses. From Fig.19 one can see that the formulations of the damping ratio have sufficient accuracy. Therefore, the damping ratios calculated by formulas (6) and (7) are included in the properties of the beam elements simulating the profiles of the simplified cabin model.
6 Validation of the cabin vibration behavior predicted by the simplified model
In order to validate the vibration behavior of the simplified cabin model (Fig.7), the damping ratios calculated by the formulas (6), (7) are incorporated in the properties of the beam elements. Then, a forced vibration response analysis is done with the obtained FE simplified model. In order to validate the simplified cabin model, an impact test is performed on the actual cabin structure, which is supported by 4 air mounts. While an impact hammer applies the impact force on
© 2005 WIT Press WIT Transactions on Modelling and Simulation, Vol 41, www.witpress.com, ISSN 1743-355X (on-line)
Computational Methods and Experimental Measurements XII 335
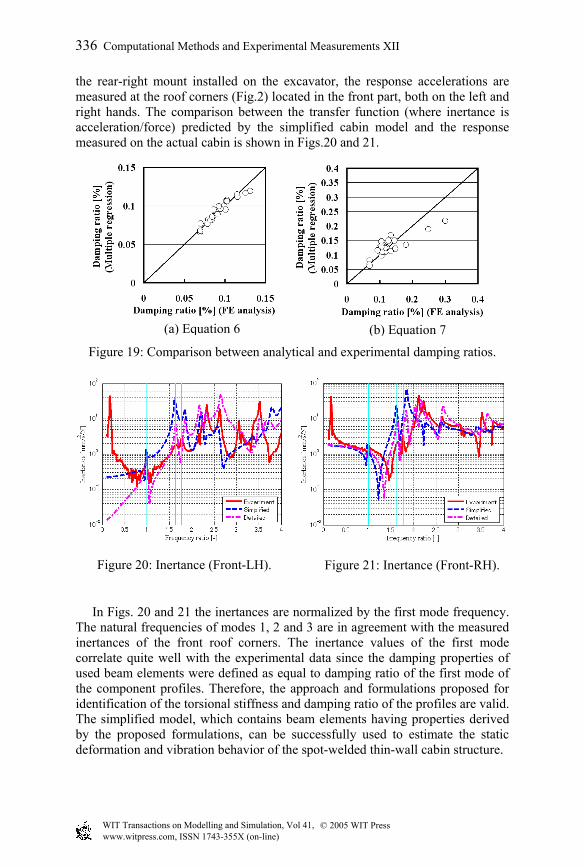
the rear-right mount installed on the excavator, the response accelerations are measured at the roof corners (Fig.2) located in the front part, both on the left and right hands. The comparison between the transfer function (where inertance is acceleration/force) predicted by the simplified cabin model and the response measured on the actual cabin is shown in Figs.20 and 21.
Figure 19: Comparison between analytical and experimental damping ratios. In Figs. 20 and 21 the inertances are normalized by the first mode frequency. The natural frequencies of modes 1, 2 and 3 are in agreement with the measured inertances of the front roof corners. The inertance values of the first mode correlate quite well with the experimental data since the damping properties of used beam elements were defined as equal to damping ratio of the first mode of the component profiles. Therefore, the approach and formulations proposed for identification of the torsional stiffness and damping ratio of the profiles are valid. The simplified model, which contains beam elements having properties derived by the proposed formulations, can be successfully used to estimate the static deformation and vibration behavior of the spot-welded thin-wall cabin structure.
(a) Equation 6 (b) Equation 7
Figure 20: Inertance (Front-LH). Figure 21: Inertance (Front-RH).
© 2005 WIT Press WIT Transactions on Modelling and Simulation, Vol 41, www.witpress.com, ISSN 1743-355X (on-line)
336 Computational Methods and Experimental Measurements XII
7 Conclusions
・ An analysis method is proposed to calculate the torsional stiffness of complex shape section profiles other than the hat-shape profile.
・ The torsional stiffness of the complex shape section profiles, calculated by the proposed method, is validated by comparing the deformation predicted by the simplified model with that measured on actual cabin structure under static load.
・ The damping ratio expression of a spot-welded flange is formulated by a regression analysis for the first natural frequency based on the impact test data.
・ The damping ratios of the complex profiles are estimated by the proposed approach using a finite element model that incorporates the identified equivalent viscous damping ratio and the material damping ratio.
・ The simplified cabin model is validated by comparing the transfer functions predicted by the simplified cabin model, which includes the formulated damping ratio of thin-wall profiles, with the impact test results measured on the actual cabin.
The approach proposed to calculate the torsional stiffness and damping ratio of the spot-welded profiles was validated and the simplified model, which incorporates these properties, can be successfully used to estimate the overall deformation and vibration behavior of spot-welded thin-wall structures from the concept design stage. References [1] Vlasov, V.Z., Thin-walled elastic beams, pp. 50-58, 1940. [2] Katayama, T., Kawaguchi, M. & Enoki, S., Evaluation Method for Torsoinal
Rigidity of Flame having Spot Weldings (1st Report, Simplified Torsional Rigidity Analysis with FEM). Transactions of Japan Society of Mechanical Engineers (C edition), pp. .3333-3338, Vol62-600, 1996.
[3] Katayama, T., Kawaguchi, M. & Enoki, S., Evaluation Method for Torsional Rigidity of Flame having Spot Weldings (2nd Report, Expression of Torsional Rigidity). Transactions of Japan Society Mechanical Engineers (C edition), pp. 3339-3346, Vol62-600, 1996.
[4] Pal, K. & Cronin, D.L., Static and Dynamic Characteristics of Spot Welded Sheet Metal Beams. Transactions of ASME, pp. 316-322, 117, 1995.
[5] Lesieutre, G.A. & Mingori, D.L., Finite Element Modeling of Frequency-Dependent Material Properties Using Augmented Thermodynamic Fields. AIAA Journal of Guidance Control and Dynamics, 13, pp. 1040-1050, 1990.
© 2005 WIT Press WIT Transactions on Modelling and Simulation, Vol 41, www.witpress.com, ISSN 1743-355X (on-line)
Computational Methods and Experimental Measurements XII 337