Embed Size (px)
Citation preview
SANDIA REPORT SAND2021-5627 Printed May 2021
Application of a Standard Approach to Benefit-Cost Analysis for Electric Grid Resilience Investments
Designing Resilient Communities: A Consequence-Based Approach for Grid Investment Report Series Synapse Energy Economics:
Jennifer Kallay Steve Letendre, PhD Tim Woolf Ben Havumaki Shelley Kwok Asa Hopkins, PhD
Sandia National Laboratories: Robert Broderick Robert Jeffers, PhD Katherine Jones
Bosque Advisors
Mercy DeMenno, PhD
Prepared by Sandia National Laboratories Albuquerque, New Mexico 87185 and Livermore, California 94550
2
Issued by Sandia National Laboratories, operated for the United States Department of Energy by National Technology & Engineering Solutions of Sandia, LLC. NOTICE: This report was prepared as an account of work sponsored by an agency of the United States Government. Neither the United States Government, nor any agency thereof, nor any of their employees, nor any of their contractors, subcontractors, or their employees, make any warranty, express or implied, or assume any legal liability or responsibility for the accuracy, completeness, or usefulness of any information, apparatus, product, or process disclosed, or represent that its use would not infringe privately owned rights. Reference herein to any specific commercial product, process, or service by trade name, trademark, manufacturer, or otherwise, does not necessarily constitute or imply its endorsement, recommendation, or favoring by the United States Government, any agency thereof, or any of their contractors or subcontractors. The views and opinions expressed herein do not necessarily state or reflect those of the United States Government, any agency thereof, or any of their contractors. Printed in the United States of America. This report has been reproduced directly from the best available copy. Available to DOE and DOE contractors from U.S. Department of Energy Office of Scientific and Technical Information P.O. Box 62 Oak Ridge, TN 37831 Telephone: (865) 576-8401 Facsimile: (865) 576-5728 E-Mail: [email protected] Online ordering: http://www.osti.gov/scitech Available to the public from U.S. Department of Commerce National Technical Information Service 5301 Shawnee Rd Alexandria, VA 22312 Telephone: (800) 553-6847 Facsimile: (703) 605-6900 E-Mail: [email protected] Online order: https://classic.ntis.gov/help/order-methods/

3
ABSTRACT In 2019, Sandia National Laboratories (Sandia) contracted Synapse Energy Economics (Synapse) to research the integration of community and electric grid resilience investment planning as part of the Designing Resilient Communities (DRC): A Consequence-Based Approach for Grid Investment project. Synapse produced a series of reports to explore the challenges and opportunities in several key areas, including benefit-cost analysis (BCA), performance metrics, microgrids, and regulatory mechanisms. This report focuses on BCA. BCA is an approach that electric utilities, electric utility regulators, and communities can use to evaluate the costs and benefits of a wide range of grid resilience investments in a comprehensive and consistent way. While BCA is regularly applied to some types of grid investments, application of BCA to grid resilience investments is in the early stages of development. Though resilience is increasingly cited in connection with grid investment proposals and plans, the resilience-related costs and benefits of grid resilience investments are typically not fully identified, infrequently quantified, and almost never monetized. Without complete assessments of costs and benefits, regulators can be hesitant to approve some types of grid resilience investments. This report provides the first application of the framework developed in the 2020 National Standard Practice Manual for Benefit-Cost Analysis of Distributed Energy Resources (NSPM for DERs)1 to grid resilience investments. We provide guidance on next steps for implementation to enable grid resilience investments to receive due consideration. We suggest developing BCA principles and standards for jurisdiction-specific BCA tests. We also recommend identifying the resilience impacts of the investments and quantification of these impacts by establishing utility performance metrics for resilience. Proactive integration of grid resilience investments into existing regulatory processes and practices can increase the capacity of jurisdictions to respond to and recover from the consequences of extreme events.
1 National Energy Screening Project. 2020. National Standard Practice Manual for Benefit-Cost Analysis of Distributed Energy Resources. Edition 1. Available at: https://www.nationalenergyscreeningproject.org/national-standard-practice-manual/.

4
CONTENTS 1. Introduction ............................................................................................................................................... 12
1.1. Purpose ............................................................................................................................................. 12 1.2. Report Organization ....................................................................................................................... 13
2. Electric Grid Resilience Investments ..................................................................................................... 14
3. BCA Framework ....................................................................................................................................... 18 3.1. Introduction to BCA ...................................................................................................................... 18 3.2. History of BCA in Utility Regulation ........................................................................................... 18 3.3. BCA Principles ................................................................................................................................ 20 3.4. Jurisdiction-Specific BCA Test ..................................................................................................... 22
4. The Costs and Benefits of Grid Resilience Investments..................................................................... 25 4.1. Overview of Perspectives .............................................................................................................. 25
Utility System ................................................................................................................................... 25 Host Customer ................................................................................................................................ 25 Community ...................................................................................................................................... 25 Society 26
4.2. Costs ................................................................................................................................................. 26 Utility System ................................................................................................................................... 27 Host Customer ................................................................................................................................ 28 Community ...................................................................................................................................... 28 Society 29
4.3. Benefits ............................................................................................................................................. 29 Utility System ................................................................................................................................... 31 Host Customer ................................................................................................................................ 32 Community ...................................................................................................................................... 32 Society 34
4.4. Illustrative Example ........................................................................................................................ 34
5. Other Considerations ............................................................................................................................... 37 5.1. Probability of Occurrence ............................................................................................................. 37 5.2. Temporal and Locational Variability ............................................................................................ 38 5.3. Interactive Effects ........................................................................................................................... 39
6. Metrics and Data Needs ........................................................................................................................... 40
7. Next Steps for Implementation of BCA for Resilience Investments ................................................ 45
Appendix A. Resilience Benefit Valuation Approaches ...................................................................... 51
Appendix B. BCA Tests in the California Standard Practice Manual ............................................... 53
5
LIST OF FIGURES Figure 1. Summary of Next Steps for Implementation of BCA for Resilience Inclusive
Investments .................................................................................................................................................. 8 Figure 2. BCA With and Without Resilience Costs and Benefits ............................................................. 36 Figure 3. Summary of Next Steps for Implementation of BCA for Resilience Inclusive
Investments ................................................................................................................................................ 46
LIST OF TABLES Table 1. Electric Grid Investments with potential Resilience Benefits .................................................... 15 Table 2. Principles of BCA ......................................................................................................................... 21 Table 3. Process for Developing a Jurisdiction-Specific BCA Test ......................................................... 23 Table 4. Costs ................................................................................................................................................... 27 Table 5. Benefits ............................................................................................................................................... 30 Table 6. Illustrative Resilience Benefit Metrics............................................................................................ 43 Table 7. Analytical Approaches for Types of Resilience Benefits ............................................................ 51

6
EXECUTIVE SUMMARY
In 2019, Sandia National Laboratories (Sandia) contracted Synapse Energy Economics (Synapse) to research the integration of community and electric utility resilience investment planning.2. The research was funded by the U.S. Department of Energy (DOE) and conducted as part of the Grid Modernization Laboratory Consortium (GMLC). GMLC’s portfolio of projects includes the Designing Resilient Communities: A Consequence-Based Approach for Grid Investment (DRC) project.
The primary objective of this project is to understand and provide guidance on the challenges and opportunities facing communities and electric utilities seeking to coordinate energy-related resilience efforts.3 The project seeks to demonstrate an actionable path toward designing resilient communities through consequence-based approaches4 to grid planning and investment, and through field validation of technologies with partners that enable distributed and clean resources to improve community resilience. As part of the DRC project, Sandia is partnering with a variety of government, industry, and university partners to develop and test a framework for community resilience planning focused on modernization of the electric grid.
During the project, Synapse produced a series of reports to explore challenges and opportunities in several key areas, including benefit-cost analysis (BCA), performance metrics, microgrids, and regulatory mechanisms. This report focuses on BCA, an approach that electric utilities, electric utility regulators, and communities can use to evaluate the costs and benefits of a wide range of grid resilience investments in a comprehensive and consistent way.
While BCA is regularly applied to some types of grid investments, application of BCA to grid resilience investments is in the early stages of development. Though resilience is increasingly cited in connection with grid investment proposals and plans, the resilience-related costs and benefits of grid resilience investments are typically not fully identified, infrequently quantified, and almost never monetized.5,6 Without complete assessments of costs and benefits, regulators can be hesitant to approve some types of grid resilience investments. The BCA framework presented in this report is a resilience-inclusive BCA that recognizes that resilience is one of several goals when planning grid investments. This BCA framework highlights that resilience may not be the only or primary reason for making the investment and that there may also be costs and benefits that are not resilience-related.
2 In this research, municipal governments are considered communities due to their broad lens into local, public efforts and investments as well as their decision-making authority. Municipal governments include communities that are both urban and rural and both large and small. 3 Department of Energy. New GMLC Lab Call Awards for Resilient Distribution Systems. September 4, 2017. Available at: https://www.energy.gov/articles/new-gmlc-lab-call-awards-resilient-distribution-systems. 4 The North American Energy Resilience Modeling (NAERM) effort has developed a taxonomy describing the consequence of power outages in discrete dimensions. The NAERM metrics report is available on request through the US Department of Energy. 5 The Value of Resilience for Distributed Energy Resources: An Overview of Current Analytical Practices. April 2019. National Association of Regulatory Utility Commissioners. p. 4. Available at: https://pubs.naruc.org/pub/531AD059-9CC0-BAF6-127B-99BCB5F02198 6 Pacific Northwest National Laboratory. 2016. Valuation of Electric Power System Services and Technologies, p. 6.2.

7
This report provides the first application of the framework developed in the 2020 National Standard Practice Manual for Benefit-Cost Analysis of Distributed Energy Resources (NSPM for DERs)7 to grid resilience investments. We use this framework to develop:
• Naming and definitions for the costs and benefits that are relevant to grid resilience investments; • A catalogue of the many types of grid resilience investments; • An illustrative example of how to include these resilience impacts in a BCA; • Other considerations that are relevant to BCA for grid resilience investments, including the
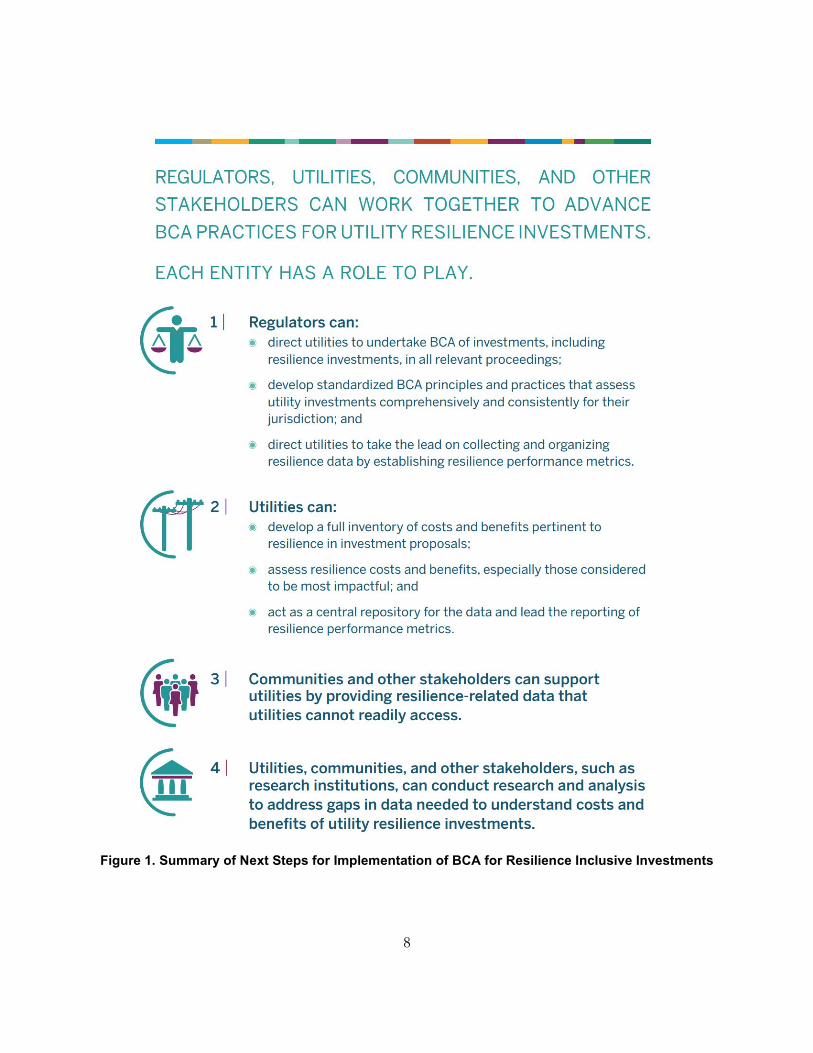
probability of occurrence, temporal and locational variability, and interactive effects; • A summary of metrics and data needs to quantify the costs and benefits of resilience; and • Guidance on next steps for implementation of BCA for resilience investments. The figure on the following page summarizes the next steps for implementation of BCA for resilience investments. With these improvements to BCA in place, utilities and regulators can better understand the costs and benefits of grid resilience investments. Utilities can present a range of options for regulatory consideration and regulators can evaluate these options. Proactive integration of grid resilience investments into existing regulatory processes and practices can increase the capacity of jurisdictions to respond to and recover from the consequences of extreme events.
7 National Standard Practice Manual for Benefit-Cost Analysis of Distributed Energy Resources. August 2020. Prepared by the National Energy Screening Project. Available at: https://www.nationalenergyscreeningproject.org/national-standard-practice-manual/
8
Figure 1. Summary of Next Steps for Implementation of BCA for Resilience Inclusive Investments
9
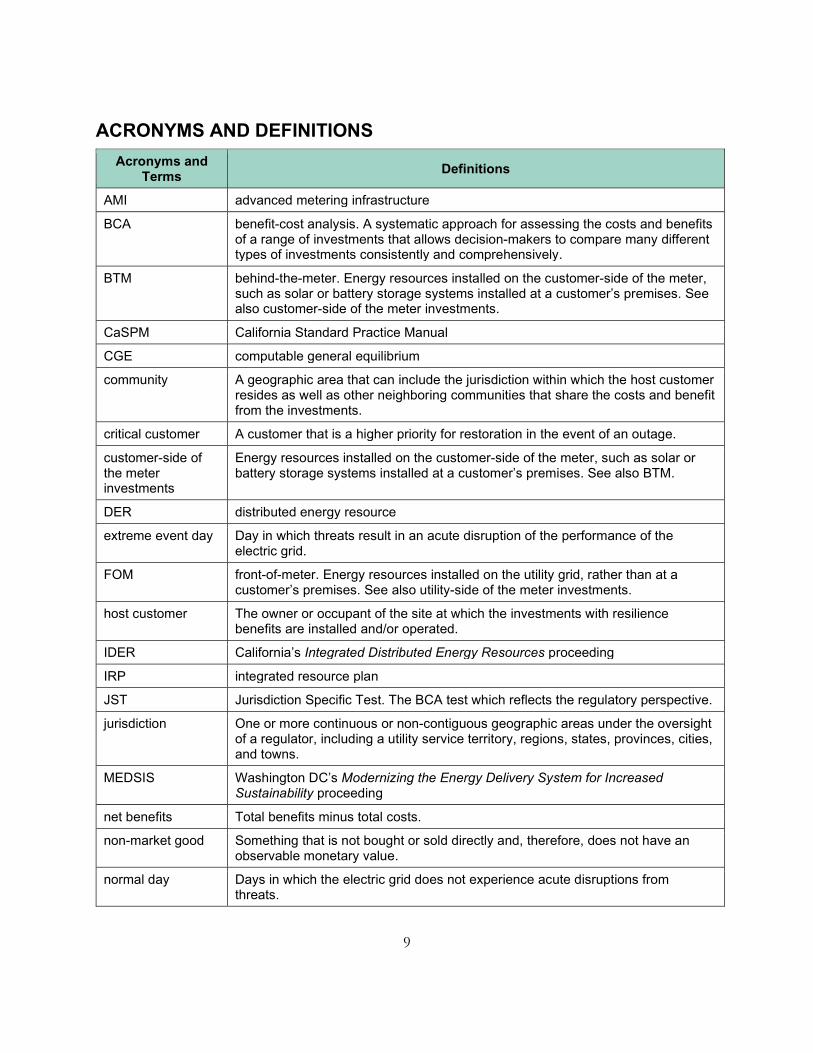
ACRONYMS AND DEFINITIONS Acronyms and
Terms Definitions
AMI advanced metering infrastructure
BCA benefit-cost analysis. A systematic approach for assessing the costs and benefits of a range of investments that allows decision-makers to compare many different types of investments consistently and comprehensively.
BTM behind-the-meter. Energy resources installed on the customer-side of the meter, such as solar or battery storage systems installed at a customer’s premises. See also customer-side of the meter investments.
CaSPM California Standard Practice Manual
CGE computable general equilibrium
community A geographic area that can include the jurisdiction within which the host customer resides as well as other neighboring communities that share the costs and benefit from the investments.
critical customer A customer that is a higher priority for restoration in the event of an outage.
customer-side of the meter investments
Energy resources installed on the customer-side of the meter, such as solar or battery storage systems installed at a customer’s premises. See also BTM.
DER distributed energy resource
extreme event day Day in which threats result in an acute disruption of the performance of the electric grid.
FOM front-of-meter. Energy resources installed on the utility grid, rather than at a customer’s premises. See also utility-side of the meter investments.
host customer The owner or occupant of the site at which the investments with resilience benefits are installed and/or operated.
IDER California’s Integrated Distributed Energy Resources proceeding
IRP integrated resource plan
JST Jurisdiction Specific Test. The BCA test which reflects the regulatory perspective.
jurisdiction One or more continuous or non-contiguous geographic areas under the oversight of a regulator, including a utility service territory, regions, states, provinces, cities, and towns.
MEDSIS Washington DC’s Modernizing the Energy Delivery System for Increased Sustainability proceeding
net benefits Total benefits minus total costs.
non-market good Something that is not bought or sold directly and, therefore, does not have an observable monetary value.
normal day Days in which the electric grid does not experience acute disruptions from threats.

10
Acronyms and Terms Definitions
NSPM for DERs 2020 National Standard Practice Manual for Benefit-Cost Analysis of Distributed Energy Resources
NWA non-wires alternative
PAC Program Administrator Cost Test. A BCA test which reflects the program administrator or utility system perspective. This test is also referred to as the Utility Cost Test or UCT.
PCT Participant Cost Test. A BCA test which reflects the participant or host customer perspectives. In cases where a community is a participant or host customer, this test can be used to reflect the community perspective.
regulatory perspective
A perspective that accounts for the applicable regulatory policies and goals of the jurisdiction. In this context, the term “regulatory” is meant to broadly refer to all types of decision-makers overseeing grid investments, including legislators, commissioners, boards overseeing public power authorities, municipal utilities, and utility cooperatives, among others.
reliability The ability of the system or its components to withstand instability, uncontrolled events, cascading failures, or unanticipated loss of system components.8
resilience The ability to prepare for and adapt to changing conditions and withstand and recover rapidly from disruptions.9
resilience benefits Resilience-related advancements generated by resilience costs.
resilience costs Investments aimed at unlocking resilience benefits.
resilience impacts Resilience costs and benefits.
REV New York’s Reforming the Energy Vision proceeding
RIM Rate Impact Measure Test. A BCA test which reflects all the costs and benefits of the PAC test, plus estimates of the utility lost revenues. This test is designed to address rate impacts and therefore answers fundamentally different questions than does a BCA.
SCT Societal Cost Test. A BCA test which reflects the societal perspective.
society Beyond the utility system and the host customer.
TRC Total Resource Cost Test. A BCA test which reflects the utility system and host customer and/or community perspectives.
utility program participant
Utility customers who participate in a utility program that provides financial incentives to customers to improve resilience.
utility-side of the meter investments
Energy resources installed on the utility grid, rather than at a customer’s premises. See also FOM.
8 Congressional Research Service. Electric Reliability and Power System Resilience. May 2, 2018. Page 7. Available at: https://www.everycrsreport.com/files/20180502_IN10895_b74bbaf13d1c87cf3bcd377022a1596667834782.pdf 9 U.S. Office of the Press Secretary. Presidential Policy Directive/PPD-21 -- Critical Infrastructure Security and Resilience. February 12, 2013. Available at: https://obamawhitehouse.archives.gov/the-press-office/2013/02/12/presidential-policy-directive-critical-infrastructure-security-and-resil.

11
Acronyms and Terms Definitions
utility system All elements of the electricity system necessary to deliver services to the utility’s customers, including generation, transmission, distribution, and utility operations.
VOLL value of lost load
VSL value of a statistical life
12
1. INTRODUCTION
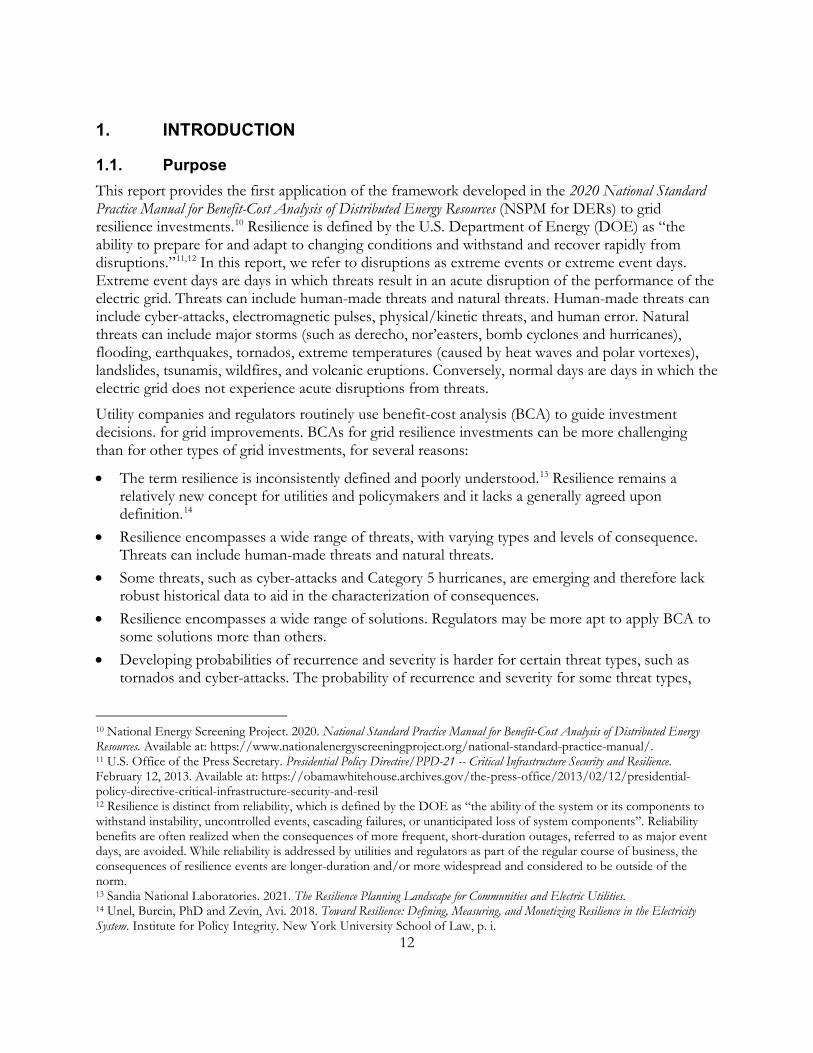
1.1. Purpose This report provides the first application of the framework developed in the 2020 National Standard Practice Manual for Benefit-Cost Analysis of Distributed Energy Resources (NSPM for DERs) to grid resilience investments.10 Resilience is defined by the U.S. Department of Energy (DOE) as “the ability to prepare for and adapt to changing conditions and withstand and recover rapidly from disruptions.”11,12 In this report, we refer to disruptions as extreme events or extreme event days. Extreme event days are days in which threats result in an acute disruption of the performance of the electric grid. Threats can include human-made threats and natural threats. Human-made threats can include cyber-attacks, electromagnetic pulses, physical/kinetic threats, and human error. Natural threats can include major storms (such as derecho, nor’easters, bomb cyclones and hurricanes), flooding, earthquakes, tornados, extreme temperatures (caused by heat waves and polar vortexes), landslides, tsunamis, wildfires, and volcanic eruptions. Conversely, normal days are days in which the electric grid does not experience acute disruptions from threats.
Utility companies and regulators routinely use benefit-cost analysis (BCA) to guide investment decisions. for grid improvements. BCAs for grid resilience investments can be more challenging than for other types of grid investments, for several reasons:
• The term resilience is inconsistently defined and poorly understood.13 Resilience remains a relatively new concept for utilities and policymakers and it lacks a generally agreed upon definition.14
• Resilience encompasses a wide range of threats, with varying types and levels of consequence. Threats can include human-made threats and natural threats.
• Some threats, such as cyber-attacks and Category 5 hurricanes, are emerging and therefore lack robust historical data to aid in the characterization of consequences.
• Resilience encompasses a wide range of solutions. Regulators may be more apt to apply BCA to some solutions more than others.
• Developing probabilities of recurrence and severity is harder for certain threat types, such as tornados and cyber-attacks. The probability of recurrence and severity for some threat types,
10 National Energy Screening Project. 2020. National Standard Practice Manual for Benefit-Cost Analysis of Distributed Energy Resources. Available at: https://www.nationalenergyscreeningproject.org/national-standard-practice-manual/. 11 U.S. Office of the Press Secretary. Presidential Policy Directive/PPD-21 -- Critical Infrastructure Security and Resilience. February 12, 2013. Available at: https://obamawhitehouse.archives.gov/the-press-office/2013/02/12/presidential-policy-directive-critical-infrastructure-security-and-resil 12 Resilience is distinct from reliability, which is defined by the DOE as “the ability of the system or its components to withstand instability, uncontrolled events, cascading failures, or unanticipated loss of system components”. Reliability benefits are often realized when the consequences of more frequent, short-duration outages, referred to as major event days, are avoided. While reliability is addressed by utilities and regulators as part of the regular course of business, the consequences of resilience events are longer-duration and/or more widespread and considered to be outside of the norm. 13 Sandia National Laboratories. 2021. The Resilience Planning Landscape for Communities and Electric Utilities. 14 Unel, Burcin, PhD and Zevin, Avi. 2018. Toward Resilience: Defining, Measuring, and Monetizing Resilience in the Electricity System. Institute for Policy Integrity. New York University School of Law, p. i.

13
such as those exacerbated by climate change, like hurricanes and forest fires, are increasing. As a result, historical probabilities may not accurately predict future probabilities.
• Resilience benefits can be nonmarket goods and thus can be more difficult to monetize. Avoiding lost quality of life can be a significant resilience investment benefit and is difficult to monetize.
These challenges can be overcome to ensure proper allocation of grid investments to grid resilience, among other goals such as affordability and sustainability. Current analyses of costs and benefits do not compare one type of resilience investment to another, or one or more resilience investments to non-resilience investments. Without complete and credible BCA, regulators can be hesitant to approve some types of grid resilience investments.
This report explores BCA as an approach that electric utilities, regulators, and communities can use to address these gaps by comprehensively and consistently evaluating the costs and benefits of a wide range of grid investments, with a specific focus on grid resilience investments. Utilities and regulators can understand the costs and benefits of grid resilience investments more fully with these BCA improvements place. Utilities can present a range of options for regulatory consideration and regulators can evaluate these options. Proactive integration of grid resilience investments into existing regulatory processes and practices can increase the capacity of jurisdictions to respond to and recover from the consequences of extreme events.
1.2. Report Organization The remainder of this report is organized as follows:
• Section 2 describes the many types of grid resilience investments. • Section 3 introduces BCA, discusses the history of BCA, describes a set of principles for
conducting BCA, and identifies a process for developing a jurisdiction-specific BCA test. • Section 4 discusses the resilience costs and benefits of grid investments and provides an
illustrative example. • Section 5 identifies and discusses other considerations that are relevant to grid resilience
investment BCA, including probability of occurrence, temporal and locational variability, and interactive effects.
• Section 6 identifies metrics and data needs. • Section 7 summarizes next steps for implementation of BCA for resilience investments. Appendix A summarizes the resilience benefit valuation approaches in common use. Appendix B provides an overview of the five BCA tests identified in the California Standard Practice Manual.

14
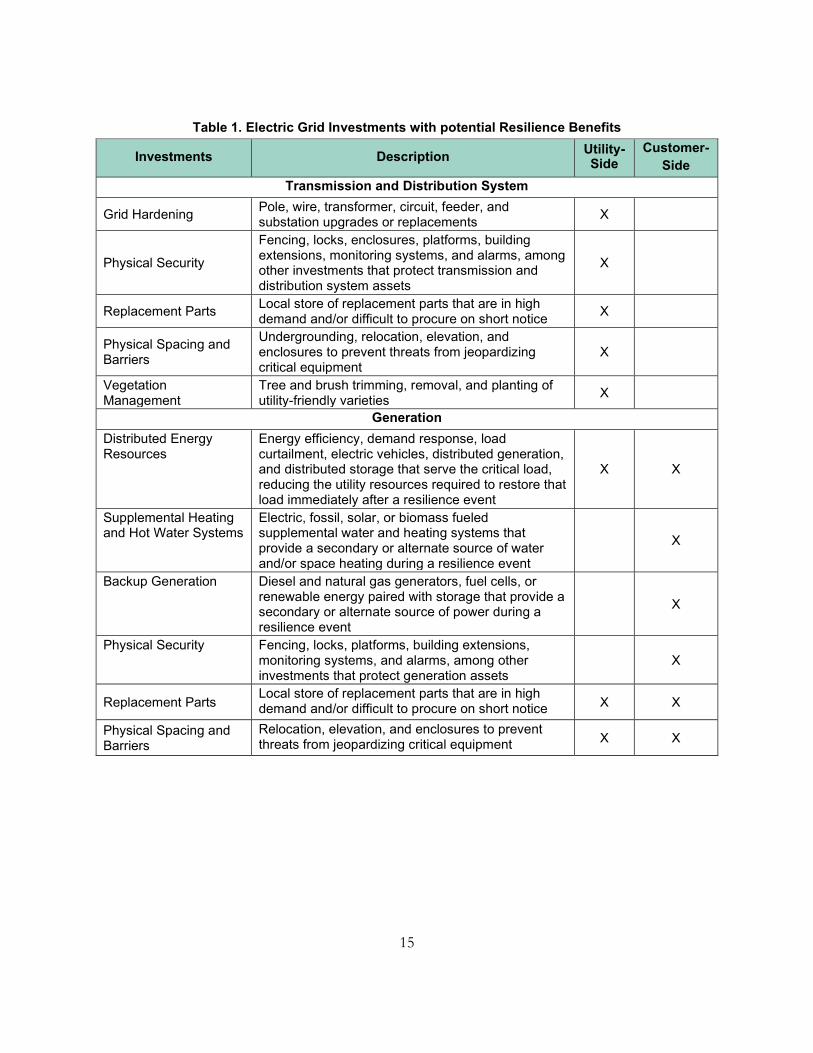
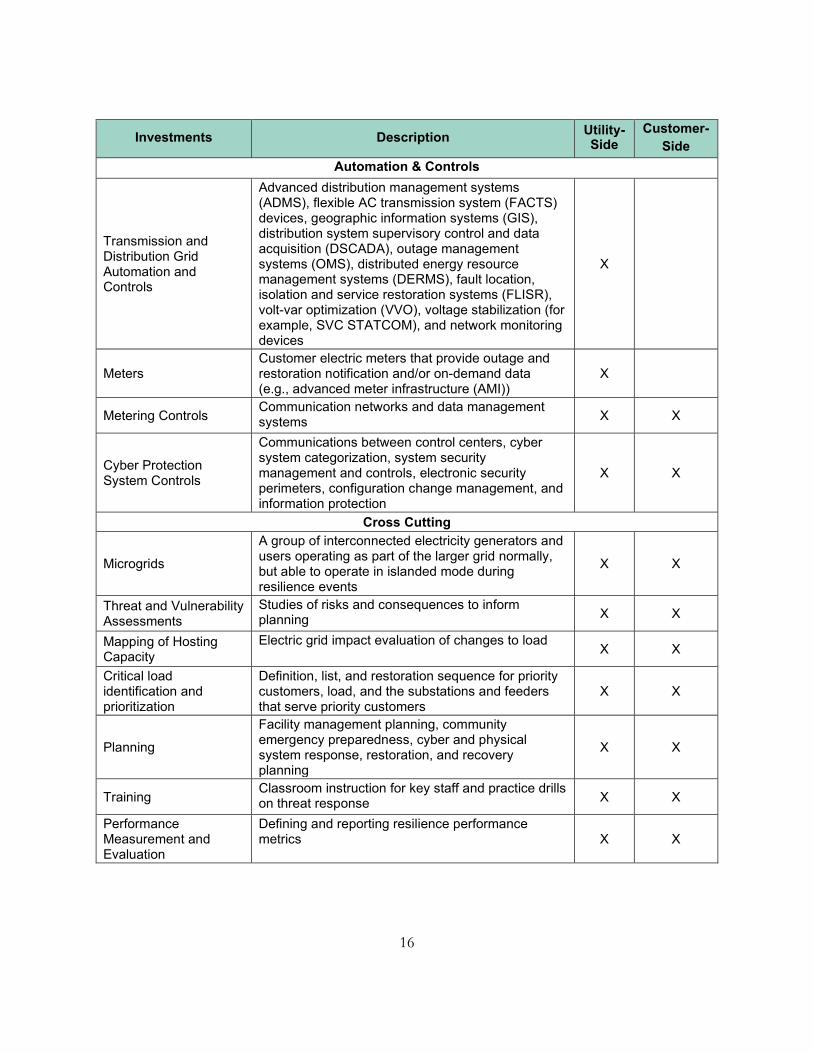
2. ELECTRIC GRID RESILIENCE INVESTMENTS Utilities, customers, and third parties can make many types of investments15 that improve grid resilience. The table below provides a list of these investments, grouped into four categories including: (1) transmission and distribution system, (2) generation, (3) automation and controls, and (4) cross cutting. The table also indicates whether each investment is on the utility-side of the meter, the customer-side of the meter, or both.16
Some investments, such as constructing a sea wall to block flooding from storm surge and sea level rise, are made primarily to improve resilience and all the costs and benefits are resilience-related. However, some of the technologies and solutions shown in the table below are not new or specific to resilience. In some cases, resilience may not be the only or primary reason for making the investment and there may also be costs and benefits that are not resilience-related. The resilience costs and benefits of these solutions can vary significantly. BCA is particularly well-suited for evaluating the costs and benefits of the wide range of solutions that exist to improve grid resilience, as well as address other important goals.
15 We use the term “investment” broadly to mean all types of costs. 16 The utility-side of the meter is often referred to as front-of-meter and the customer-side of the meter is often referred to as behind-the-meter.
15
Table 1. Electric Grid Investments with potential Resilience Benefits
Investments Description Utility-Side
Customer- Side
Transmission and Distribution System
Grid Hardening Pole, wire, transformer, circuit, feeder, and substation upgrades or replacements X
Physical Security
Fencing, locks, enclosures, platforms, building extensions, monitoring systems, and alarms, among other investments that protect transmission and distribution system assets
X
Replacement Parts Local store of replacement parts that are in high demand and/or difficult to procure on short notice X
Physical Spacing and Barriers
Undergrounding, relocation, elevation, and enclosures to prevent threats from jeopardizing critical equipment
X
Vegetation Management
Tree and brush trimming, removal, and planting of utility-friendly varieties X
Generation Distributed Energy Resources
Energy efficiency, demand response, load curtailment, electric vehicles, distributed generation, and distributed storage that serve the critical load, reducing the utility resources required to restore that load immediately after a resilience event
X X
Supplemental Heating and Hot Water Systems
Electric, fossil, solar, or biomass fueled supplemental water and heating systems that provide a secondary or alternate source of water and/or space heating during a resilience event
X
Backup Generation Diesel and natural gas generators, fuel cells, or renewable energy paired with storage that provide a secondary or alternate source of power during a resilience event
X
Physical Security Fencing, locks, platforms, building extensions, monitoring systems, and alarms, among other investments that protect generation assets
X
Replacement Parts Local store of replacement parts that are in high demand and/or difficult to procure on short notice X X
Physical Spacing and Barriers
Relocation, elevation, and enclosures to prevent threats from jeopardizing critical equipment X X
16
Investments Description Utility-Side
Customer- Side
Automation & Controls
Transmission and Distribution Grid Automation and Controls
Advanced distribution management systems (ADMS), flexible AC transmission system (FACTS) devices, geographic information systems (GIS), distribution system supervisory control and data acquisition (DSCADA), outage management systems (OMS), distributed energy resource management systems (DERMS), fault location, isolation and service restoration systems (FLISR), volt-var optimization (VVO), voltage stabilization (for example, SVC STATCOM), and network monitoring devices
X
Meters Customer electric meters that provide outage and restoration notification and/or on-demand data (e.g., advanced meter infrastructure (AMI))
X
Metering Controls Communication networks and data management systems X X
Cyber Protection System Controls
Communications between control centers, cyber system categorization, system security management and controls, electronic security perimeters, configuration change management, and information protection
X X
Cross Cutting
Microgrids
A group of interconnected electricity generators and users operating as part of the larger grid normally, but able to operate in islanded mode during resilience events
X X
Threat and Vulnerability Assessments
Studies of risks and consequences to inform planning X X
Mapping of Hosting Capacity
Electric grid impact evaluation of changes to load X X
Critical load identification and prioritization
Definition, list, and restoration sequence for priority customers, load, and the substations and feeders that serve priority customers
X X
Planning
Facility management planning, community emergency preparedness, cyber and physical system response, restoration, and recovery planning
X X
Training Classroom instruction for key staff and practice drills on threat response X X
Performance Measurement and Evaluation
Defining and reporting resilience performance metrics X X

17
Below we highlight six of the examples provided in the table above and provide more detail on each one:
• hardening the transmission or distribution system to a higher degree of rigor or redundancy than a minimum or present-day standard to strengthen the system so it can withstand challenges that are less frequent but of higher consequence;
• trimming a greater number of trees, trimming trees further, or removing trees and planting utility-friendly trees to avoid transmission and distribution system damages;
• relocating a piece of grid equipment and/or building a barrier to protect that equipment;
• enabling islandable microgrids with longer lasting backup generation, such as pairing battery storage systems with distributed renewable energy generation, to sustain critical loads in extended outages;
• purchasing supplies in advance to accelerate restoration efforts after a significant event beyond that which is deemed necessary for normal operations; and
• conducting utility staff training on grid restoration.
A utility interested in improving resilience may want to consider these options. BCA can allow the utility and its regulator to compare these options to one another, select the options of greatest interest, and prioritize those options for implementation.
18
3. BCA FRAMEWORK We use this section to provide some foundational information on BCA and framework materials. We start with an introduction to BCA, including its definition, calculation, and application. Then, we describe the history of BCA in utility regulation. Next, we provide a set of fundamental principles that can serve as the foundation for conducting BCA. Lastly, we define the term jurisdiction-specific BCA test and provide a process for developing this test.
3.1. Introduction to BCA BCA is a systematic approach for assessing the likely impacts of a range of investments and allows decision-makers to compare many different types of investments consistently and comprehensively. BCA is assessed by comparing the sum of the present value of all the benefits (in dollars) to the sum of the present value of all the costs. The results of BCA can be reported in the form of (1) present values of costs and benefits, (2) net benefits, which involves subtracting the present value costs from the present value benefits, and (3) a benefit-cost ratio, which involves dividing the present value benefits by the present value costs. A positive net benefit and a benefit-cost ratio of 1.0 or higher indicates that the benefits of the investment are equal to or greater than the costs.
BCA can be used to:
• identify the lowest-cost options for achieving desired outcomes; • identify how proposed projects and investments will affect utility revenue requirements and
average customer bills; • explore the merits of an investment from multiple perspectives, including the perspectives of
regulators, utilities, host customers, communities, and society; • compare and prioritize multiple, diverse resilience solutions with one another; and • compare and prioritize solutions that provide resilience with solutions that address other goals,
such as reliability and sustainability.
3.2. History of BCA in Utility Regulation Regulators regularly require electric utilities to perform BCA to guide investment decisions in integrated resource planning, to justify cost recovery for past investments in rate cases, or to request commission approval of proposed new or unusual investments. In the 1980s, regulators began to require utility companies to use BCA practices to evaluate investments in energy efficiency relative to investments in new power plants.
The California Standard Practice Manual (CaSPM) was developed in the 1990s and updated in 2001 to standardize the application of BCA to energy efficiency in the state of California. The CaSPM
BCA is a systematic approach for assessing the costs and benefits of a range of investments and allows decision-makers to compare many different types of investments consistently and comprehensively.
19
established five BCA tests including the Program Administrator Cost Test (PAC),17 the Participant Cost Test (PCT), the Total Resource Cost Test (TRC), the Rate Impact Measure Test (RIM) and the Societal Cost Test (SCT). We review each of these BCA tests in more detail in Appendix B.
Over time, the CaSPM became the national guidebook for energy efficiency BCA with five pre-defined tests. Despite being in use for many years, the CaSPM and its tests have many limitations. While these tests provide a structured approach to evaluating investments, the choice of perspectives they offer is too limited for some contexts. The tests do not provide much flexibility for addressing the specific regulatory policy goals of any one jurisdiction. This inflexibility has caused general confusion about which costs and benefits should be included in a BCA test, as well as how to account for hard-to-quantify impacts. As a result, different jurisdictions have applied the tests to energy efficiency inconsistently. Additionally, CaSPM did not offer guidance for application to some new types of investments, such as grid modernization investments and distributed energy resources.
In 2009, the DOE created the Smart Grid Investment Grant (SGIG) program as part of the American Recovery and Reinvestment Act 2009. The SGIG awarded up to 50 percent of eligible project costs for a total of approximately $3.4 billion to 99 projects across the country. Many utility awardees petitioned their regulators for pre-approval to proceed with smart grid investment projects, but many regulators required Smart Grid petitions to provide BCA results as part of the application process. At the time, there was no standardized way of evaluating the costs and benefits of smart grid investments. Regulators across the country had to determine appropriate costs and benefits to include in the evaluation of the smart grid proposals. In 2012, the DOE provided a framework to evaluate Smart Grid Demonstration projects. This framework for evaluating SGIG projects provided a roadmap for BCA requirements for other distribution infrastructure pre-approval proceedings.18
In 2016, New York’s Reforming the Energy Vision (REV) proceeding established a BCA framework and incorporated resilience as a key consideration in valuing distributed energy resources (DER) and non-wires alternatives (NWA).19 This framework is used for evaluating DER alternatives as substitutions for more traditional utility solutions and is designed to be flexible enough to account for qualitative benefits to utility or grid operations, as well as to include societal non-energy benefits as more data become available.20 The state’s investor-owned utilities are required to prepare BCA handbooks on a biannual basis. The handbooks outline the methodologies for evaluating benefits and costs and help establish standards for evaluating grid modernization investments. Importantly, New York’s BCA Framework includes “reliability/resiliency” as a category of benefits to be considered in utility BCAs.
In California, the Integrated Distributed Energy Resources (IDER) proceeding recognizes the resilience benefits of DERs and similarly has prioritized BCA as an approach to rationalize the utility
17 This is often referred to as the Utility Cost Test (UCT). 18 Wakefield, M. 2012. Guidebook for Cost/Benefit Analysis of Smart Grid Demonstration Projects, Revision 1, Measuring Impacts and Monetizing Benefits, 1025734, Technical Update. Electrical Power Research Institute. Available at: https://www.energy.gov/sites/prod/files/2017/01/f34/Guidebook-Cost-Benefit-Analysis-Smart-Grid-Demonstration-Projects.pdf. 19 Case 14-M-0101. Proceeding on Motion of the Commission in Regard to New York’s Reforming the Energy Vision. Order Establishing Benefit Cost Analysis Framework. January 21, 2016. 20 New York Public Service Commission, Order Establishing the Benefit Cost Analysis Framework, Case 14-M-0101 - Proceeding on Motion of the Commission in Regard to Reforming the Energy Vision, January 21, 2016, at 21-22.

20
investment process.21 The California Public Service Commission initiated a rulemaking (R.14-08-013) in 2014 to develop a regulatory framework for DERs. The effort aimed to “integrate customer demand-side programs, such as energy efficiency, self-generation, advanced metering, and demand response, in a coherent and efficient manner.”22 The resulting “Competitive Solicitation Framework Working Group Final Report” identified resilience as among the distribution system benefits that could be procured from DERs. Since then, legislation was adopted requiring the Commission to account for greenhouse gases in planning decisions and the Commission has updated the avoided costs used in calculating costs and benefits for traditional supply resources and DERs to include avoided greenhouse gases.23
Frameworks in New York and California advanced BCA standards by (1) requiring BCA for a range of investments, (2) improving the consistency of BCA across various proceedings, (3) accounting for state policy in PUC decision making, and (4) incorporating resilience into BCA. In 2020, the NSPM for DERs was developed to update, expand upon, and replace the CaSPM. It introduces several new concepts to guide BCA practices, including fundamental principles, the regulatory perspective, the jurisdiction-specific BCA test, and more. This report is the first application of the NSPM for DERs framework to grid resilience investments.
3.3. BCA Principles In this section, we describe the eight fundamental BCA principles from the NSPM for DERs that represent sound economic and regulatory practice.24 The principles in the table below set the foundation for developing BCA tests. The principles are not mutually exclusive, as they contain some overlapping concepts. There may be situations where it is necessary for jurisdictions to make trade-offs between certain principles, depending upon specific situations. For example, some DER types might historically have different policy goals that other DER types, requiring regulators to strike a balance between addressing historic policy goals (Principle 2) and treating all DERs consistently (Principle 1).
A common issue with BCA for grid investments is the inclusion of all the costs, but not all the benefits. Principle 1 (Treat Utility Resources Consistently), Principle 3 (Ensure Symmetry), and Principle 4 (Account for Relevant Impacts) all help to address this issue. It is also important to note that the principles in and of themselves do not determine which BCA test should be used by any one jurisdiction. The principles should be used to help guide stakeholders and regulators to develop a test that is tailored to the applicable policy goals of the jurisdiction.
21 California Public Utilities Commission (CPUC). Decision 16-12-036 and R.14-10-003. Competitive Solicitation Framework Working Group Final Report 22 CPUC. Decision 07-10-032. 23 CPUC. Rulemaking 14-10-003. Order Instituting Rulemaking to Create a Consistent Regulatory Framework for the Guidance, Planning and Evaluation of Integrated Distributed Energy Resources. Administrative Law Judge’s Ruling Confirming Use of Recommendations from Rulemaking 14-08-013 and Introducing Staff Proposal for Major Updates to Avoided Cost Calculator. November 20, 2019. Available at: https://docs.cpuc.ca.gov/PublishedDocs/Efile/G000/M319/K898/319898332.PDF 24 NSPM for DERs, page iv.

21
Table 2. Principles of BCA
Principle Description Implications for Resilience
Treat Utility Resources Consistently
All utility resources should be compared using consistent methods and assumptions to avoid bias across resource investment decisions.
All resilience investment options should be evaluated using BCA.
Align with Policy Goals Jurisdictions invest in or support energy resources to meet a variety of goals and objectives. The jurisdiction-specific BCA test should therefore reflect this intent by accounting for the jurisdiction’s applicable policy goals and objectives.
If resilience is a policy goal, resilience costs and benefits should be captured.
Ensure Symmetry Asymmetrical treatment of benefits and costs associated with a resource can lead to a biased assessment of the resource. To avoid such bias, benefits and costs should be treated symmetrically for any given type of impact.
If resilience costs are included, resilience benefits should be as well.
Account for Relevant Impacts
BCA tests should include all relevant impacts including those that are difficult to quantify or monetize.
Some resilience benefits may be hard to quantify but they should not be ignored or given no value.
Conduct Forward-Looking, Long-Term, Incremental Analyses
BCA should be forward-looking, long-term,25 and incremental to what would have occurred absent the investment. This helps ensure that the investment in question is properly compared with alternatives. The analysis should consider the entire lifetime of the investment so it can capture the full costs and benefits associated with the solutions under consideration.
The benefits of resilience investments may not be experienced frequently or soon.
Avoid Double-Counting Impacts
BCA present a risk of double-counting benefits and/or costs. All impacts should therefore be clearly defined and valued to avoid double-counting.
The delineation by perspective can help avoid counting the same impact twice.
25 To ensure a valid comparison of the benefits to the costs, future costs and benefits should be discounted to the present day using an appropriate discount rate.

22
Principle Description Implications for Resilience Ensure Transparency Transparency helps ensure
engagement and trust in the BCA process and decisions. BCA practices should therefore be transparent, where all relevant assumptions, methodologies, and results are clearly documented and available for stakeholder review and input.
Resilience costs and benefits should be clearly named and defined.
Conduct BCAs Separately from Rate and Bill Impact Analyses
BCA answer fundamentally different questions than rate and bill impact analyses, and therefore should be conducted separately from the rate and bill impact analysis.
As the cost of some resilience investments may be high, rate and bill impacts are an important, but separate consideration.
3.4. Jurisdiction-Specific BCA Test Different BCA tests provide different information about the costs and benefits of grid investments, and it is important to identify the test or tests that are most appropriate for the jurisdiction. The NSPM for DERs recommends that regulators and others develop a jurisdiction-specific BCA test (JST) that can be used to make the ultimate decision of whether a program or project merits investment.
The JST should account for the regulatory perspective, meaning that it reflects the applicable regulatory policies and goals of the jurisdiction. These policies and goals can be articulated in many forms, including legislation, executive orders, regulations, previous commission orders, etc. Further, these policies and goals can change over time. The regulatory perspective, and the decisions regarding how to account for policy goals in a JST, should be informed by robust stakeholder input to balance the interests of different parties. In this context, the term “regulatory” is meant to broadly refer to all types of decision-makers overseeing grid investments, including legislators, commissioners, and board members, among others.
A JST can be developed using a multi-step process guided by the fundamental BCA principles. The principles are intended to be applied in a manner that considers the characteristics and circumstances of each jurisdiction’s approach to evaluating energy resources. Thus, application can result in different JST’s for different jurisdictions. The following table outlines a five-step process for developing a JST.

23
Table 3. Process for Developing a Jurisdiction-Specific BCA Test
Steps Description
1. Articulate Applicable Policy Goals
Articulate the jurisdiction’s applicable policy goals. The NSPM for DERs framework is policy-neutral, meaning it does not recommend any specific BCA tests. Rather, the NSPM for DERs framework supports BCA tests that align with the jurisdiction’s policy goals and objectives. It is important for a jurisdiction to account for all its applicable energy-related policy goals. Examples of where these goals may be found include statues, regulations, organizational policies, utility resource planning principles and policies, and/or other codified forms under which utilities or energy planners operate. The process of identifying relevant policies and associated goals should be transparent and open to stakeholders and the result documented before moving on to Step 2.
2. Include All Utility System Impacts
Identify and include the full range of utility system impacts in the JST. Once regulators and other decision-makers in the jurisdiction have determined the applicable policies and goals, they can then decide which costs and benefits to include in the BCA. Evaluation of many grid investments has historically focused on the costs and benefits that accrue to the utility system and these provide a reasonable foundation for BCA. For an electric utility, this may include impacts related to generation, transmission, and distribution of electricity. Avoided cost estimates are crucial to this analysis and should be comprehensive, up-to-date, and reviewed by regulators.
3. Decide which Non-Utility System Impact to Include
Identify those non-utility system impacts to include in the JST based on applicable policy goals identified in Step 1. This important step is used to determine whether to include host customer, community, societal, low-income, and/or other fuel and water impacts. These should be identified and documented for further consideration and discussion in this step.
4. Ensure that Benefits and Costs Are Properly Addressed
Ensure that the impacts identified in Steps 2 and 3 are properly addressed, where: • Benefits and costs are treated symmetrically. • Relevant impacts are included, even if hard to quantify. • Benefits and costs are not double counted. • Benefits and costs are treated consistently for different types of
investments. Please see investment categories and investments in Table 1. Costs are relatively easy to quantify and are usually represented as a dollar value. Benefits can be more difficult to quantify and cannot always be monetized. Example approaches that can be used to account for costs and benefits include: (1) leveraging inputs, assumptions, calculations, methodologies from a related study for another jurisdiction as a proxy, (2) doing a jurisdiction-specific study, or (3) developing new forms of quantitative or qualitative information based on existing data. This step needs to be completed before moving to the final step.
24
Steps Description
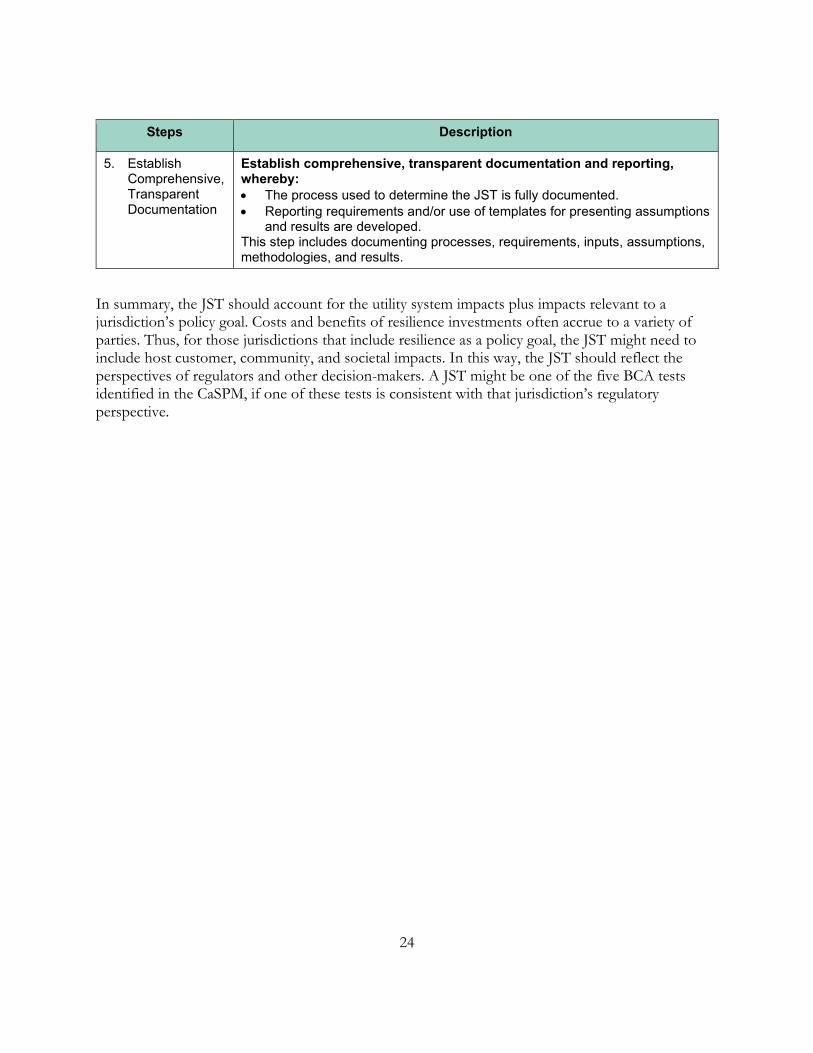
5. Establish Comprehensive, Transparent Documentation
Establish comprehensive, transparent documentation and reporting, whereby: • The process used to determine the JST is fully documented. • Reporting requirements and/or use of templates for presenting assumptions
and results are developed. This step includes documenting processes, requirements, inputs, assumptions, methodologies, and results.
In summary, the JST should account for the utility system impacts plus impacts relevant to a jurisdiction’s policy goal. Costs and benefits of resilience investments often accrue to a variety of parties. Thus, for those jurisdictions that include resilience as a policy goal, the JST might need to include host customer, community, and societal impacts. In this way, the JST should reflect the perspectives of regulators and other decision-makers. A JST might be one of the five BCA tests identified in the CaSPM, if one of these tests is consistent with that jurisdiction’s regulatory perspective.
25
4. THE COSTS AND BENEFITS OF GRID RESILIENCE INVESTMENTS One of the most important steps in conducting a BCA is identifying all relevant costs and benefits for the perspectives of interest. We start by providing an overview of the potential perspectives of interest and the costs and benefits relevant to these perspectives, as detailed in the NSPM for DERs. We highlight the categories of costs and benefits that are relevant to resilience solutions. Next, we identify and define resilience costs and benefits within these categories. Lastly, we provide an illustrative example of how these resilience costs and benefits can be applied to BCA.
4.1. Overview of Perspectives The BCA can reflect different perspectives, including a utility system, host-customer, community, and/or societal perspective. The results of BCA tests can vary significantly, depending upon whose costs and whose benefits are considered. Clear definitions of the relevant perspectives are needed to avoid double-counting of costs and benefits.
Utility System The utility system is defined as all elements of the electricity or gas system necessary to deliver services to the utility’s customers. For electric utilities, this includes generation, transmission, distribution, and utility operations. This term refers to any type of utility ownership or management, including investor-owned utilities, publicly owned utilities, municipal utility systems, and cooperatives. For vertically integrated utilities, this perspective includes all the benefits and costs that affect utility revenue requirements. For utilities that are not vertically integrated, this test includes all benefits and costs that affect utility revenue requirements, plus additional benefits and costs associated with market-based procurement of electricity and gas services. The utility system perspective can be accounted for in BCA using the utility cost test.
Host Customer A host customer is defined as the owner or occupant of the site at which the resilience investments are installed and/or operated. The customer can be a critical residential, commercial (including municipal government facilities and small, mid-sized, or large private businesses), or industrial customer. A critical customer is a customer that has a higher priority for restoration in the event of an outage. Critical customers are prioritized based on their ability to provide life sustaining products or services or based on need, as for vulnerable customers. In some cases, these customers may participate in a utility program that provides financial incentives to customers to improve resilience.
The host customer perspective can be accounted for in BCA using the tests in the CaSPM in two ways. First, the participant cost test can be used to determine how a utility investment will affect just the host customer. Second, the total resource cost test can be used to determine how a utility investment will affect the host customer and utility system the combined.
Community A BCA test focused on a community’s perspective can be relevant for grid resilience investments. A community can include jurisdictions which receive a resilience benefit from the resilience investment, such as the community within which the host customer resides and other neighboring
26
communities that share the costs and benefit from the investments. The benefits to each community depend on the location of the host customer and type of services enabled by the investment. In cases where the host customer provides a critical community service, the community benefits more than cases where the host customer does not provide a critical community service. For example, when the host customer is a community center, resilience investments can provide members of the community a respite from extreme heat and cold during an extended outage.
The community perspective can be accounted for in two ways, depending upon the purpose of the BCA.
• If the purpose of the BCA is for the community itself to decide whether to make a resilience investment, then the participant cost test should be used.
• If the purpose of the BCA is for a utility to decide whether to make an investment to provide resilience benefits for communities, and community resilience benefits are a policy goal for its jurisdiction, then it should use either (a) the societal cost test, or (b) a jurisdiction specific test that includes community resilience impacts, both of which include community impacts.
Society The societal perspective accounts for those impacts that extend beyond the utility system, host customer, and community. This can include, for example, alleviating poverty, improving the environment, supporting economic development, and reducing federal taxes. The societal perspective can be accounted for in BCA using the societal cost test.
In the context of resilience investments, it can be important to define the boundary between the utility system, host customer, community, and society. Society can include customers such as municipal government facilities, residents, and businesses. The society boundary includes:
o Customers within the utility service territory, but outside of the geographic boundaries of the community.
o Customers outside of the utility service territory.
4.2. Costs The NSPM for DERs includes a comprehensive list of the categories of potential costs for a range of DER types, all of which are relevant to resilience.26 The table below shows the costs from the NSPM for DERs that apply to resilience as well as how these impacts affect the utility system, host customers, communities, and society.27 Grid resilience investments can have installation, operation, maintenance, transaction, interconnection, financial incentive, program administration, and utility performance incentive costs. Below the table we provide additional description of the costs that are relevant to each perspective (for boxes in the table with a check mark). We first discuss costs
26 NSPM for DERs, pages viii-vix. 27 We are not discussing the costs (or benefits) associated with investments made to support normal day operations. For more on these types of costs (or benefits), please see the NSPM for DERs.

27
relevant to the utility system, then to the host customer, next to the community, and finally to society.
Table 4. Costs
Type Impact
Util
ity
Syst
em
Hos
t C
usto
mer
Com
mun
ity
Soci
ety28
Proj
ect I
mpl
emen
tatio
n
Installation, Operation, and Maintenance X X X
Transaction X X X
Interconnection X X X
Financial Incentives X X
Program Administration X
Utility Performance Incentives X
Utility System The resilience costs may include the following utility system costs:
• Installation, Operation, and Maintenance: A portion of the utility system cost to procure and install equipment that provides resilience benefits can be considered a resilience cost. Beyond the installation costs, there can be fixed and variable costs for a utility to operate and maintain the new systems, including new skills and capabilities to respond to extreme events. For instance, a battery storage system may require that staff attend to the charging in advance of an extreme event (when there is ample notice that an event is coming) and the discharging during the event. Often, longer-duration events require substantial fuel reserves to provide backup power. To the extent that the utility owns or maintains backup generation or pays some or all the cost of maintaining a larger fuel reserve, these costs represent the resilience costs for the utility system.
• Transaction: There may be additional costs associated with establishing communication networks and data tracking and transfers between entities for certain projects.
• Interconnection: Solutions may require interconnection costs to unlock their full resilience potential. For example, DERs can be upsized to be able to serve all the critical load at a site.
28 Impacts that affects utilities, host customers, or communities are typically considered to be also included in societal impacts. In this column, however, we identify those impacts that affect society but do not affect the other entities listed here.
28
Larger-sized DERs may require costs to upgrade transformers or other distribution system equipment that are borne by the utility.
• Financial Incentives29: Utilities can provide financial support to individual residential, commercial, and industrial customers that make resilience investments. For example, utilities can help customers invest in a more functional grid forming inverter that, when paired with a battery at a substation and a grid forming inverter, can provide power during resilience events.
• Utility Program Administration: Utilities that provide financial incentive programs to residential, commercial, and industrial customers may incur costs to develop, plan for, and manage these programs.
• Utility Performance Incentives: Utility regulators can allow utilities that invest in resilience to receive performance incentives for doing so.
Host Customer The resilience costs may include the following host customer costs:
• Installation, Operation, and Maintenance: Residential, commercial, and industrial customers can contribute to the installation, operation, and maintenance of resilience investments. One of the most common examples is the purchase of backup generation for use during a resilience event. A customer’s operation and maintenance costs can include the costs to maintain a backup generator in operational condition, monthly costs to pay a utility or third-party supplier for access to the services of a battery or uninterruptible power system, or costs to maintain the skills of facility energy managers to operate equipment during resilience events. Fuel shortages are common during resilience events, which may make a case for fuel reserves to be procured in advance and stored on site.
• Transaction: Some of the communication, data, and legal costs required to enable the resilience investment can be borne by the host customer.
• Interconnection: Host customers might pay a portion of the costs to interconnect a project at their site to the electricity grid. For example, a portion of the utility costs to upgrade transformers and other utility system equipment to handle larger DERs can be allocated to larger host customers.
Community The resilience costs may include the following community costs:
• Installation, Operation, and Maintenance: A community may wish to partially or completely fund a microgrid to provide support for a municipal government building or public, service such as fire and police department services, during an extended grid outage. A community may also decide to contribute to the costs of a microgrid for a private business (such as a grocery store or restaurant) if the business can provide life-sustaining products or services to the community
29 Financial incentives to host customers can be described as “offsetting impacts” because one party experiences a cost that is exactly offset by a benefit received by another party. Despite that fact that financial incentives can be offsetting impacts, they should nonetheless be included in all BCA tests. This issue is addressed in more detail in the NSPM for DERs in Appendix F: Transfer Payments and Offsetting Impacts.

29
during an extreme event. This can include investing a portion of community funds to support ongoing fixed and variable operation and maintenance costs.
• Transaction: The community may pay some of the communication, data, and legal costs that enable resilience investments.
• Interconnection: Communities may contribute to the costs to interconnect projects in critical public or private facilities in their municipality.
Society The resilience costs may include the following societal costs:
• Financial Incentives: Resilience investments may be supported by state or federal funding, such as through grant or subsidy programs from the Department of Energy, State Energy Offices, or other government agencies. The resulting tax burden is a societal cost
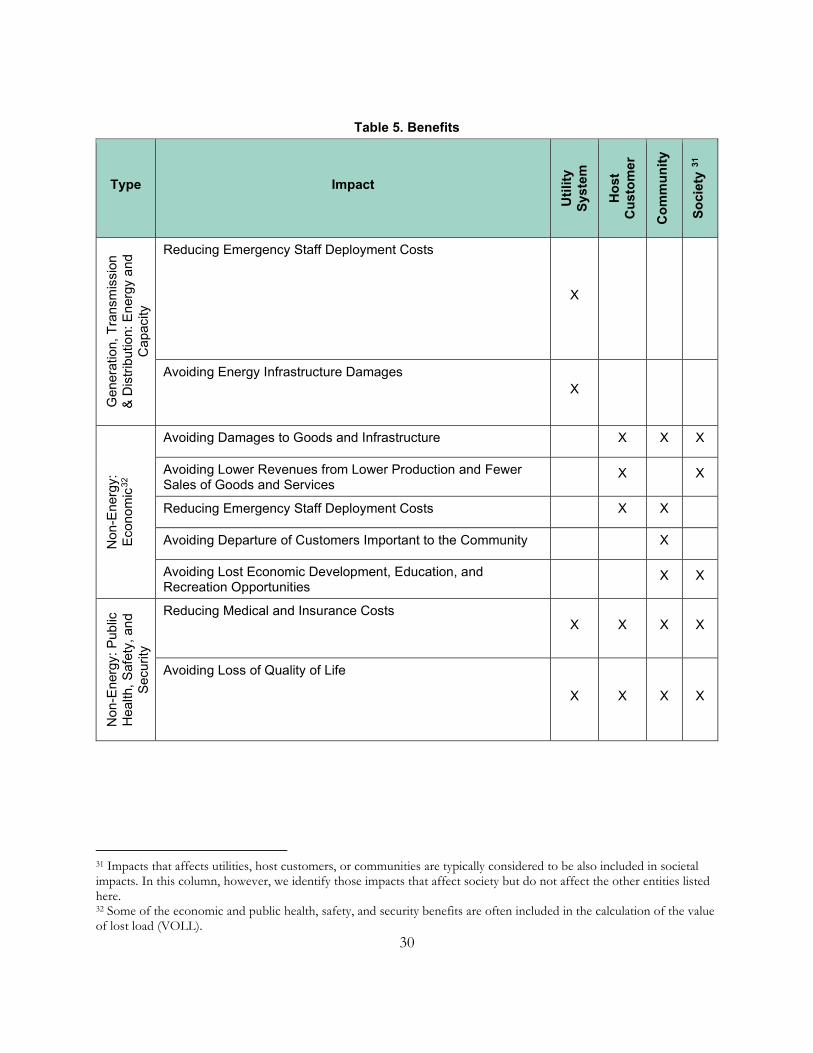
4.3. Benefits The NSPM for DERs also includes a comprehensive list of the categories of potential benefits.30 The table below shows the subset of benefits from the NSPM for DERs that applies to resilience as well as how these impacts affect the utility system, host customers, communities, and society. Grid resilience investments can have energy and capacity, economic, and public health, safety, and security benefits. Below the table we provide additional description of the benefits that are relevant to each perspective (for boxes in the table with a check mark). We first discuss benefits relevant to the utility system, then to the host customer, next to the community, and finally to society.
30 NSPM for DERs, pages viii-vix.
30
Table 5. Benefits
Type Impact
Util
ity
Syst
em
Hos
t C
usto
mer
Com
mun
ity
Soci
ety
31
Gen
erat
ion,
Tra
nsm
issi
on
& D
istri
butio
n: E
nerg
y an
d C
apac
ity
Reducing Emergency Staff Deployment Costs
X
Avoiding Energy Infrastructure Damages X
Non
-Ene
rgy:
Ec
onom
ic32
Avoiding Damages to Goods and Infrastructure X X X
Avoiding Lower Revenues from Lower Production and Fewer Sales of Goods and Services
X X
Reducing Emergency Staff Deployment Costs X X
Avoiding Departure of Customers Important to the Community X
Avoiding Lost Economic Development, Education, and Recreation Opportunities
X X
Non
-Ene
rgy:
Pub
lic
Hea
lth, S
afet
y, a
nd
Secu
rity
Reducing Medical and Insurance Costs X X X X
Avoiding Loss of Quality of Life
X X X X
31 Impacts that affects utilities, host customers, or communities are typically considered to be also included in societal impacts. In this column, however, we identify those impacts that affect society but do not affect the other entities listed here. 32 Some of the economic and public health, safety, and security benefits are often included in the calculation of the value of lost load (VOLL).

31
Utility System The resilience benefits may include the following utility system benefits:
Economic
• Reducing Emergency Staff Deployment Costs: Avoiding outages can reduce the costs associated with dispatching utility staff to customer sites, including overtime costs, housing costs for the staff if the sites are far from where they live, and costs for trucks and fuel to reach the sites.
• Avoiding Energy Infrastructure Damages: Some investments seek to avoid or limit costs associated with damages to utility owned and operated generation, transmission, and distribution infrastructure during an extreme event. For example, a utility can invest in new distribution system poles that are made of metal, so they do not burn in forest fires. Alternatively, the poles can be made thicker or with a sturdier design to withstand higher wind speeds.
Public Health, Safety, and Security
• Reducing Medical and Insurance Costs: Resilience investments can reduce the public health, safety, and security impacts for utility employees, including office staff and line workers. For example, utilities can avoid exposure of utility personnel to hazards during power restoration that can result in work-related injuries leading to increased costs from doctor and emergency room visits, medical procedures, and drug prescriptions.
• Avoiding Loss of Quality of Life: Reductions in exposure to power restoration hazards also result in reductions in stress, injury, illness, and/or death.
Avoided utility lost revenues from avoided lost customer load should not be included as a benefit in BCA.
When a utility does not serve its current load, it loses the ability to generate revenue from the sale of electricity. If the loss of revenue is significant, it may mean that the utility cannot recoup its fixed costs. If the utility cannot recoup its fixed costs, the utility may seek to adjust its rates upward to fully recoup its fixed costs, resulting in rate increases. In economic terms, these fixed costs are referred to as “sunk” costs. The fixed costs that would be recovered through rate increases are not caused by the event or investments themselves; they are caused by historical investments in supply-side resources that become fixed costs. In economic theory, sunk costs should not be considered when assessing future investments because they are incurred regardless of whether the future investment is undertaken. Instead, these impacts should be analyzed using rate and bill impact analyses. Rate impacts from lost revenues are caused by the need to recover fixed costs over fewer sales. Bill impacts account for rate impacts as well as changes in consumption.
32
Host Customer The resilience benefits may include the following host customer benefits:
Economic
• Avoiding Damages to Goods and Infrastructure: Investments in sustained electricity service can avoid loss of product and waste for critical business customers. For example, a food distribution center that maintains cooling in its refrigerators and freezers can avoid loss of revenue from food spoilage. Also, some investments create resilience benefits by reducing the likelihood that buildings on a customer’s property and equipment within these buildings will be damaged. For example, investments in microgrid infrastructure providing electricity during a prolonged outage allows for the continued operation of pumps and heating equipment. These investments can prevent pipes from freezing and bursting, thereby reducing damage to homes and businesses from potential flooding.
• Avoiding Lower Revenues from Lower Production and Fewer Sales of Goods and Services: Avoiding outages allows commercial and industrial customers to continue producing and selling goods and providing services.
• Reducing Emergency Staff Deployment Costs: Avoiding outages avoids the overtime costs associated with retaining staff to resolve on-site issues at commercial and industrial customer sites or at managed residential properties.
Public Health, Safety, and Security
• Reducing Medical and Insurance Costs: Grid resilience investments can reduce the public health, safety, and security impacts for people who live and work at host customer sites. For example, customers with electricity-dependent medical devices such as ventilators, insulin pumps, and wheelchairs may need to be hospitalized if these devices cannot function. Commercial customers may not have access to safety-related communications in an outage, which may make them more susceptible to workplace injuries.33 These issues may lead to increased costs from doctor and emergency room visits, medical procedures, and drug prescriptions for employees and residents.
• Avoiding Loss of Quality of Life: Reductions in health and safety risks can decrease instances of stress, injury, illness, and/or death.
Community The resilience benefits may include the following community benefits:
Economic
• Avoiding Damages to Goods and Infrastructure: Economic benefits accrue to the community when customers providing critical community products and services continue to operate during an extreme event. When a pharmacy loses electricity, medicines spoil due to a lack of refrigeration. Some investments create benefits by reducing the likelihood that critical facilities that can provide life-sustaining services to the broader community will suffer outages. For
33 To the extent that the expected cost of workplace injuries is covered by utility insurance payments or otherwise financially borne by the utility and passed on in costs to ratepayers, this should be treated as a utility system value.
33
example, a microgrid that keeps a coffee shop or restaurant up and running during a prolonged outage could avoid infrastructure damages to buildings that may occur as people loot and vandalize to secure food.
• Reducing Emergency Staff Deployment Costs: Enabling resilience at critical municipal, residential, and business customer sites can reduce the number of municipal staff resources and overtime hours required to address outage-related issues at these customer sites.
• Avoiding Departure of Customers Important to the Community: Certain businesses can be important for community functions. For example, in some communities, a single company employs many of the residents in that community and therefore is fundamental to the economic stability of the community. There may be a community benefit to investing in resilience for a large employer, so they do not move elsewhere. Also, residents may be more likely to remain in their community if their electricity service is reliable. When residents and businesses stay in communities, communities can maintain their tax base.
• Avoiding Lost Economic Development, Education, and Recreation Opportunities: During events, prices for goods and services can increase. When prices increase, people are spending more on products and services than they otherwise would have spent. This increase spending depletes the money that customers have available to spend in other ways. When impacted communities return to normalcy faster, they can stabilize pricing which reduces inefficient spending. A reduction in inefficient spending reduces lost economic opportunity, allowing individuals to once again direct their efforts and funds to support other community objectives, such as economic development, education, and recreation.
Public Health, Safety, and Security
• Reducing Medical and Insurance Costs: Resilience investments can reduce the public health, safety, and security impacts for the broader community by maintaining the availability of life-sustaining products and services. A microgrid that keeps a grocery store running during a prolonged outage could help avoid problems with hunger, starvation, and dehydration in the community. Electricity outages can also result in the failure of critical systems that rely on electricity to operate, such as water treatment and pumping, transportation, and communication systems. Keeping water treatment and pumping systems in the community running reduces health and safety issues associated with a lack of water or water contamination. Maintaining electricity for transportation and communication infrastructure, such as vehicle fueling stations and data centers, can reduce health, safety, and security issues by keeping fire, police, medical, and utility personnel who are operating in the community connected.
• Avoiding Loss of Quality of Life: During an extreme event, community centers use electricity to maintain hygiene for the broader community by dealing with human waste and providing potable water. They can also provide relief from extreme temperatures. Without these services, residents can suffer from stress, injury, illness, and/or death. Supporting law enforcement facilities enables these public servants to maintain order, which can also help avoid injuries or fatalities.
34
Society The resilience benefits may include the following societal benefits:
Economic
• Avoiding Damages to Goods and Infrastructure: If communities affected by a resilience event are more resilient, they may require less support from the broader society to restore normal life. This means that funds that might otherwise be spent on recovery can be spent on other societal goods, or not collected as taxes in the first place. Furthermore, resilient host customers have indirect economic benefits to society through the effect of supply chains. For example, a resilient host customer that produces a critical good which is a component for manufacturers outside the local community would constitute an indirect economic benefit.
• Avoiding Lower Revenues from Lower Production and Fewer Sales of Goods and Services: When companies stay in business, the federal government can maintain its tax base and operating budget. Federal government funding supports a variety of public benefits and services.
• Avoiding Lost Economic Development, Education, and Recreation Opportunities: During events, prices for goods and services can increase. When prices increase, people are spending more on products and services than they otherwise would have spent. This increase spending depletes the money that customers have available to spend in other ways. When impacted communities return to normalcy faster, they can stabilize pricing which reduces inefficient spending. A reduction in inefficient spending reduces lost economic opportunity, allowing individuals to once again direct their efforts and funds to support other objectives, such as economic development, education, and recreation.
Public Health, Safety, and Security
• Reducing Medical and Insurance Costs: An electricity outage in one location can result in blackouts that affect critical services on a broader scale. Certain equipment and grid locations are higher priority as the impacts of outages at those locations can trigger broader grid issues. For example, services for some systems such as water treatment and pumping, transportation, and communication infrastructure can extend well beyond the boundaries of a single municipality. The interruption of these life-sustaining services in one area can trigger medical and insurance costs in other areas.
• Avoiding Loss of Quality of Life: The cascading consequences of electricity outages can result in illness and deaths in communities both near and far. For example, when water treatment systems fail, sewage can be flow into lakes, rivers, and ponds and make people ill who consume the affected water, produce, meat, and fish.
4.4. Illustrative Example This example describes a hypothetical case in which resilience is not the only or primary reason for making the investment. A utility is considering implementing a battery on an exposed peninsula to avoid upgrades to the utilities’ transmission and distribution system. The battery can be encased in concrete to protect it from damages due to the increasing likelihood of a hurricane. We further

35
assume that with the concrete the battery can continue to operate during an extreme event, whereas without the concrete, the battery will need to be shut off.
The figure below illustrates conceptually a BCA for the investment in the concrete encased battery system. The first two purple columns (costs, benefits, and net benefits) do not include resilience costs and benefits. The battery helps improve system reliability on normal days. The cost of the battery is represented by the purple costs. The reliability benefits derived from the battery on normal days is represented by the purple benefits. The benefits minus the costs equal the net benefits without resilience in the first grey column.
The green segments atop the second two purple segments represent the resilience costs and benefits. The utilities’ investment in a concrete encasement for the battery is the resilience cost. The resilience benefits include reduced staff deployment costs, avoided energy infrastructure damages, and avoiding lost customer load. The combined benefits minus the combined costs equal the combined net benefits, with resilience, in the second grey column.
1. To start, examine the costs and benefits, not including those related to resilience.
• How do the total benefits compare to the total costs? (Are the net benefits positive, negative, or neutral?)
2. Next, examine the costs and benefits, including those related to resilience.
• How do the total benefits compare to the total costs? (Are the net benefits positive, negative, or neutral?)
• What proportion of the total costs and total benefits are resilience-related?
• Is the project attractive with the resilience costs and benefits included? If the project is attractive with the resilience costs and benefits included, can a more significant investment in resilience be supported? If the project is not attractive with the resilience costs and benefits included, are there any modifications or alternatives that can produce a more favorable result?

36
Figure 2. BCA With and Without Resilience Costs and Benefits
In this illustration, the benefits exceed the costs, with and without the resilience components. While the total costs increase 25 percent with the resilience component, the benefits increase as well and to a slightly greater degree. The resilience-related costs and benefits are not most of the costs or the benefits, but they nonetheless contribute to each.
As there are significant positive net benefits with the resilience component, it may make sense to redesign the project to maximize the net benefit including resilience. For example, it may be worth exploring increasing the size of the battery so it can provide more support during resilience events. The incremental cost to upsize the battery can be added to the resilience cost. The resilience benefits, namely reduced staff deployment costs and avoiding lost customer load, would be higher as well as more customers could be served by the battery and/or the battery could last longer during the outage.
Without Resilience
With Resilience
Costs Benefits Net Benefits Costs Benefits Net Benefits
Without Resilience With Resilience
Impa
cts
(pre
sent
val
ue $
)
Important Note
The federal standard for BCA (EO 12866) requires that benefits justify, not outweigh, the costs. For example, an investment can be implemented even when the costs exceed the benefits if the investment represents the least costly investment to achieve a given level of benefit.

37
5. OTHER CONSIDERATIONS There are several other considerations that are relevant to BCA for grid resilience investments. These include probability of occurrence, temporal and locational variability, and interactive effects. A discussion of each consideration follows.
5.1. Probability of Occurrence By nature, extreme events have a low probability of occurring, but when they happen, they can result in high consequences. The rare occurrence of these types of events complicates utility planning as it is uncertain whether the benefits of resilience investments will be realized within a near-term planning horizon and if so, when. This is akin to purchasing insurance, where the subscriber knows in advance the extreme event being insured against is unlikely to occur. Additionally, the likelihood that certain jurisdictions will experience the consequence of certain types of extreme events is changing over time. For example, the strength and frequency of hurricanes may be increasing due to climate change.
Regulators can factor the probability of extreme event occurrence in their jurisdiction into decision-making and into utility performance projections. A national standard approach for calculating this metric could be developed, potentially by applying FEMA’s National Risk Index and a Probabilistic Risk Assessment (PRA) framework.34,35 This standard would be especially helpful for regulators to compare the risk profiles of different types of threats faced by individual communities within a larger utility service territory. This data can also inform a forecast for a probability distribution or histogram of resilience-related costs and benefits that can be integrated into BCA for investments made primarily to improve resilience, and then modified based on historical trends and projections to capture anticipated changes.
Planning processes can better consider the probability of extreme event occurrence by integrating a probability factor into BCA in the form of expected values or other summary metrics of the costs and benefits probability distribution.36 The full costs of the investments should be maintained in the BCA. However, the benefits can be normalized by using a probability factor to calculate the probability weighted benefits. Given that the probability of extreme events occurring is very low, the value of the probability weighted benefits will typically be significantly lower than those that are not weighted. However, regulators may apply a separate weighting factor to increase this value if resilience is a higher priority than other goals.
34 Federal Emergency Management Agency. National Risk Index. 2020. Available at: https://www.fema.gov/flood-maps/products-tools/national-risk-index/overview 35 The PRA approach has been applied to regulation of the national nuclear energy enterprise through the Nuclear Regulatory Commission. See: https://www.nrc.gov/about-nrc/regulatory/risk-informed/pra.html 36 Within the PRA approach, it is important to be explicit about probability distributions. To this effect, taking the simple approach of representing a probabilistic threat – such as flooding – using a single design basis threat will likely be misleading. It is recommended, therefore, that analysts use more than one design basis threat to characterize each threat type (for instance, 50-year, 100-year, and 500-year flood events), and attempt to calculate summary metrics each threat’s consequence distribution such as value at risk in addition to expected value.
38
.
5.2. Temporal and Locational Variability The costs and benefits can vary significantly depending upon when and where extreme events occur and how grid resilience investments function during these events. A BCA can capture this temporal and locational variability.
It can be difficult to predict when certain events may occur, and the timeframe associated with restoration and recovery. A forest fire is more likely during summer seasons and in years where there is a drought, and the increased value of investments during these timeframes should be accounted for. It can also be difficult to predict when the investment will operate during and after an extreme event and how much value to ascribe to its operation. Some resilience solutions provide more relief during peak hours and seasons when extreme temperatures are more likely. Additionally, a previous peak with high electricity demand may no longer be the peak after the event if load changes (buildings do not get rebuilt) or the mix of customers in the jurisdiction changes (if some businesses and residents choose to relocate). Some utilities calculate avoided costs for peak and non-peak periods for the summer and winter seasons. To understand temporal variability more fully, utilities can calculate avoided cost and operational timing at more granular (at least hourly) levels.
It can also be difficult to predict where extreme events will strike. While a forest fire may be more likely in wooded areas suffering from drought that were not recently burned by forest fires, forest fires can be ignited inadvertently by careless people or mismanaged electrical equipment. The value of investments can be better estimated with greater precision regarding location. It can also be difficult to identify where the investment should be located to provide the most value. Resilience investments provide more relief in geographies or for customers of higher consequence. Geographies and customers of higher consequence can be characterized as customers who are critical or particularly vulnerable. The value of the investments may be greater if the investments are targeted to those geographies and customers that are most likely to be affected. Additionally, some resilience investments cannot be implemented in certain areas. For example, undergrounding of transmission and distribution wires may not be an option in areas where these systems cross-protected or highly-developed land. Lastly, some investments are immobile while other resilience investments can be more easily moved in preparation for and during extreme events. For example, battery storage and some transmission and distribution system equipment can be quickly transported by truck to different locations as landfall projections for storms are revised. Some utilities are
Important Note
Probability factors for many extreme events might be so low that the benefits may be negligible when these factors are applied. In these situations, regulators and utilities can apply a separate weighting factor to reflect the importance of the resilience investment, considering the extent of the potential consequences and the desire to avoid them. This is analogous to the way homeowners consider the insurance value of resilience in their investment decisions. The likelihood of a fire may be low, but many people purchase fire insurance anyways.
39
moving towards differentiating avoided costs by customer class and geographic region. The order from New York’s REV proceeding provides broad guidance on valuing these components, indicating that avoided outage costs “will need to be determined by customer class and geographic region,” and instructing the investor-owned utilities to provide jurisdiction-specific values where possible in their respective handbooks.37 To understand locational variability more fully, utilities can segment their service territories at more granular levels (by level of consequence).
Monte Carlo simulations can be run using these more disaggregated temporal and locational avoided cost data to generate ranges of potential values. Placeholder data can be used for planning purposes in the interim, while these more detailed analyses are in development. The Modernizing the Energy Delivery System for Increased Sustainability (MEDSIS) proceeding38 was initiated in 2018 to tackle implementation of the District of Columbia’s ambitious climate law.39 In its vision statement, adopted through Public Utility Commission order, MEDSIS prioritized distribution system resilience.40 The importance of valuing resilience benefits was discussed in the microgrid working group. There, some stakeholders suggested that a tariff for microgrids could be developed that included compensation for resiliency benefits.41 To this end, the Department of Energy and Environment (DOEE) proposed a $0.01 per kWh resilience “adder” for qualifying projects, intended as a temporary stand-in for the true “locational and time-dependent” value of resilience, which would be determined subsequently. While DOEE’s recommendation was not adopted by the Public Utility Commission, it provides an interesting example for consideration by jurisdictions.42
5.3. Interactive Effects The implementation of some investments with resilience benefits can affect the implementation, performance, costs, and benefits of other investments. For example, implementation of customer-side solutions such as microgrids can affect the need for utility-side solutions such as investments in transmission and distribution system equipment. These inter-solution effects are not typically captured when investments are assessed in isolation. The integration of planning processes that consider resilience investments with planning processes that consider other types of investments can provide utilities and regulators the opportunity to identify and account for these interactions in BCA. One way to account for interactive effects of grid modernization components is to combine them in logical bundles to assess how they provide benefits when operating together. Packaging measures together can help utilities and regulators avoid unnecessary investments in multiple solutions with duplicative benefits. Packaging measures together can also result in benefits for enough customers that ratepayer funding becomes justified.
37 Case 14-M-0101. Order. Appendix C, pg. 14. 38 The successor to MEDSIS is PowerPath DC. 39 CleanEnergy DC Omnibus Amendment Act of 2018. 40 District of Columbia’s MEDSIS proceeding. FC 1130, Order 19275, p. A-4. 41 MEDSIS Final Report, pp 202-213. 42 MEDSIS Final Report, p 212.

40
6. METRICS AND DATA NEEDS BCA is a bottom-up approach which is constructed by aggregating discrete, non-overlapping components of costs and benefits. To construct this calculation, the components of costs and benefits need to be identified and metrics for each component defined. Regulators can use the guidance presented in this report to identify the components – the resilience costs and benefits -- pertinent to their JST. Regulators can then identify the metrics that are used in the calculation of each component. Regulators may also identify additional metrics that are not necessary for BCA but are also of interest.
Establishing performance metrics for resilience is most useful for enabling quantification of benefits. In this section, we provide an illustrative set of metrics for each resilience benefit identified in Section 4.3. In the table below, we provide one example for each benefit. We acknowledge that these examples are simplified representations of the metrics and calculations. Utilities and regulators in each jurisdiction will need to select the appropriate benefits for quantification, define the metrics that underly the quantification, and construct the formulas that combine the metrics to form each benefit. The benefits and metrics can be different for different jurisdictions and the metrics can be different than the metrics shown here. It may not always be possible to monetize benefits as described below and regulators should be ready to consider non-monetized benefits as well. On the other hand, some consistency may be useful so the selection of benefits and metrics should be done with careful consideration.
In this section, we also suggest a simple construct for calculating resilience benefits. In the table below, we include two types of metrics for each resilience benefit component: one for the scope of the impact and one for the value of each impact. The scope of the impact can be measured by the number of or counts of items damaged, people or businesses affected, or lost opportunities. The value of each impact is represented in net present value dollars of the avoided cost per item damaged, person or business affected, or opportunity lost. The probability of occurrence of the event can also be accounted for, as discussed in Section 5.1.
The steps to calculate a resilience BCA using these inputs follows:
1. Multiply the scope of each benefit by the net present value of each benefit.
2. Calculate the net present value of each of the costs.
3. Sum all the benefits. Multiply the sum of all the benefits by the probability of event occurrence.43
4. Sum all the costs.
5. Divide the total probability-adjusted benefits by the total costs.
43 Or another appropriate factor representing insurance value.
BCA is a bottom-up approach which is constructed by aggregating discrete, non-overlapping components of costs and benefits.

41
The formula follows, where:
BS = benefit scope
BV = benefit value
TB = total benefits
CV = cost value
TC = total costs
POE = probability of event
First:
𝐵𝐵𝐵𝐵1 𝑥𝑥 𝑁𝑁𝑁𝑁𝑁𝑁(𝐵𝐵𝑁𝑁1) = 𝑇𝑇𝐵𝐵1
𝐵𝐵𝐵𝐵2 𝑥𝑥 𝑁𝑁𝑁𝑁𝑁𝑁(𝐵𝐵𝑁𝑁2) = 𝑇𝑇𝐵𝐵2
𝐵𝐵𝐵𝐵3 𝑥𝑥 𝑁𝑁𝑁𝑁𝑁𝑁(𝐵𝐵𝑁𝑁3) = 𝑇𝑇𝐵𝐵3
Next:
𝑁𝑁𝑁𝑁𝑁𝑁(𝐶𝐶𝑁𝑁1) = 𝑇𝑇𝐶𝐶1
𝑁𝑁𝑁𝑁𝑁𝑁(𝐶𝐶𝑁𝑁2) = 𝑇𝑇𝐶𝐶2
𝑁𝑁𝑁𝑁𝑁𝑁(𝐶𝐶𝑁𝑁3) = 𝑇𝑇𝐶𝐶3
Then:
∑(𝑇𝑇𝐵𝐵1,𝑇𝑇𝐵𝐵2,𝑇𝑇𝐵𝐵3, … ) 𝑥𝑥 𝑁𝑁𝑃𝑃𝑃𝑃∑(𝑇𝑇𝐶𝐶1,𝑇𝑇𝐶𝐶2,𝑇𝑇𝐶𝐶3, … )
Resilience performance metrics provide a way for utilities to collect data from various sources in one place. We suggest that regulators direct utilities to take the lead on collecting and organizing resilience data by establishing resilience performance metrics. To provide further support to regulators and utilities on this effort, Sandia National Laboratories’ report titled Performance Metrics to Evaluate Utility Resilience Investments and the accompanying Excel-based reporting tools define performance metrics for resilience.44 Metrics that can facilitate BCA are included in the tables.
Utilities have access to a portion, but not all, of this data. In the table below, we suggest potential sources for the illustrative metrics. For example, utilities can provide data to support metrics on the impacts on utility costs and revenues, such as the scope and value metrics within the Generation,
44 Sandia National Laboratories. 2021. Performance Metrics to Evaluate Utility Resilience Investment.

42
Transmission & Distribution: Energy and Capacity benefit type. Communities can provide data to support metrics on the impacts on municipal government resources, such as the scope and value metrics within the Reducing Emergency Staff Deployment Costs benefit. The federal government can provide data to support metrics on the impacts on health, such as the scope and value metrics within the avoiding loss of quality-of-life benefit. Universities and other research institutions can assist in developing metrics and collecting or modeling data on community and societal impacts that have not yet been quantified, including value metrics such as Avoided Lost Economic Development, Education, and Recreation Opportunities and those within the Reducing Medical and Insurance Costs benefit. Other stakeholders, such as organizations supporting vulnerable customers, can work with communities to develop the components of the scope and value metrics within the Maintaining Power Supply to Critical Customers benefit that relate to vulnerable residential customers. Utilities can reach out to these other sources to gather these components of the data.
In some cases, these data are available and in other cases additional modeling and analysis may be needed to produce the data. In producing the performance metrics, utilities can start by gathering historical actuals for resilience events in the recent past.

43
Table 6. Illustrative Resilience Benefit Metrics Benefit Type Benefits Metric
Type Illustrative Metric Name Potential Source(s)
Gen
erat
ion,
Tra
nsm
issi
on &
D
istri
butio
n: E
nerg
y an
d C
apac
ity
Reducing Emergency Staff Deployment Costs Scope Count of affected employees
Utilities Value
Avoided cost per affected employee
Avoiding Energy Infrastructure Damages Scope Count of damaged equipment
Value Avoided cost per damaged piece of equipment
Non
-Ene
rgy:
Eco
nom
ic45
Avoiding Damages to Goods and Infrastructure
Scope Count of items damaged
Communities, Universities, Other Research Institutions, and Other Stakeholders
Value Avoided cost per damaged item
Avoiding Lower Revenues from Lower Production and Fewer Sales of Goods and Services
Scope Count of items not produced and/or sold
Value
Revenue per item not produced and/or sold
Changes in gross domestic product
Reducing Emergency Staff Deployment Costs
Scope Count of affected employees
Value Avoided cost per affected employee
Avoiding Departure of Customers Important to the Community
Scope Count of departed customers
Value GDP per departed customer
Avoided Lost Economic Development, Education, and Recreation Opportunities
Scope Count of opportunities
Value GDP generated per opportunity
45 Many of the economic benefits and some of the public health, safety, and security benefits are often included in the calculation of the Value of Lost Load (VOLL). This technique measures willingness to pay for reductions in electrical service interruptions.

44
Benefit Type Benefits Metric
Type Illustrative Metric Name Potential Source(s)
Non
-Ene
rgy:
Pub
lic H
ealth
, Saf
ety,
and
Sec
urity
Reducing Medical and Insurance Costs Scope
Count of individuals requiring medical treatment
Federal government, Universities, Other Research Institutions, and Other Stakeholders
Value Avoided medical costs per individual requiring treatment
Scope Count of individuals with increased insurance costs
Value
Avoided cost of increased insurance premiums per individual requiring treatment
Avoiding Loss of Quality of Life Scope
Count of injured individuals
Quality adjusted life years
Value Cost of reduced quality of life per injury
Scope Count of deaths
Value Value of a statistical life
45
7. NEXT STEPS FOR IMPLEMENTATION OF BCA FOR RESILIENCE INVESTMENTS
Regulators, utilities, communities, and other stakeholders can work together to advance BCA practices for investments that can achieve grid resilience, among other goals. In this section, we identify several next steps and leads for each step. Each entity has a role to play.
Ideally, all steps should be pursued. However, it is important to note that these steps can be pursued in any order and can proceed concurrently.
The figure on the following page summarizes the next steps for implementation of BCA for resilience investments. With these improvements to BCA in place, utilities and regulators can better understand the costs and benefits of grid resilience investments. Utilities can present a range of options for regulatory consideration and regulators can evaluate these options. Proactive integration of grid resilience investments into existing regulatory processes and practices can increase the capacity of jurisdictions to respond to and recover from the consequences of extreme events.

46
Figure 3. Summary of Next Steps for Implementation of BCA for Resilience Inclusive Investments

47
Below we provide further detail associated with each step.
1. Regulators can:
• direct utilities to undertake BCA of investments, including resilience investments, in all relevant proceedings. BCA is particularly well suited to compare the costs and benefits for a wide range of solutions, including resilience solutions. Utility regulators can direct utilities to conduct BCAs for all proposals in all proceedings, including integrated resource planning, distributed system integrated planning, grid modernization, non-wires alternatives, energy efficiency, and renewable energy proceedings. By guiding utilities to provide BCA for all proposals in all proceedings, utility regulators can compare, select, and prioritize investments, including resilience investments, for implementation. Ideally, this is done before significant investments in resilience are made.
• develop standardized BCA principles and practices that assess grid investments comprehensively and consistently for their jurisdiction.
First, regulators can establish a set of fundamental principles that serve as the foundation for conducting BCA. As part of the developing standard practices for conducting BCA, regulators can work with utilities, communities, and other stakeholders to identify policy priorities.
Second, regulators can construct a JST. In jurisdictions where resilience is a policy priority, resilience costs and benefits need to be included in BCA.
Third, regulators can discuss approaches for accounting for non-monetized benefits. Some resilience benefits may not be able to be monetized and included as an explicit dollar value benefit in a BCA. Regulators can define approaches for examining the impacts of these benefits that they are comfortable with applying.
In addition, regulators can consider the processes and proceedings that warrant a resilience-inclusive BCA. In the Sandia National Laboratories report titled Regulatory Mechanisms to Align Utility Investments with Resilience46, we identify various types of proceedings where grid resilience investments may be contemplated.
• direct utilities to take the lead on collecting and organizing resilience data by establishing resilience performance metrics. We recommend that regulators establish resilience performance metrics for utilities and require utilities to track and report this information. Utility resilience performance metrics provide a way for utilities collect historical data from various sources in one place. By establishing utility resilience performance metrics, regulators can signal to utilities that they are to be the central repository for this data.
46 Sandia National Laboratories. 2021. Regulatory Mechanisms to Align Utility Investments with Resilience.
48
2. Utilities can:
• develop a full inventory of costs and benefits pertinent to resilience in investment proposals. This inventory should be consistent with the JST identified by their regulator. Naming and defining resilience costs and benefits can be helpful for regulators and other stakeholders.
• assess resilience costs and benefits, especially those that are most impactful. This information can be used to prioritize knowledge gaps in the most impactful types of costs and benefits to be addressed by further research.
• act as a central repository for the data and lead the reporting of resilience performance metrics. Utilities can take the lead on collecting the data, identifying gaps, and reaching out to communities and other stakeholders to fill the gaps.
3. Communities and other stakeholders can support utilities by providing resilience-related data that utilities cannot readily access. As utilities work with communities and other stakeholders work together to assemble the key components, the data gaps can become more apparent. In many cases, resilience data exist, but utilities do not currently have access. Communities and other stakeholders (such as the federal government and national research institutions) can be a source for information that utilities do not have that appear in this data set. Utilities can reach out to these sources to gather this data. Utilities can also be a source of data for communities who want to apply an aligned resilience-inclusive BCA to their own investments.
4. Utilities, communities, and other stakeholders, such as research institutions, can conduct research and analysis to address gaps in data needed to understand costs and benefits of grid resilience investments. There may be significant gaps in resilience impacts data, particularly for resilience benefits. For example, data on the probability of extreme events, variability of impacts temporally and by location, and the interactive effects is not readily available. Data for certain threats, especially threats that are human-made such as cyber-related threats or threats that are intensified by climate change such as hurricanes, may be more difficult to develop. Utilities may be able to work with communities to address some of these gaps; however, regional and national resources and coordination are likely also needed. Larger scale studies featuring results that can be disaggregated at regional or community levels can provide a credible range of values for input into BCA.
Proactive integration of grid resilience investments into existing regulatory processes and practices can increase the capacity of jurisdictions to respond to and recover from the consequences of extreme events.
49
8. REFERENCES California Public Utilities Commission (CPUC). Decision 16-12-036 and R.14-10-003. Competitive Solicitation Framework Working Case 14-M-0101. Proceeding on Motion of the Commission in Regard to New York’s Reforming the Energy Vision. Order Establishing Benefit Cost Analysis Framework. January 21, 2016. Congressional Research Service. Electric Reliability and Power System Resilience. May 2, 2018. Page 7. https://www.everycrsreport.com/files/20180502_IN10895_b74bbaf13d1c87cf3bcd377022a1596667834782.pdf CPUC. Rulemaking 14-10-003. Order Instituting Rulemaking to Create a Consistent Regulatory Framework for the Guidance, Planning and Evaluation of Integrated Distributed Energy Resources. Administrative Law Judge’s Ruling Confirming Use of Recommendations from Rulemaking 14-08-013 and Introducing Staff Proposal for Major Updates to Avoided Cost Calculator. November 20, 2019. https://docs.cpuc.ca.gov/PublishedDocs/Efile/G000/M319/K898/319898332.PDF Department of Energy. New GMLC Lab Call Awards for Resilient Distribution Systems. September 4, 2017. https://www.energy.gov/articles/new-gmlc-lab-call-awards-resilient-distribution-systems Federal Emergency Management Agency. National Risk Index. 2020. https://www.fema.gov/flood-maps/products-tools/national-risk-index/overview NARUC. 2019. The Value of Resilience for Distributed Energy Resources: An Overview of Current Analytical Practices. National Energy Screening Project. 2020. National Standard Practice Manual for Benefit-Cost Analysis of Distributed Energy Resources. Edition 1. https://www.nationalenergyscreeningproject.org/national-standard-practice-manual/ National Energy Screening Project. 2020. National Standard Practice Manual for Benefit-Cost Analysis of Distributed Energy Resources. https://www.nationalenergyscreeningproject.org/national-standard-practice-manual/ National Standard Practice Manual for Benefit-Cost Analysis of Distributed Energy Resources. August 2020. Prepared by the National Energy Screening Project. https://www.nationalenergyscreeningproject.org/national-standard-practice-manual/ New York Public Service Commission, Order Establishing the Benefit Cost Analysis Framework, Case 14-M-0101 - Proceeding on Motion of the Commission in Regard to Reforming the Energy Vision, January 21, 2016, at 21-22. Pacific Northwest National Laboratory. 2016. Valuation of Electric Power System Services and Technologies, p. 6.2.
50
Sanstad, Alan H. Ph.D., Regional Economic Modeling of Electricity Supply Disruptions: A Review and Recommendations for Research. LBNL-1004426. LBNL. 2016. Sandia National Laboratories. 2021. Performance Metrics to Evaluate Utility Resilience Investment. Sandia National Laboratories. 2021. Regulatory Mechanisms to Align Utility Investments with Resilience. Sandia National Laboratories. 2021. The Resilience Planning Landscape for Communities and Electric Utilities. The Value of Resilience for Distributed Energy Resources: An Overview of Current Analytical Practices. April 2019. National Association of Regulatory Utility Commissioners. p. 4. https://pubs.naruc.org/pub/531AD059-9CC0-BAF6-127B-99BCB5F02198 Unel, Burcin, PhD and Zevin, Avi. 2018. Toward Resilience: Defining, Measuring, and Monetizing Resilience in the Electricity System. Institute for Policy Integrity. New York University School of Law, p. i. U.S. EPA. 2018. User’s Manual for the Co-Benefits Risk Assessment Health Impacts Screening and Mapping Tool (COBRA). Version 3.2. Appendix F. U.S. Office of the Press Secretary. Presidential Policy Directive/PPD-21 -- Critical Infrastructure Security and Resilience. February 12, 2013. https://obamawhitehouse.archives.gov/the-press-office/2013/02/12/presidential-policy-directive-critical-infrastructure-security-and-resil U.S. Office of the Press Secretary. Presidential Policy Directive/PPD-21 -- Critical Infrastructure Security and Resilience. February 12, 2013. https://obamawhitehouse.archives.gov/the-press-office/2013/02/12/presidential-policy-directive-critical-infrastructure-security-and-resil. Wakefield, M. 2012. Guidebook for Cost/Benefit Analysis of Smart Grid Demonstration Projects, Revision 1, Measuring Impacts and Monetizing Benefits, 1025734, Technical Update. Electrical Power Research Institute. https://www.energy.gov/sites/prod/files/2017/01/f34/Guidebook-Cost-Benefit-Analysis-Smart-Grid-Demonstration-Projects.pdf.
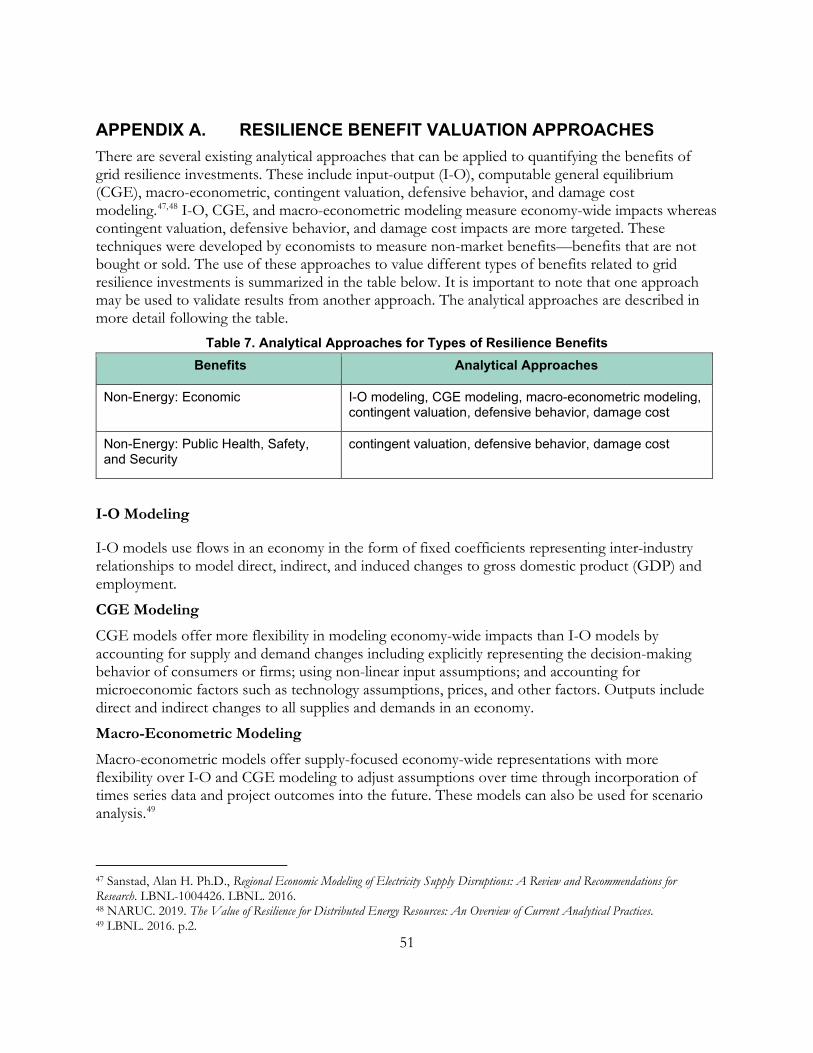
51
APPENDIX A. RESILIENCE BENEFIT VALUATION APPROACHES There are several existing analytical approaches that can be applied to quantifying the benefits of grid resilience investments. These include input-output (I-O), computable general equilibrium (CGE), macro-econometric, contingent valuation, defensive behavior, and damage cost modeling.47,48 I-O, CGE, and macro-econometric modeling measure economy-wide impacts whereas contingent valuation, defensive behavior, and damage cost impacts are more targeted. These techniques were developed by economists to measure non-market benefits—benefits that are not bought or sold. The use of these approaches to value different types of benefits related to grid resilience investments is summarized in the table below. It is important to note that one approach may be used to validate results from another approach. The analytical approaches are described in more detail following the table.
Table 7. Analytical Approaches for Types of Resilience Benefits Benefits Analytical Approaches
Non-Energy: Economic I-O modeling, CGE modeling, macro-econometric modeling, contingent valuation, defensive behavior, damage cost
Non-Energy: Public Health, Safety, and Security
contingent valuation, defensive behavior, damage cost
I-O Modeling
I-O models use flows in an economy in the form of fixed coefficients representing inter-industry relationships to model direct, indirect, and induced changes to gross domestic product (GDP) and employment.
CGE Modeling
CGE models offer more flexibility in modeling economy-wide impacts than I-O models by accounting for supply and demand changes including explicitly representing the decision-making behavior of consumers or firms; using non-linear input assumptions; and accounting for microeconomic factors such as technology assumptions, prices, and other factors. Outputs include direct and indirect changes to all supplies and demands in an economy.
Macro-Econometric Modeling
Macro-econometric models offer supply-focused economy-wide representations with more flexibility over I-O and CGE modeling to adjust assumptions over time through incorporation of times series data and project outcomes into the future. These models can also be used for scenario analysis.49
47 Sanstad, Alan H. Ph.D., Regional Economic Modeling of Electricity Supply Disruptions: A Review and Recommendations for Research. LBNL-1004426. LBNL. 2016. 48 NARUC. 2019. The Value of Resilience for Distributed Energy Resources: An Overview of Current Analytical Practices. 49 LBNL. 2016. p.2.
52
Contingent Valuation
The contingent valuation approach uses surveys and studies to elicit consumers’ willingness to pay for greater service or to avoid erosion of quality of life. Methods that assess revealed preferences, rather than stated preferences, include:
• Value of Lost Load (VoLL): This technique measures willingness to pay for reductions in electrical service interruptions.
• Value of a Statistical Life (VSL): This technique measures willingness to pay for reductions in the risk of premature death.50
• Value of Time: This technique calculates the monetary value of a person’s time spent on non-discretionary tasks, such as time spent meeting basic needs.
Defensive Behavior
Defensive behavior methods identify the amount that customers have paid to avoid the consequences of an event, such as:
• The costs of purchasing and maintaining a back-up generator; • The customer cost of participating in a utility-administered program to improve resilience; and • The cost of insurance products, such as medical, flood or fire. Damage Cost Damage cost methods calculate the actual costs experienced during an event, such as:
• The cost to repair or replace utility or community infrastructure; • The cost of medical treatment, which may include hospitalization, medication, and surgery; and • Forgone wages due to illness or injury.51
50 U.S. Environmental Protection Agency. 2010. Valuing Mortality Risk Reductions for Environmental Policy: A White Paper. p. 3. 51 U.S. EPA. 2018. User’s Manual for the Co-Benefits Risk Assessment Health Impacts Screening and Mapping Tool (COBRA). Version 3.2. Appendix F.
53
APPENDIX B. BCA TESTS IN THE CALIFORNIA STANDARD PRACTICE MANUAL
In this section, we provide a summary of the five BCA tests identified in the CaSPM. For more detailed information, please see Appendix E of the NSPM for DERs.52 Program Administrator Cost Test
The test that reflects the program administrator or utility system perspective is referred to as the Program Administrator Cost Test or PAC. The PAC includes all benefits and costs that affect the operation of the utility system and the provision of electric and gas services to customers.
Participant Cost Test
The test that reflects a utility program participant or host customer perspective is the Participant Cost Test or PCT. This test includes all impacts on the program participants, but no other impacts. The PCT is not appropriate for assessing the value of utility system resources. However, the PCT can have value for the purpose of informing utility program design, including the level of financial incentives to offer prospective participants and/or the level of energy bill impact on participants. Total Resource Cost Test
The test that reflects a combination of the program administrator and participant perspectives is the Total Resource Cost Test or TRC. This test includes all impacts of the PAC and PCT. Rate Impact Measure Test
The test that includes all the costs and benefits of the PAC test, plus estimates of the utility lost revenues. This test is designed to address rate impacts and therefore answers fundamentally different questions than does a BCA. Societal Cost Test
The test that reflects a societal perspective is the Societal Cost Test or SCT. This test includes the program administrator, participant, community (if it is a participant) and societal perspectives. This test includes the impacts of the TRC test, plus the additional impacts on society.
52 National Energy Screening Project. 2020. National Standard Practice Manual for Benefit-Cost Analysis of Distributed Energy Resources. Edition 1. Available at: https://www.nationalenergyscreeningproject.org/national-standard-practice-manual/.

54
This page left blank
55
DISTRIBUTION Email—Internal
Name Org. Sandia Email Address
Robert Broderick 8812 [email protected]
Summer Ferreira 8812 [email protected]
Brooke Marshall Garcia 8812 [email protected]
Robert Jeffers 8812 [email protected]
Katherine Jones 8723 [email protected]
Technical Library 01177 [email protected]
Email—External (encrypt for OUO)
Name Company Email Address Company Name
Gilbert Bindewald [email protected] U.S. Department of Energy
Mercy Demenno [email protected]
Bosque Advisors
Jennifer Kallay [email protected] Synapse Energy Economics
Stephen Walls [email protected] U.S. Department of Energy
Guohui Yuan [email protected] U.S. Department of Energy

56
This page left blank
Sandia National Laboratories is a multimission laboratory managed and operated by National Technology & Engineering Solutions of Sandia LLC, a wholly owned subsidiary of Honeywell International Inc. for the U.S. Department of Energy’s National Nuclear Security Administration under contract DE-NA0003525.