Embed Size (px)
Citation preview
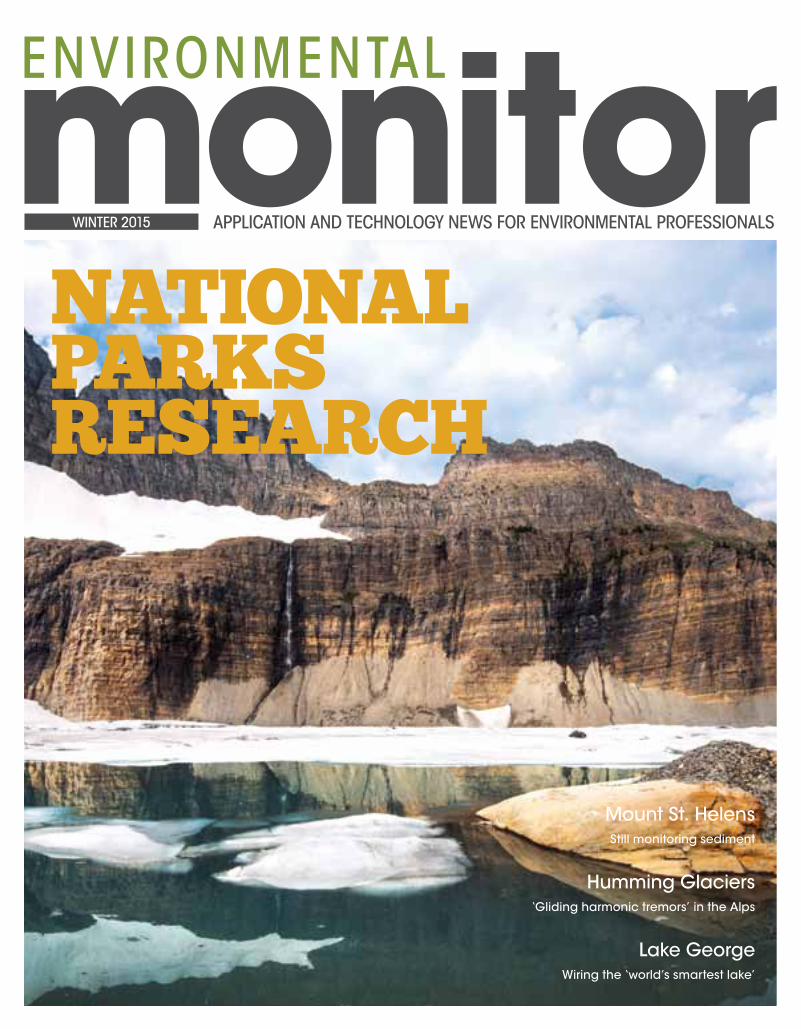
WINTER 2015 APPLICATION AND TECHNOLOGY NEWS FOR ENVIRONMENTAL PROFESSIONALS
Mount St. HelensStill monitoring sediment
Humming Glaciers‘Gliding harmonic tremors’ in the Alps
Lake GeorgeWiring the ‘world’s smartest lake’
NatioNalparks rEsEarCH

46
WELCOME...Welcome to the Winter 2015 edition of the Environmental Monitor, a quarterly collection of the best of our online news publication. This issue we have a collection of stories of research of human impacts to some of the last, best places in the United States. We profile projects in five national parks, from Yosemite to the Everglades, covering environmental issues including wildfires, climate change, air pollution and and restoring natural flow regimes.
Beyond the parks, we also hear from two scientists who are still monitoring sediment in the Toutle River decades after the 1980 Mount St. Helens eruption displaced 3 billion cubic yards of sand and gravel. From the Saskatchewan prairie, we have a story of a new data buoy that could help scientists and treatment plant operators solve the puzzle of skinny, shallow and bloom-prone Buffalo Pound Lake.
Located in Fairborn, Ohio, Fondriest Environmental is the trusted partner you can turn to for help with environmental monitoring projects. We can assist in everything from planning and monitoring to systems integration, equipment calibration and even staff training. Our applications engineers assemble, integrate, and calibrate all equipment – when you get it, it’s ready to use. Our specialists have years of experience developing and deploying remote systems and working with leading suppliers such as YSI, Hach, Thermo Scientific, In-Situ, Solinst, NexSens, and many more.
IN THE NEXT EDITIONNiagara Region Public Health’s data buoys in lakes Ontario and Erie help predict water quality, ensur-ing beaches are safe for swimming. tel: 888.426.2151
fax: [email protected]
Fondriest Environmental, Inc.2091 Exchange CourtFairborn, OH 45324
STAFFSteve Fondriest, [email protected]
Paul Nieberding, General [email protected]
Jeff Gillies, [email protected]
Daniel Kelly, Staff [email protected]
Alex Card, Contributing [email protected]
Charity Smalls, Contributing [email protected]
Lori Balster, Contributing [email protected]
Audrey Carson, Contributing [email protected]
Nate Christopher, Graphic [email protected]
Mike Voellmecke, Applications [email protected]
Tyler Fondriest, Mechanical [email protected]
Web Exclusives
In the News
Featured Photo
Environmental Education
Mount St. Helens Sediment
Conservation Drones
Product Innovation: DL100
National Parks Introduction
Sequoia Lake Temps
Yosemite Rim Fire
Rocky Mountain Nitrate
Glacier’s Disappearing Stonefly
Everglades Flow Experiment
Unexploded Ordnance
Buffalo Pound Blooms
Humming Glaciers
Polar Ice Infographic
Colorado River Pulse
Lake George
Monitoring Gear
Monitoring with Mariners
Underwater Camera
High-Tech Volunteers
In the Great Lakes
Wetland Methane Sources
Industry Profile
New Zealand Buoy
New Technology
Crossword Puzzle
0304060810121516171820222426283234363840424446485152535456
CONTENTSENVIRONMENTAL MONITOR | WINTER 2015
4228
17
12
26
fondriest.com discount code: EM1502
fondriest.comF O N D R I E S T environmental monitoring products
Cov
er P
ho
to:
Tim
Ra
ins
/ N
atio
na
l Pa
rk S
erv
ice
32
Scan to go to the iTunesApp Store
iOS Appfor iPhone and iPad
Download it for FREE
Pho
to: (
top
) Jü
rgen
Kes
selm
eier
/ M
ax
Pla
nck
Inst
itute
for C
hem
istr
y; (
cen
ter)
Bre
nd
an
Ph
ilip
/ U
niv
ersi
ty o
f Wa
shin
gto
n; (
bo
ttom
) Et
ha
n G
utm
an
n /
NC
AR
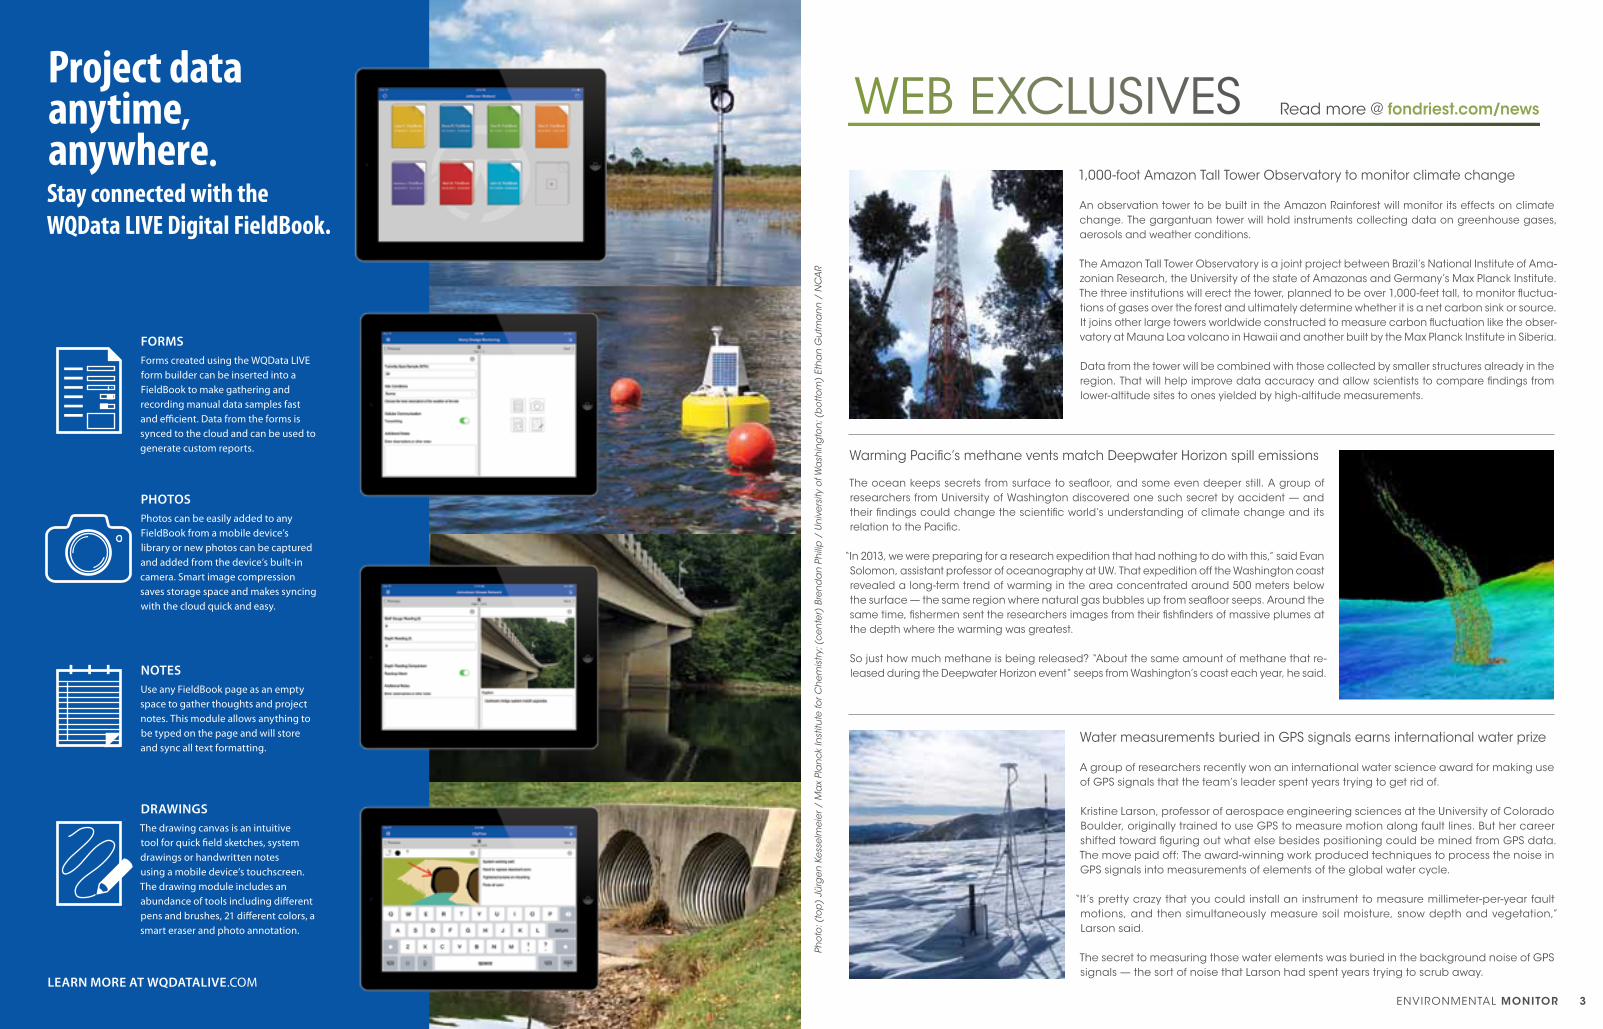
1,000-foot Amazon Tall Tower Observatory to monitor climate change
An observation tower to be built in the Amazon Rainforest will monitor its effects on climate change. The gargantuan tower will hold instruments collecting data on greenhouse gases, aerosols and weather conditions.
The Amazon Tall Tower Observatory is a joint project between Brazil’s National Institute of Ama-zonian Research, the University of the state of Amazonas and Germany’s Max Planck Institute. The three institutions will erect the tower, planned to be over 1,000-feet tall, to monitor fluctua-tions of gases over the forest and ultimately determine whether it is a net carbon sink or source. It joins other large towers worldwide constructed to measure carbon fluctuation like the obser-vatory at Mauna Loa volcano in Hawaii and another built by the Max Planck Institute in Siberia.
Data from the tower will be combined with those collected by smaller structures already in the region. That will help improve data accuracy and allow scientists to compare findings from lower-altitude sites to ones yielded by high-altitude measurements.
Water measurements buried in GPS signals earns international water prize
A group of researchers recently won an international water science award for making use of GPS signals that the team’s leader spent years trying to get rid of.
Kristine Larson, professor of aerospace engineering sciences at the University of Colorado Boulder, originally trained to use GPS to measure motion along fault lines. But her career shifted toward figuring out what else besides positioning could be mined from GPS data. The move paid off: The award-winning work produced techniques to process the noise in GPS signals into measurements of elements of the global water cycle.
“It’s pretty crazy that you could install an instrument to measure millimeter-per-year fault motions, and then simultaneously measure soil moisture, snow depth and vegetation,” Larson said.
The secret to measuring those water elements was buried in the background noise of GPS signals — the sort of noise that Larson had spent years trying to scrub away.
Warming Pacific’s methane vents match Deepwater Horizon spill emissions
The ocean keeps secrets from surface to seafloor, and some even deeper still. A group of researchers from University of Washington discovered one such secret by accident — and their findings could change the scientific world’s understanding of climate change and its relation to the Pacific.
“In 2013, we were preparing for a research expedition that had nothing to do with this,” said Evan Solomon, assistant professor of oceanography at UW. That expedition off the Washington coast revealed a long-term trend of warming in the area concentrated around 500 meters below the surface — the same region where natural gas bubbles up from seafloor seeps. Around the same time, fishermen sent the researchers images from their fishfinders of massive plumes at the depth where the warming was greatest.
So just how much methane is being released? “About the same amount of methane that re-leased during the Deepwater Horizon event” seeps from Washington’s coast each year, he said.
WEB EXCLUSIVES
ENVIRONMENTAL MONITOR 3
Read more @ fondriest.com/news
Project data anytime, anywhere.Stay connected with the WQData LIVE Digital FieldBook.
LEARN MORE AT wqdATALivE.com
FORMS
phOTOS
NOTES
dRAwiNgS
Forms created using the WQData LIVE form builder can be inserted into a FieldBook to make gathering and recording manual data samples fast and efficient. Data from the forms is synced to the cloud and can be used to generate custom reports.
Photos can be easily added to any FieldBook from a mobile device’s library or new photos can be captured and added from the device’s built-in camera. Smart image compression saves storage space and makes syncing with the cloud quick and easy.
Use any FieldBook page as an empty space to gather thoughts and project notes. This module allows anything to be typed on the page and will store and sync all text formatting.
The drawing canvas is an intuitive tool for quick field sketches, system drawings or handwritten notes using a mobile device’s touchscreen. The drawing module includes an abundance of tools including different pens and brushes, 21 different colors, a smart eraser and photo annotation.
5ENVIRONMENTAL MONITOR4
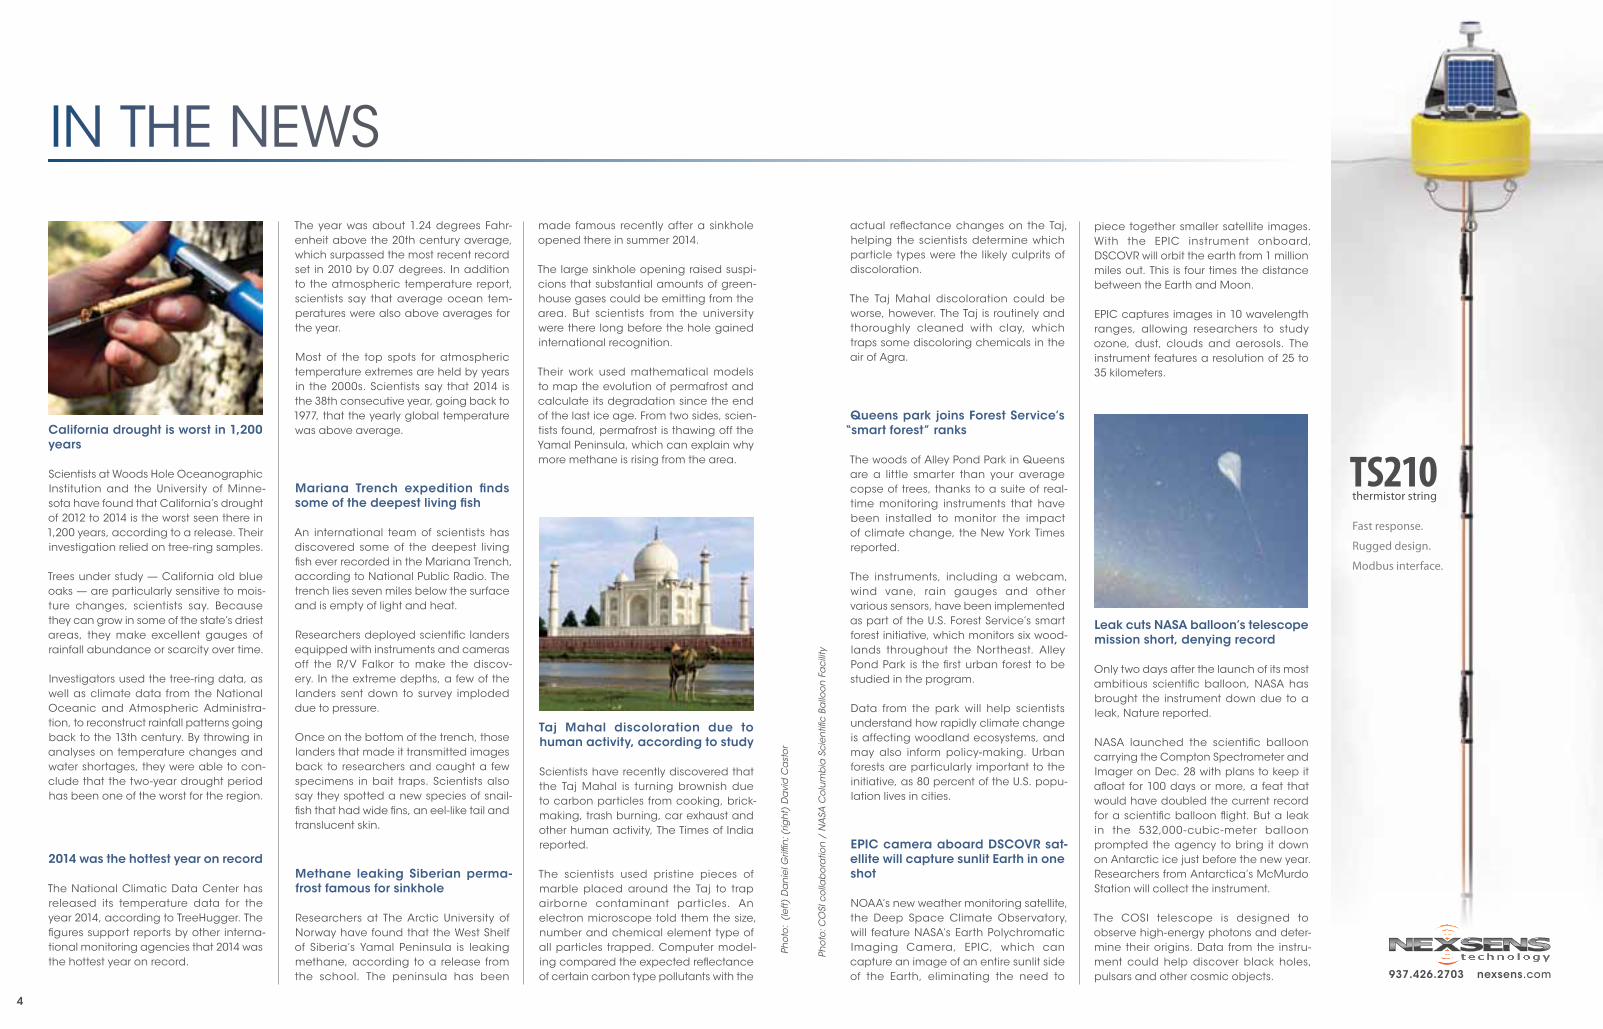
Taj Mahal discoloration due to human activity, according to study
Scientists have recently discovered that the Taj Mahal is turning brownish due to carbon particles from cooking, brick-making, trash burning, car exhaust and other human activity, The Times of India reported.
The scientists used pristine pieces of marble placed around the Taj to trap airborne contaminant particles. An electron microscope told them the size, number and chemical element type of all particles trapped. Computer model-ing compared the expected reflectance of certain carbon type pollutants with the
California drought is worst in 1,200 years
Scientists at Woods Hole Oceanographic Institution and the University of Minne-sota have found that California’s drought of 2012 to 2014 is the worst seen there in 1,200 years, according to a release. Their investigation relied on tree-ring samples.
Trees under study — California old blue oaks — are particularly sensitive to mois-ture changes, scientists say. Because they can grow in some of the state’s driest areas, they make excellent gauges of rainfall abundance or scarcity over time.
Investigators used the tree-ring data, as well as climate data from the National Oceanic and Atmospheric Administra-tion, to reconstruct rainfall patterns going back to the 13th century. By throwing in analyses on temperature changes and water shortages, they were able to con-clude that the two-year drought period has been one of the worst for the region.
EPIC camera aboard DSCOVR sat-ellite will capture sunlit Earth in one shot
NOAA’s new weather monitoring satellite, the Deep Space Climate Observatory, will feature NASA’s Earth Polychromatic Imaging Camera, EPIC, which can capture an image of an entire sunlit side of the Earth, eliminating the need to
Mariana Trench expedition finds some of the deepest living fish
An international team of scientists has discovered some of the deepest living fish ever recorded in the Mariana Trench, according to National Public Radio. The trench lies seven miles below the surface and is empty of light and heat.
Researchers deployed scientific landers equipped with instruments and cameras off the R/V Falkor to make the discov-ery. In the extreme depths, a few of the landers sent down to survey imploded due to pressure.
Once on the bottom of the trench, those landers that made it transmitted images back to researchers and caught a few specimens in bait traps. Scientists also say they spotted a new species of snail-fish that had wide fins, an eel-like tail and translucent skin.
2014 was the hottest year on record
The National Climatic Data Center has released its temperature data for the year 2014, according to TreeHugger. The figures support reports by other interna-tional monitoring agencies that 2014 was the hottest year on record.
Methane leaking Siberian perma-frost famous for sinkhole
Researchers at The Arctic University of Norway have found that the West Shelf of Siberia’s Yamal Peninsula is leaking methane, according to a release from the school. The peninsula has been
Leak cuts NASA balloon’s telescope mission short, denying record
Only two days after the launch of its most ambitious scientific balloon, NASA has brought the instrument down due to a leak, Nature reported.
NASA launched the scientific balloon carrying the Compton Spectrometer and Imager on Dec. 28 with plans to keep it afloat for 100 days or more, a feat that would have doubled the current record for a scientific balloon flight. But a leak in the 532,000-cubic-meter balloon prompted the agency to bring it down on Antarctic ice just before the new year. Researchers from Antarctica’s McMurdo Station will collect the instrument.
The COSI telescope is designed to observe high-energy photons and deter-mine their origins. Data from the instru-ment could help discover black holes, pulsars and other cosmic objects.
Queens park joins Forest Service’s “smart forest” ranks
The woods of Alley Pond Park in Queens are a little smarter than your average copse of trees, thanks to a suite of real-time monitoring instruments that have been installed to monitor the impact of climate change, the New York Times reported.
The instruments, including a webcam, wind vane, rain gauges and other various sensors, have been implemented as part of the U.S. Forest Service’s smart forest initiative, which monitors six wood-lands throughout the Northeast. Alley Pond Park is the first urban forest to be studied in the program.
Data from the park will help scientists understand how rapidly climate change is affecting woodland ecosystems, and may also inform policy-making. Urban forests are particularly important to the initiative, as 80 percent of the U.S. popu-lation lives in cities.
IN THE NEWS
TS210thermistor string
Fast response.
Rugged design.
modbus interface.
937.426.2703 nexsens.com
made famous recently after a sinkhole opened there in summer 2014.
The large sinkhole opening raised suspi-cions that substantial amounts of green-house gases could be emitting from the area. But scientists from the university were there long before the hole gained international recognition.
Their work used mathematical models to map the evolution of permafrost and calculate its degradation since the end of the last ice age. From two sides, scien-tists found, permafrost is thawing off the Yamal Peninsula, which can explain why more methane is rising from the area.
The year was about 1.24 degrees Fahr-enheit above the 20th century average, which surpassed the most recent record set in 2010 by 0.07 degrees. In addition to the atmospheric temperature report, scientists say that average ocean tem-peratures were also above averages for the year.
Most of the top spots for atmospheric temperature extremes are held by years in the 2000s. Scientists say that 2014 is the 38th consecutive year, going back to 1977, that the yearly global temperature was above average.
actual reflectance changes on the Taj, helping the scientists determine which particle types were the likely culprits of discoloration.
The Taj Mahal discoloration could be worse, however. The Taj is routinely and thoroughly cleaned with clay, which traps some discoloring chemicals in the air of Agra.
Pho
to:
(lef
t) D
an
iel G
riffin
; (rig
ht)
Da
vid
Ca
sto
r
Pho
to: C
OSI
co
llab
ora
tion
/ N
ASA
Co
lum
bia
Sci
entifi
c Ba
lloo
n F
aci
lity
piece together smaller satellite images. With the EPIC instrument onboard, DSCOVR will orbit the earth from 1 million miles out. This is four times the distance between the Earth and Moon.
EPIC captures images in 10 wavelength ranges, allowing researchers to study ozone, dust, clouds and aerosols. The instrument features a resolution of 25 to 35 kilometers.
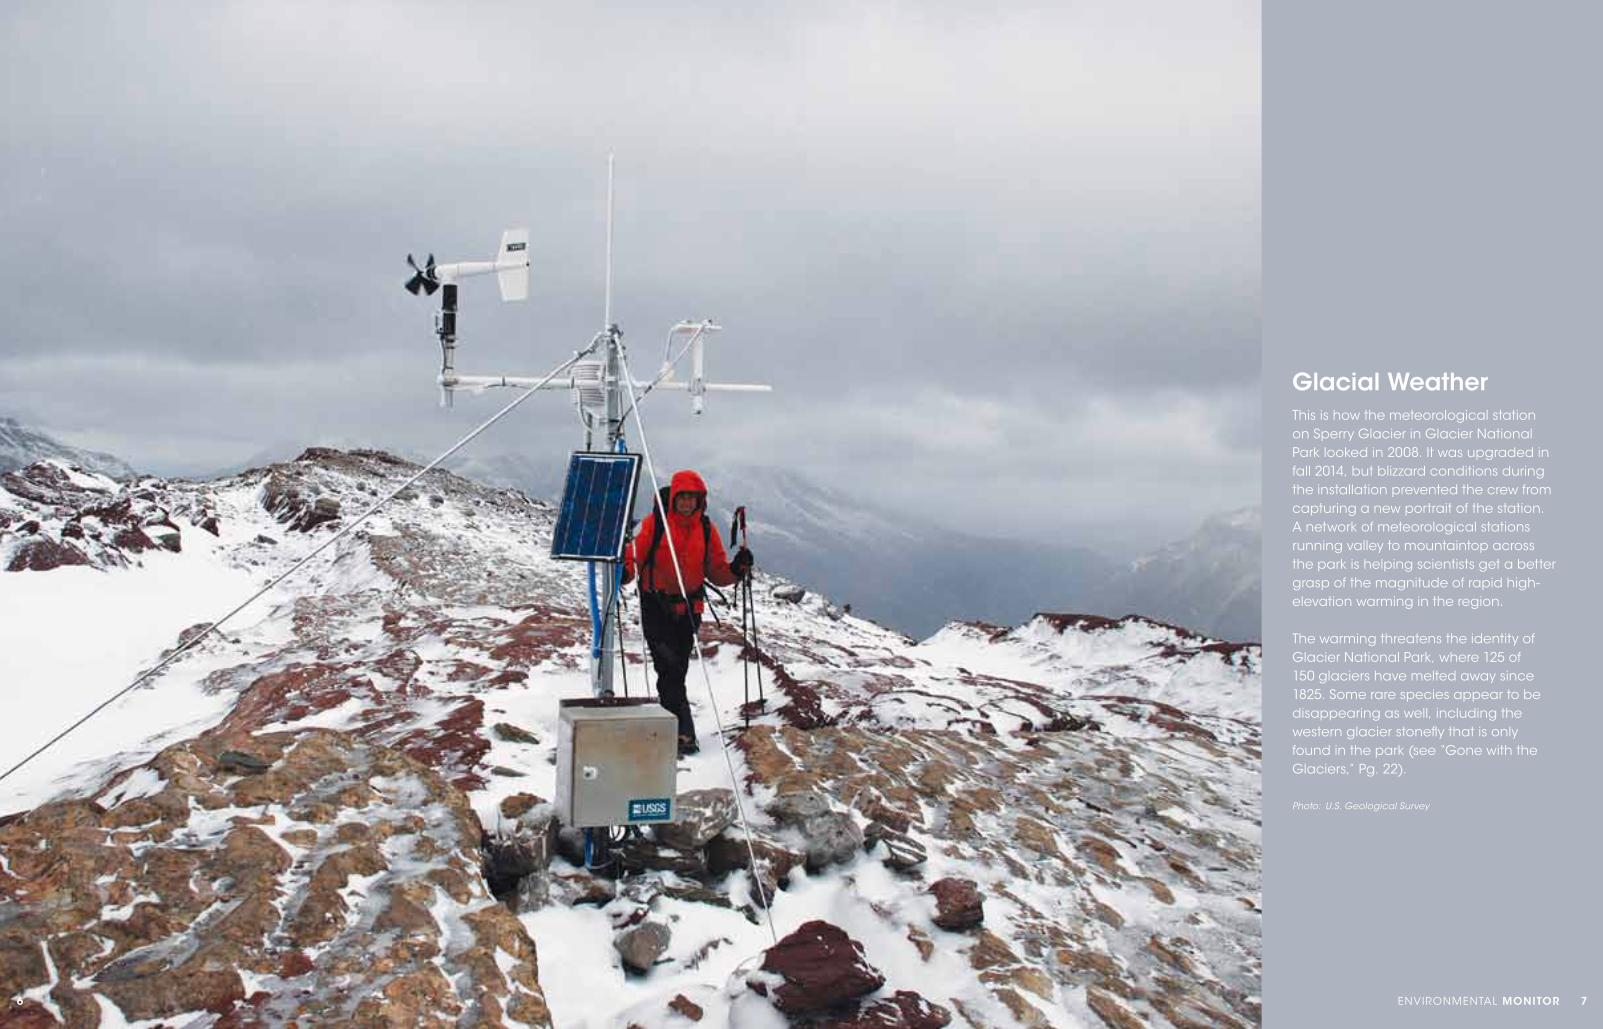
This is how the meteorological station on Sperry Glacier in Glacier National Park looked in 2008. It was upgraded in fall 2014, but blizzard conditions during the installation prevented the crew from capturing a new portrait of the station. A network of meteorological stations running valley to mountaintop across the park is helping scientists get a better grasp of the magnitude of rapid high-elevation warming in the region.
The warming threatens the identity of Glacier National Park, where 125 of 150 glaciers have melted away since 1825. Some rare species appear to be disappearing as well, including the western glacier stonefly that is only found in the park (see “Gone with the Glaciers,” Pg. 22).
Photo: U.S. Geological Survey
Glacial Weather
6 ENVIRONMENTAL MONITOR 7
8 ENVIRONMENTAL MONITOR 9
Pho
tos:
Iza
ak
Wa
lton
Lea
gu
e o
f Am
eric
a
For teachers looking to integrate hands-on environmental edu-cation into their lesson plans, the Izaak Walton League of Amer-ica’s Creek Freaks program can make that a little easier.
This stream and watershed science program comes with a built-in curriculum with an eye toward education standards. There’s even a jet-setting coordinator ready to train teachers and infor-mal educators in the program’s classroom and outdoor activi-ties.
“I run Creek Freaks training workshops wherever I’m needed or wanted,” said Erin Johnson, a clean water fellow with the Izaak Walton League. In the past year, she’s hosted workshops and conference sessions in New York, Iowa, California and Virginia, to name a few. “If teachers are interested in bringing the training to their area, we can make that happen,” she said.
In those two-day workshops, Johnson first leads educators through classroom activities that the U.S. Bureau of Land Man-agement and University of Wisconsin-Extension designed to relate to national science education standards. Next, she shows them the ropes of the stream monitoring segment based on the same protocols of Save Our Streams, the Izaak Walton League’s volunteer water quality monitoring program.
By the time the workshops are through, the trainees are ready to lead their own students through a curriculum that teaches important scientific concepts while connecting kids to their local environments. The classroom activities (some of which work just as well outdoors) cover topics such as stream channel morphology, non-point pollution and even nutrient filtration by vegetation in riparian buffer zones. They present those topics for students ages 10 to 14 through interactive models that make the science easy to understand.
Creek Freaks
ENVIRONMENTAL EDUCATION
Pho
to: (
top
) M
on
tan
a S
pa
ce G
ran
d C
on
sort
ium
; (b
otto
m)
Un
iver
sity
of W
ash
ing
ton
Scientists will have their first four-dimensional measurement of stratospheric temperature changes during a total solar eclipse when thousands of students across the United States launch high-altitude balloons to document the moon’s passage between the sun and terra firma.
The gargantuan effort, with Space Grants in some 42 states expected to participate, will track the eclipse as it passes across the continental U.S. Balloons will take off from 12 sites stretch-ing from the coast of Oregon to the coast of South Carolina. Cameras attached to the balloons will take images 100,000 feet in the air and beam them to NASA’s website in real time so that anyone can glimpse the phenomenal view from the edge of space.
“It’s a fantastic educational experience for the average person to help them to see what’s happening cosmically,” said Angela Des Jardins, director of NASA’s Montana Space Grant Consor-tium and organizer of the project. “It’s amazing and very visually impressive.”
Each team gets to design and build their own balloon platform. They must include a satellite communications modem so that
Seattle’s Lake Union is located near the University of Washing-ton’s campus and provides teachers there a good setting for all types of educational activities. For Miles Logsdon, a professor of oceanography at the school, it’s the perfect spot for his class on sonar.
The class aims to teach young oceanographers how to make scientific observations of what’s going on along the seafloor, as well as show them how to set up sensors and configure multi-beam sonar on their own.
The students are measuring the depth of the seafloor while learning to map acoustic backscatter, which helps research-ers measure seafloor composition. They’re likewise learning to measure acoustic waves as they travel through the water column. All that goes into forming a relatively clear image of some of the processes that are in play to shape the ocean envi-ronment.
The class includes training on a Kongsberg EM302 echosounder and 2040C sonar. Data collected are typically post-processed using ESRI and CARIS software. Using that sort of equipment is important because it’s used in the professional arena every day.
Eclipse Balloons
Student Sonar
For example, the “Putting on the Brakes” activity has students build their own stream channel in a box using modeling clay, adding pipe cleaners and popsicle sticks to create roughness elements. Then they “race” marbles down their channels to see whose goes the slowest, showing that a complex channel slows water and curbs bank erosion. In another activity, students build model watersheds, dusting some areas with Kool-Aid mix to represent fertilizer and chocolate sprinkles to represent animal waste (“Everyone’s favorite,” Johnson said).
The activities give students a base of understanding for when they head to the actual creeks for monitoring. They’ll assess biology by collecting, sorting and identifying macroinverte-brates and calculating a water quality score from the results. They’ll use colorimetric strips to test for chemical constituents like nitrates and phosphates. They’ll take physical measure-ments like width, depth and velocity.
Though the Creek Freaks training program covers the full curric-ulum, teachers and educators aren’t obligated to adopt every piece of it. They’re free to pick and choose elements and adapt them to fit their needs.
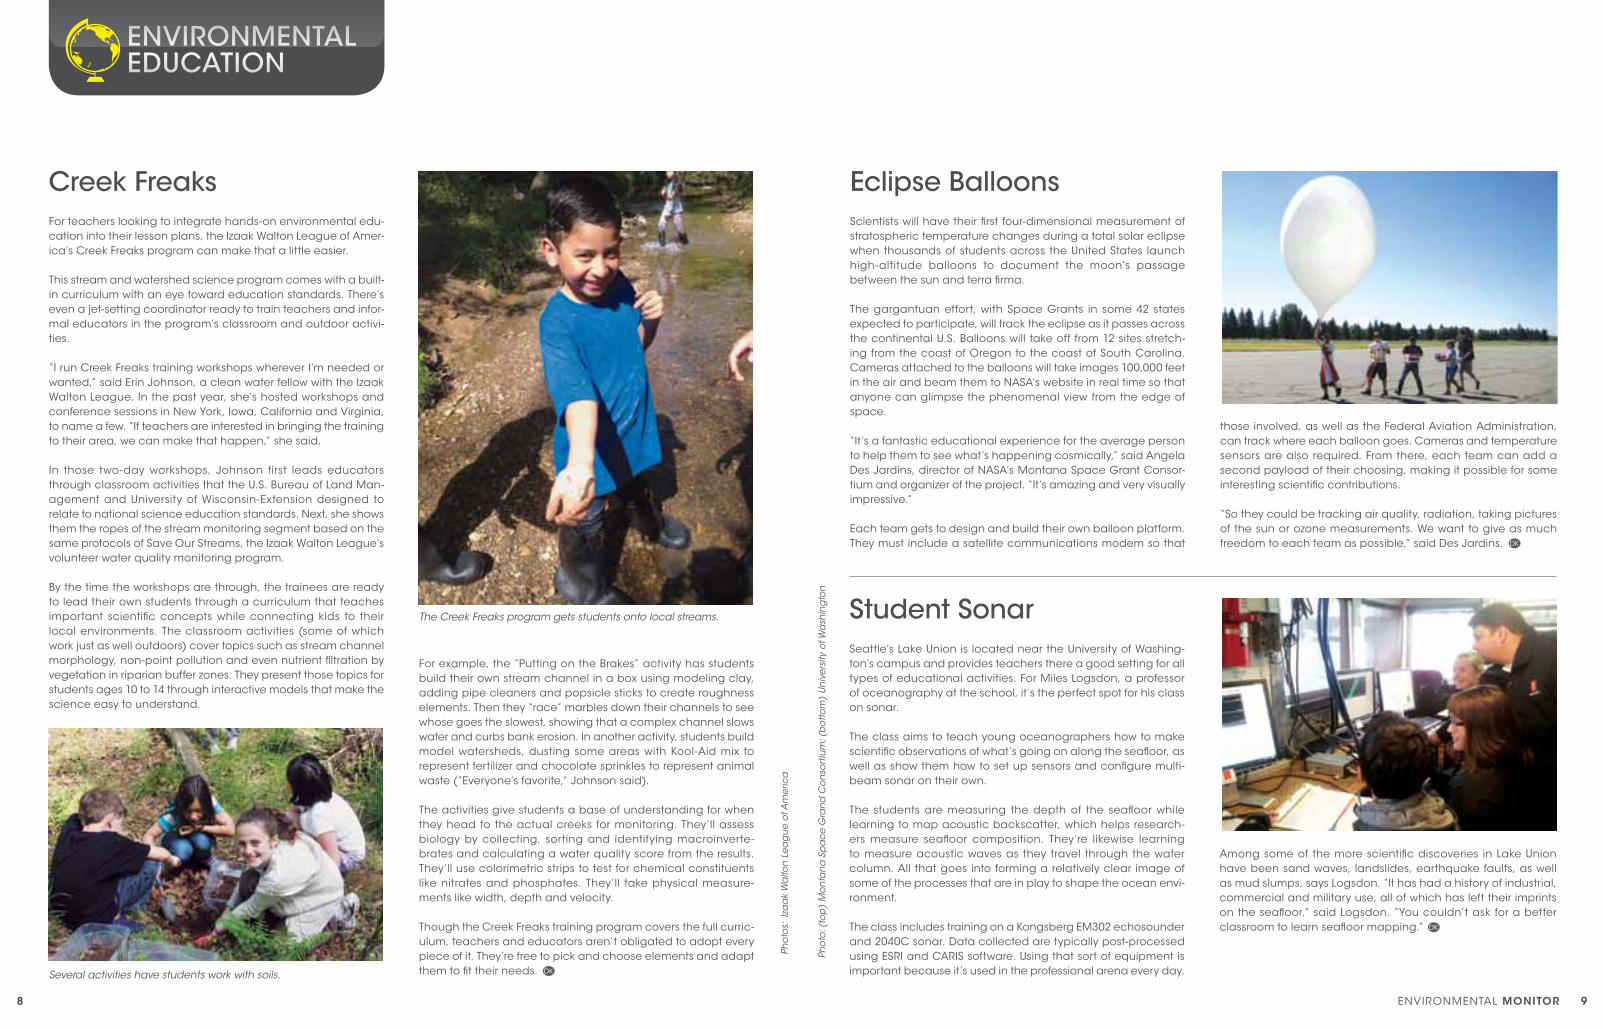
The Creek Freaks program gets students onto local streams.
Several activities have students work with soils.
those involved, as well as the Federal Aviation Administration, can track where each balloon goes. Cameras and temperature sensors are also required. From there, each team can add a second payload of their choosing, making it possible for some interesting scientific contributions.
“So they could be tracking air quality, radiation, taking pictures of the sun or ozone measurements. We want to give as much freedom to each team as possible,” said Des Jardins.
Among some of the more scientific discoveries in Lake Union have been sand waves, landslides, earthquake faults, as well as mud slumps, says Logsdon. “It has had a history of industrial, commercial and military use, all of which has left their imprints on the seafloor,” said Logsdon. “You couldn’t ask for a better classroom to learn seafloor mapping.”
10 ENVIRONMENTAL MONITOR 11
Mount St. Helens has mostly faded from international head-lines since the volcano erupted and blew a cloud of ash
and debris 15 miles into the sky in 1980. But the aftermath of the eruption is a matter of daily life for scientists dealing with the debris in the rivers that drain the mountain’s north flank.
The eruption followed an earthquake that triggered a debris avalanche, which cut the mountain’s peak by 1,300 feet and sent nearly 3 billion cubic yards of sand and gravel careening 20 miles down the North Fork Toutle Valley. Much of that continued downstream from the Toutle River into the Cowlitz River, where it built up on the riverbed, raising the water level and the risk of flooding for communities like Castle Rock and Longview.
Thirty-four years later, the U.S. Geological Survey and Army Corps of Engineers collaborate on a multi-million-dollar effort to track and trap sediment in the Toutle River. The long record helps the corps plan modifications to its sediment-blocking dam on the Toutle, as well as project how long the high sediment concentra-tions will persist — which is apparently well into the foreseeable future.
“Every indication is it will be for years, and probably decades,” said Kurt Spicer, a hydrologic technician with the USGS.
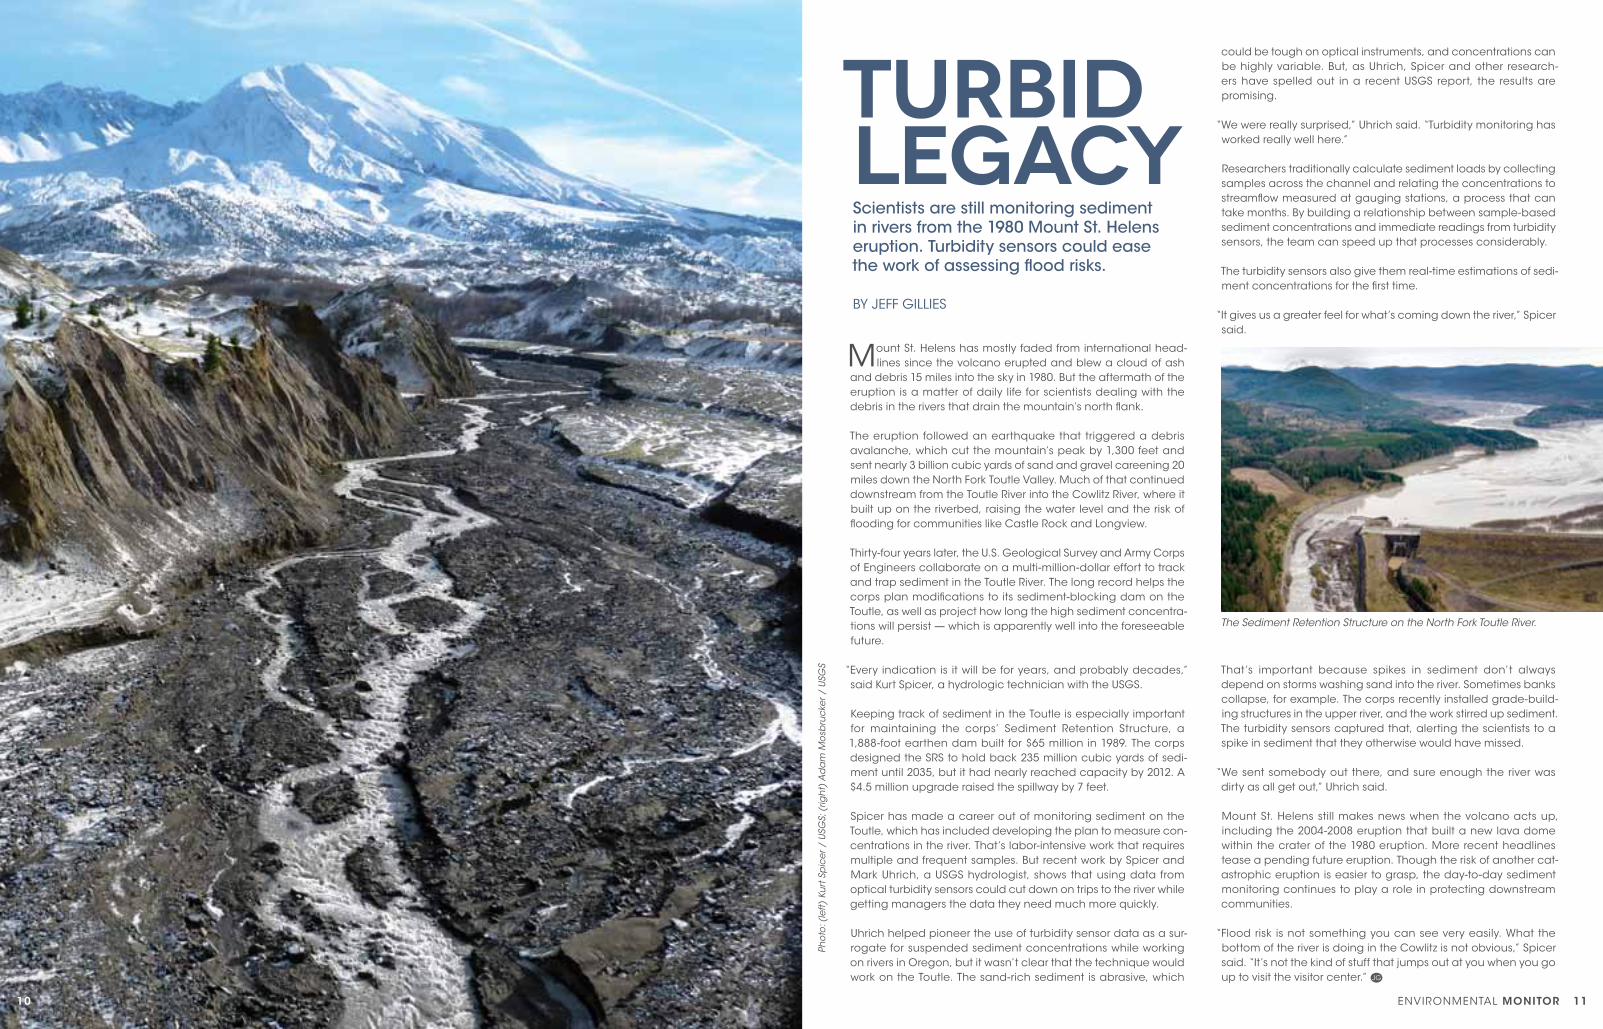
Keeping track of sediment in the Toutle is especially important for maintaining the corps’ Sediment Retention Structure, a 1,888-foot earthen dam built for $65 million in 1989. The corps designed the SRS to hold back 235 million cubic yards of sedi-ment until 2035, but it had nearly reached capacity by 2012. A $4.5 million upgrade raised the spillway by 7 feet.
Spicer has made a career out of monitoring sediment on the Toutle, which has included developing the plan to measure con-centrations in the river. That’s labor-intensive work that requires multiple and frequent samples. But recent work by Spicer and Mark Uhrich, a USGS hydrologist, shows that using data from optical turbidity sensors could cut down on trips to the river while getting managers the data they need much more quickly.
Uhrich helped pioneer the use of turbidity sensor data as a sur-rogate for suspended sediment concentrations while working on rivers in Oregon, but it wasn’t clear that the technique would work on the Toutle. The sand-rich sediment is abrasive, which
Turbid legacy
could be tough on optical instruments, and concentrations can be highly variable. But, as Uhrich, Spicer and other research-ers have spelled out in a recent USGS report, the results are promising.
“We were really surprised,” Uhrich said. “Turbidity monitoring has worked really well here.”
Researchers traditionally calculate sediment loads by collecting samples across the channel and relating the concentrations to streamflow measured at gauging stations, a process that can take months. By building a relationship between sample-based sediment concentrations and immediate readings from turbidity sensors, the team can speed up that processes considerably.
The turbidity sensors also give them real-time estimations of sedi-ment concentrations for the first time.
“It gives us a greater feel for what’s coming down the river,” Spicer said.
BY JEFF GILLIES
Scientists are still monitoring sediment in rivers from the 1980 Mount St. Helens eruption. Turbidity sensors could ease the work of assessing flood risks.
That’s important because spikes in sediment don’t always depend on storms washing sand into the river. Sometimes banks collapse, for example. The corps recently installed grade-build-ing structures in the upper river, and the work stirred up sediment. The turbidity sensors captured that, alerting the scientists to a spike in sediment that they otherwise would have missed.
“We sent somebody out there, and sure enough the river was dirty as all get out,” Uhrich said.
Mount St. Helens still makes news when the volcano acts up, including the 2004-2008 eruption that built a new lava dome within the crater of the 1980 eruption. More recent headlines tease a pending future eruption. Though the risk of another cat-astrophic eruption is easier to grasp, the day-to-day sediment monitoring continues to play a role in protecting downstream communities.
“Flood risk is not something you can see very easily. What the bottom of the river is doing in the Cowlitz is not obvious,” Spicer said. “It’s not the kind of stuff that jumps out at you when you go up to visit the visitor center.”
The Sediment Retention Structure on the North Fork Toutle River.
Pho
to: (
left)
Ku
rt S
pic
er /
USG
S; (
righ
t) A
da
m M
osb
ruck
er /
USG
S
All
Pho
tos:
Jo
e G
iers
ch /
USG
S
All
Pho
tos:
Co
nse
rva
tion
Dro
nes
.org
12 ENVIRONMENTAL MONITOR 13
BY ALEX CARD
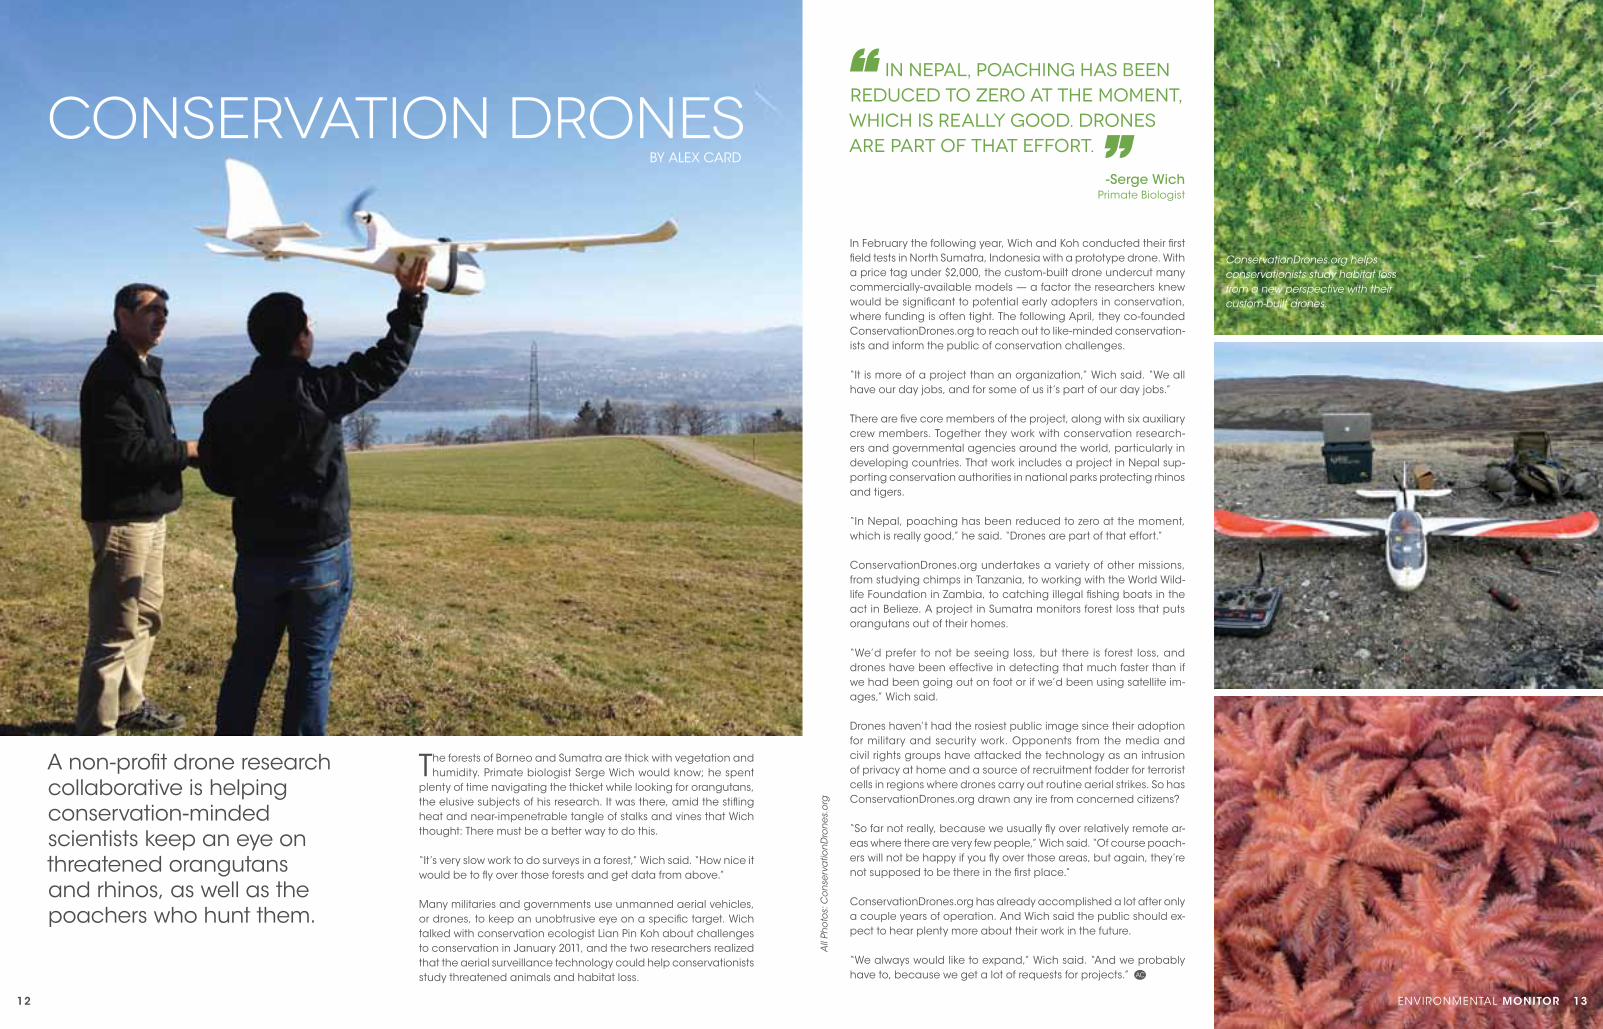
The forests of Borneo and Sumatra are thick with vegetation and humidity. Primate biologist Serge Wich would know; he spent
plenty of time navigating the thicket while looking for orangutans, the elusive subjects of his research. It was there, amid the stifling heat and near-impenetrable tangle of stalks and vines that Wich thought: There must be a better way to do this.
“It’s very slow work to do surveys in a forest,” Wich said. “How nice it would be to fly over those forests and get data from above.”
Many militaries and governments use unmanned aerial vehicles, or drones, to keep an unobtrusive eye on a specific target. Wich talked with conservation ecologist Lian Pin Koh about challenges to conservation in January 2011, and the two researchers realized that the aerial surveillance technology could help conservationists study threatened animals and habitat loss.
In February the following year, Wich and Koh conducted their first field tests in North Sumatra, Indonesia with a prototype drone. With a price tag under $2,000, the custom-built drone undercut many commercially-available models — a factor the researchers knew would be significant to potential early adopters in conservation, where funding is often tight. The following April, they co-founded ConservationDrones.org to reach out to like-minded conservation-ists and inform the public of conservation challenges.
“It is more of a project than an organization,” Wich said. “We all have our day jobs, and for some of us it’s part of our day jobs.”
There are five core members of the project, along with six auxiliary crew members. Together they work with conservation research-ers and governmental agencies around the world, particularly in developing countries. That work includes a project in Nepal sup-porting conservation authorities in national parks protecting rhinos and tigers.
“In Nepal, poaching has been reduced to zero at the moment, which is really good,” he said. “Drones are part of that effort.”
ConservationDrones.org undertakes a variety of other missions, from studying chimps in Tanzania, to working with the World Wild-life Foundation in Zambia, to catching illegal fishing boats in the act in Belieze. A project in Sumatra monitors forest loss that puts orangutans out of their homes.
“We’d prefer to not be seeing loss, but there is forest loss, and drones have been effective in detecting that much faster than if we had been going out on foot or if we’d been using satellite im-ages,” Wich said.
Drones haven’t had the rosiest public image since their adoption for military and security work. Opponents from the media and civil rights groups have attacked the technology as an intrusion of privacy at home and a source of recruitment fodder for terrorist cells in regions where drones carry out routine aerial strikes. So has ConservationDrones.org drawn any ire from concerned citizens?
“So far not really, because we usually fly over relatively remote ar-eas where there are very few people,” Wich said. “Of course poach-ers will not be happy if you fly over those areas, but again, they’re not supposed to be there in the first place.”
ConservationDrones.org has already accomplished a lot after only a couple years of operation. And Wich said the public should ex-pect to hear plenty more about their work in the future.
“We always would like to expand,” Wich said. “And we probably have to, because we get a lot of requests for projects.”
Conservation Drones
A non-profit drone research collaborative is helping conservation-minded scientists keep an eye on threatened orangutans and rhinos, as well as the poachers who hunt them.
In Nepal, poaching has been reduced to zero at the moment, which is really good. Drones are part of that effort.
-Serge WichPrimate Biologist
ConservationDrones.org helps conservationists study habitat loss from a new perspective with their custom-built drones.
DL100Wi-Fi Data Logger
ENVIRONMENTAL MONITOR 15
BY DANIEL KELLY
PRODUCTInnOvaTIOn
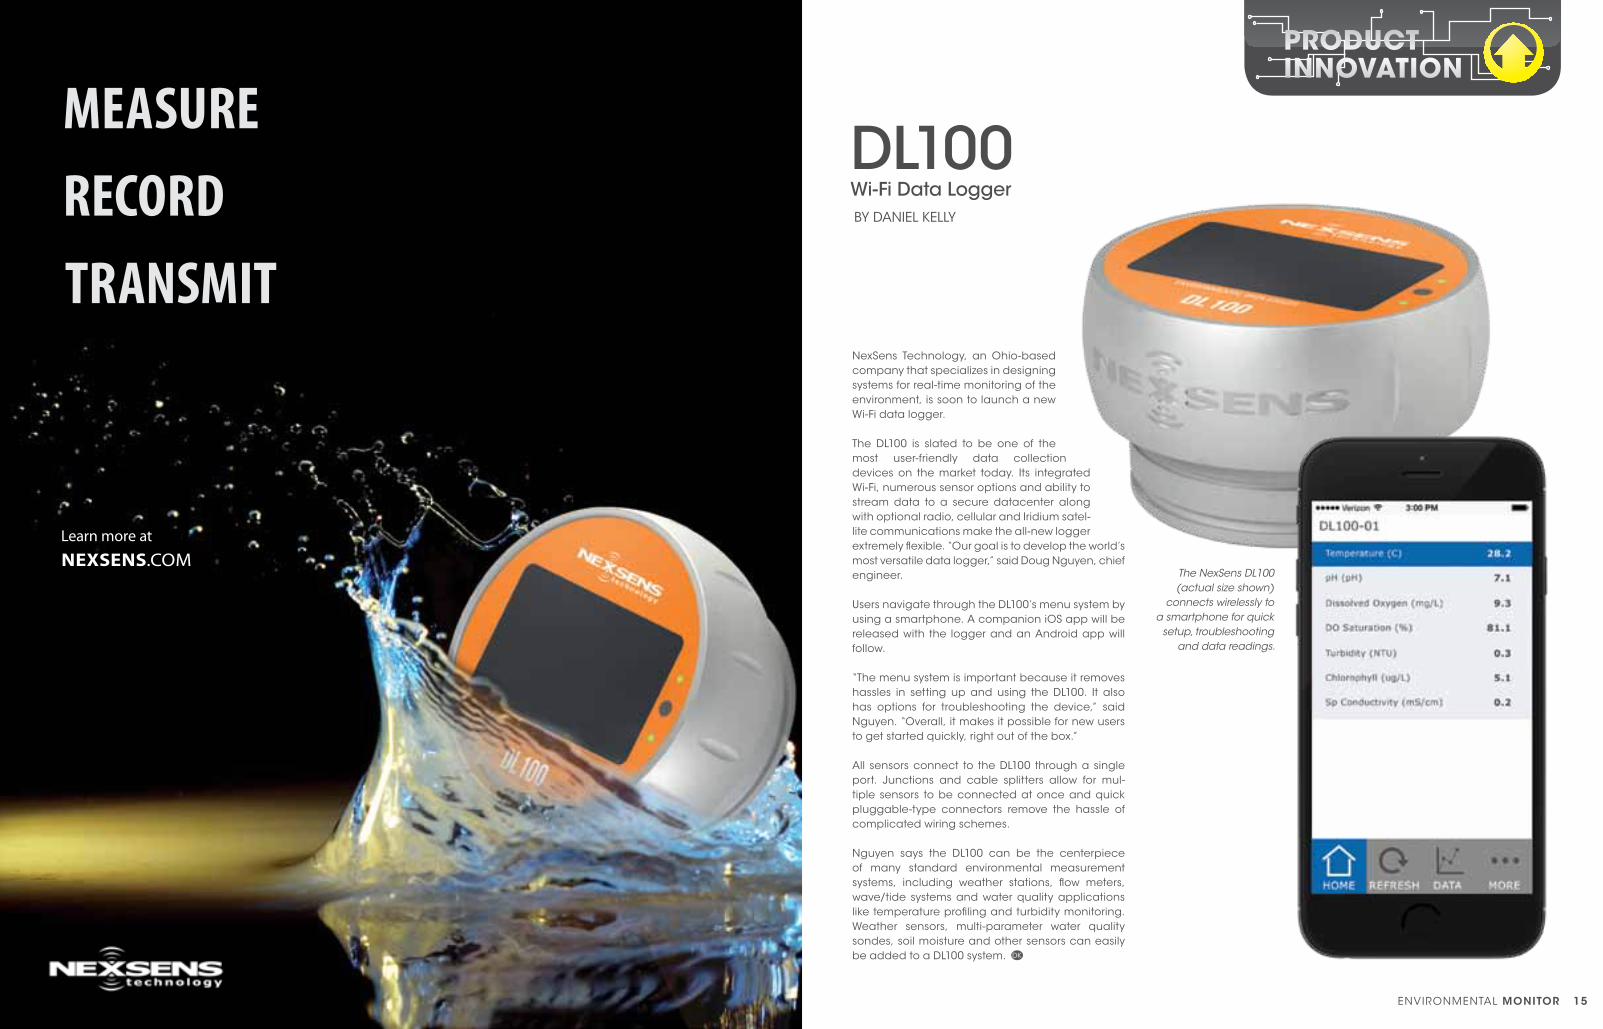
NexSens Technology, an Ohio-based company that specializes in designing systems for real-time monitoring of the environment, is soon to launch a new Wi-Fi data logger.
The DL100 is slated to be one of the most user-friendly data collection devices on the market today. Its integrated Wi-Fi, numerous sensor options and ability to stream data to a secure datacenter along with optional radio, cellular and Iridium satel-lite communications make the all-new logger extremely flexible. “Our goal is to develop the world’s most versatile data logger,” said Doug Nguyen, chief engineer.
Users navigate through the DL100’s menu system by using a smartphone. A companion iOS app will be released with the logger and an Android app will follow.
“The menu system is important because it removes hassles in setting up and using the DL100. It also has options for troubleshooting the device,” said Nguyen. “Overall, it makes it possible for new users to get started quickly, right out of the box.”
All sensors connect to the DL100 through a single port. Junctions and cable splitters allow for mul-tiple sensors to be connected at once and quick pluggable-type connectors remove the hassle of complicated wiring schemes.
Nguyen says the DL100 can be the centerpiece of many standard environmental measurement systems, including weather stations, flow meters, wave/tide systems and water quality applications like temperature profiling and turbidity monitoring. Weather sensors, multi-parameter water quality sondes, soil moisture and other sensors can easily be added to a DL100 system.
MEaSurErEcorDTranSMIT
NexSeNS.comLearn more at
The NexSens DL100 (actual size shown)
connects wirelessly to a smartphone for quick
setup, troubleshooting and data readings.
16 ENVIRONMENTAL MONITOR 17
Illu
stra
tion
: Na
te C
hris
top
her
Pho
to: S
teve
Sa
dro
sEquoia
WHEN tEmpEraturEs
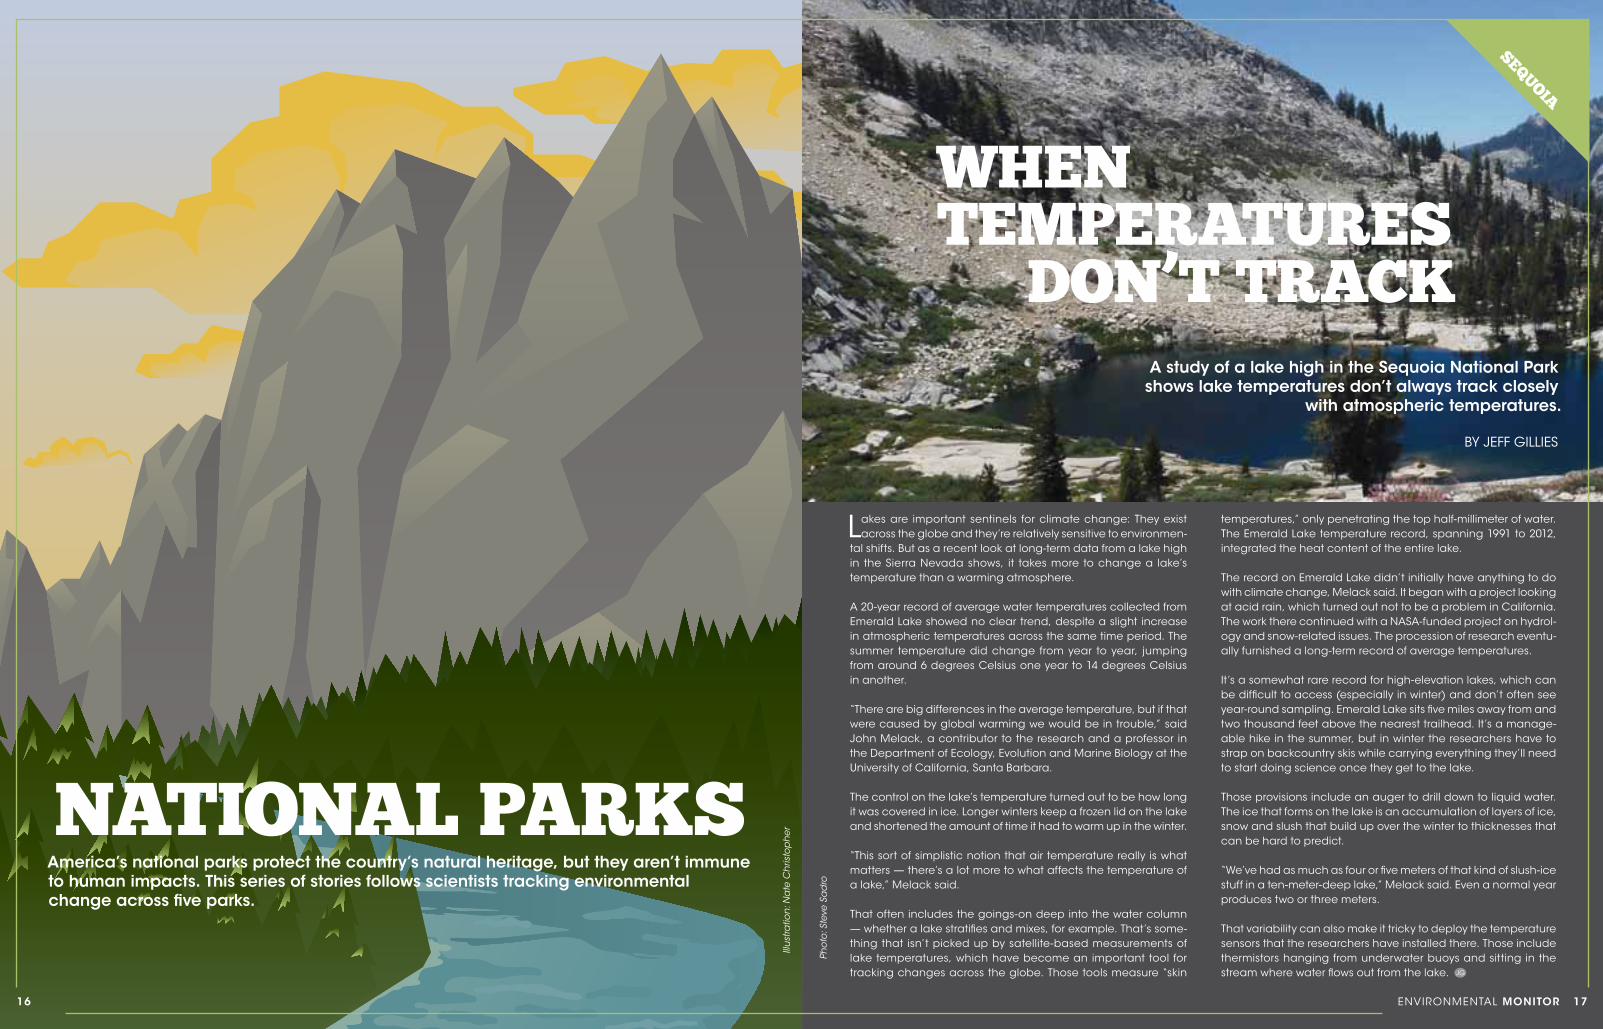
DoN’t traCkA study of a lake high in the Sequoia National Park shows lake temperatures don’t always track closely
with atmospheric temperatures.
Lakes are important sentinels for climate change: They exist across the globe and they’re relatively sensitive to environmen-
tal shifts. But as a recent look at long-term data from a lake high in the Sierra Nevada shows, it takes more to change a lake’s temperature than a warming atmosphere.
A 20-year record of average water temperatures collected from Emerald Lake showed no clear trend, despite a slight increase in atmospheric temperatures across the same time period. The summer temperature did change from year to year, jumping from around 6 degrees Celsius one year to 14 degrees Celsius in another.
“There are big differences in the average temperature, but if that were caused by global warming we would be in trouble,” said John Melack, a contributor to the research and a professor in the Department of Ecology, Evolution and Marine Biology at the University of California, Santa Barbara.
The control on the lake’s temperature turned out to be how long it was covered in ice. Longer winters keep a frozen lid on the lake and shortened the amount of time it had to warm up in the winter.
“This sort of simplistic notion that air temperature really is what matters — there’s a lot more to what affects the temperature of a lake,” Melack said.
That often includes the goings-on deep into the water column — whether a lake stratifies and mixes, for example. That’s some-thing that isn’t picked up by satellite-based measurements of lake temperatures, which have become an important tool for tracking changes across the globe. Those tools measure “skin
temperatures,” only penetrating the top half-millimeter of water. The Emerald Lake temperature record, spanning 1991 to 2012, integrated the heat content of the entire lake.
The record on Emerald Lake didn’t initially have anything to do with climate change, Melack said. It began with a project looking at acid rain, which turned out not to be a problem in California. The work there continued with a NASA-funded project on hydrol-ogy and snow-related issues. The procession of research eventu-ally furnished a long-term record of average temperatures.
It’s a somewhat rare record for high-elevation lakes, which can be difficult to access (especially in winter) and don’t often see year-round sampling. Emerald Lake sits five miles away from and two thousand feet above the nearest trailhead. It’s a manage-able hike in the summer, but in winter the researchers have to strap on backcountry skis while carrying everything they’ll need to start doing science once they get to the lake.
Those provisions include an auger to drill down to liquid water. The ice that forms on the lake is an accumulation of layers of ice, snow and slush that build up over the winter to thicknesses that can be hard to predict.
“We’ve had as much as four or five meters of that kind of slush-ice stuff in a ten-meter-deep lake,” Melack said. Even a normal year produces two or three meters.
That variability can also make it tricky to deploy the temperature sensors that the researchers have installed there. Those include thermistors hanging from underwater buoys and sitting in the stream where water flows out from the lake.
BY JEFF GILLIES
America’s national parks protect the country’s natural heritage, but they aren’t immune to human impacts. This series of stories follows scientists tracking environmental change across five parks.
NatioNal parks
18 ENVIRONMENTAL MONITOR 19
All
Pho
tos:
Yo
sem
ite N
atio
na
l Pa
rk
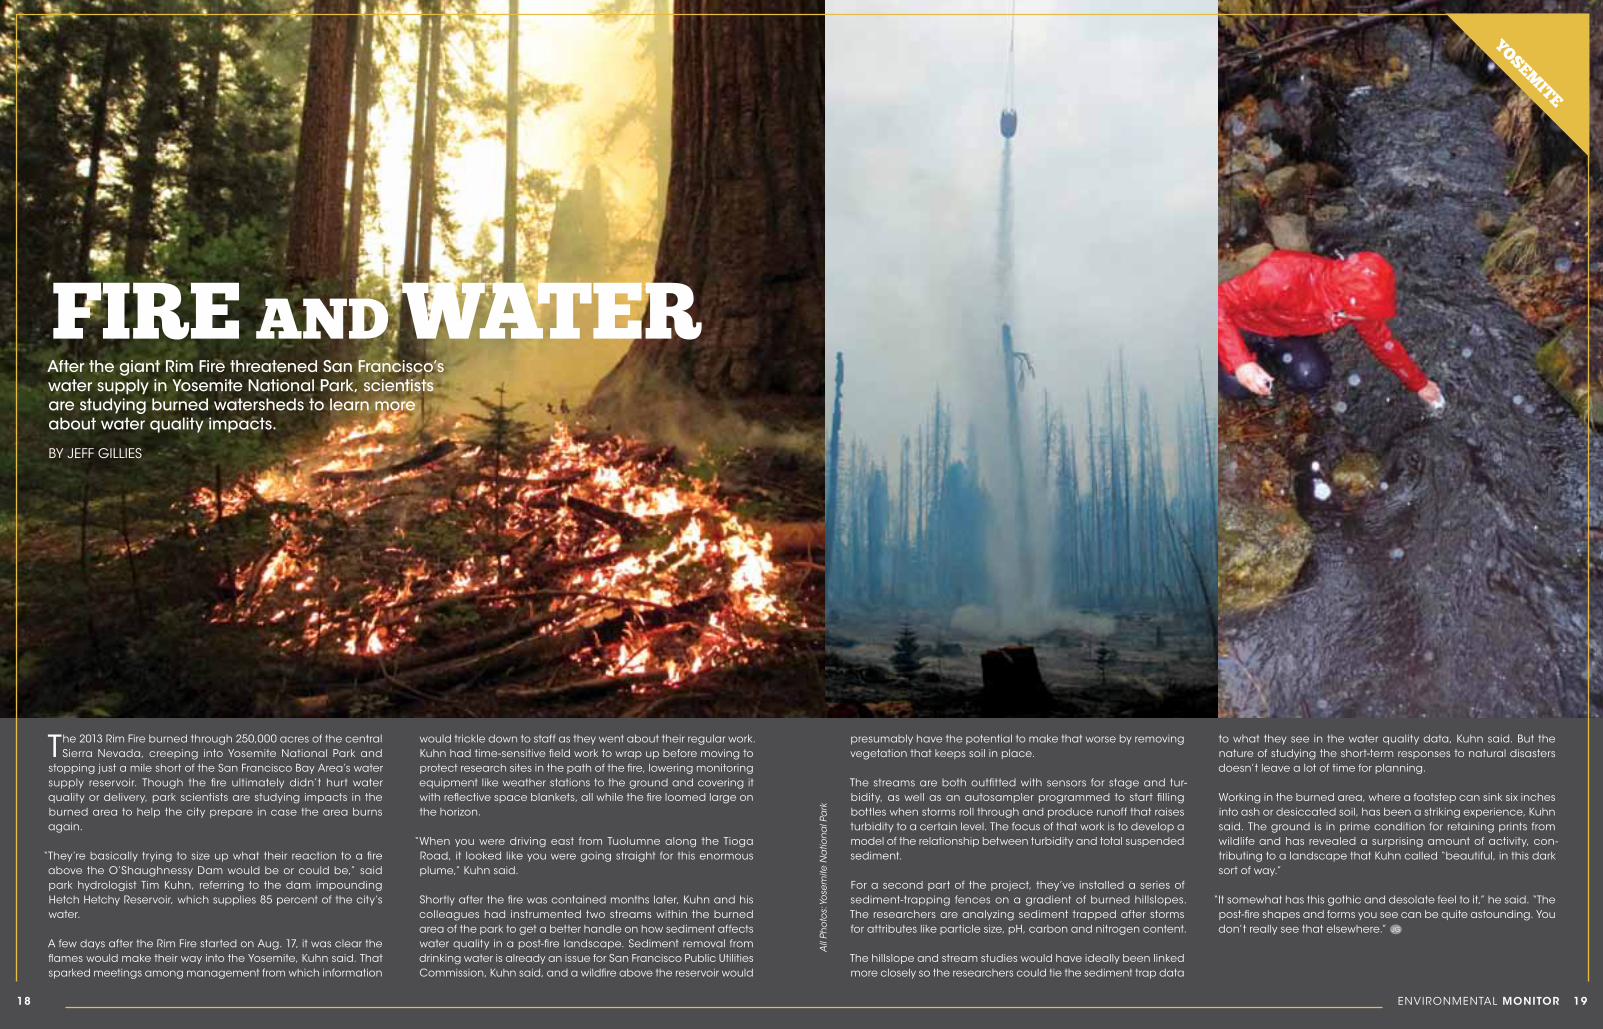
The 2013 Rim Fire burned through 250,000 acres of the central Sierra Nevada, creeping into Yosemite National Park and
stopping just a mile short of the San Francisco Bay Area’s water supply reservoir. Though the fire ultimately didn’t hurt water quality or delivery, park scientists are studying impacts in the burned area to help the city prepare in case the area burns again.
“They’re basically trying to size up what their reaction to a fire above the O’Shaughnessy Dam would be or could be,” said park hydrologist Tim Kuhn, referring to the dam impounding Hetch Hetchy Reservoir, which supplies 85 percent of the city’s water.
A few days after the Rim Fire started on Aug. 17, it was clear the flames would make their way into the Yosemite, Kuhn said. That sparked meetings among management from which information
would trickle down to staff as they went about their regular work. Kuhn had time-sensitive field work to wrap up before moving to protect research sites in the path of the fire, lowering monitoring equipment like weather stations to the ground and covering it with reflective space blankets, all while the fire loomed large on the horizon.
“When you were driving east from Tuolumne along the Tioga Road, it looked like you were going straight for this enormous plume,” Kuhn said.
Shortly after the fire was contained months later, Kuhn and his colleagues had instrumented two streams within the burned area of the park to get a better handle on how sediment affects water quality in a post-fire landscape. Sediment removal from drinking water is already an issue for San Francisco Public Utilities Commission, Kuhn said, and a wildfire above the reservoir would
presumably have the potential to make that worse by removing vegetation that keeps soil in place.
The streams are both outfitted with sensors for stage and tur-bidity, as well as an autosampler programmed to start filling bottles when storms roll through and produce runoff that raises turbidity to a certain level. The focus of that work is to develop a model of the relationship between turbidity and total suspended sediment.
For a second part of the project, they’ve installed a series of sediment-trapping fences on a gradient of burned hillslopes. The researchers are analyzing sediment trapped after storms for attributes like particle size, pH, carbon and nitrogen content.
The hillslope and stream studies would have ideally been linked more closely so the researchers could tie the sediment trap data
to what they see in the water quality data, Kuhn said. But the nature of studying the short-term responses to natural disasters doesn’t leave a lot of time for planning.
Working in the burned area, where a footstep can sink six inches into ash or desiccated soil, has been a striking experience, Kuhn said. The ground is in prime condition for retaining prints from wildlife and has revealed a surprising amount of activity, con-tributing to a landscape that Kuhn called “beautiful, in this dark sort of way.”
“It somewhat has this gothic and desolate feel to it,” he said. “The post-fire shapes and forms you see can be quite astounding. You don’t really see that elsewhere.”
FirE aND WatEr
BY JEFF GILLIES
After the giant Rim Fire threatened San Francisco’s water supply in Yosemite National Park, scientists are studying burned watersheds to learn more about water quality impacts.
YosEmitE
20 ENVIRONMENTAL MONITOR 21
All
Pho
tos:
Alis
a M
ast
skY-HigH NitratEBY JEFF GILLIES
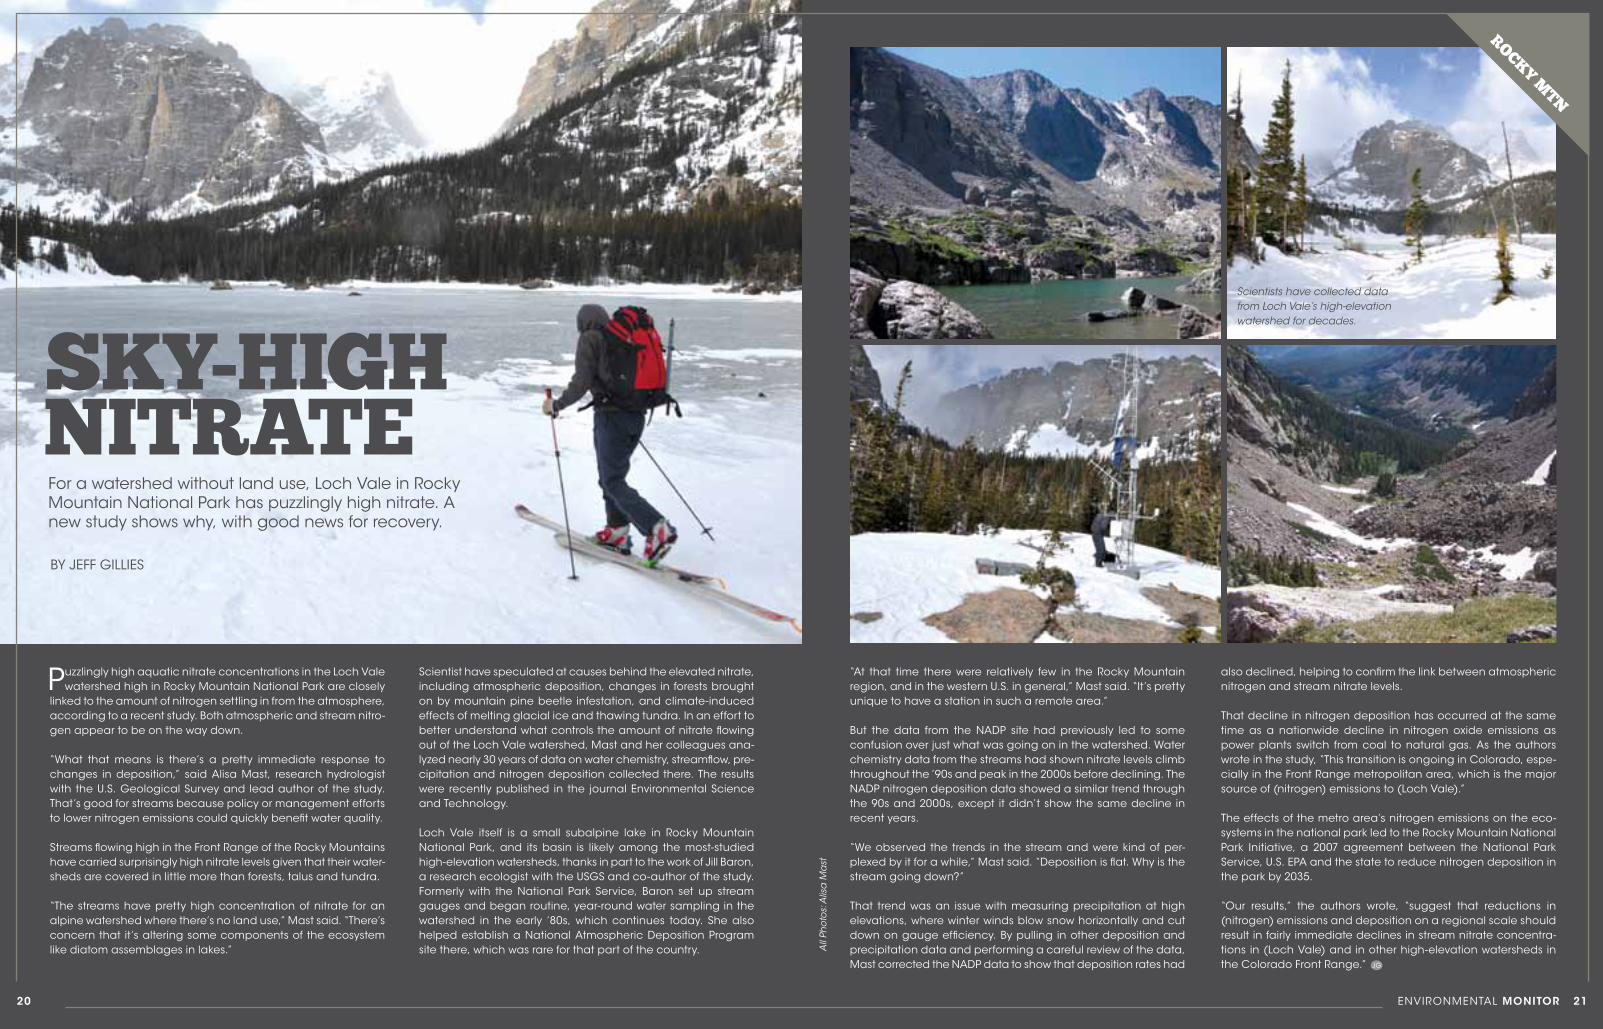
For a watershed without land use, Loch Vale in Rocky Mountain National Park has puzzlingly high nitrate. A new study shows why, with good news for recovery.
Puzzlingly high aquatic nitrate concentrations in the Loch Vale watershed high in Rocky Mountain National Park are closely
linked to the amount of nitrogen settling in from the atmosphere, according to a recent study. Both atmospheric and stream nitro-gen appear to be on the way down.
“What that means is there’s a pretty immediate response to changes in deposition,” said Alisa Mast, research hydrologist with the U.S. Geological Survey and lead author of the study. That’s good for streams because policy or management efforts to lower nitrogen emissions could quickly benefit water quality.
Streams flowing high in the Front Range of the Rocky Mountains have carried surprisingly high nitrate levels given that their water-sheds are covered in little more than forests, talus and tundra.
“The streams have pretty high concentration of nitrate for an alpine watershed where there’s no land use,” Mast said. “There’s concern that it’s altering some components of the ecosystem like diatom assemblages in lakes.”
Scientist have speculated at causes behind the elevated nitrate, including atmospheric deposition, changes in forests brought on by mountain pine beetle infestation, and climate-induced effects of melting glacial ice and thawing tundra. In an effort to better understand what controls the amount of nitrate flowing out of the Loch Vale watershed, Mast and her colleagues ana-lyzed nearly 30 years of data on water chemistry, streamflow, pre-cipitation and nitrogen deposition collected there. The results were recently published in the journal Environmental Science and Technology.
Loch Vale itself is a small subalpine lake in Rocky Mountain National Park, and its basin is likely among the most-studied high-elevation watersheds, thanks in part to the work of Jill Baron, a research ecologist with the USGS and co-author of the study. Formerly with the National Park Service, Baron set up stream gauges and began routine, year-round water sampling in the watershed in the early ’80s, which continues today. She also helped establish a National Atmospheric Deposition Program site there, which was rare for that part of the country.
“At that time there were relatively few in the Rocky Mountain region, and in the western U.S. in general,” Mast said. “It’s pretty unique to have a station in such a remote area.”
But the data from the NADP site had previously led to some confusion over just what was going on in the watershed. Water chemistry data from the streams had shown nitrate levels climb throughout the ’90s and peak in the 2000s before declining. The NADP nitrogen deposition data showed a similar trend through the 90s and 2000s, except it didn’t show the same decline in recent years.
“We observed the trends in the stream and were kind of per-plexed by it for a while,” Mast said. “Deposition is flat. Why is the stream going down?”
That trend was an issue with measuring precipitation at high elevations, where winter winds blow snow horizontally and cut down on gauge efficiency. By pulling in other deposition and precipitation data and performing a careful review of the data, Mast corrected the NADP data to show that deposition rates had
also declined, helping to confirm the link between atmospheric nitrogen and stream nitrate levels.
That decline in nitrogen deposition has occurred at the same time as a nationwide decline in nitrogen oxide emissions as power plants switch from coal to natural gas. As the authors wrote in the study, “This transition is ongoing in Colorado, espe-cially in the Front Range metropolitan area, which is the major source of (nitrogen) emissions to (Loch Vale).”
The effects of the metro area’s nitrogen emissions on the eco-systems in the national park led to the Rocky Mountain National Park Initiative, a 2007 agreement between the National Park Service, U.S. EPA and the state to reduce nitrogen deposition in the park by 2035.
“Our results,” the authors wrote, “suggest that reductions in (nitrogen) emissions and deposition on a regional scale should result in fairly immediate declines in stream nitrate concentra-tions in (Loch Vale) and in other high-elevation watersheds in the Colorado Front Range.”
roCkY mtN
Scientists have collected data from Loch Vale’s high-elevation watershed for decades.
All
Pho
tos:
Jo
e G
iers
ch /
USG
S
22 ENVIRONMENTAL MONITOR 23
All
Pho
tos:
Jo
e G
iers
ch /
USG
S
BY JEFF GILLIES
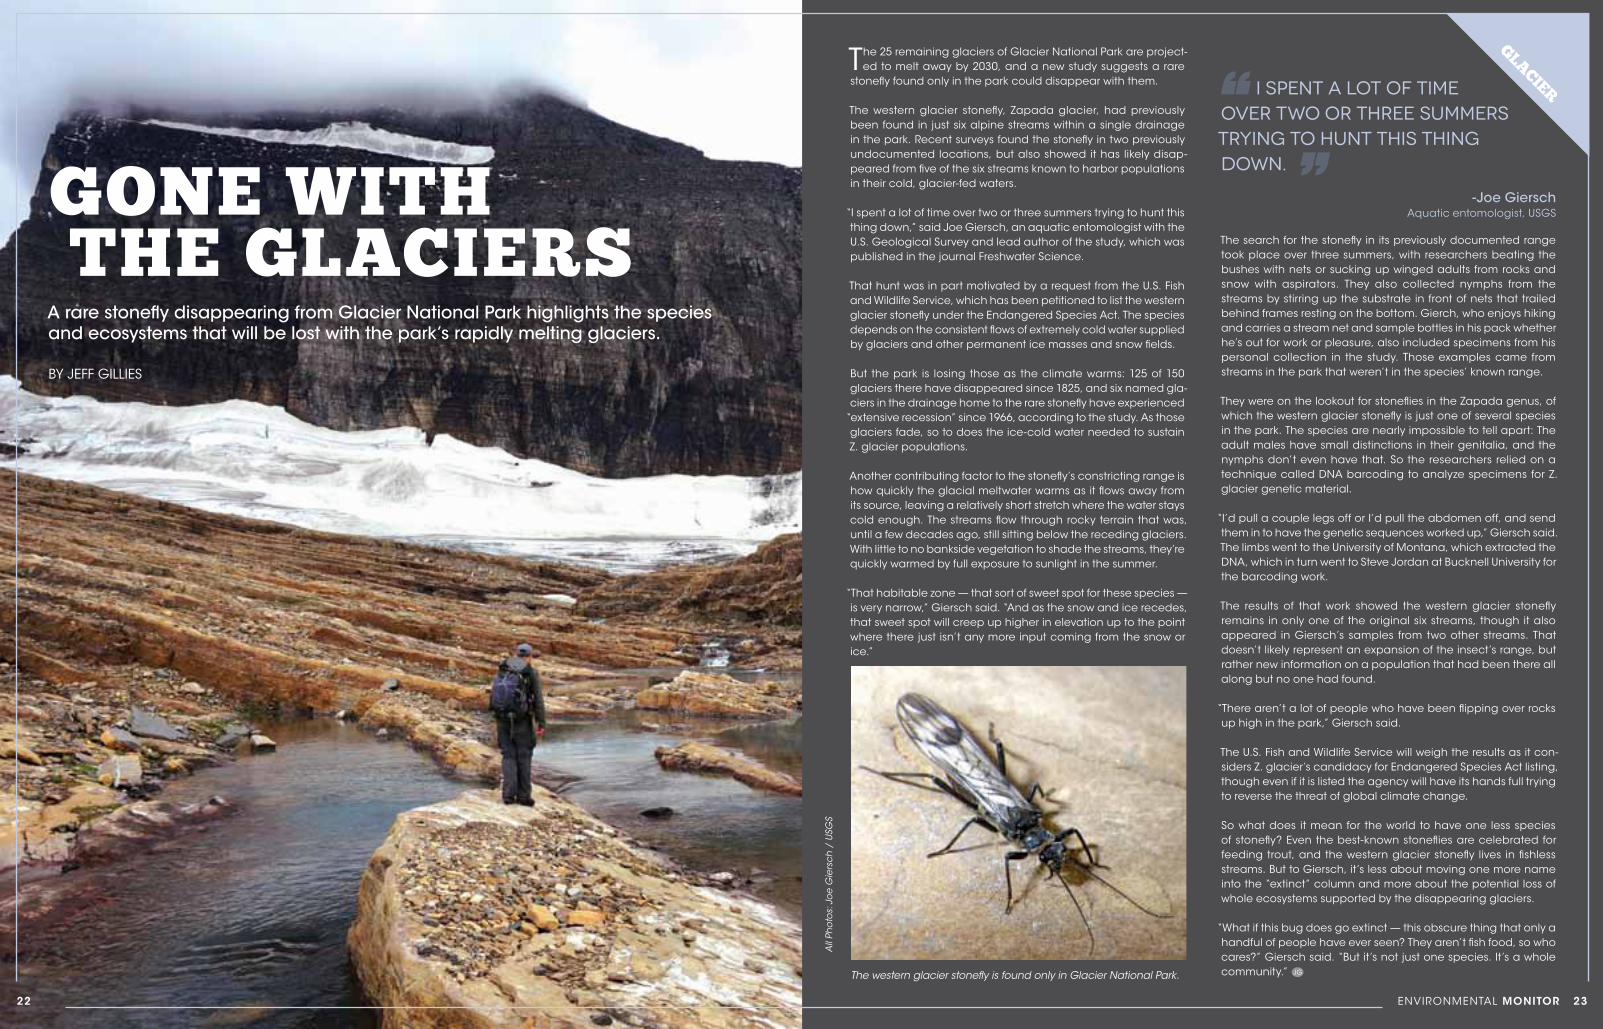
A rare stonefly disappearing from Glacier National Park highlights the species and ecosystems that will be lost with the park’s rapidly melting glaciers.
The 25 remaining glaciers of Glacier National Park are project-ed to melt away by 2030, and a new study suggests a rare
stonefly found only in the park could disappear with them.
The western glacier stonefly, Zapada glacier, had previously been found in just six alpine streams within a single drainage in the park. Recent surveys found the stonefly in two previously undocumented locations, but also showed it has likely disap-peared from five of the six streams known to harbor populations in their cold, glacier-fed waters.
“I spent a lot of time over two or three summers trying to hunt this thing down,” said Joe Giersch, an aquatic entomologist with the U.S. Geological Survey and lead author of the study, which was published in the journal Freshwater Science.
That hunt was in part motivated by a request from the U.S. Fish and Wildlife Service, which has been petitioned to list the western glacier stonefly under the Endangered Species Act. The species depends on the consistent flows of extremely cold water supplied by glaciers and other permanent ice masses and snow fields.
But the park is losing those as the climate warms: 125 of 150 glaciers there have disappeared since 1825, and six named gla-ciers in the drainage home to the rare stonefly have experienced
“extensive recession” since 1966, according to the study. As those glaciers fade, so to does the ice-cold water needed to sustain Z. glacier populations.
Another contributing factor to the stonefly’s constricting range is how quickly the glacial meltwater warms as it flows away from its source, leaving a relatively short stretch where the water stays cold enough. The streams flow through rocky terrain that was, until a few decades ago, still sitting below the receding glaciers. With little to no bankside vegetation to shade the streams, they’re quickly warmed by full exposure to sunlight in the summer.
“That habitable zone — that sort of sweet spot for these species — is very narrow,” Giersch said. “And as the snow and ice recedes, that sweet spot will creep up higher in elevation up to the point where there just isn’t any more input coming from the snow or ice.”
The search for the stonefly in its previously documented range took place over three summers, with researchers beating the bushes with nets or sucking up winged adults from rocks and snow with aspirators. They also collected nymphs from the streams by stirring up the substrate in front of nets that trailed behind frames resting on the bottom. Gierch, who enjoys hiking and carries a stream net and sample bottles in his pack whether he’s out for work or pleasure, also included specimens from his personal collection in the study. Those examples came from streams in the park that weren’t in the species’ known range.
They were on the lookout for stoneflies in the Zapada genus, of which the western glacier stonefly is just one of several species in the park. The species are nearly impossible to tell apart: The adult males have small distinctions in their genitalia, and the nymphs don’t even have that. So the researchers relied on a technique called DNA barcoding to analyze specimens for Z. glacier genetic material.
“I’d pull a couple legs off or I’d pull the abdomen off, and send them in to have the genetic sequences worked up,” Giersch said. The limbs went to the University of Montana, which extracted the DNA, which in turn went to Steve Jordan at Bucknell University for the barcoding work.
The results of that work showed the western glacier stonefly remains in only one of the original six streams, though it also appeared in Giersch’s samples from two other streams. That doesn’t likely represent an expansion of the insect’s range, but rather new information on a population that had been there all along but no one had found.
“There aren’t a lot of people who have been flipping over rocks up high in the park,” Giersch said.
The U.S. Fish and Wildlife Service will weigh the results as it con-siders Z. glacier’s candidacy for Endangered Species Act listing, though even if it is listed the agency will have its hands full trying to reverse the threat of global climate change.
So what does it mean for the world to have one less species of stonefly? Even the best-known stoneflies are celebrated for feeding trout, and the western glacier stonefly lives in fishless streams. But to Giersch, it’s less about moving one more name into the “extinct” column and more about the potential loss of whole ecosystems supported by the disappearing glaciers.
“What if this bug does go extinct — this obscure thing that only a handful of people have ever seen? They aren’t fish food, so who cares?” Giersch said. “But it’s not just one species. It’s a whole community.”The western glacier stonefly is found only in Glacier National Park.
goNE WitH tHE glaCiErs
glaCiEr I Spent a lot of time over two or three summers trying to hunt this thing down.
-Joe GierschAquatic entomologist, USGS
24 ENVIRONMENTAL MONITOR 25
Pho
to: N
atio
na
l Pa
rk S
ervi
ce
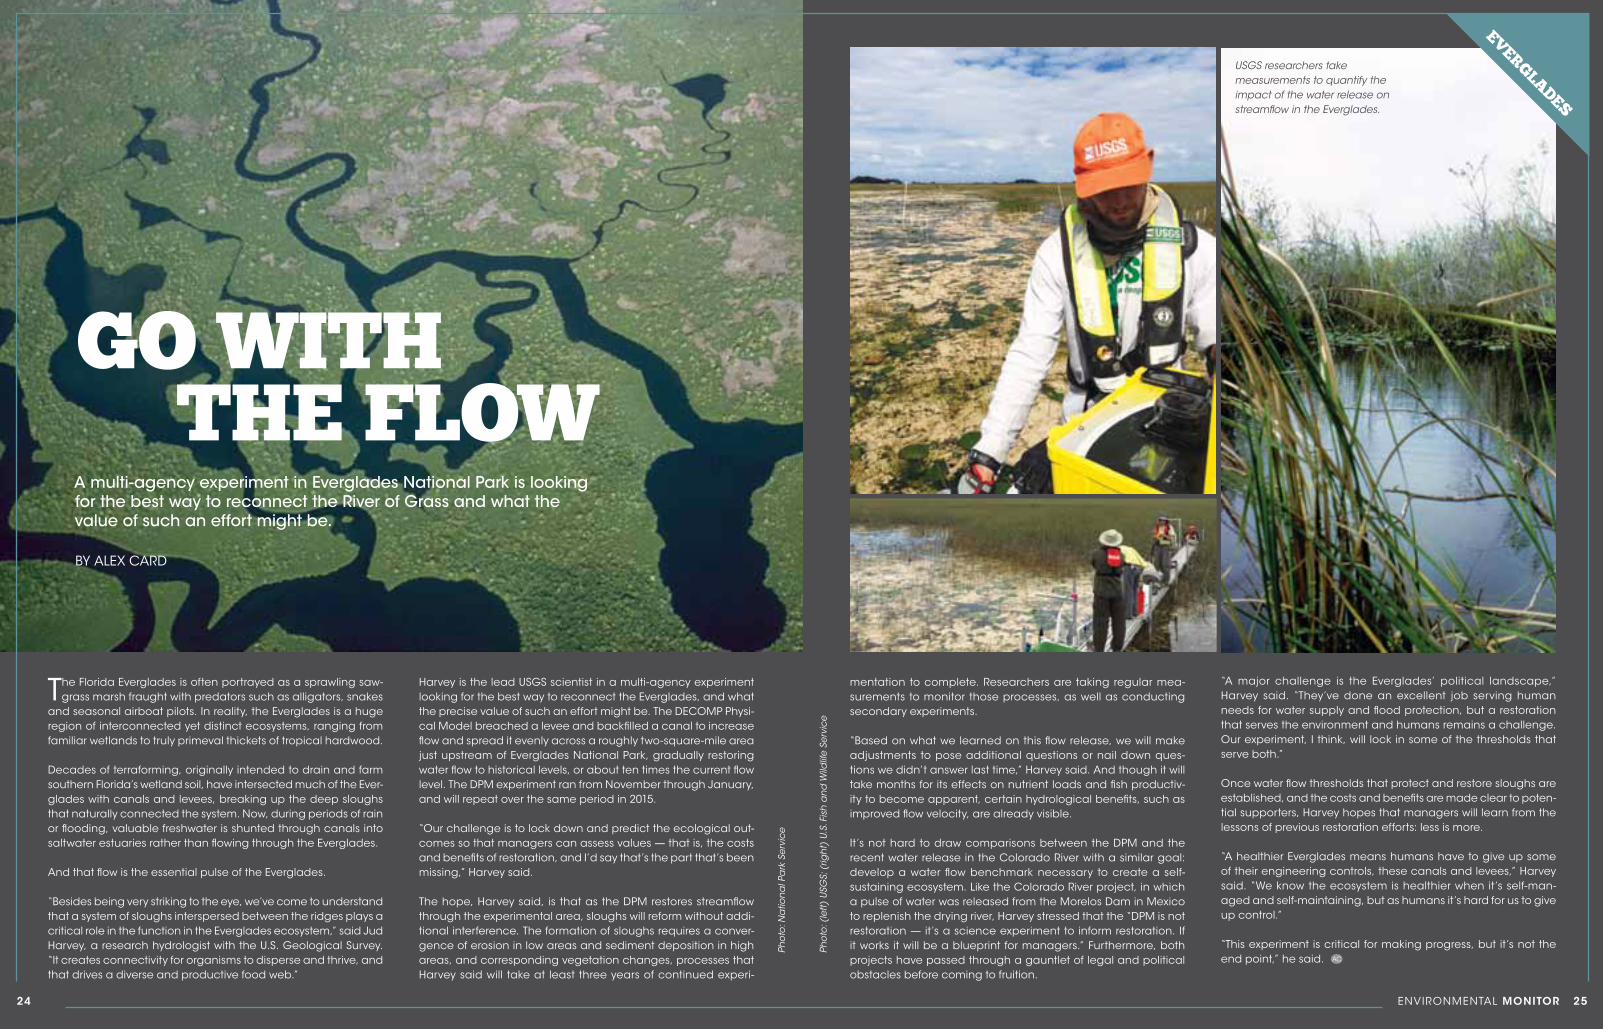
The Florida Everglades is often portrayed as a sprawling saw-grass marsh fraught with predators such as alligators, snakes
and seasonal airboat pilots. In reality, the Everglades is a huge region of interconnected yet distinct ecosystems, ranging from familiar wetlands to truly primeval thickets of tropical hardwood.
Decades of terraforming, originally intended to drain and farm southern Florida’s wetland soil, have intersected much of the Ever-glades with canals and levees, breaking up the deep sloughs that naturally connected the system. Now, during periods of rain or flooding, valuable freshwater is shunted through canals into saltwater estuaries rather than flowing through the Everglades.
And that flow is the essential pulse of the Everglades.
“Besides being very striking to the eye, we’ve come to understand that a system of sloughs interspersed between the ridges plays a critical role in the function in the Everglades ecosystem,” said Jud Harvey, a research hydrologist with the U.S. Geological Survey. “It creates connectivity for organisms to disperse and thrive, and that drives a diverse and productive food web.”
Harvey is the lead USGS scientist in a multi-agency experiment looking for the best way to reconnect the Everglades, and what the precise value of such an effort might be. The DECOMP Physi-cal Model breached a levee and backfilled a canal to increase flow and spread it evenly across a roughly two-square-mile area just upstream of Everglades National Park, gradually restoring water flow to historical levels, or about ten times the current flow level. The DPM experiment ran from November through January, and will repeat over the same period in 2015.
“Our challenge is to lock down and predict the ecological out-comes so that managers can assess values — that is, the costs and benefits of restoration, and I’d say that’s the part that’s been missing,” Harvey said.
The hope, Harvey said, is that as the DPM restores streamflow through the experimental area, sloughs will reform without addi-tional interference. The formation of sloughs requires a conver-gence of erosion in low areas and sediment deposition in high areas, and corresponding vegetation changes, processes that Harvey said will take at least three years of continued experi-
BY ALEX CARD
go WitHtHE FloW
A multi-agency experiment in Everglades National Park is looking for the best way to reconnect the River of Grass and what the value of such an effort might be.
mentation to complete. Researchers are taking regular mea-surements to monitor those processes, as well as conducting secondary experiments.
“Based on what we learned on this flow release, we will make adjustments to pose additional questions or nail down ques-tions we didn’t answer last time,” Harvey said. And though it will take months for its effects on nutrient loads and fish productiv-ity to become apparent, certain hydrological benefits, such as improved flow velocity, are already visible.
It’s not hard to draw comparisons between the DPM and the recent water release in the Colorado River with a similar goal: develop a water flow benchmark necessary to create a self-sustaining ecosystem. Like the Colorado River project, in which a pulse of water was released from the Morelos Dam in Mexico to replenish the drying river, Harvey stressed that the “DPM is not restoration — it’s a science experiment to inform restoration. If it works it will be a blueprint for managers.” Furthermore, both projects have passed through a gauntlet of legal and political obstacles before coming to fruition.
“A major challenge is the Everglades’ political landscape,” Harvey said. “They’ve done an excellent job serving human needs for water supply and flood protection, but a restoration that serves the environment and humans remains a challenge. Our experiment, I think, will lock in some of the thresholds that serve both.”
Once water flow thresholds that protect and restore sloughs are established, and the costs and benefits are made clear to poten-tial supporters, Harvey hopes that managers will learn from the lessons of previous restoration efforts: less is more.
“A healthier Everglades means humans have to give up some of their engineering controls, these canals and levees,” Harvey said. “We know the ecosystem is healthier when it’s self-man-aged and self-maintaining, but as humans it’s hard for us to give up control.”
“This experiment is critical for making progress, but it’s not the end point,” he said.
Pho
to: (
left)
USG
S; (
righ
t) U
.S. F
ish
an
d W
ildlif
e Se
rvic
e
EvErglaDEs
USGS researchers take measurements to quantify the impact of the water release on streamflow in the Everglades.
26 ENVIRONMENTAL MONITOR 27
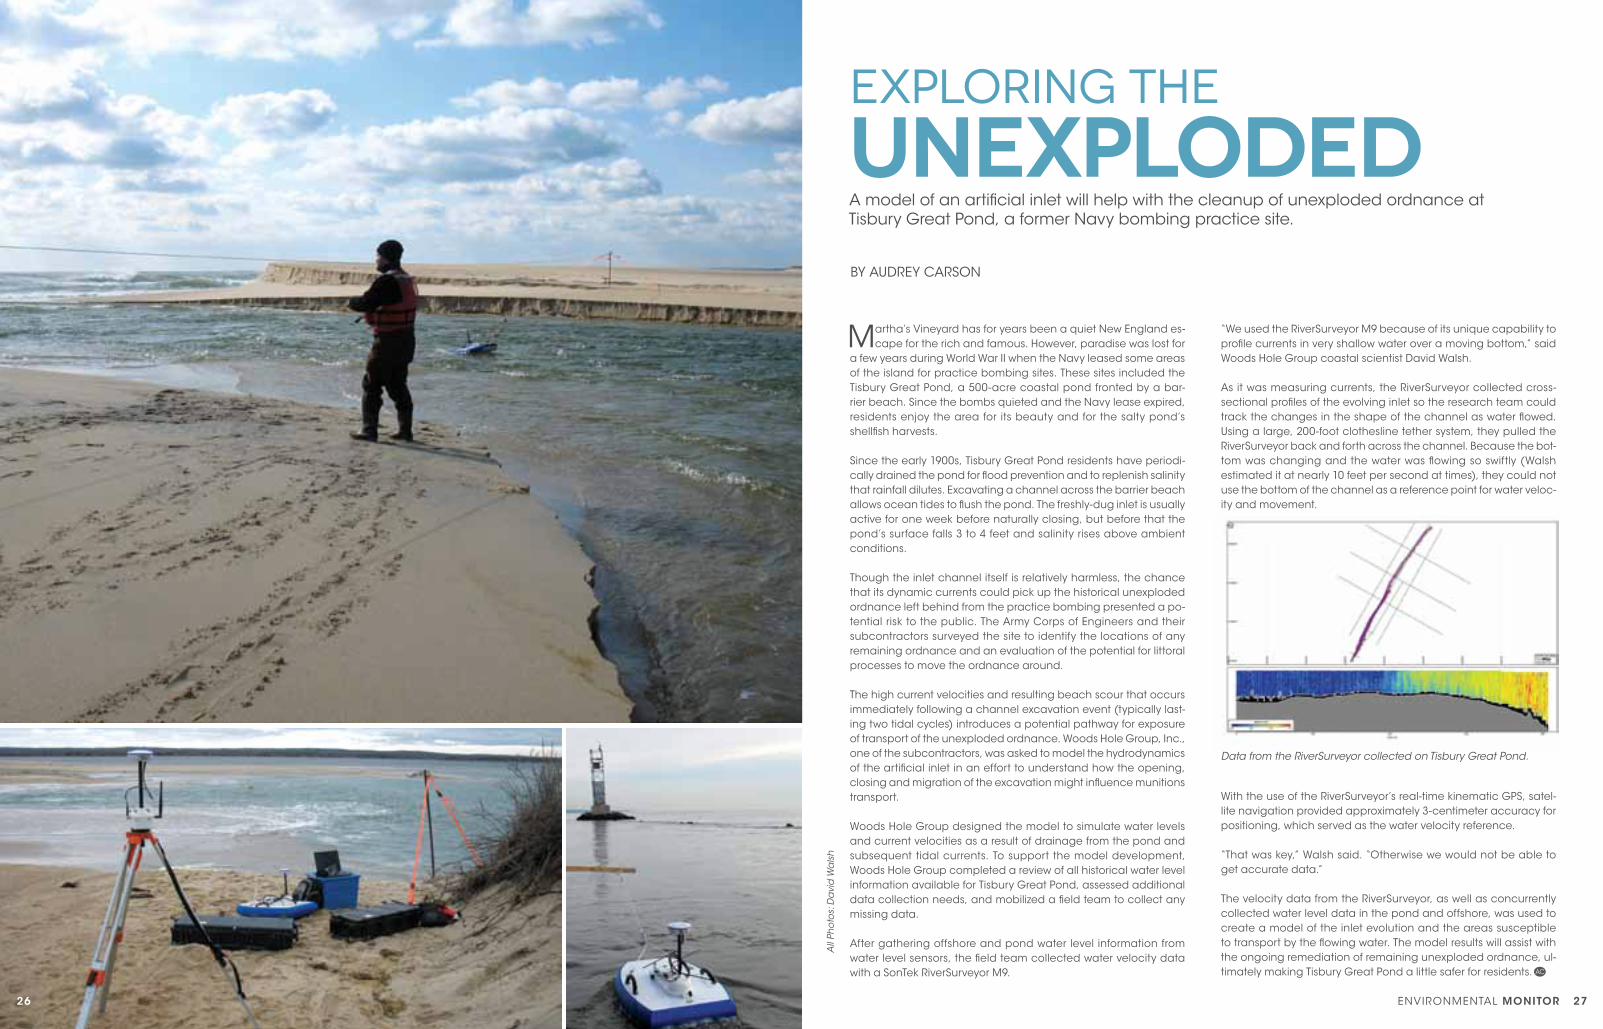
Data from the RiverSurveyor collected on Tisbury Great Pond.
BY AUDREY CARSON
A model of an artificial inlet will help with the cleanup of unexploded ordnance at Tisbury Great Pond, a former Navy bombing practice site.
Martha’s Vineyard has for years been a quiet New England es-cape for the rich and famous. However, paradise was lost for
a few years during World War II when the Navy leased some areas of the island for practice bombing sites. These sites included the Tisbury Great Pond, a 500-acre coastal pond fronted by a bar-rier beach. Since the bombs quieted and the Navy lease expired, residents enjoy the area for its beauty and for the salty pond’s shellfish harvests.
Since the early 1900s, Tisbury Great Pond residents have periodi-cally drained the pond for flood prevention and to replenish salinity that rainfall dilutes. Excavating a channel across the barrier beach allows ocean tides to flush the pond. The freshly-dug inlet is usually active for one week before naturally closing, but before that the pond’s surface falls 3 to 4 feet and salinity rises above ambient conditions.
Though the inlet channel itself is relatively harmless, the chance that its dynamic currents could pick up the historical unexploded ordnance left behind from the practice bombing presented a po-tential risk to the public. The Army Corps of Engineers and their subcontractors surveyed the site to identify the locations of any remaining ordnance and an evaluation of the potential for littoral processes to move the ordnance around.
The high current velocities and resulting beach scour that occurs immediately following a channel excavation event (typically last-ing two tidal cycles) introduces a potential pathway for exposure of transport of the unexploded ordnance. Woods Hole Group, Inc., one of the subcontractors, was asked to model the hydrodynamics of the artificial inlet in an effort to understand how the opening, closing and migration of the excavation might influence munitions transport.
Woods Hole Group designed the model to simulate water levels and current velocities as a result of drainage from the pond and subsequent tidal currents. To support the model development, Woods Hole Group completed a review of all historical water level information available for Tisbury Great Pond, assessed additional data collection needs, and mobilized a field team to collect any missing data.
After gathering offshore and pond water level information from water level sensors, the field team collected water velocity data with a SonTek RiverSurveyor M9.
“We used the RiverSurveyor M9 because of its unique capability to profile currents in very shallow water over a moving bottom,” said Woods Hole Group coastal scientist David Walsh.
As it was measuring currents, the RiverSurveyor collected cross-sectional profiles of the evolving inlet so the research team could track the changes in the shape of the channel as water flowed. Using a large, 200-foot clothesline tether system, they pulled the RiverSurveyor back and forth across the channel. Because the bot-tom was changing and the water was flowing so swiftly (Walsh estimated it at nearly 10 feet per second at times), they could not use the bottom of the channel as a reference point for water veloc-ity and movement.
ExplorINg thE
Unexploded
All
Pho
tos:
Da
vid
Wa
lsh
With the use of the RiverSurveyor’s real-time kinematic GPS, satel-lite navigation provided approximately 3-centimeter accuracy for positioning, which served as the water velocity reference.
“That was key,” Walsh said. “Otherwise we would not be able to get accurate data.”
The velocity data from the RiverSurveyor, as well as concurrently collected water level data in the pond and offshore, was used to create a model of the inlet evolution and the areas susceptible to transport by the flowing water. The model results will assist with the ongoing remediation of remaining unexploded ordnance, ul-timately making Tisbury Great Pond a little safer for residents.
BY JEFF GILLIES
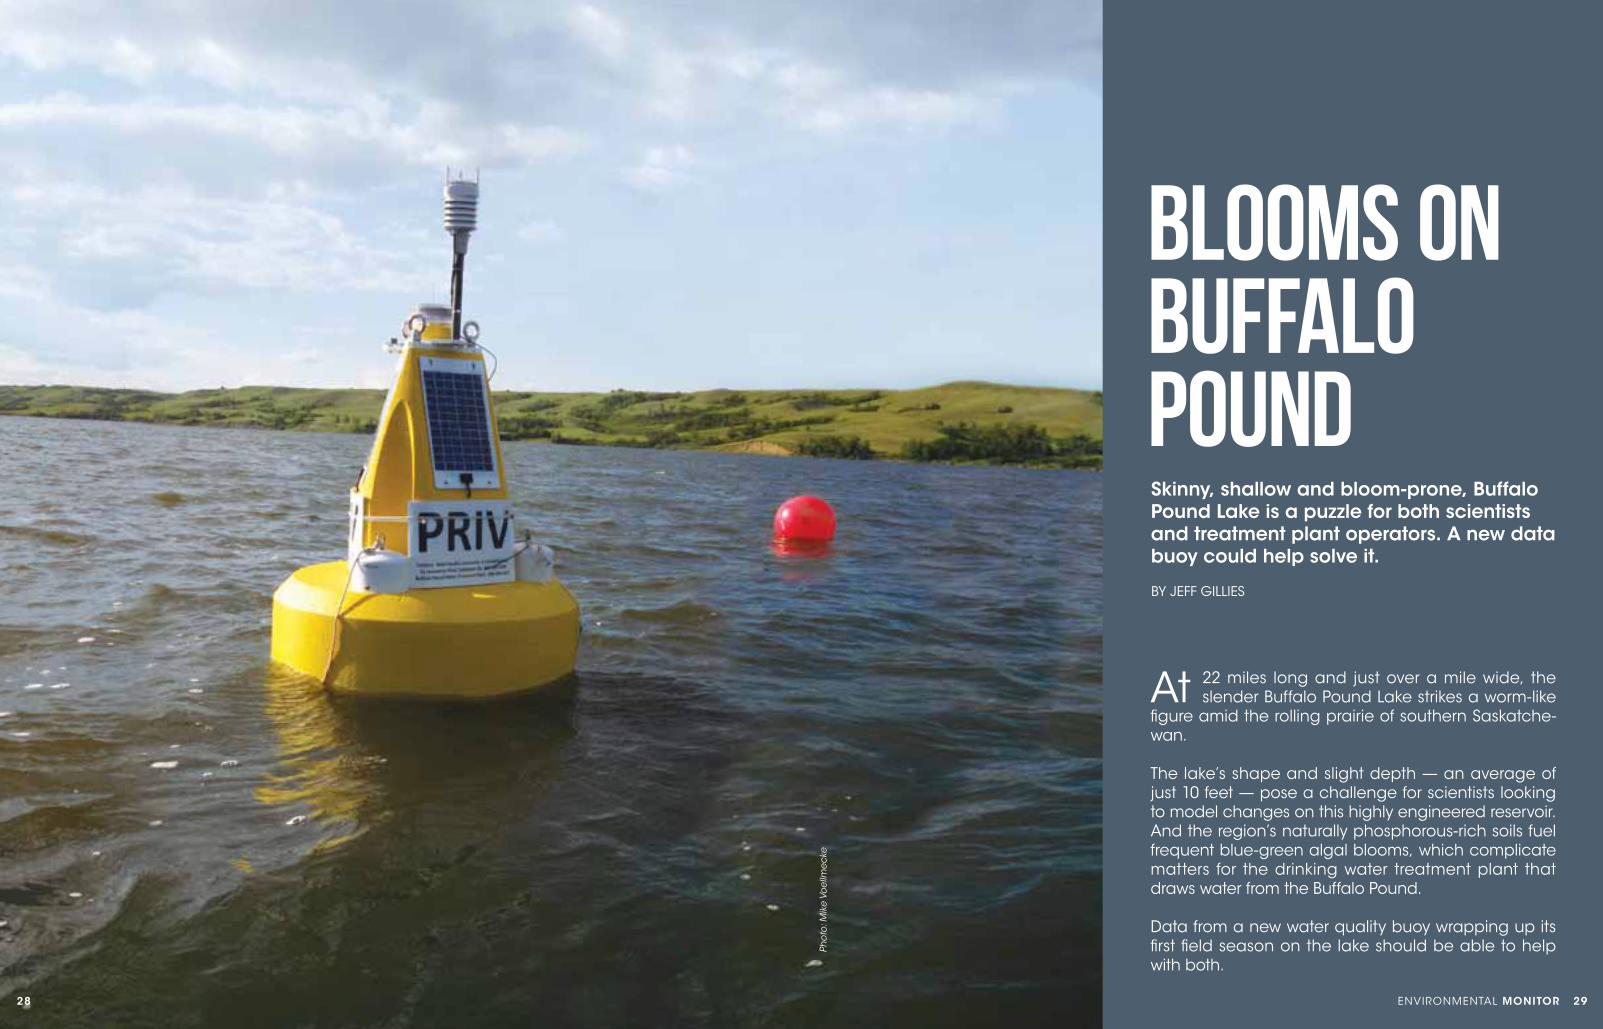
Skinny, shallow and bloom-prone, Buffalo Pound Lake is a puzzle for both scientists and treatment plant operators. A new data buoy could help solve it.
28 ENVIRONMENTAL MONITOR 29
Pho
to: M
ike
Voel
lmec
ke
At 22 miles long and just over a mile wide, the slender Buffalo Pound Lake strikes a worm-like
figure amid the rolling prairie of southern Saskatche-wan.
The lake’s shape and slight depth — an average of just 10 feet — pose a challenge for scientists looking to model changes on this highly engineered reservoir. And the region’s naturally phosphorous-rich soils fuel frequent blue-green algal blooms, which complicate matters for the drinking water treatment plant that draws water from the Buffalo Pound.
Data from a new water quality buoy wrapping up its first field season on the lake should be able to help with both.
BLOOMS On BUFFALO POUnD
30
Dia
gra
m: N
ate
Ch
risto
ph
er
above the buoy measures meteorological parameters like wind speed and direction. Those data will be especially useful in sussing out the effects of winds on blooms. When the wind is perpendicu-lar to the lake, which lies in a valley, blooms are more likely, Baulch said. When it’s parallel to the lake, the conditions are too turbulent.
Beyond the blooms, the data could help scientists better model Buffalo Pound Lake and other shallow lakes across the prairie. The lakes have an unusual wind fetch effect and hold ice cover for up to six months a year, neither of which fit well with past modeling strategies.
“We really need to adapt our modeling to try to understand those conditions as well,” Baulch said.
The region’s snowmelt-dominated runoff leads to significant water level fluctuations in most lakes, but Buffalo Pound Lake stays stable because managers have complete control over the reservoir’s major inflow. But change can still happen. Baulch says there’s a plan underway to ramp up flows through the lake to support potash mine development downstream. The buoy will help sort out how that affects water chemistry in the reservoir.
On top of all that, the researchers are also interested in learning more about measuring productivity with carbon dioxide sensors versus oxygen sensors. And they’ll work with GLEON, the Global Lakes Ecological Observatory Network, to share their data and try to get at more global-scale questions that you can only answer by comparing responses across different lakes.
“I think there’s a million options for things we can do with the data,” she said.
Helen Baulch, here on Buffalo Pound Lake, is a lead investigator on the buoy project.
Paleolimnological studies and early reports suggest that lakes in the region have produced blooms long before intensive ag-riculture exacerbated erosion, according to Helen Baulch, an assistant professor at the University of Saskatchewan’s School of Environment and Sustainability. Algal growth isn’t just a problem for Buffalo Pound Lake. Any standing water on the region’s prairies is vulnerable.
“Every year, farmers who have dugouts will have blue-green algal blooms, and you’ll hear about cattle deaths or dogs getting sick,” said Baulch, a lead investigator on the buoy project.
But the issue is magnified on Buffalo Pound Lake, the source of drinking water for roughly a quarter of the province’s population living in Moose Jaw and Regina. The Buffalo Pound Water Treat-ment Plant’s work keeping that water tasty and above standards gets more difficult during the lake’s algae blooms.
For one, the algae produce the chemical compound geosmin, which can affect the taste and smell of water at extremely low con-centrations. Plant workers remove geosmin by running the water through activated carbon, which costs money and takes time.
The blooms are also associated with elevated pH and dissolved gasses which affect treatment processes such as alum applica-tions. The buoy data will give operators a look at chlorophyll, pH, oxygen and carbon dioxide levels in the water a few hours before it hits the plant, giving them a chance to fine-tune their procedures and potentially reduce costs.
The buoy, which came out of the lake in October ahead of the ice, also measures water temperature and photosynthetically active radiation to gauge light penetration. A weather sensor mounted
Pho
to: M
ike
Voel
lmec
ke
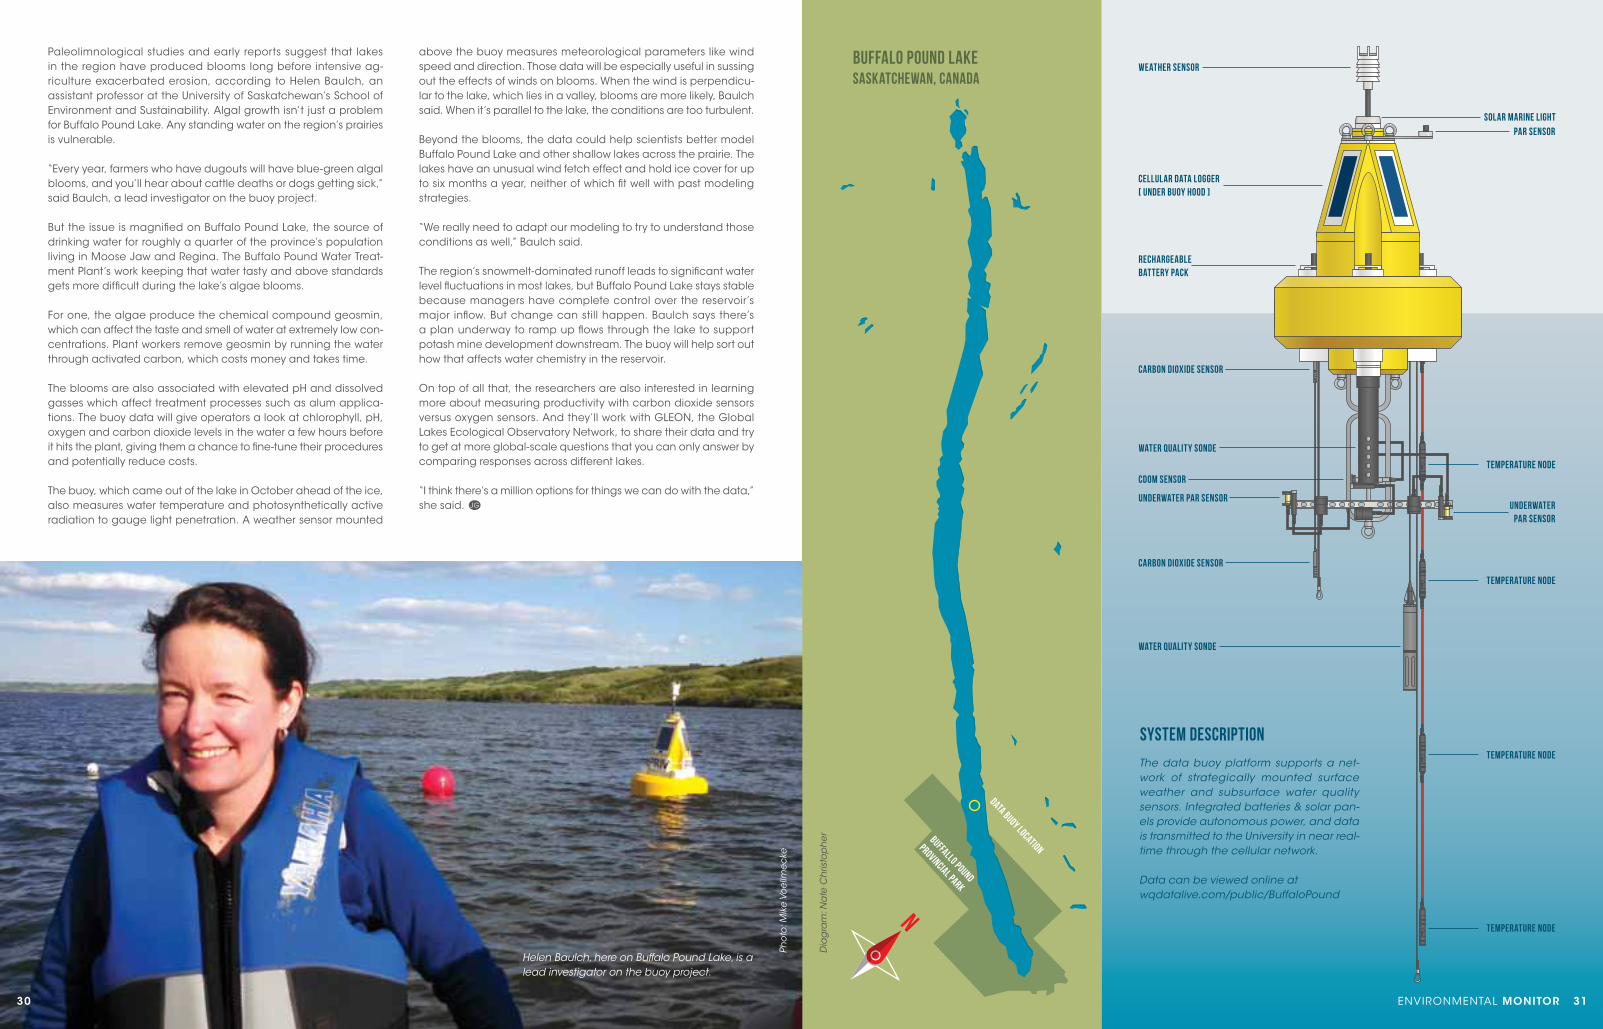
The data buoy platform supports a net-work of strategically mounted surface weather and subsurface water quality sensors. Integrated batteries & solar pan-els provide autonomous power, and data is transmitted to the University in near real-time through the cellular network.
Data can be viewed online atwqdatalive.com/public/BuffaloPound
CELLULAR DATA LOGGER[ UnDER BUOY HOOD ]
WEATHER SEnSORBuffalo Pound LakeSaskatchewan, Canada
SYSTEM DESCRIPTIOn
WATER QUALITY SOnDE
CARBOn DIOXIDE SEnSOR
CARBOn DIOXIDE SEnSOR
Underwater par SEnSORUnderwater
par SEnSOR
DATA BUOY LOCATIOn
Buffallo Pound
Provincial Park
Temperature nODE
Temperature nODE
Temperature nODE
Temperature nODE
Solar marine light
PAR SEnSOR
RECHARGEABLEBATTERY PACK
WATER QUALITY SOnDE
CDOM SEnSOR
ENVIRONMENTAL MONITOR 31
32 ENVIRONMENTAL MONITOR 33
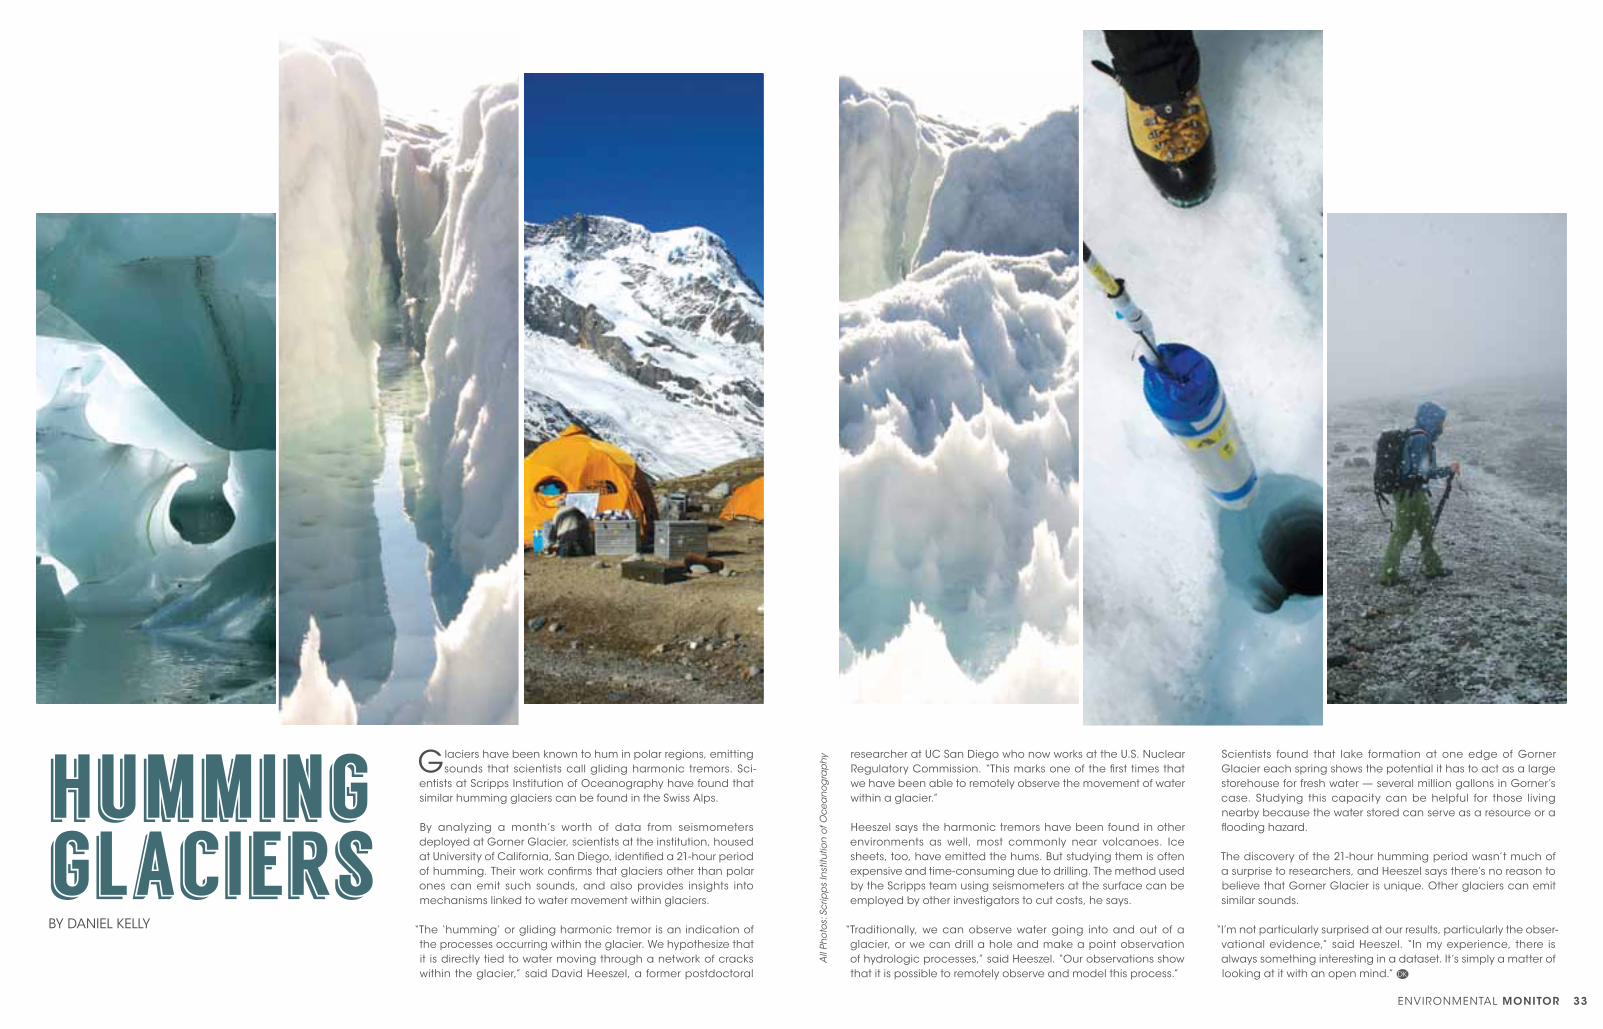
Glaciers have been known to hum in polar regions, emitting sounds that scientists call gliding harmonic tremors. Sci-
entists at Scripps Institution of Oceanography have found that similar humming glaciers can be found in the Swiss Alps.
By analyzing a month’s worth of data from seismometers deployed at Gorner Glacier, scientists at the institution, housed at University of California, San Diego, identified a 21-hour period of humming. Their work confirms that glaciers other than polar ones can emit such sounds, and also provides insights into mechanisms linked to water movement within glaciers.
“The ‘humming’ or gliding harmonic tremor is an indication of the processes occurring within the glacier. We hypothesize that it is directly tied to water moving through a network of cracks within the glacier,” said David Heeszel, a former postdoctoral
researcher at UC San Diego who now works at the U.S. Nuclear Regulatory Commission. “This marks one of the first times that we have been able to remotely observe the movement of water within a glacier.”
Heeszel says the harmonic tremors have been found in other environments as well, most commonly near volcanoes. Ice sheets, too, have emitted the hums. But studying them is often expensive and time-consuming due to drilling. The method used by the Scripps team using seismometers at the surface can be employed by other investigators to cut costs, he says.
“Traditionally, we can observe water going into and out of a glacier, or we can drill a hole and make a point observation of hydrologic processes,” said Heeszel. “Our observations show that it is possible to remotely observe and model this process.”
humming glaciersBY DANIEL KELLY
Scientists found that lake formation at one edge of Gorner Glacier each spring shows the potential it has to act as a large storehouse for fresh water — several million gallons in Gorner’s case. Studying this capacity can be helpful for those living nearby because the water stored can serve as a resource or a flooding hazard.
The discovery of the 21-hour humming period wasn’t much of a surprise to researchers, and Heeszel says there’s no reason to believe that Gorner Glacier is unique. Other glaciers can emit similar sounds.
“I’m not particularly surprised at our results, particularly the obser-vational evidence,” said Heeszel. “In my experience, there is always something interesting in a dataset. It’s simply a matter of looking at it with an open mind.”
All
Pho
tos:
Scr
ipp
s In
stitu
tion
of O
cea
no
gra
phy
34 ENVIRONMENTAL MONITOR 35
Information from:National Snow & Ice Data Center
nsidc.org
NOAA / NASA 2013 Global Temperaturesnasa.gov
United States Environmental Protection Agencyepa.gov/climatechange
European Space Agencyesa.int/Our_Activities/Observing_the_Earth/CryoSat
National Science Foundationnsf.gov/about/history/nsf0050/arctic/seaice.htm
PoLar IcE
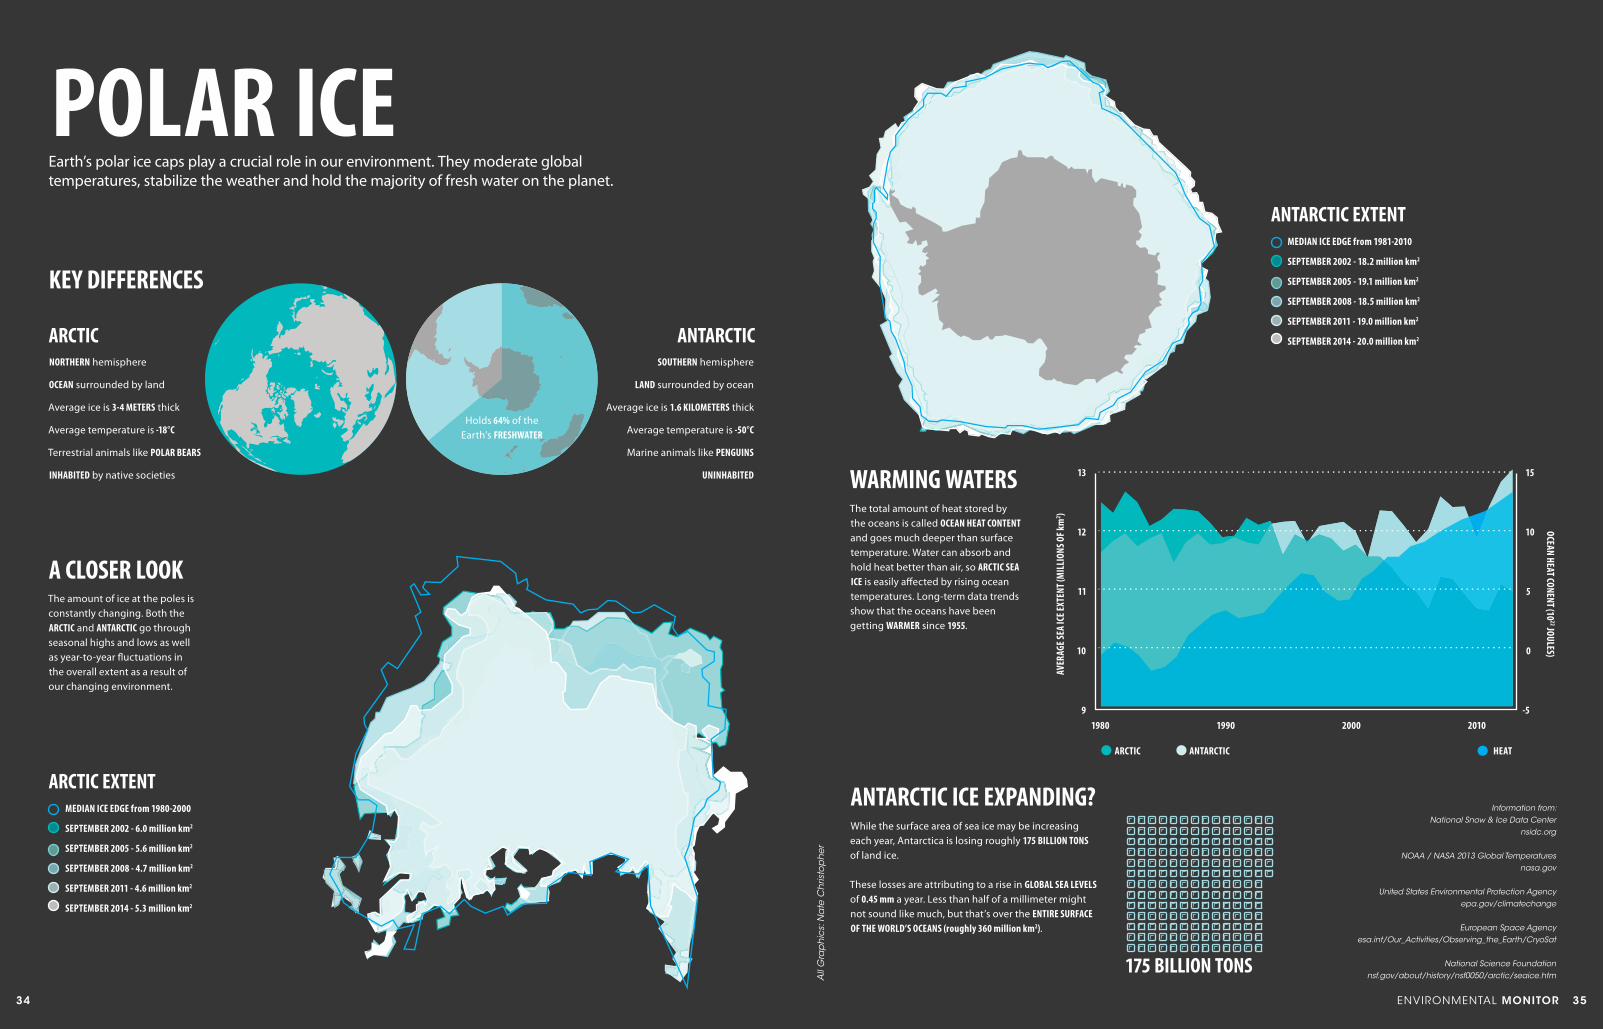
The amount of ice at the poles is constantly changing. Both the arcTIc and anTarcTIc go through seasonal highs and lows as well as year-to-year fluctuations in the overall extent as a result of our changing environment.
The total amount of heat stored by the oceans is called ocEan HEaT conTEnT and goes much deeper than surface temperature. Water can absorb and hold heat better than air, so arcTIc SEa IcE is easily affected by rising ocean temperatures. Long-term data trends show that the oceans have been getting WarMEr since 1955.
While the surface area of sea ice may be increasing each year, Antarctica is losing roughly 175 BILLIon TonS of land ice.
These losses are attributing to a rise in GLoBaL SEa LEVELS of 0.45 mm a year. Less than half of a millimeter might not sound like much, but that’s over the EnTIrE SurFacE oF THE WorLD’S ocEanS (roughly 360 million km2).
norTHErn hemisphere
ocEan surrounded by land
Average ice is 3-4 METErS thick
Average temperature is -18°c
Terrestrial animals like PoLar BEarS
InHaBITED by native societies
SouTHErn hemisphere
LanD surrounded by ocean
Average ice is 1.6 KILoMETErS thick
Average temperature is -50°c
marine animals like PEnGuInS
unInHaBITED
MEDIan IcE EDGE from 1980-2000
SEPTEMBEr 2002 - 6.0 million km2
SEPTEMBEr 2005 - 5.6 million km2
SEPTEMBEr 2008 - 4.7 million km2
SEPTEMBEr 2011 - 4.6 million km2
SEPTEMBEr 2014 - 5.3 million km2
MEDIan IcE EDGE from 1981-2010
SEPTEMBEr 2002 - 18.2 million km2
SEPTEMBEr 2005 - 19.1 million km2
SEPTEMBEr 2008 - 18.5 million km2
SEPTEMBEr 2011 - 19.0 million km2
SEPTEMBEr 2014 - 20.0 million km2
9 -5
13 15
12 10
11 5
ocEan HEaT conEnT (1022 JouLES)
aVEr
aGE S
Ea Ic
E EXT
EnT (
MIL
LIon
S oF k
m2 )
10 0
arcTIc EXTEnT
anTarcTIc EXTEnT
KEY DIFFErEncES
a cLoSEr LooK
WarMInG WaTErS
175 BILLIon TonS
anTarcTIc IcE EXPanDInG?
arcTIc anTarcTIc
19901980 2000
arcTIc anTarcTIc HEaT
2010
Holds 64% of the Earth’s FrESHWaTEr
Earth’s polar ice caps play a crucial role in our environment. They moderate global temperatures, stabilize the weather and hold the majority of fresh water on the planet.
All
Gra
ph
ics:
Na
te C
hris
top
her
All
Pho
tos:
Ka
rl Fl
essa
All
Pho
tos:
Ka
rl Fl
essa
36 ENVIRONMENTAL MONITOR 37
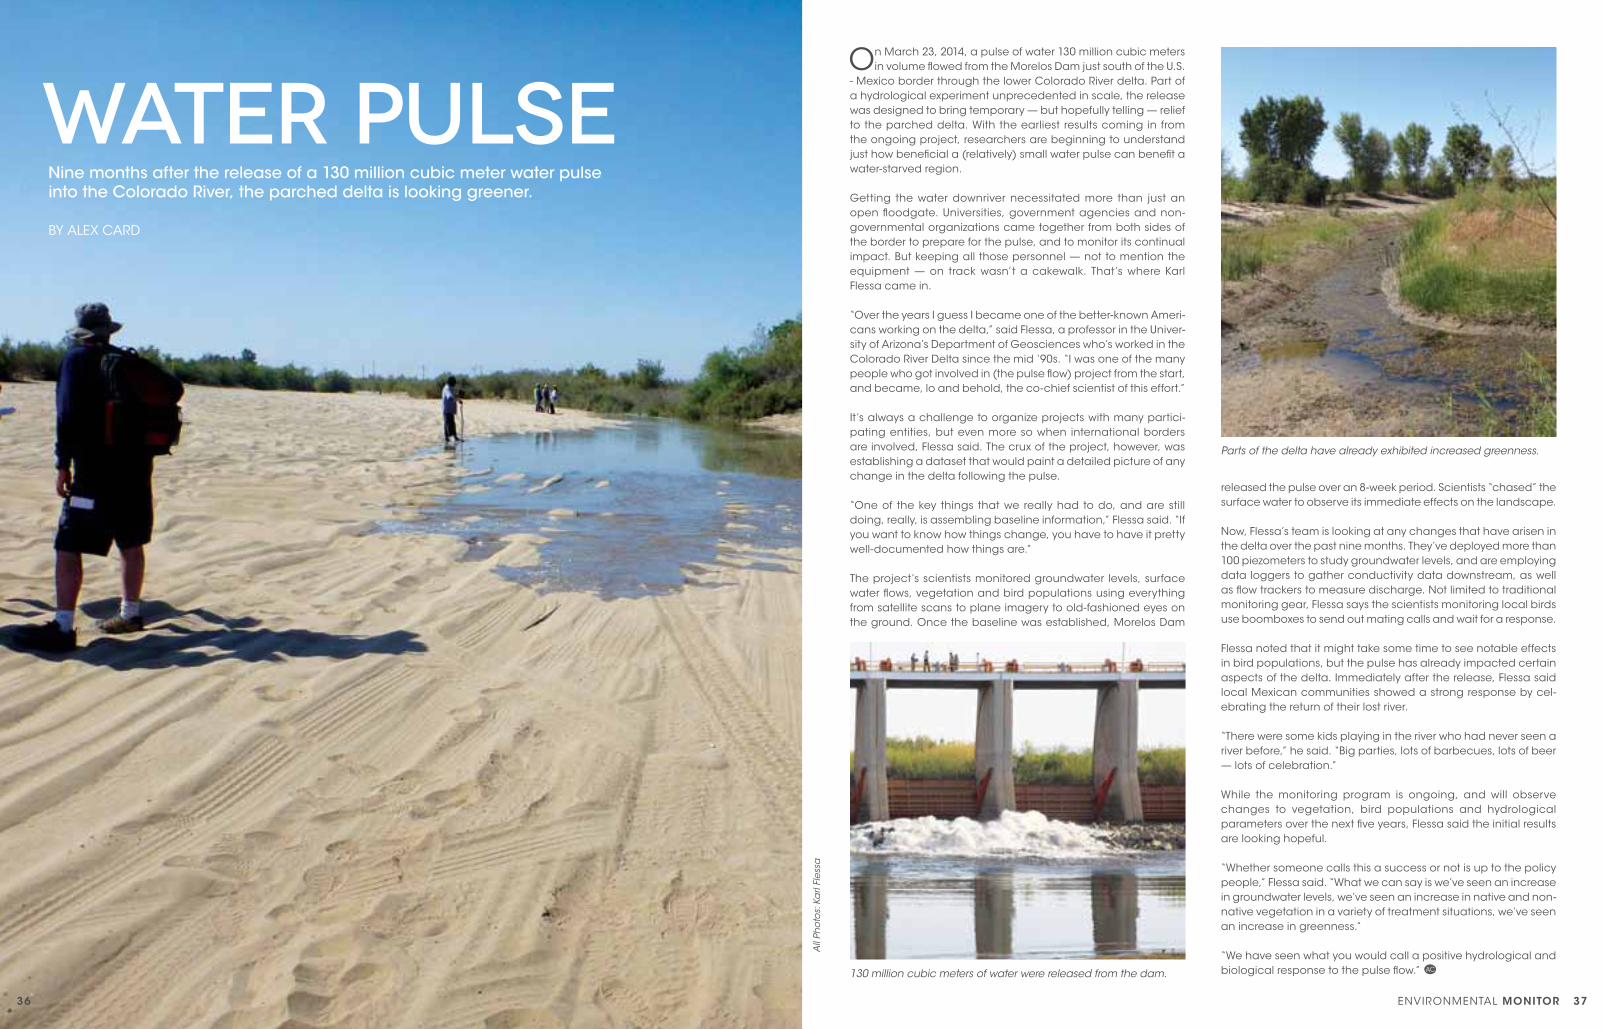
On March 23, 2014, a pulse of water 130 million cubic meters in volume flowed from the Morelos Dam just south of the U.S.
- Mexico border through the lower Colorado River delta. Part of a hydrological experiment unprecedented in scale, the release was designed to bring temporary — but hopefully telling — relief to the parched delta. With the earliest results coming in from the ongoing project, researchers are beginning to understand just how beneficial a (relatively) small water pulse can benefit a water-starved region.
Getting the water downriver necessitated more than just an open floodgate. Universities, government agencies and non-governmental organizations came together from both sides of the border to prepare for the pulse, and to monitor its continual impact. But keeping all those personnel — not to mention the equipment — on track wasn’t a cakewalk. That’s where Karl Flessa came in.
“Over the years I guess I became one of the better-known Ameri-cans working on the delta,” said Flessa, a professor in the Univer-sity of Arizona’s Department of Geosciences who’s worked in the Colorado River Delta since the mid ‘90s. “I was one of the many people who got involved in (the pulse flow) project from the start, and became, lo and behold, the co-chief scientist of this effort.”
It’s always a challenge to organize projects with many partici-pating entities, but even more so when international borders are involved, Flessa said. The crux of the project, however, was establishing a dataset that would paint a detailed picture of any change in the delta following the pulse.
“One of the key things that we really had to do, and are still doing, really, is assembling baseline information,” Flessa said. “If you want to know how things change, you have to have it pretty well-documented how things are.”
The project’s scientists monitored groundwater levels, surface water flows, vegetation and bird populations using everything from satellite scans to plane imagery to old-fashioned eyes on the ground. Once the baseline was established, Morelos Dam
released the pulse over an 8-week period. Scientists “chased” the surface water to observe its immediate effects on the landscape.
Now, Flessa’s team is looking at any changes that have arisen in the delta over the past nine months. They’ve deployed more than 100 piezometers to study groundwater levels, and are employing data loggers to gather conductivity data downstream, as well as flow trackers to measure discharge. Not limited to traditional monitoring gear, Flessa says the scientists monitoring local birds use boomboxes to send out mating calls and wait for a response.
Flessa noted that it might take some time to see notable effects in bird populations, but the pulse has already impacted certain aspects of the delta. Immediately after the release, Flessa said local Mexican communities showed a strong response by cel-ebrating the return of their lost river.
“There were some kids playing in the river who had never seen a river before,” he said. “Big parties, lots of barbecues, lots of beer — lots of celebration.”
While the monitoring program is ongoing, and will observe changes to vegetation, bird populations and hydrological parameters over the next five years, Flessa said the initial results are looking hopeful.
“Whether someone calls this a success or not is up to the policy people,” Flessa said. “What we can say is we’ve seen an increase in groundwater levels, we’ve seen an increase in native and non-native vegetation in a variety of treatment situations, we’ve seen an increase in greenness.”
“We have seen what you would call a positive hydrological and biological response to the pulse flow.”
BY ALEX CARD
Nine months after the release of a 130 million cubic meter water pulse into the Colorado River, the parched delta is looking greener.
Water Pulse
130 million cubic meters of water were released from the dam.
Parts of the delta have already exhibited increased greenness.
38 ENVIRONMENTAL MONITOR 39
BY DANIEL KELLY
As part of IBM’s Smarter Planet initiative, the company has poured millions into projects
around the world to test out some of its new tech-nologies and has gotten some good clippings in the press along the way. One well-known offshoot
of this effort is Watson, the computer that famously beat human opponents at Jeopardy.
But the initiative goes much farther than Watson, and some of the same engineers who worked on the
supercomputer project have already turned their eyes to another one: the Jefferson Project, a joint effort between IBM, The FUND for Lake George and the Rensselaer Polytechnic Insti-tute that is pushing the limits on lake monitoring.
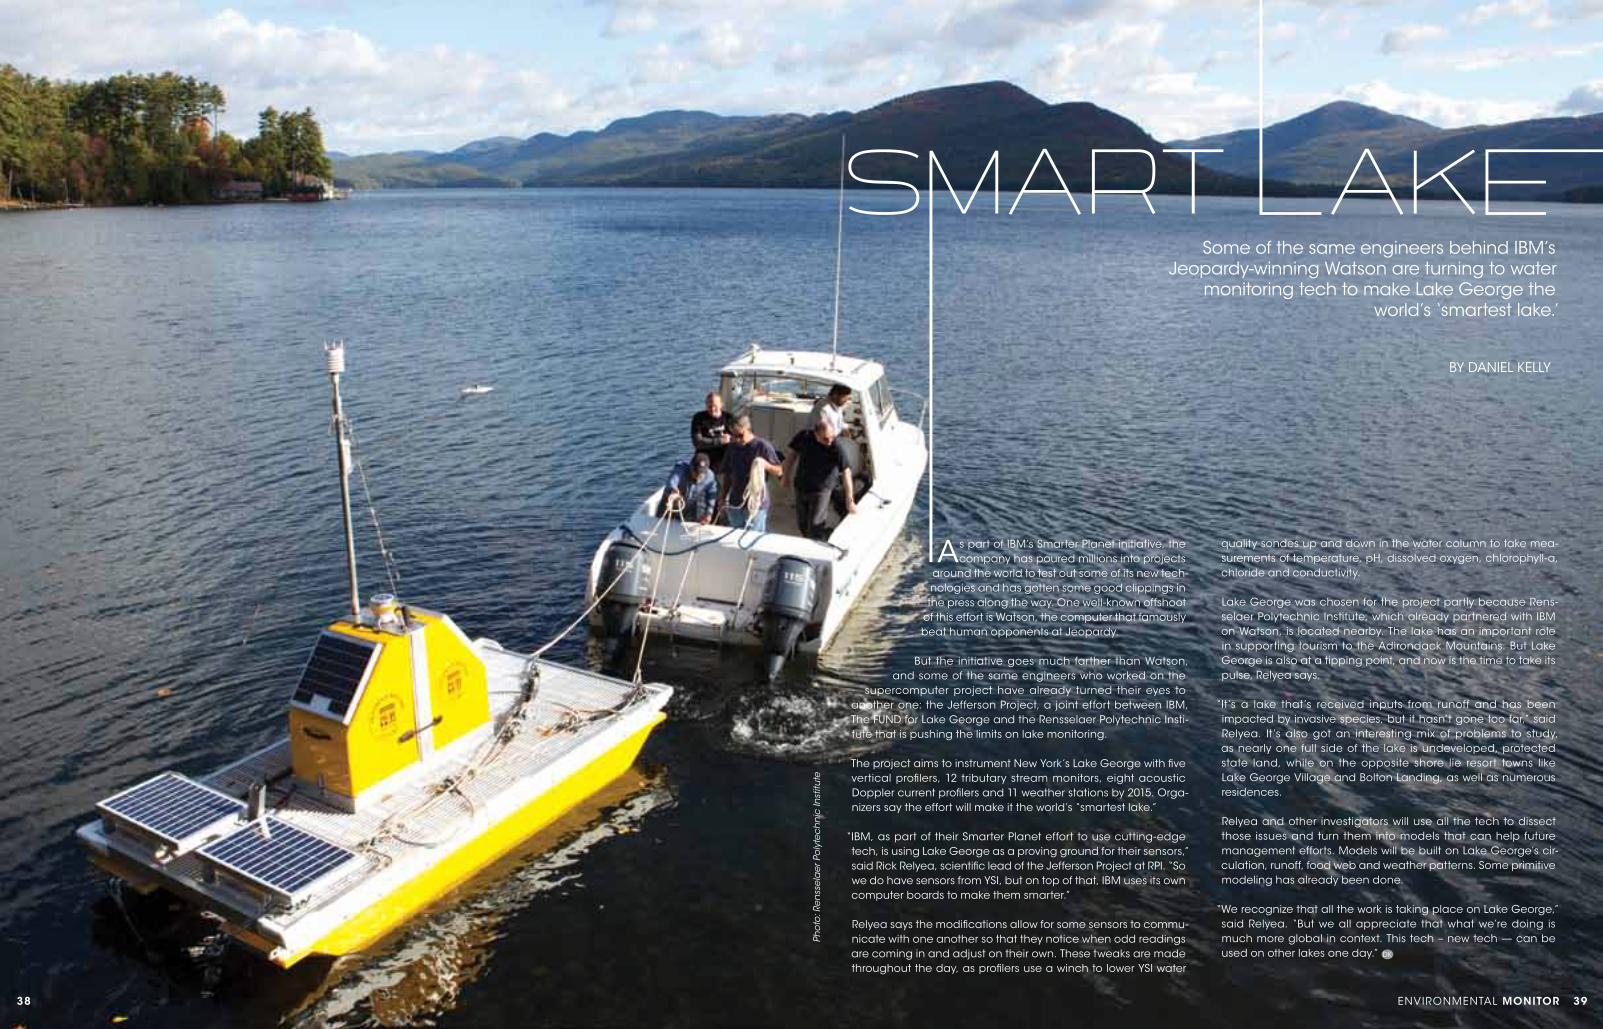
The project aims to instrument New York’s Lake George with five vertical profilers, 12 tributary stream monitors, eight acoustic Doppler current profilers and 11 weather stations by 2015. Orga-nizers say the effort will make it the world’s “smartest lake.”
“IBM, as part of their Smarter Planet effort to use cutting-edge tech, is using Lake George as a proving ground for their sensors,” said Rick Relyea, scientific lead of the Jefferson Project at RPI. “So we do have sensors from YSI, but on top of that, IBM uses its own computer boards to make them smarter.”
Relyea says the modifications allow for some sensors to commu-nicate with one another so that they notice when odd readings are coming in and adjust on their own. These tweaks are made throughout the day, as profilers use a winch to lower YSI water
quality sondes up and down in the water column to take mea-surements of temperature, pH, dissolved oxygen, chlorophyll-a, chloride and conductivity.
Lake George was chosen for the project partly because Rens-selaer Polytechnic Institute, which already partnered with IBM on Watson, is located nearby. The lake has an important role in supporting tourism to the Adirondack Mountains. But Lake George is also at a tipping point, and now is the time to take its pulse, Relyea says.
“It’s a lake that’s received inputs from runoff and has been impacted by invasive species, but it hasn’t gone too far,” said Relyea. It’s also got an interesting mix of problems to study, as nearly one full side of the lake is undeveloped, protected state land, while on the opposite shore lie resort towns like Lake George Village and Bolton Landing, as well as numerous residences.
Relyea and other investigators will use all the tech to dissect those issues and turn them into models that can help future management efforts. Models will be built on Lake George’s cir-culation, runoff, food web and weather patterns. Some primitive modeling has already been done.
“We recognize that all the work is taking place on Lake George,” said Relyea. “But we all appreciate that what we’re doing is much more global in context. This tech – new tech — can be used on other lakes one day.”
Some of the same engineers behind IBM’s Jeopardy-winning Watson are turning to water
monitoring tech to make Lake George the world’s ‘smartest lake.’
Pho
to: R
enss
ela
er P
oly
tech
nic
Inst
itute
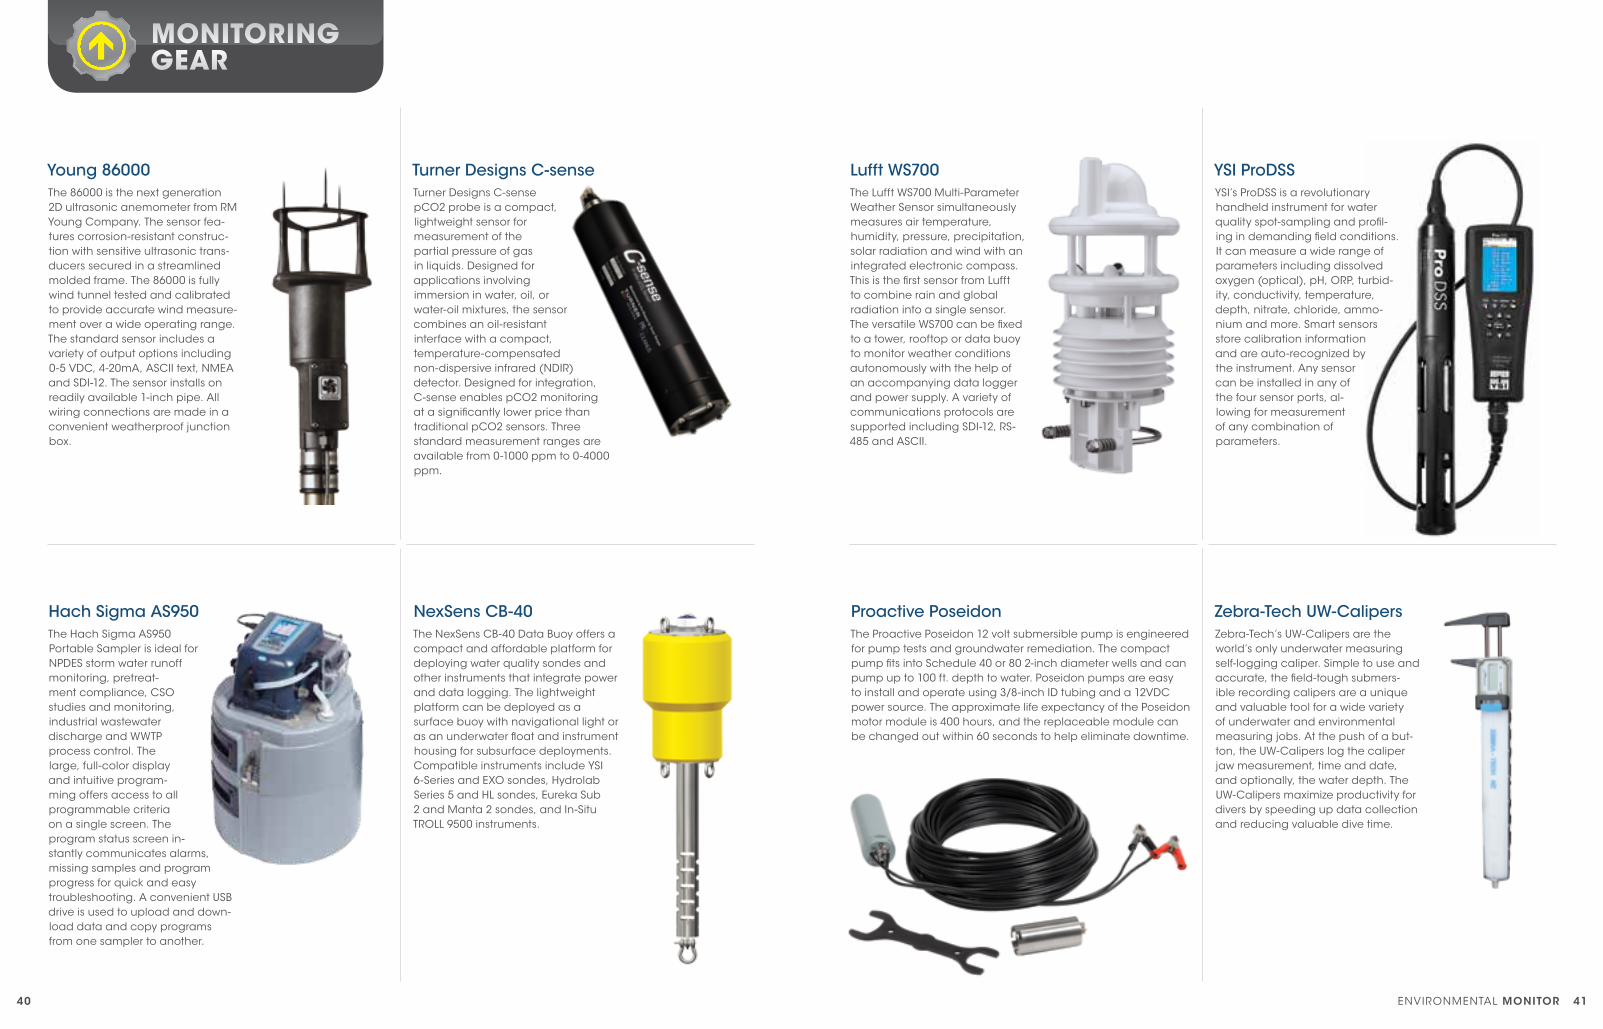
The 86000 is the next generation 2D ultrasonic anemometer from RM Young Company. The sensor fea-tures corrosion-resistant construc-tion with sensitive ultrasonic trans-ducers secured in a streamlined molded frame. The 86000 is fully wind tunnel tested and calibrated to provide accurate wind measure-ment over a wide operating range. The standard sensor includes a variety of output options including 0-5 VDC, 4-20mA, ASCII text, NMEA and SDI-12. The sensor installs on readily available 1-inch pipe. All wiring connections are made in a convenient weatherproof junction box.
The Lufft WS700 Multi-Parameter Weather Sensor simultaneously measures air temperature, humidity, pressure, precipitation, solar radiation and wind with an integrated electronic compass. This is the first sensor from Lufft to combine rain and global radiation into a single sensor. The versatile WS700 can be fixed to a tower, rooftop or data buoy to monitor weather conditions autonomously with the help of an accompanying data logger and power supply. A variety of communications protocols are supported including SDI-12, RS-485 and ASCII.
Turner Designs C-sense pCO2 probe is a compact, lightweight sensor for measurement of the partial pressure of gas in liquids. Designed for applications involving immersion in water, oil, or water-oil mixtures, the sensor combines an oil-resistant interface with a compact, temperature-compensated non-dispersive infrared (NDIR) detector. Designed for integration, C-sense enables pCO2 monitoring at a significantly lower price than traditional pCO2 sensors. Three standard measurement ranges are available from 0-1000 ppm to 0-4000 ppm.
YSI’s ProDSS is a revolutionary handheld instrument for water quality spot-sampling and profil-ing in demanding field conditions. It can measure a wide range of parameters including dissolved oxygen (optical), pH, ORP, turbid-ity, conductivity, temperature, depth, nitrate, chloride, ammo-nium and more. Smart sensors store calibration information and are auto-recognized by the instrument. Any sensor can be installed in any of the four sensor ports, al-lowing for measurement of any combination of parameters.
The Hach Sigma AS950 Portable Sampler is ideal for NPDES storm water runoff monitoring, pretreat-ment compliance, CSO studies and monitoring, industrial wastewater discharge and WWTP process control. The large, full-color display and intuitive program-ming offers access to all programmable criteria on a single screen. The program status screen in-stantly communicates alarms, missing samples and program progress for quick and easy troubleshooting. A convenient USB drive is used to upload and down-load data and copy programs from one sampler to another.
Zebra-Tech’s UW-Calipers are the world’s only underwater measuring self-logging caliper. Simple to use and accurate, the field-tough submers-ible recording calipers are a unique and valuable tool for a wide variety of underwater and environmental measuring jobs. At the push of a but-ton, the UW-Calipers log the caliper jaw measurement, time and date, and optionally, the water depth. The UW-Calipers maximize productivity for divers by speeding up data collection and reducing valuable dive time.
The NexSens CB-40 Data Buoy offers a compact and affordable platform for deploying water quality sondes and other instruments that integrate power and data logging. The lightweight platform can be deployed as a surface buoy with navigational light or as an underwater float and instrument housing for subsurface deployments. Compatible instruments include YSI 6-Series and EXO sondes, Hydrolab Series 5 and HL sondes, Eureka Sub 2 and Manta 2 sondes, and In-Situ TROLL 9500 instruments.
The Proactive Poseidon 12 volt submersible pump is engineered for pump tests and groundwater remediation. The compact pump fits into Schedule 40 or 80 2-inch diameter wells and can pump up to 100 ft. depth to water. Poseidon pumps are easy to install and operate using 3/8-inch ID tubing and a 12VDC power source. The approximate life expectancy of the Poseidon motor module is 400 hours, and the replaceable module can be changed out within 60 seconds to help eliminate downtime.
Young 86000 Lufft WS700Turner Designs C-sense YSI ProDSS
Hach Sigma AS950 Zebra-Tech UW-CalipersNexSens CB-40 Proactive Poseidon
MOnITORInggeaR
40 ENVIRONMENTAL MONITOR 41
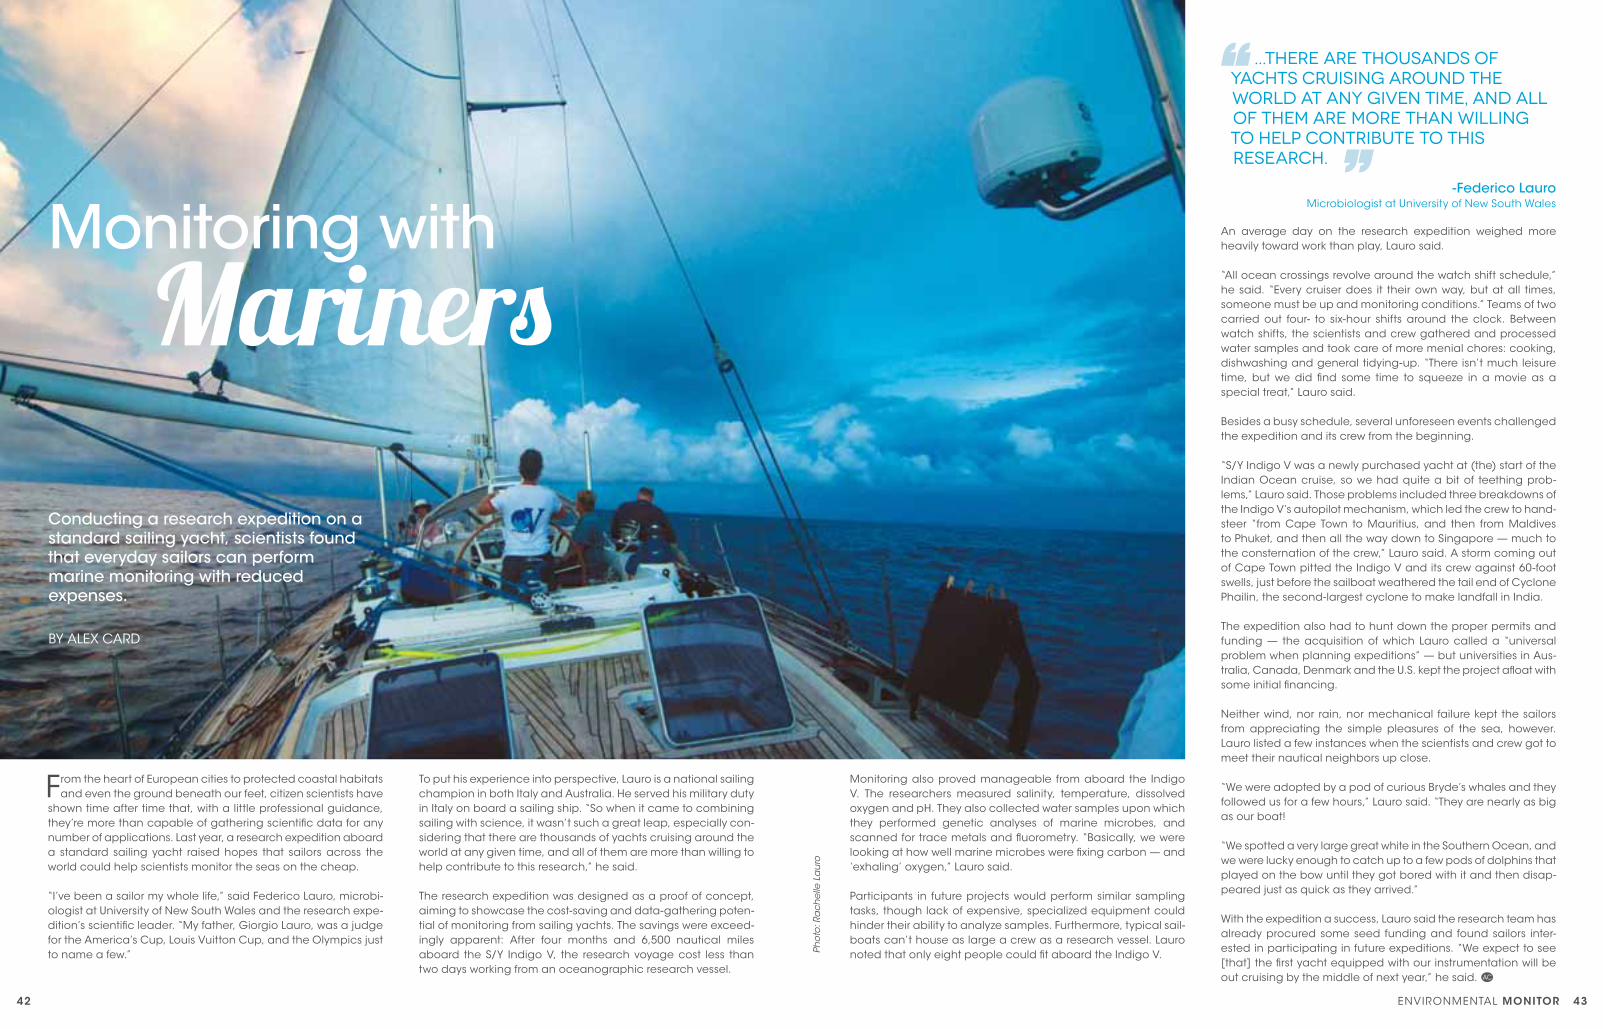
42 ENVIRONMENTAL MONITOR 43
Pho
to: R
ach
elle
La
uro
From the heart of European cities to protected coastal habitats and even the ground beneath our feet, citizen scientists have
shown time after time that, with a little professional guidance, they’re more than capable of gathering scientific data for any number of applications. Last year, a research expedition aboard a standard sailing yacht raised hopes that sailors across the world could help scientists monitor the seas on the cheap.
“I’ve been a sailor my whole life,” said Federico Lauro, microbi-ologist at University of New South Wales and the research expe-dition’s scientific leader. “My father, Giorgio Lauro, was a judge for the America’s Cup, Louis Vuitton Cup, and the Olympics just to name a few.”
To put his experience into perspective, Lauro is a national sailing champion in both Italy and Australia. He served his military duty in Italy on board a sailing ship. “So when it came to combining sailing with science, it wasn’t such a great leap, especially con-sidering that there are thousands of yachts cruising around the world at any given time, and all of them are more than willing to help contribute to this research,” he said.
The research expedition was designed as a proof of concept, aiming to showcase the cost-saving and data-gathering poten-tial of monitoring from sailing yachts. The savings were exceed-ingly apparent: After four months and 6,500 nautical miles aboard the S/Y Indigo V, the research voyage cost less than two days working from an oceanographic research vessel.
Monitoring with
Mariners
BY ALEX CARD
Conducting a research expedition on a standard sailing yacht, scientists found that everyday sailors can perform marine monitoring with reduced expenses.
Monitoring also proved manageable from aboard the Indigo V. The researchers measured salinity, temperature, dissolved oxygen and pH. They also collected water samples upon which they performed genetic analyses of marine microbes, and scanned for trace metals and fluorometry. “Basically, we were looking at how well marine microbes were fixing carbon — and ‘exhaling’ oxygen,” Lauro said.
Participants in future projects would perform similar sampling tasks, though lack of expensive, specialized equipment could hinder their ability to analyze samples. Furthermore, typical sail-boats can’t house as large a crew as a research vessel. Lauro noted that only eight people could fit aboard the Indigo V.
An average day on the research expedition weighed more heavily toward work than play, Lauro said.
“All ocean crossings revolve around the watch shift schedule,” he said. “Every cruiser does it their own way, but at all times, someone must be up and monitoring conditions.” Teams of two carried out four- to six-hour shifts around the clock. Between watch shifts, the scientists and crew gathered and processed water samples and took care of more menial chores: cooking, dishwashing and general tidying-up. “There isn’t much leisure time, but we did find some time to squeeze in a movie as a special treat,” Lauro said.
Besides a busy schedule, several unforeseen events challenged the expedition and its crew from the beginning.
“S/Y Indigo V was a newly purchased yacht at (the) start of the Indian Ocean cruise, so we had quite a bit of teething prob-lems,” Lauro said. Those problems included three breakdowns of the Indigo V’s autopilot mechanism, which led the crew to hand-steer “from Cape Town to Mauritius, and then from Maldives to Phuket, and then all the way down to Singapore — much to the consternation of the crew,” Lauro said. A storm coming out of Cape Town pitted the Indigo V and its crew against 60-foot swells, just before the sailboat weathered the tail end of Cyclone Phailin, the second-largest cyclone to make landfall in India.
The expedition also had to hunt down the proper permits and funding — the acquisition of which Lauro called a “universal problem when planning expeditions” — but universities in Aus-tralia, Canada, Denmark and the U.S. kept the project afloat with some initial financing.
Neither wind, nor rain, nor mechanical failure kept the sailors from appreciating the simple pleasures of the sea, however. Lauro listed a few instances when the scientists and crew got to meet their nautical neighbors up close.
“We were adopted by a pod of curious Bryde’s whales and they followed us for a few hours,” Lauro said. “They are nearly as big as our boat!
“We spotted a very large great white in the Southern Ocean, and we were lucky enough to catch up to a few pods of dolphins that played on the bow until they got bored with it and then disap-peared just as quick as they arrived.”
With the expedition a success, Lauro said the research team has already procured some seed funding and found sailors inter-ested in participating in future expeditions. “We expect to see [that] the first yacht equipped with our instrumentation will be out cruising by the middle of next year,” he said.
...there are thousands of yachts cruising around the world at any given time, and all of them are more than willing to help contribute to this research.
-Federico LauroMicrobiologist at University of New South Wales
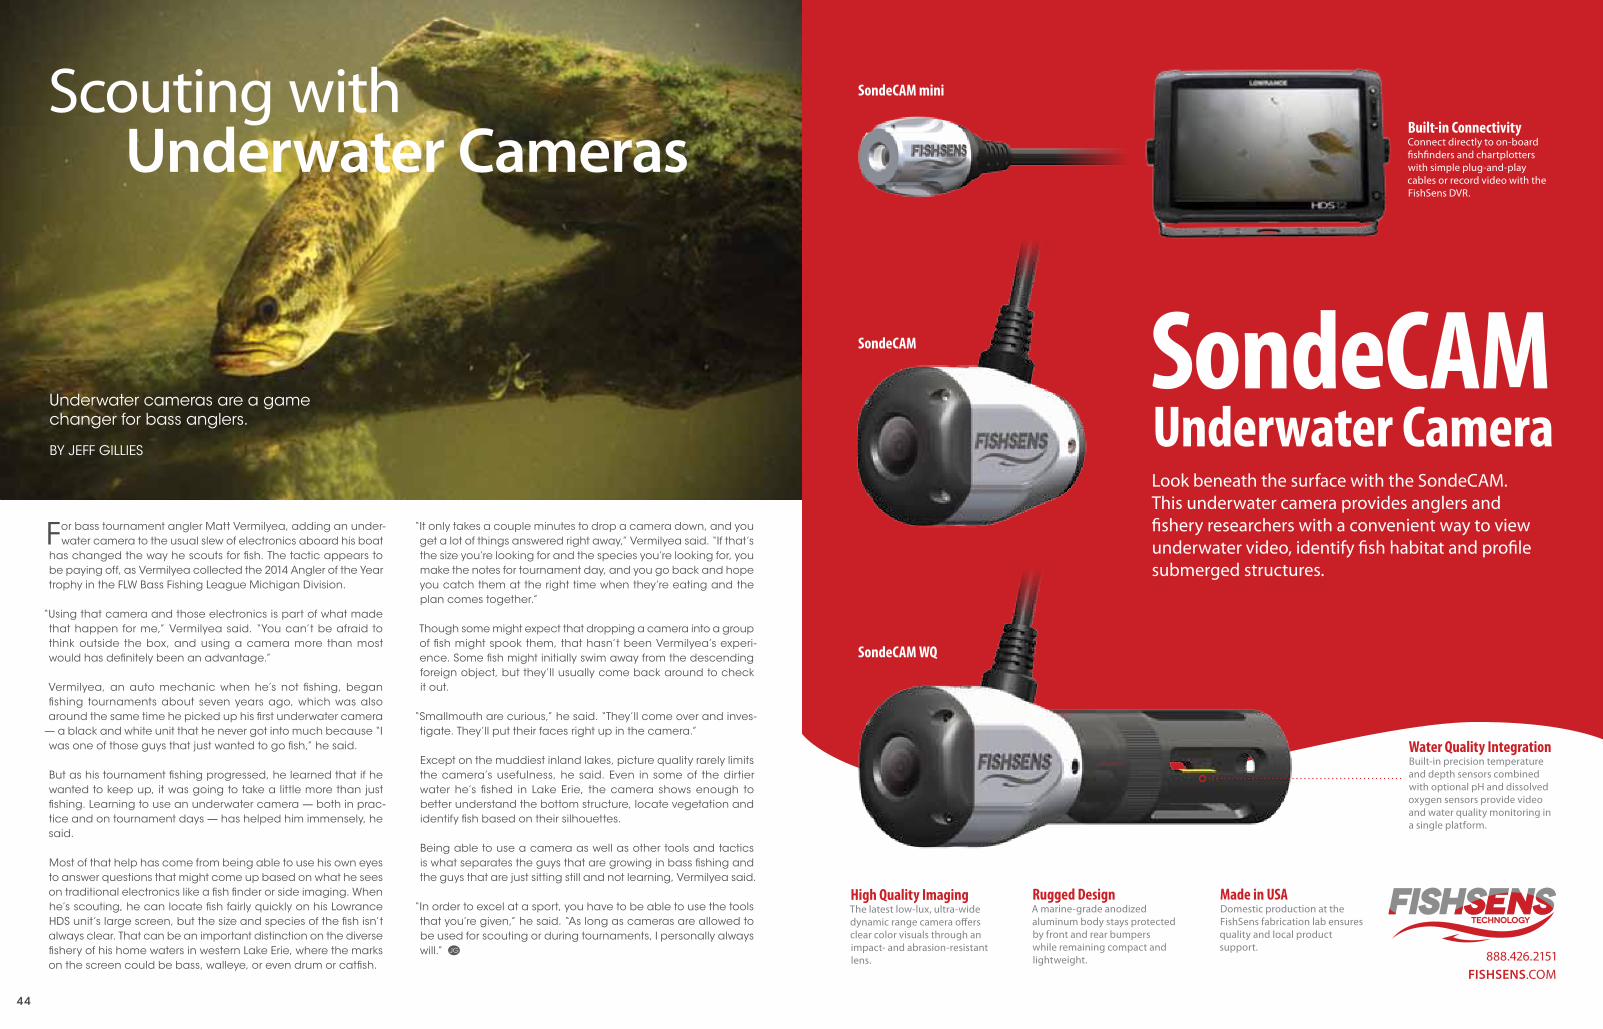
44
BY JEFF GILLIES
Underwater cameras are a game changer for bass anglers.
Scouting with Underwater Cameras
For bass tournament angler Matt Vermilyea, adding an under-water camera to the usual slew of electronics aboard his boat
has changed the way he scouts for fish. The tactic appears to be paying off, as Vermilyea collected the 2014 Angler of the Year trophy in the FLW Bass Fishing League Michigan Division.
“Using that camera and those electronics is part of what made that happen for me,” Vermilyea said. “You can’t be afraid to think outside the box, and using a camera more than most would has definitely been an advantage.”
Vermilyea, an auto mechanic when he’s not fishing, began fishing tournaments about seven years ago, which was also around the same time he picked up his first underwater camera
— a black and white unit that he never got into much because “I was one of those guys that just wanted to go fish,” he said.
But as his tournament fishing progressed, he learned that if he wanted to keep up, it was going to take a little more than just fishing. Learning to use an underwater camera — both in prac-tice and on tournament days — has helped him immensely, he said.
Most of that help has come from being able to use his own eyes to answer questions that might come up based on what he sees on traditional electronics like a fish finder or side imaging. When he’s scouting, he can locate fish fairly quickly on his Lowrance HDS unit’s large screen, but the size and species of the fish isn’t always clear. That can be an important distinction on the diverse fishery of his home waters in western Lake Erie, where the marks on the screen could be bass, walleye, or even drum or catfish.
“It only takes a couple minutes to drop a camera down, and you get a lot of things answered right away,” Vermilyea said. “If that’s the size you’re looking for and the species you’re looking for, you make the notes for tournament day, and you go back and hope you catch them at the right time when they’re eating and the plan comes together.”
Though some might expect that dropping a camera into a group of fish might spook them, that hasn’t been Vermilyea’s experi-ence. Some fish might initially swim away from the descending foreign object, but they’ll usually come back around to check it out.
“Smallmouth are curious,” he said. “They’ll come over and inves-tigate. They’ll put their faces right up in the camera.”
Except on the muddiest inland lakes, picture quality rarely limits the camera’s usefulness, he said. Even in some of the dirtier water he’s fished in Lake Erie, the camera shows enough to better understand the bottom structure, locate vegetation and identify fish based on their silhouettes.
Being able to use a camera as well as other tools and tactics is what separates the guys that are growing in bass fishing and the guys that are just sitting still and not learning, Vermilyea said.
“In order to excel at a sport, you have to be able to use the tools that you’re given,” he said. “As long as cameras are allowed to be used for scouting or during tournaments, I personally always will.” Ph
oto
: K
FiShSENS.com888.426.2151
SondecaMunderwater cameraLook beneath the surface with the SondecAm. This underwater camera provides anglers and fishery researchers with a convenient way to view underwater video, identify fish habitat and profile submerged structures.
SondecaM
SondecaM mini
SondecaM WQ
Built-in connectivityconnect directly to on-board fishfinders and chartplotters with simple plug-and-play cables or record video with the FishSens DVR.
Made in uSaDomestic production at the FishSens fabrication lab ensures quality and local product support.
High Quality ImagingThe latest low-lux, ultra-wide dynamic range camera offers clear color visuals through an impact- and abrasion-resistant lens.
rugged DesignA marine-grade anodized aluminum body stays protected by front and rear bumpers while remaining compact and lightweight.
Water Quality IntegrationBuilt-in precision temperature and depth sensors combined with optional pH and dissolved oxygen sensors provide video and water quality monitoring in a single platform.
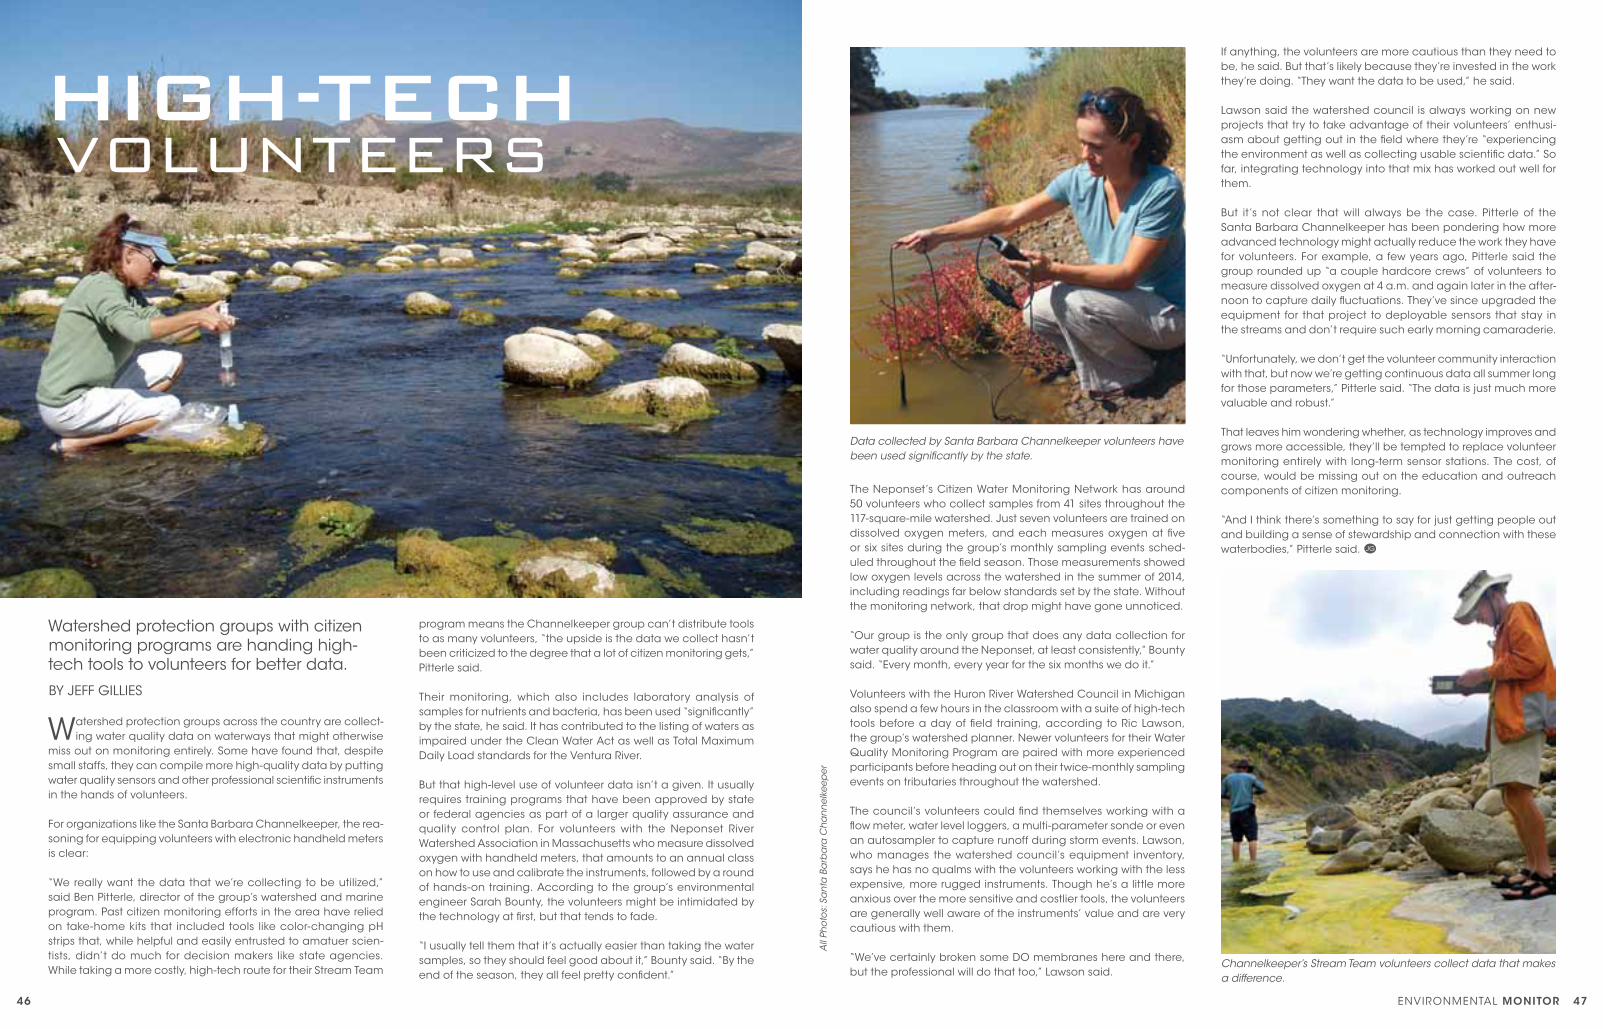
All
Pho
tos:
Sa
nta
Ba
rba
ra C
ha
nn
elke
eper
ENVIRONMENTAL MONITOR 4746
Watershed protection groups with citizen monitoring programs are handing high-tech tools to volunteers for better data.
BY JEFF GILLIES
HIGH-TECHVOLUNTEERS
Watershed protection groups across the country are collect-ing water quality data on waterways that might otherwise
miss out on monitoring entirely. Some have found that, despite small staffs, they can compile more high-quality data by putting water quality sensors and other professional scientific instruments in the hands of volunteers.
For organizations like the Santa Barbara Channelkeeper, the rea-soning for equipping volunteers with electronic handheld meters is clear:
“We really want the data that we’re collecting to be utilized,” said Ben Pitterle, director of the group’s watershed and marine program. Past citizen monitoring efforts in the area have relied on take-home kits that included tools like color-changing pH strips that, while helpful and easily entrusted to amatuer scien-tists, didn’t do much for decision makers like state agencies. While taking a more costly, high-tech route for their Stream Team
program means the Channelkeeper group can’t distribute tools to as many volunteers, “the upside is the data we collect hasn’t been criticized to the degree that a lot of citizen monitoring gets,” Pitterle said.
Their monitoring, which also includes laboratory analysis of samples for nutrients and bacteria, has been used “significantly” by the state, he said. It has contributed to the listing of waters as impaired under the Clean Water Act as well as Total Maximum Daily Load standards for the Ventura River.
But that high-level use of volunteer data isn’t a given. It usually requires training programs that have been approved by state or federal agencies as part of a larger quality assurance and quality control plan. For volunteers with the Neponset River Watershed Association in Massachusetts who measure dissolved oxygen with handheld meters, that amounts to an annual class on how to use and calibrate the instruments, followed by a round of hands-on training. According to the group’s environmental engineer Sarah Bounty, the volunteers might be intimidated by the technology at first, but that tends to fade.
“I usually tell them that it’s actually easier than taking the water samples, so they should feel good about it,” Bounty said. “By the end of the season, they all feel pretty confident.”
The Neponset’s Citizen Water Monitoring Network has around 50 volunteers who collect samples from 41 sites throughout the 117-square-mile watershed. Just seven volunteers are trained on dissolved oxygen meters, and each measures oxygen at five or six sites during the group’s monthly sampling events sched-uled throughout the field season. Those measurements showed low oxygen levels across the watershed in the summer of 2014, including readings far below standards set by the state. Without the monitoring network, that drop might have gone unnoticed.
“Our group is the only group that does any data collection for water quality around the Neponset, at least consistently,” Bounty said. “Every month, every year for the six months we do it.”
Volunteers with the Huron River Watershed Council in Michigan also spend a few hours in the classroom with a suite of high-tech tools before a day of field training, according to Ric Lawson, the group’s watershed planner. Newer volunteers for their Water Quality Monitoring Program are paired with more experienced participants before heading out on their twice-monthly sampling events on tributaries throughout the watershed.
The council’s volunteers could find themselves working with a flow meter, water level loggers, a multi-parameter sonde or even an autosampler to capture runoff during storm events. Lawson, who manages the watershed council’s equipment inventory, says he has no qualms with the volunteers working with the less expensive, more rugged instruments. Though he’s a little more anxious over the more sensitive and costlier tools, the volunteers are generally well aware of the instruments’ value and are very cautious with them.
“We’ve certainly broken some DO membranes here and there, but the professional will do that too,” Lawson said.
If anything, the volunteers are more cautious than they need to be, he said. But that’s likely because they’re invested in the work they’re doing. “They want the data to be used,” he said.
Lawson said the watershed council is always working on new projects that try to take advantage of their volunteers’ enthusi-asm about getting out in the field where they’re “experiencing the environment as well as collecting usable scientific data.” So far, integrating technology into that mix has worked out well for them.
But it’s not clear that will always be the case. Pitterle of the Santa Barbara Channelkeeper has been pondering how more advanced technology might actually reduce the work they have for volunteers. For example, a few years ago, Pitterle said the group rounded up “a couple hardcore crews” of volunteers to measure dissolved oxygen at 4 a.m. and again later in the after-noon to capture daily fluctuations. They’ve since upgraded the equipment for that project to deployable sensors that stay in the streams and don’t require such early morning camaraderie.
“Unfortunately, we don’t get the volunteer community interaction with that, but now we’re getting continuous data all summer long for those parameters,” Pitterle said. “The data is just much more valuable and robust.”
That leaves him wondering whether, as technology improves and grows more accessible, they’ll be tempted to replace volunteer monitoring entirely with long-term sensor stations. The cost, of course, would be missing out on the education and outreach components of citizen monitoring.
“And I think there’s something to say for just getting people out and building a sense of stewardship and connection with these waterbodies,” Pitterle said.
Channelkeeper’s Stream Team volunteers collect data that makes a difference.
Data collected by Santa Barbara Channelkeeper volunteers have been used significantly by the state.
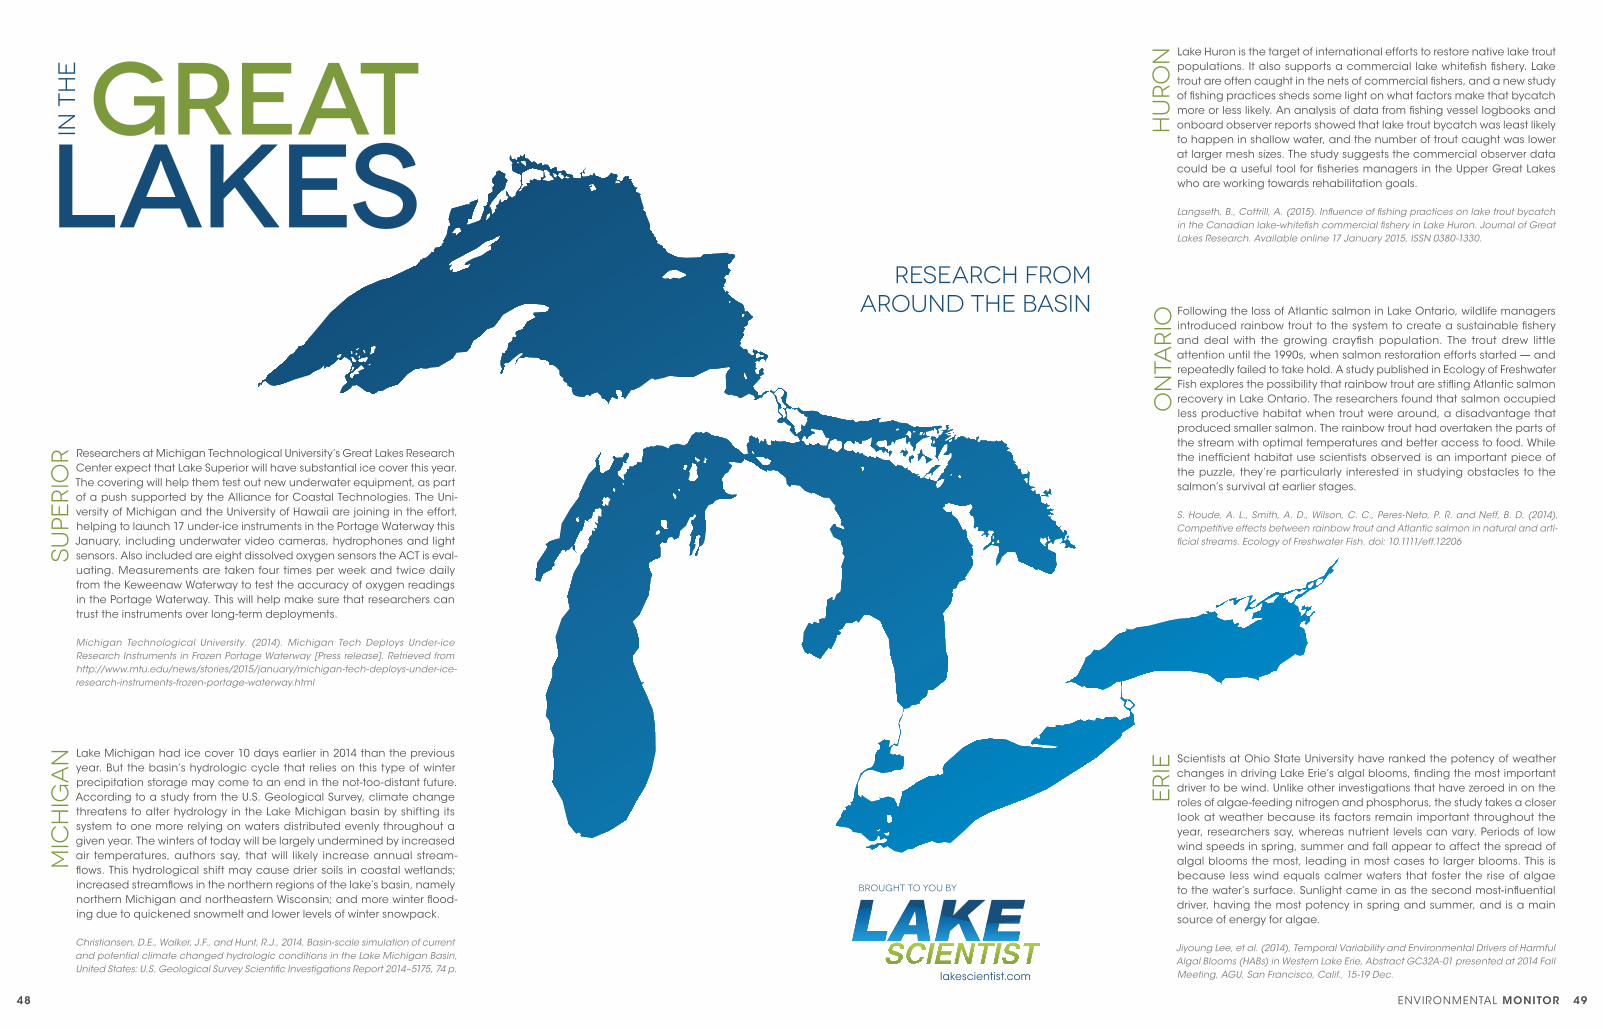
sU
Per
ior
HU
ro
no
nta
rio
erie
MiC
HiG
an
48 ENVIRONMENTAL MONITOR 49
Great Lakes
in t
he
Researchers at Michigan Technological University’s Great Lakes Research Center expect that Lake Superior will have substantial ice cover this year. The covering will help them test out new underwater equipment, as part of a push supported by the Alliance for Coastal Technologies. The Uni-versity of Michigan and the University of Hawaii are joining in the effort, helping to launch 17 under-ice instruments in the Portage Waterway this January, including underwater video cameras, hydrophones and light sensors. Also included are eight dissolved oxygen sensors the ACT is eval-uating. Measurements are taken four times per week and twice daily from the Keweenaw Waterway to test the accuracy of oxygen readings in the Portage Waterway. This will help make sure that researchers can trust the instruments over long-term deployments.
Michigan Technological University. (2014). Michigan Tech Deploys Under-ice Research Instruments in Frozen Portage Waterway [Press release]. Retrieved from http://www.mtu.edu/news/stories/2015/january/michigan-tech-deploys-under-ice-research-instruments-frozen-portage-waterway.html
Lake Michigan had ice cover 10 days earlier in 2014 than the previous year. But the basin’s hydrologic cycle that relies on this type of winter precipitation storage may come to an end in the not-too-distant future. According to a study from the U.S. Geological Survey, climate change threatens to alter hydrology in the Lake Michigan basin by shifting its system to one more relying on waters distributed evenly throughout a given year. The winters of today will be largely undermined by increased air temperatures, authors say, that will likely increase annual stream-flows. This hydrological shift may cause drier soils in coastal wetlands; increased streamflows in the northern regions of the lake’s basin, namely northern Michigan and northeastern Wisconsin; and more winter flood-ing due to quickened snowmelt and lower levels of winter snowpack.
Christiansen, D.E., Walker, J.F., and Hunt, R.J., 2014, Basin-scale simulation of current and potential climate changed hydrologic conditions in the Lake Michigan Basin, United States: U.S. Geological Survey Scientific Investigations Report 2014–5175, 74 p.
Lake Huron is the target of international efforts to restore native lake trout populations. It also supports a commercial lake whitefish fishery. Lake trout are often caught in the nets of commercial fishers, and a new study of fishing practices sheds some light on what factors make that bycatch more or less likely. An analysis of data from fishing vessel logbooks and onboard observer reports showed that lake trout bycatch was least likely to happen in shallow water, and the number of trout caught was lower at larger mesh sizes. The study suggests the commercial observer data could be a useful tool for fisheries managers in the Upper Great Lakes who are working towards rehabilitation goals.
Langseth, B., Cottrill, A. (2015). Influence of fishing practices on lake trout bycatch in the Canadian lake-whitefish commercial fishery in Lake Huron. Journal of Great Lakes Research. Available online 17 January 2015, ISSN 0380-1330.
Following the loss of Atlantic salmon in Lake Ontario, wildlife managers introduced rainbow trout to the system to create a sustainable fishery and deal with the growing crayfish population. The trout drew little attention until the 1990s, when salmon restoration efforts started — and repeatedly failed to take hold. A study published in Ecology of Freshwater Fish explores the possibility that rainbow trout are stifling Atlantic salmon recovery in Lake Ontario. The researchers found that salmon occupied less productive habitat when trout were around, a disadvantage that produced smaller salmon. The rainbow trout had overtaken the parts of the stream with optimal temperatures and better access to food. While the inefficient habitat use scientists observed is an important piece of the puzzle, they’re particularly interested in studying obstacles to the salmon’s survival at earlier stages.
S. Houde, A. L., Smith, A. D., Wilson, C. C., Peres-Neto, P. R. and Neff, B. D. (2014), Competitive effects between rainbow trout and Atlantic salmon in natural and arti-ficial streams. Ecology of Freshwater Fish. doi: 10.1111/eff.12206
Scientists at Ohio State University have ranked the potency of weather changes in driving Lake Erie’s algal blooms, finding the most important driver to be wind. Unlike other investigations that have zeroed in on the roles of algae-feeding nitrogen and phosphorus, the study takes a closer look at weather because its factors remain important throughout the year, researchers say, whereas nutrient levels can vary. Periods of low wind speeds in spring, summer and fall appear to affect the spread of algal blooms the most, leading in most cases to larger blooms. This is because less wind equals calmer waters that foster the rise of algae to the water’s surface. Sunlight came in as the second most-influential driver, having the most potency in spring and summer, and is a main source of energy for algae.
Jiyoung Lee, et al. (2014), Temporal Variability and Environmental Drivers of Harmful Algal Blooms (HABs) in Western Lake Erie, Abstract GC32A-01 presented at 2014 Fall Meeting, AGU, San Francisco, Calif., 15-19 Dec.
research from around the basin
BroUGHt to You By
lakescientist.com
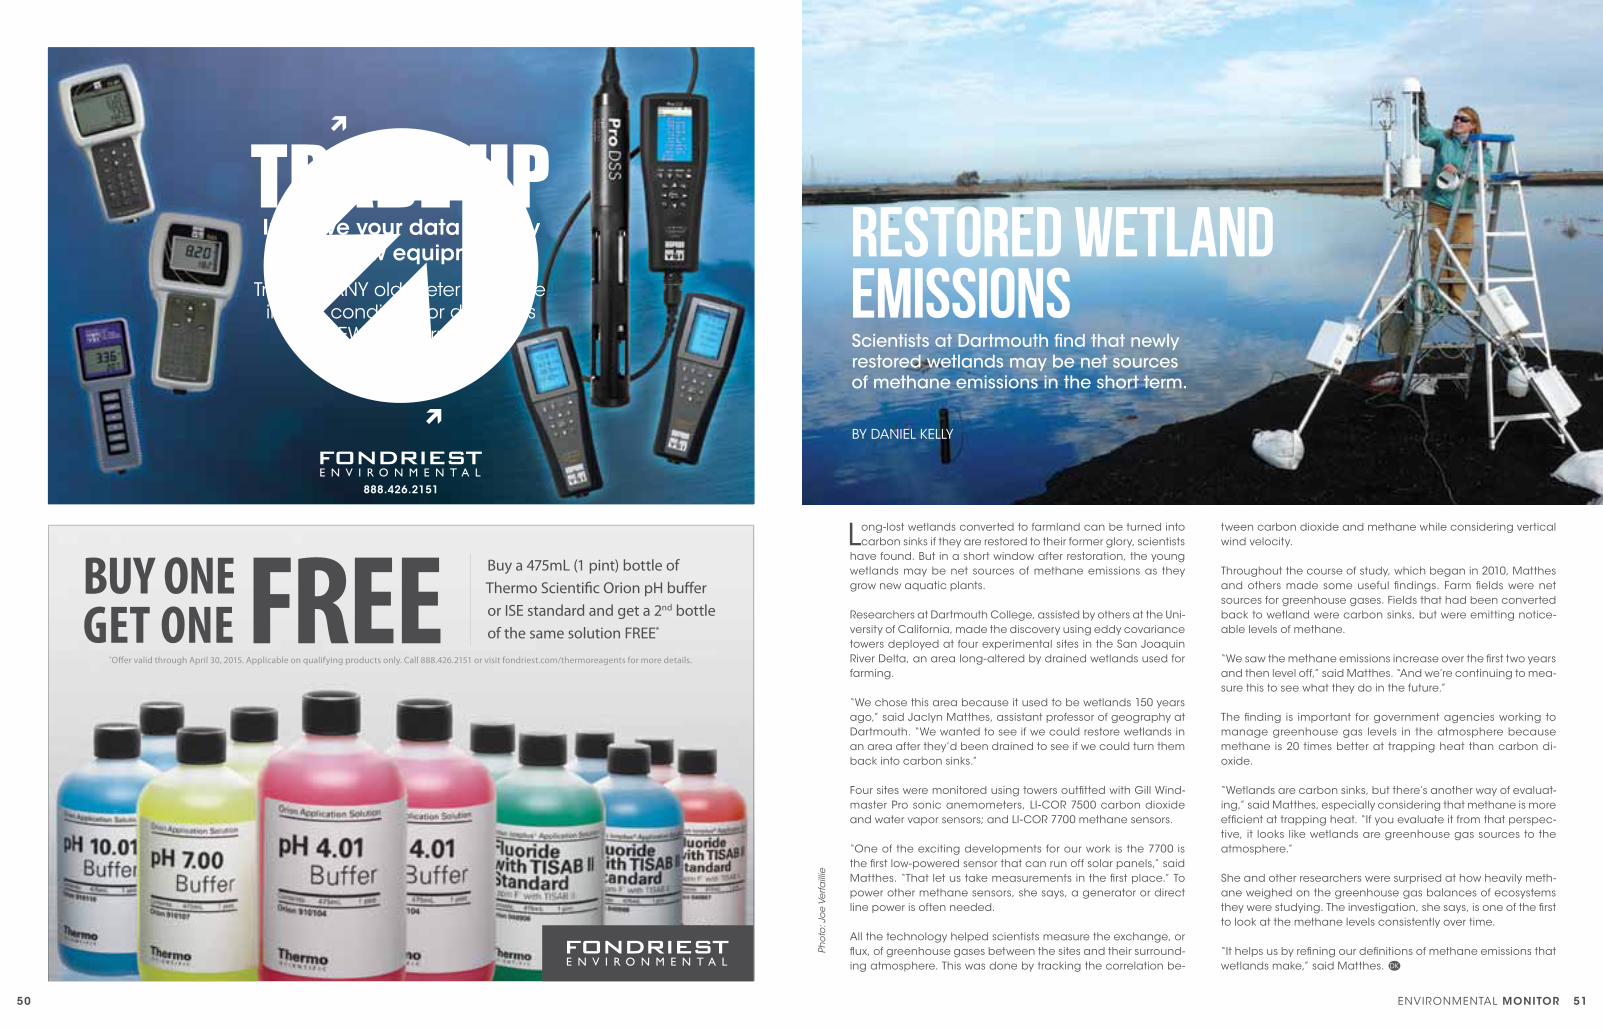
TRADE UPTrade in ANY old meter or sonde
in ANY condition for discountson NEW YSI instruments!
Improve your data quality with new equipment
888.426.2151
50 ENVIRONMENTAL MONITOR 51
Pho
to: J
oe
Verfa
illie
Buy a 475mL (1 pint) bottle of Thermo Scientific orion pH buffer or ISE standard and get a 2nd bottle of the same solution FREE*
*offer valid through April 30, 2015. Applicable on qualifying products only. call 888.426.2151 or visit fondriest.com/thermoreagents for more details.
Long-lost wetlands converted to farmland can be turned into carbon sinks if they are restored to their former glory, scientists
have found. But in a short window after restoration, the young wetlands may be net sources of methane emissions as they grow new aquatic plants.
Researchers at Dartmouth College, assisted by others at the Uni-versity of California, made the discovery using eddy covariance towers deployed at four experimental sites in the San Joaquin River Delta, an area long-altered by drained wetlands used for farming.
“We chose this area because it used to be wetlands 150 years ago,” said Jaclyn Matthes, assistant professor of geography at Dartmouth. “We wanted to see if we could restore wetlands in an area after they’d been drained to see if we could turn them back into carbon sinks.”
Four sites were monitored using towers outfitted with Gill Wind-master Pro sonic anemometers, LI-COR 7500 carbon dioxide and water vapor sensors; and LI-COR 7700 methane sensors.
“One of the exciting developments for our work is the 7700 is the first low-powered sensor that can run off solar panels,” said Matthes. “That let us take measurements in the first place.” To power other methane sensors, she says, a generator or direct line power is often needed.
All the technology helped scientists measure the exchange, or flux, of greenhouse gases between the sites and their surround-ing atmosphere. This was done by tracking the correlation be-
tween carbon dioxide and methane while considering vertical wind velocity.
Throughout the course of study, which began in 2010, Matthes and others made some useful findings. Farm fields were net sources for greenhouse gases. Fields that had been converted back to wetland were carbon sinks, but were emitting notice-able levels of methane.
“We saw the methane emissions increase over the first two years and then level off,” said Matthes. “And we’re continuing to mea-sure this to see what they do in the future.”
The finding is important for government agencies working to manage greenhouse gas levels in the atmosphere because methane is 20 times better at trapping heat than carbon di-oxide.
“Wetlands are carbon sinks, but there’s another way of evaluat-ing,” said Matthes, especially considering that methane is more efficient at trapping heat. “If you evaluate it from that perspec-tive, it looks like wetlands are greenhouse gas sources to the atmosphere.”
She and other researchers were surprised at how heavily meth-ane weighed on the greenhouse gas balances of ecosystems they were studying. The investigation, she says, is one of the first to look at the methane levels consistently over time.
“It helps us by refining our definitions of methane emissions that wetlands make,” said Matthes.
Restored WetlandEmissions
BY DANIEL KELLY
Scientists at Dartmouth find that newly restored wetlands may be net sources of methane emissions in the short term.
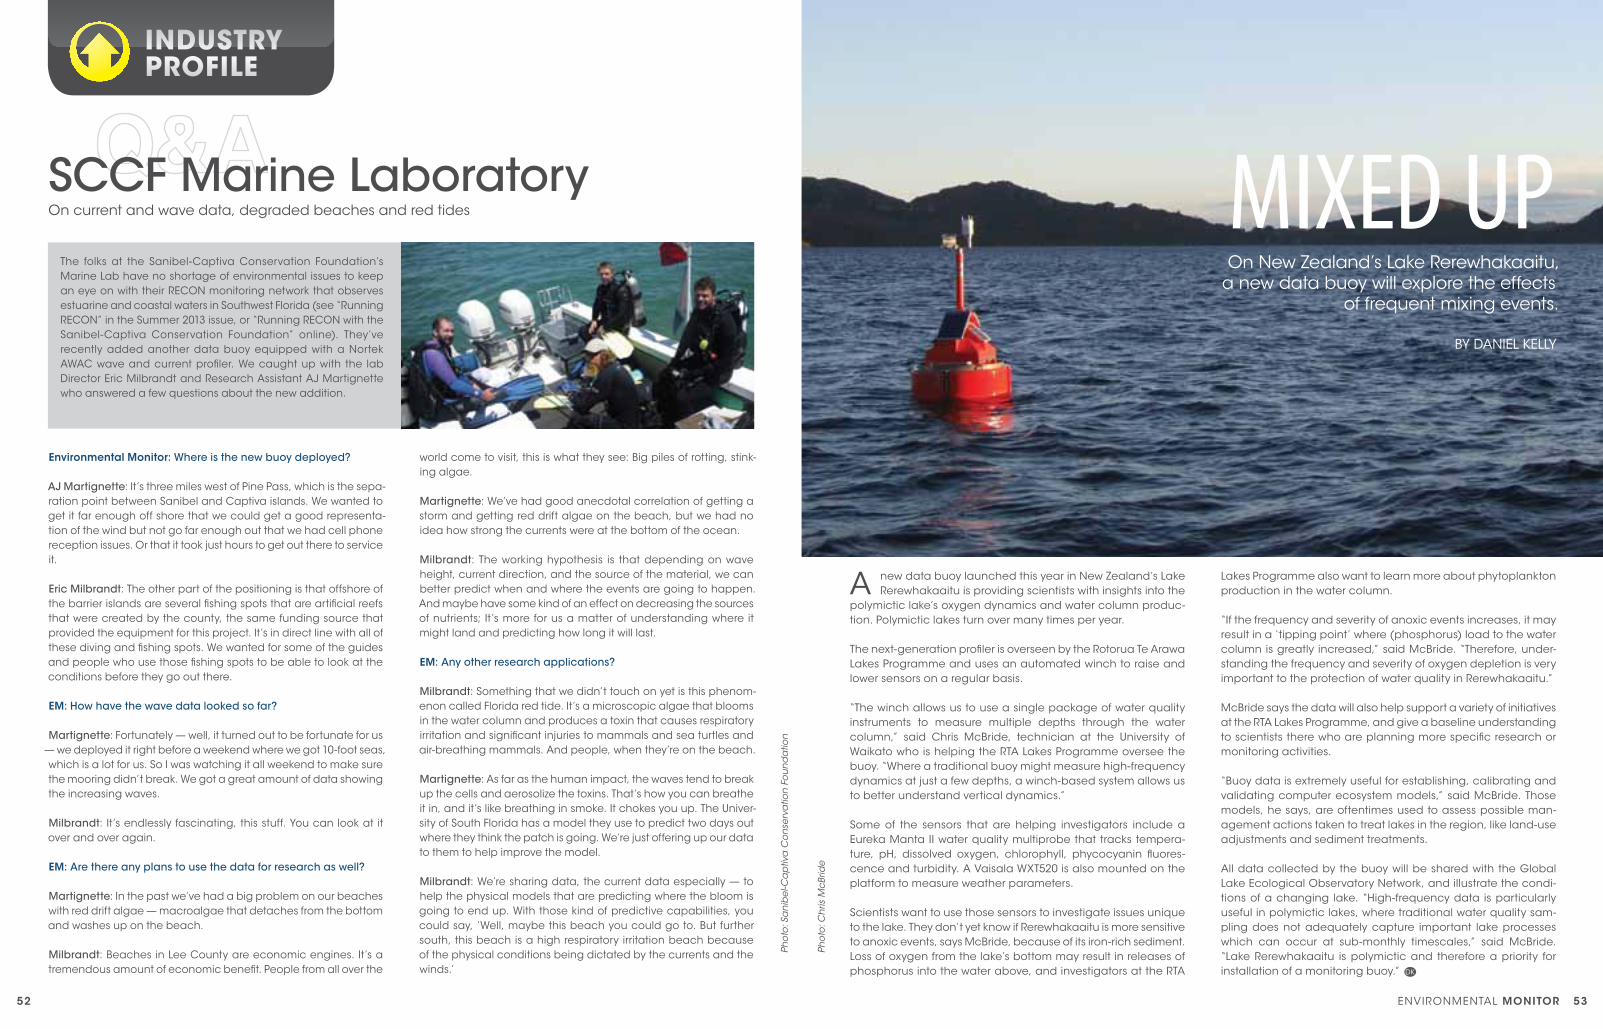
Pho
to: S
an
ibel
-Ca
ptiv
a C
on
serv
atio
n F
ou
nd
atio
n
SCCF Marine LaboratoryOn current and wave data, degraded beaches and red tides
InDUsTRyPROfIle
Environmental Monitor: Where is the new buoy deployed?
AJ Martignette: It’s three miles west of Pine Pass, which is the sepa-ration point between Sanibel and Captiva islands. We wanted to get it far enough off shore that we could get a good representa-tion of the wind but not go far enough out that we had cell phone reception issues. Or that it took just hours to get out there to service it.
Eric Milbrandt: The other part of the positioning is that offshore of the barrier islands are several fishing spots that are artificial reefs that were created by the county, the same funding source that provided the equipment for this project. It’s in direct line with all of these diving and fishing spots. We wanted for some of the guides and people who use those fishing spots to be able to look at the conditions before they go out there.
EM: How have the wave data looked so far?
Martignette: Fortunately — well, it turned out to be fortunate for us — we deployed it right before a weekend where we got 10-foot seas, which is a lot for us. So I was watching it all weekend to make sure the mooring didn’t break. We got a great amount of data showing the increasing waves.
Milbrandt: It’s endlessly fascinating, this stuff. You can look at it over and over again.
EM: Are there any plans to use the data for research as well?
Martignette: In the past we’ve had a big problem on our beaches with red drift algae — macroalgae that detaches from the bottom and washes up on the beach.
Milbrandt: Beaches in Lee County are economic engines. It’s a tremendous amount of economic benefit. People from all over the
52 ENVIRONMENTAL MONITOR 53
Pho
to: C
hris
McB
ride
world come to visit, this is what they see: Big piles of rotting, stink-ing algae.
Martignette: We’ve had good anecdotal correlation of getting a storm and getting red drift algae on the beach, but we had no idea how strong the currents were at the bottom of the ocean.
Milbrandt: The working hypothesis is that depending on wave height, current direction, and the source of the material, we can better predict when and where the events are going to happen. And maybe have some kind of an effect on decreasing the sources of nutrients; It’s more for us a matter of understanding where it might land and predicting how long it will last.
EM: Any other research applications?
Milbrandt: Something that we didn’t touch on yet is this phenom-enon called Florida red tide. It’s a microscopic algae that blooms in the water column and produces a toxin that causes respiratory irritation and significant injuries to mammals and sea turtles and air-breathing mammals. And people, when they’re on the beach.
Martignette: As far as the human impact, the waves tend to break up the cells and aerosolize the toxins. That’s how you can breathe it in, and it’s like breathing in smoke. It chokes you up. The Univer-sity of South Florida has a model they use to predict two days out where they think the patch is going. We’re just offering up our data to them to help improve the model.
Milbrandt: We’re sharing data, the current data especially — to help the physical models that are predicting where the bloom is going to end up. With those kind of predictive capabilities, you could say, ‘Well, maybe this beach you could go to. But further south, this beach is a high respiratory irritation beach because of the physical conditions being dictated by the currents and the winds.’
A new data buoy launched this year in New Zealand’s Lake Rerewhakaaitu is providing scientists with insights into the
polymictic lake’s oxygen dynamics and water column produc-tion. Polymictic lakes turn over many times per year.
The next-generation profiler is overseen by the Rotorua Te Arawa Lakes Programme and uses an automated winch to raise and lower sensors on a regular basis.
“The winch allows us to use a single package of water quality instruments to measure multiple depths through the water column,” said Chris McBride, technician at the University of Waikato who is helping the RTA Lakes Programme oversee the buoy. “Where a traditional buoy might measure high-frequency dynamics at just a few depths, a winch-based system allows us to better understand vertical dynamics.”
Some of the sensors that are helping investigators include a Eureka Manta II water quality multiprobe that tracks tempera-ture, pH, dissolved oxygen, chlorophyll, phycocyanin fluores-cence and turbidity. A Vaisala WXT520 is also mounted on the platform to measure weather parameters.
Scientists want to use those sensors to investigate issues unique to the lake. They don’t yet know if Rerewhakaaitu is more sensitive to anoxic events, says McBride, because of its iron-rich sediment. Loss of oxygen from the lake’s bottom may result in releases of phosphorus into the water above, and investigators at the RTA
On New Zealand’s Lake Rerewhakaaitu, a new data buoy will explore the effects
of frequent mixing events.
Mixed upBY DANIEL KELLY
Lakes Programme also want to learn more about phytoplankton production in the water column.
“If the frequency and severity of anoxic events increases, it may result in a ‘tipping point’ where (phosphorus) load to the water column is greatly increased,” said McBride. “Therefore, under-standing the frequency and severity of oxygen depletion is very important to the protection of water quality in Rerewhakaaitu.”
McBride says the data will also help support a variety of initiatives at the RTA Lakes Programme, and give a baseline understanding to scientists there who are planning more specific research or monitoring activities.
“Buoy data is extremely useful for establishing, calibrating and validating computer ecosystem models,” said McBride. Those models, he says, are oftentimes used to assess possible man-agement actions taken to treat lakes in the region, like land-use adjustments and sediment treatments.
All data collected by the buoy will be shared with the Global Lake Ecological Observatory Network, and illustrate the condi-tions of a changing lake. “High-frequency data is particularly useful in polymictic lakes, where traditional water quality sam-pling does not adequately capture important lake processes which can occur at sub-monthly timescales,” said McBride. “Lake Rerewhakaaitu is polymictic and therefore a priority for installation of a monitoring buoy.”
The folks at the Sanibel-Captiva Conservation Foundation’s Marine Lab have no shortage of environmental issues to keep an eye on with their RECON monitoring network that observes estuarine and coastal waters in Southwest Florida (see “Running RECON” in the Summer 2013 issue, or “Running RECON with the Sanibel-Captiva Conservation Foundation” online). They’ve recently added another data buoy equipped with a Nortek AWAC wave and current profiler. We caught up with the lab Director Eric Milbrandt and Research Assistant AJ Martignette who answered a few questions about the new addition.
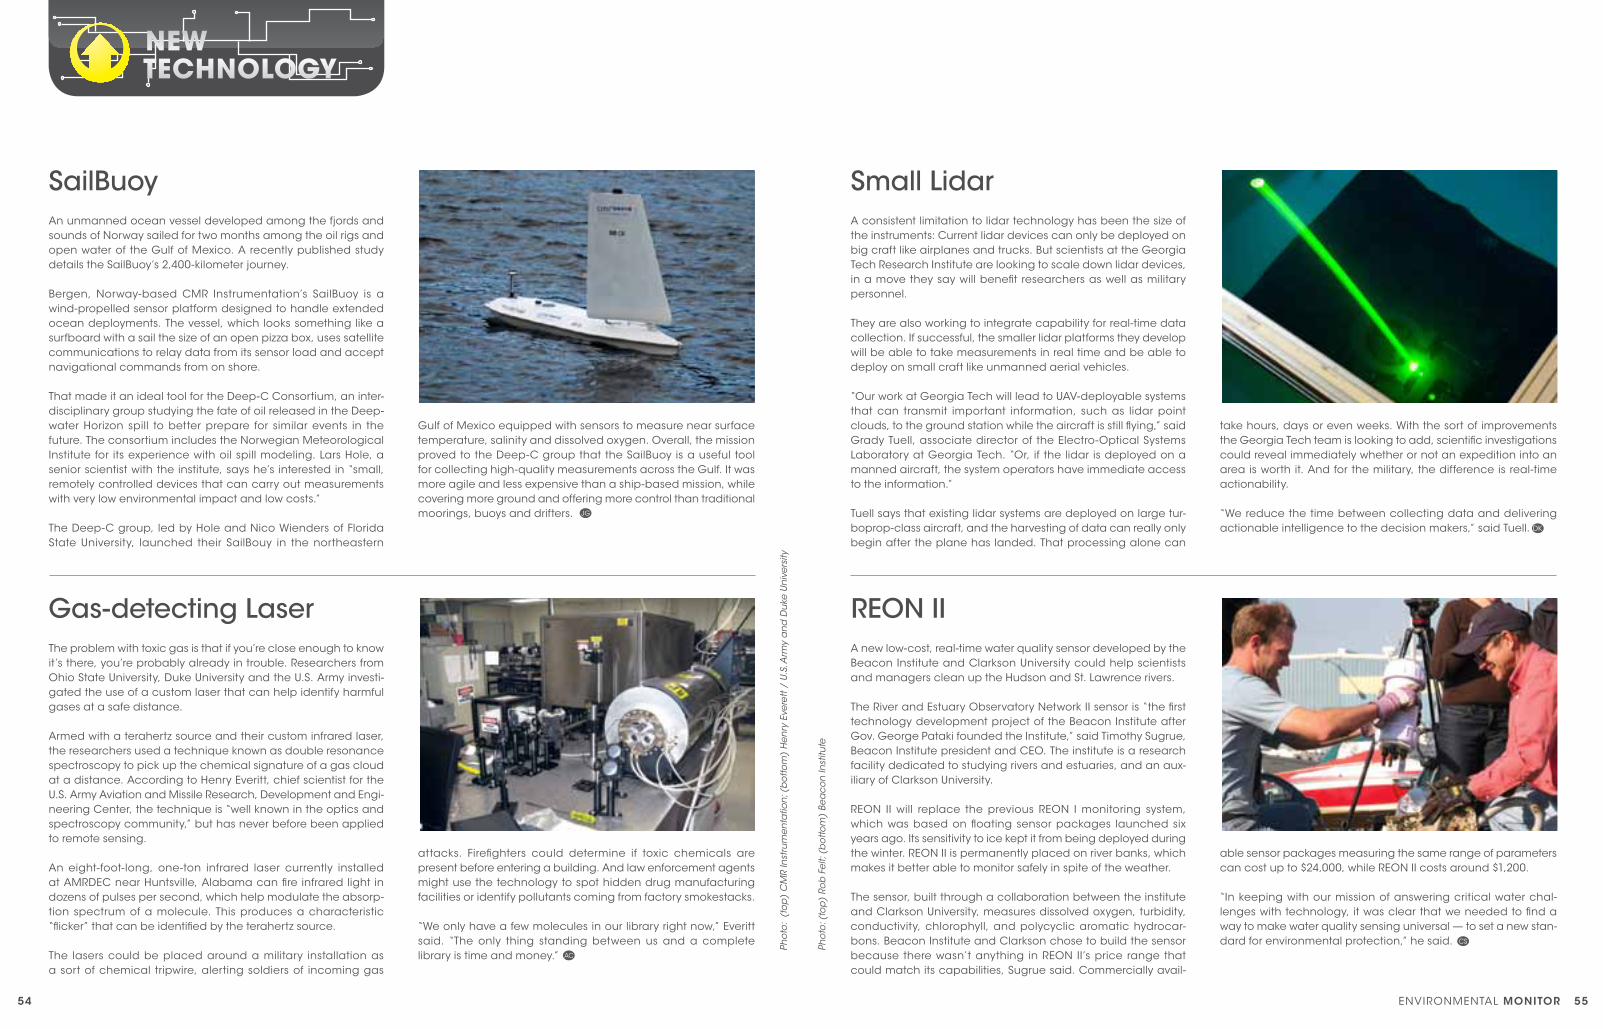
new TeCHnOlOgy
Pho
to:
(to
p)
CM
R In
stru
men
tatio
n; (
bo
ttom
) H
enry
Eve
rett
/ U.
S. A
rmy
an
d D
uke
Un
iver
sity
Pho
to: (
top
) Ro
b F
elt;
(bo
ttom
) Be
aco
n In
stitu
te
54 ENVIRONMENTAL MONITOR 55
An unmanned ocean vessel developed among the fjords and sounds of Norway sailed for two months among the oil rigs and open water of the Gulf of Mexico. A recently published study details the SailBuoy’s 2,400-kilometer journey.
Bergen, Norway-based CMR Instrumentation’s SailBuoy is a wind-propelled sensor platform designed to handle extended ocean deployments. The vessel, which looks something like a surfboard with a sail the size of an open pizza box, uses satellite communications to relay data from its sensor load and accept navigational commands from on shore.
That made it an ideal tool for the Deep-C Consortium, an inter-disciplinary group studying the fate of oil released in the Deep-water Horizon spill to better prepare for similar events in the future. The consortium includes the Norwegian Meteorological Institute for its experience with oil spill modeling. Lars Hole, a senior scientist with the institute, says he’s interested in “small, remotely controlled devices that can carry out measurements with very low environmental impact and low costs.”
The Deep-C group, led by Hole and Nico Wienders of Florida State University, launched their SailBouy in the northeastern
A consistent limitation to lidar technology has been the size of the instruments: Current lidar devices can only be deployed on big craft like airplanes and trucks. But scientists at the Georgia Tech Research Institute are looking to scale down lidar devices, in a move they say will benefit researchers as well as military personnel.
They are also working to integrate capability for real-time data collection. If successful, the smaller lidar platforms they develop will be able to take measurements in real time and be able to deploy on small craft like unmanned aerial vehicles.
“Our work at Georgia Tech will lead to UAV-deployable systems that can transmit important information, such as lidar point clouds, to the ground station while the aircraft is still flying,” said Grady Tuell, associate director of the Electro-Optical Systems Laboratory at Georgia Tech. “Or, if the lidar is deployed on a manned aircraft, the system operators have immediate access to the information.”
Tuell says that existing lidar systems are deployed on large tur-boprop-class aircraft, and the harvesting of data can really only begin after the plane has landed. That processing alone can
The problem with toxic gas is that if you’re close enough to know it’s there, you’re probably already in trouble. Researchers from Ohio State University, Duke University and the U.S. Army investi-gated the use of a custom laser that can help identify harmful gases at a safe distance.
Armed with a terahertz source and their custom infrared laser, the researchers used a technique known as double resonance spectroscopy to pick up the chemical signature of a gas cloud at a distance. According to Henry Everitt, chief scientist for the U.S. Army Aviation and Missile Research, Development and Engi-neering Center, the technique is “well known in the optics and spectroscopy community,” but has never before been applied to remote sensing.
An eight-foot-long, one-ton infrared laser currently installed at AMRDEC near Huntsville, Alabama can fire infrared light in dozens of pulses per second, which help modulate the absorp-tion spectrum of a molecule. This produces a characteristic “flicker” that can be identified by the terahertz source.
The lasers could be placed around a military installation as a sort of chemical tripwire, alerting soldiers of incoming gas
A new low-cost, real-time water quality sensor developed by the Beacon Institute and Clarkson University could help scientists and managers clean up the Hudson and St. Lawrence rivers.
The River and Estuary Observatory Network II sensor is “the first technology development project of the Beacon Institute after Gov. George Pataki founded the Institute,” said Timothy Sugrue, Beacon Institute president and CEO. The institute is a research facility dedicated to studying rivers and estuaries, and an aux-iliary of Clarkson University.
REON II will replace the previous REON I monitoring system, which was based on floating sensor packages launched six years ago. Its sensitivity to ice kept it from being deployed during the winter. REON II is permanently placed on river banks, which makes it better able to monitor safely in spite of the weather.
The sensor, built through a collaboration between the institute and Clarkson University, measures dissolved oxygen, turbidity, conductivity, chlorophyll, and polycyclic aromatic hydrocar-bons. Beacon Institute and Clarkson chose to build the sensor because there wasn’t anything in REON II’s price range that could match its capabilities, Sugrue said. Commercially avail-
SailBuoy Small Lidar
Gas-detecting Laser REON II
Gulf of Mexico equipped with sensors to measure near surface temperature, salinity and dissolved oxygen. Overall, the mission proved to the Deep-C group that the SailBuoy is a useful tool for collecting high-quality measurements across the Gulf. It was more agile and less expensive than a ship-based mission, while covering more ground and offering more control than traditional moorings, buoys and drifters.
take hours, days or even weeks. With the sort of improvements the Georgia Tech team is looking to add, scientific investigations could reveal immediately whether or not an expedition into an area is worth it. And for the military, the difference is real-time actionability.
“We reduce the time between collecting data and delivering actionable intelligence to the decision makers,” said Tuell.
attacks. Firefighters could determine if toxic chemicals are present before entering a building. And law enforcement agents might use the technology to spot hidden drug manufacturing facilities or identify pollutants coming from factory smokestacks.
“We only have a few molecules in our library right now,” Everitt said. “The only thing standing between us and a complete library is time and money.”
able sensor packages measuring the same range of parameters can cost up to $24,000, while REON II costs around $1,200.
“In keeping with our mission of answering critical water chal-lenges with technology, it was clear that we needed to find a way to make water quality sensing universal — to set a new stan-dard for environmental protection,” he said.

Visit fondriest.com/news/crossword-puzzles to find more puzzles and answers!
Across
This park protects the world’s longest cave system
A rare stonefly only found in this park is disappearing
Trees protected here are among the world’s tallest
High stream nitrate levels are declining in this park
Features North America’s highest mountain
Lake temperatures don’t track with warming air temps here
Contains more than 2,000 of its namesake sandstone features
Down
The 2013 Rim Fire burned 250,000 acres here
The first national park in the world
In Maine, the easternmost national park
Reconnecting flow patterns is a research priority here
Its lowest point is 282 feet below sea level
Features the Skyline Drive through the Blue Ridge Mountains
Buy scientific equipment here
3.
5.
7.
11.
12.
13.
14.
1.
2.
4.
6.
8.
9.
10.
National Parks
fondriest.com/featured-product
Pluvio2PRECIPITATION GAUGEThe OTT Pluvio2 Precipitation Gauge is an all-weather precipitation gauge that uses superior weight-based technology to measure rainfall, snow or hail. Liquid or solid precipitation is measured immediately with no time delay for melting solid precipitation.
R E N T A L
rentaL eqUiPMent for anY ProjeCtfast DeLiverY . reLiaBLe PerforManCe . qUaLitY Data
56
when your
demandsresearchquality data
PRSRT STDUS POSTAGEPaIDDAYTON, OHPERMIT# 860
Fondriest Environmental, Inc.2091 Exchange CourtFairborn, OH 45324
P 888.426.2151
F 937.426.1125
Niagara Region Public HealthRead the full story in the next edition
Niagara Region Public HealthRead the full story in the next edition