Embed Size (px)
Citation preview

CH2M HILL
2485 Natomas Park Drive
Suite 600
Sacramento, CA 95833
Tel 916.286.0224
Fax 916.614.3424
July 13, 2012 427930.DI.CD
Mike Monasmith Senior Project Manager Systems Assessment & Facility Siting Division California Energy Commission 1516 Ninth Street, MS-15 Sacramento, CA 95814
Subject: Preliminary Staff Assessment Comments, Set 1
Hidden Hills Solar Electric Generating System (11-AFC-2) Dear Mr. Monasmith: The Applicant (Hidden Hills Solar I, LLC; and Hidden Hills Solar II, LLC) is preparing comments on the Preliminary Staff Assessment (PSA) which we plan to file on July 23, 2012.
However, as was discussed at the June 27th PSA workshop in Bishop, CA, the Applicant has been reviewing the desert tortoise compensation ratios proposed by staff. To further discussion on this topic, the Applicant is submitting its proposed approach for desert tortoise compensation in advance of our PSA comments. We will also include it in our formal comments that we file on July 23rd.
Please call me if you have any questions.
Sincerely, CH2M HILL John L. Carrier, J.D. Program Manager Encl. c:
POS List Project file
DOCKETEDCalifornia Energy Commission
FEB 15 2013
TN # 69532
11-AFC-2

With Technical Assistance from
Preliminary Staff Assessment Comments, Set 1
Hidden Hills Solar Electric Generating System
(11-AFC-2)
Application for Certifi cationHidden Hills Solar I, LLC; and Hidden Hills Solar II, LLC
July 2012
IS061411043744SAC

Desert Tortoise Mitigation Compensation Analysis for the
Hidden Hills Solar Electric Generating System
Prepared for
Hidden Hills Solar I, LLC, and Hidden Hills Solar II, LLC
July 2012
Prepared by
2485 Natomas Park Drive, Suite 600
Sacramento, CA 95833

IS061411043744SAC ii
Contents Section Page
1.0 Introduction ................................................................................................................................................ 1
2.0 Environmental Setting—Factors Affecting Desert Tortoise Habitat Quality ................................................ 1 2.1 Geologic and Geomorphic Setting .......................................................................................................... 1
2.1.1 Surficial Geology .......................................................................................................................... 2 2.1.2 Surface Relief and Incision .......................................................................................................... 5
2.2 Vegetational Patterns ............................................................................................................................. 8 2.2.1 Shadscale and Halophyte Scrub of the Bolson Floor ................................................................... 8 2.2.2 Creosote Bush Scrub of the Alluvial Fans of the Eastern Edge of the HHSEGS Project Area....... 9
3.0 Desert Tortoise Survey Results ................................................................................................................... 9
4.0 Mitigation Ratios on CEC-regulated Projects ............................................................................................. 12
5.0 Conclusions and Recommendations .......................................................................................................... 16
6.0 References ................................................................................................................................................ 16
Tables
1 Relative Densities of Adult Desert Tortoise 2 Estimated Number of Desert Tortoise on the Project Site (95 percent confidence values) 3 Comparison of Conditions and Mitigation Ratios at Various CEC Project Sites
Figures
1 Land Surface Units 2 Elevation Profile 3 Mitigation Ratios
Photos
1 Trench profile showing stratigraphy typical of Unit Qa 2 Trench profile showing a thin mantle of Unit Qa overlying the pedogenically altered and friable clays of
upper Unit Qbf 3 The western portion of the HHSEGS site where calcareous basin fill (Unit Qbf) is exposed at the surface
and, at this locality, supports a shadscale-tumbleweed association 4 The western portion of the HHSEGS site where Unit Qbf is exposed at the surface 5 A wash or shallow arroyo incised into Unit Qa1

IS061411043744SAC 1
Desert Tortoise Mitigation Compensation Analysis
1.0 Introduction Hidden Hills Solar I, LLC, and Hidden Hills Solar II, LLC (the Applicant) reviewed the desert tortoise protocol survey results and habitat and botanical data available for the Hidden Hills Solar Electric Generating System (HHSEGS) project to evaluate the consistency of this information with the findings presented in the California Energy Commission’s (CEC) Preliminary Staff Assessment regarding impacts to desert tortoise habitat and recommended mitigation ratios. The CEC used the presence of tortoise sign and habitat degradation within the project site to define impacts to desert tortoise habitat and determine mitigation ratios to mitigate these impacts. The CEC defined areas that were coarsely delineated by Garcia and Associates (CH2M HILL, 2011) as shadscale scrub as lower quality tortoise habitat warranting a 1:1 mitigation ratio and defined areas delineated as Mojave Desert scrub as higher quality tortoise habitat warranting a 3:1 mitigation ratio. They based the 3:1 ratio on precedence from other solar projects, specifically including High Desert Power Project, Victorville 2 Hybrid Power Project, and Calico Solar Energy Project.
After careful review of the information available for the project site, the Applicant suggests that the CEC’s basis for determining mitigation ratios should be refined because: (1) these coarse-grained habitat classes do not adequately reflect tortoise habitat quality and use of the site, and (2) the projects cited by Staff did not, in fact, have simple 3:1 ratios for desert tortoise and there are other projects that also should be included in the analysis. The Applicant recommends that the CEC consider a more detailed and refined assessment of the ecological circumstances on the project site to ensure adequate and appropriate mitigation for loss of desert tortoise habitat. Specifically, we recommend that the CEC rely on the project’s focused tortoise survey data and other site characteristics as the primary indicators of habitat quality for desert tortoise, and that this information be used as the basis for determination of mitigation ratios instead of the coarse-scale habitat classification provided in the botanical survey report for the project. This report presents an analysis of habitat quality, concluding with the recommendations that the CEC’s designation of the Mojave Desert scrub habitat onsite as high quality be reconsidered, and that the entire project be considered a lower quality habitat. The findings of this report support a tiered mitigation approach consisting of mitigation ratios for loss of desert tortoise habitat of 0.5:1, 1:1 and 1.5:1 in identified areas of the project site.
2.0 Environmental Setting—Factors Affecting Desert Tortoise Habitat Quality
Habitat quality is affected by a series of factors that together comprise elements of the physical and biotic environment of the species under consideration. The nature of the substrate and surface roughness are two important elements of the physical environment that affect plant community composition and density which, in turn, are chief elements determining the carrying capacity of the local ecosystem. Especially in desert ecosystems, changes in plant community composition strongly affect carrying capacity for the associated vertebrate species, and net primary productivity as measured by aboveground vegetative biomass has long been known (for example, Shmida et al., 1986) to be a strong predictor of vertebrate carrying capacity in desert ecosystems. On the HHSEGS project site, the impact of these factors on habitat quality for desert tortoise is notable, the details of which are discussed below.
2.1 Geologic and Geomorphic Setting The influence of substrate on plant community composition and productivity in the northeastern Mojave Desert has been a subject of study since at least the early twentieth century. Toward the bottom of most valleys in the Basin and Range Province soils become finer grained and charged with evaporites and carbonates. The saline, alkaline, clay-rich soil conditions are tolerated by only a subset of perennial plants common to the Mojave Desert, chiefly species of the saltbush Atriplex. In addition, Janice Beatley’s research not far to the north at the Nevada Test Site (for example, Beatley, 1974) pointed to the climatic factors as well as edaphic factors influencing the distribution of saltscrub (desert scrub dominated by saltbush usually of the genus Atriplex) versus creosote bush-

DESERT TORTOISE MITIGATION COMPENSATION ANALYSIS
IS061411043744SAC 2
burrobush (Larrea tridentata – Ambrosia dumosa) scrub. In the case of a fossorial vertebrate such as the desert tortoise, aspects of the substrate are important not only for their effect on plant diversity and abundance, but also for the influence on habitability because burrows are critical to the animal’s ability to withstand environmental extremes and escape predators.
The project area lies in the axial basin of the Pahrump Valley. This linear basin, oriented northwest-southeast, is typical of elongate valleys, or bolsons, that lack a hydrologic outlet and therefore fill with fine-grained sediment over tens to hundreds of thousands of years. The eastern margin of this basin lies just to the east of the HHSEGS project area, and is formed by the fault scarps of the Stateline Fault System (SFS; Scheirer et al., 2010). The HHSEGS project area has the general shape of a right triangle with the legs of the triangle running north-south and east-west, and the hypotenuse lying parallel to the California-Nevada border and the scarps of the SFS, which also generally parallel the border on the Nevada side (Figure 1). Scarps associated with the SFS comprise successively higher-elevation, subparallel lineaments, between about 0.25 mile and 2 miles northeast of the border. To the east of the SFS scarps lies the west bajada, or alluvial fan complex, of the Spring Mountains, and to the west is the HHSEGS project area in the Pahrump Valley bolson. This basin marks the position of the graben, or down-warped segment of crust, that lies to the west of the SFS (Lundstrom et al., 2002; Scheirer et al., 2010).
2.1.1 Surficial Geology One of the principal features of the SFS is the dunes and sand sheets that have accumulated at the foot of the fault scarps in that area. And, due to differential uplift on the east side of the SFS, tongues of sandy alluvium have splayed out across the bolson floor onto the HHSEGS project area as Late Holocene (last 4,000 years) drainages channeled reworked eolian sand and minor gravels out onto the valley floor (Units Qa1 and Qa2 in Figure 1). This blanket of younger, generally loose, sandy alluvium mantles a second, much older sedimentary unit of starkly different properties. This older unit, which underlies Unit Qa on the eastern portion of the site and which is exposed at the surface elsewhere, is a loose to moderately indurated, carbonate-rich, buff to white light-colored silty clay to clayey sand. This older basin fill appears to be highly weathered, and is likely at least Late Pleistocene in age. More formal descriptions of the two surficial geological units that typify the HHSEGS site are provided below, and their distribution is shown in Figure 1.
Qa Late Holocene sandy, gravelly alluvium, grey to light brown in color, blanketing the eastern approximately one-third of the HHSEGS site. Lateral facies changes typical of bar-and-swale alluvial deposition, although generally lacking clasts coarser than medium gravels. The abundance of reworked eolian sands notwithstanding, profiles usually display a moderately consolidated and cohesive sedimentary unit below about 50 centimeters (cm) (approximately 20 inches; see Photo 1). Unit Qa1 alluvium is deposited by drainages issuing from the SFS to the northeast, while Qa2 alluvium is an older Holocene unit. Alluvium of Unit Qa2 originated from now-abandoned drainages formerly integrated into a wash system issuing onto the HHSEGS site from the east (Figure 1). Unit Qa (both Qa1 and Qa2) supports burrobush-creosote bush (Ambrosia dumosa–Larrea tridentata) scrub with a suite of perennial associates that becomes increasingly diverse to the east as the state line is approached.
Qbf Quaternary basin fill of Plio-Pleistocene age exposed at the surface on the western approximately two-thirds of the HHSEGS site. Carbonate and clay-rich, generally massively bedded basin fill possessing a typically high albedo (white to buff colored). Highly pedogenically altered with soil profiles often displaying friable, crumbly structure (Photo 2). Lateral facies changes include relict spring discharge carbonates (tufa ledges) and clay-filled paleo-drainages and small depobasins. Erosional exposures, particularly along roads, show that Qbf is mantled by Unit Qa debouching from the east onto the project area (Figure 1). The clay-rich, calcareous soils of Unit Qbf support saltscrub (Atriplex spp.) with a weedy flora in which the noxious species tumbleweed (Salsola tragus) and halogeton (Halogeton glomeratus) are abundant over areas that extend for acres. In the southern part of the HHSEGS site, the surface of Unit Qbf is sculpted of a linear bar and swale topography oriented generally west-northwest–east-southeast, with large (30 to 150 meters) whalebacks frequently mantled by a thin veneer of older, darker fluvial gravels (Units Qf and Qf/Qbf in Figure 1).

Figu
re 1
Land
Sur
face
Uni
tsH
idde
n H
ills
Sol
ar E
lect
ric G
ener
atin
g S
yste
m
SAC
\\Z
ION
\SA
CG
IS\P
RO
J\S
OLA
RP
RO
JEC
TS\H
IDD
EN
HIL
LS\M
APFI
LES\
2012
\DE
SER
T_TO
RTO
ISE_
MAP
S\D
T_M
EMO
_JU
LY20
12\F
IGU
RE
1_LA
ND
_SU
RFA
CE
_UN
ITS
.MX
D S
SC
OP
ES
7/12
/201
2 12
:46:
45 P
M
VIC
INIT
Y M
AP
XX
XX X X
XX
X
WW
WW W W
WW
W
"
""
"" "
""
"
"
"
"
"
"
/
//
// /
//
/
/
/
/
/
/
# *
!
!!
!
!!!
!!
!!
!
!!
!!!!
!!
!!
!!
!!
!
!!
!!
!!
!!
!
!!
!!
!!
!
!!!
!!
!!
!!!
!!
!!
!
!
!
!!
!!
!! !
!!
!
!!
!
!
!!
!
!!
!
!
!!
!
!!
!
!
(
((
(
(((
((
((
(
((
((((
((
((
((
((
(
((
((
((
((
(
((
((
((
(
(((
((
((
(((
((
((
(
(
(
((
((
(( (
((
(
((
(
(
((
(
((
(
(
((
(
((
(
(
$$
$
$
$
$
$
$$
$
$
++
+
+
+
+
+
++
+
+
Qa1
Qa1
Qa2
Qa2
Qf/Q
bf
Qbf
STATELIN
E
FAULT
SYSTEM
Teco
pa R
d
CALIFORNIA
NEVADA
SCARPSSALT
BUSH
SCRUB
CREOSOTE
BUSH SCRUB
Sola
r Pla
nt 2
Sola
r Pla
nt 1
Com
mon
Are
a
02,
000
1,00
0
Feet
LEG
EN
D
Torto
ise
Dat
a$+
Live
Tor
tois
e!(
Torto
ise
Burr
ow# *
Torto
ise
Car
cass
"/To
rtois
e Sc
at
XWTo
rtois
e Tr
acks
Vege
tatio
n Zo
ne B
ound
ary
(eco
tone
) ba
sed
on s
oil t
ypes
: Sh
adsc
ale
scru
b to
wes
t, cr
eoso
te b
ush
scru
b to
eas
t
Del
inea
ted
Was
hes
and
Sm
all A
rroy
os20
0ft B
uffe
rH
HSE
GS
Bou
ndar
y
^̀
HH
SEG
SLO
CAT
ION
$
Qa1
- H
oloc
ene
allu
vium
from
the
north
east
Qa2
- H
oloc
ene
allu
vium
from
the
east
Qf
- Q
uate
rnar
y (L
ate
Ple
isto
cene
and
H
oloc
ene?
) flu
vial
dep
osits
Qbf
- Q
uate
rnar
y (L
ate
Ple
isto
cene
or
o
lder
) bas
in fi
ll

DESERT TORTOISE MITIGATION COMPENSATION ANALYSIS
IS061411043744SAC 4
Photo 1 Trench profile showing stratigraphy typical of Unit Qa Tags are at 10 cm (~4 inches) intervals. The trowel at about 50 cm (~20 inches) depth lies at the transition between friable sediments above and more compact, indurated sediments below that depth.
Photo 2 Trench profile showing a thin mantle of Unit Qa overlying the pedogenically altered and friable clays of upper Unit Qbf The pedogenically altered zone is also heavily churned by rodent burrows. The sediments above about 1 meter (~39 inches) are poorly consolidated, while the clays below are massive and consolidated.
DESERT TORTOISE MITIGATION COMPENSATION ANALYSIS
IS061411043744SAC 5
Geotechnical and geoarchaeological test trenching through the Unit Qa sediment of the alluvial fans extending west from the SFS reveal primarily sandy strata intercalated with less frequent gravel lenses (Photo 1). Reworked eolian sand appears to be the primary component of this alluvium, with the more limited gravel lenses representing the bedload of each flood event, which rapidly fines upward to sand and then silty sand. Farther to the west where Unit Qa thins out and the calcareous basin fill of Unit Qbf is near the surface (Photo 2), if not exposed there, relatively indurated silty sand units do not exist. There are, however, some areas within Unit Qbf on the west side of the project area where limited tufa ledges are found that could provide some of the sheltering stratigraphy that contributes to attractive burrowing habitat for fossorial animals such as desert tortoise.
2.1.2 Surface Relief and Incision As seen in Photos 1 and 2, the thickness of Unit Qa alluvium varies from less than 1 foot to in excess of 10 feet, with thicknesses generally increasing to the east, reaching a maximum depth in areas near the state line. Elevations also increase from southwest to northeast across the HHSEGS project site and toward the state line, in part due to an increase in the elevation of the erosional surface formed on top of Unit Qbf, and in part by the thickening of the alluvial fan lobes closer to their source. Test trenching near the toes of these fans reveals a thin stratum of Unit Qa overlying friable, pedogenically altered clays marking the top of Unit Qbf (Photo 2).
A fundamental rule of geomorphology is the flatter the terrain, the less incised the drainages tend to be, in the absence of arroyo cutting, and this is indeed the case with the HHSEGS area. The landscape on the western side of the HHSEGS site is flat, with a subdued gradient generally toward Pahrump Playa about 3 miles to the west-northwest (Photos 3 and 4). Drainages in this area are hardly discernible on the ground because they are so shallowly incised (for example, the swale in Photo 4). To the east and northeast, the terrain inclines more steeply upward to the SFS (Figure 2) and, as a consequence, the drainages are incised into the alluvium of Unit Qa, and therefore can be mapped (Figure 1). Figure 2 shows the elevation profile across the HHSEGS site (red line) where Unit Qbf is exposed to the west (left side of the figure), beyond the toe of the alluvial fan lobe, which is marked by the arrows. The profile shows the relatively steep elevational gain up the fan lobe to the east. This is the phenomenon accounting for the incision of washes and small arroyos into Unit Qa closer to the state line (Figure 1).
Because of the uplift along the SFS to the east in Nevada, consequent deposition of sandy alluvium onto the east side of the Pahrump bolson where the HHSEGS site is located, and the erosional incision of these alluvial surfaces (Photo 5), terrain is more deeply incised and variable on the eastern approximate one-third of the project site than farther west. Moreover, erosion of the shallow drainages on the eastern side of the project area exposes alluvial sediments that have moderately indurated silty-sand strata (Photo 1), and this sediment may, therefore, be more suitable for large burrows than the massive, calcareous fines of the older basin fill to the west (Unit Qbf; Photo 2).

DESERT TORTOISE MITIGATION COMPENSATION ANALYSIS
IS061411043744SAC 6
Photo 3 The western portion of the HHSEGS site where calcareous basin fill (Unit Qbf) is exposed at the surface and, at this locality, supports a shadscale-tumbleweed association Note the hummocky nature of the surface, which is due primarily to fossorial rodent activity. View east-northeast toward the SFS. Arrows point to the toe of the alluvial fans (Unit Qa), which in turn is marked by the dark line of creosote bush.
Photo 4 The western portion of the HHSEGS site where Unit Qbf is exposed at the surface Hat for scale; view south-southeast. At this locality, a barren clay surface is elevated 5 to 10 cm (a few inches) above the surrounding vegetation-choked swales (to upper right of hat). These swales possess no bank and are heavily bioturbated, while the barren clay is stable, evinced by the gravel lag on its surface.

IS12
2311
0430
10SA
C F
ig_2.a
i 07-
11-1
2 da
sh
FIGU
RE 2
Elev
ation
Pro
file
Hidd
en H
ills S
olar E
lectri
c Gen
erat
ing S
yste
m
mod
ified
by
CH2M
HIL
L
2649
ft26
49 ft
2.33
mi
0.8%
2.33
mi
Teco
pa R
oad
Teco
pa R
oad
0.8%

DESERT TORTOISE MITIGATION COMPENSATION ANALYSIS
IS061411043744SAC 8
Photo 5 A wash or shallow arroyo incised into Unit Qa1 View west-southwest onto the HHSEGS site, with the road along the California-Nevada state line at the bottom of the photograph. The darker, dense shrubs in the mid-ground in the arroyo bottom are mesquite (Prosopis glandulosa). This is looking down one of the better-developed washes incised into the small alluvial fans on the east side of the HHSEGS site (Figures 1 and 2); it possesses a relatively large drainage basin including the Hidden Hills Ranch area east of the first set of scarps of the SFS.
2.2 Vegetational Patterns As is typical of valleys in the Great Basin (including both the floristically defined Mojave and Great Basin deserts), the bottom of the Pahrump Valley off the playas is typified by saltscrub or saltbush desert scrub, dominated by shrubs of the genus Atriplex, as well as other halophytes. In the Mojave Desert, these valley bottom plant communities give way up-slope to creosote bush desert scrub and, farther upslope and nearer the mountains, to more diverse desert scrub vegetation, which is not the subject of discussion here. Substrate plays an important role in the transition from saltbush scrub to creosote bush scrub, although frigid winter temperatures near valley bottoms may also play a role (for example, Beatley, 1974). For example, in the western approximately two-thirds of the HHSEGS project area, calcareous, clayey silts and clays of the valley bottom (Unit Qbf; Figure 2) support vegetation dominated by shadscale (Atriplex confertifolia, a type of saltbush) as well as other halophytes, both annual and perennial. On the sandy alluvium of Unit Qa, however, saltbush occurs only sparsely when at all, and vegetation is typified by creosote bush and burrobush, with the former being visually prominent and the latter numerically dominant (but much smaller). The sharply defined limits of the small alluvial fans, visible on the remote images as splayed lobes on the lighter-colored basin fill (Figures 1 and 2), owe their contrast as much to the limits of the dark-evergreen creosote bush (as shown in Photo 3), which does not occur on the calcareous clays of Unit Qbf, as to the change in surface albedo as one moves from the off-white, carbonate-rich soils of the bolson and onto to the darker, alluvial soils of the fans. Due to substrate control—the edaphic effects of the clay-rich, high-pH soils of Unit Qbf to the west—the ecotone between saltbush scrub to the west and creosote-burrobush scrub to the east is due to, and therefore largely concordant with, the limits of sandy alluvium issuing onto the valley floor from the east. This is consistent with field observations of the ecotone in the HHSEGS area.
2.2.1 Shadscale and Halophyte Scrub of the Bolson Floor In this part of the Mojave Desert, basin-floor plant community transitions have been most closely studied by Janice Beatley (for example, Beatley, 1976) on what was then the Nevada Test Site, about 50 to 100 miles north of the HHSEGS site. As in the valleys of the Nevada Test Site, certain shrubs extend out onto the basin floor to mingle with saltbush and the most common are wolfberry (Lycium pallidum) and hopsage (Grayia spinosa). Annual halophytes abundant on the western portion of the HHSEGS site include tumbleweed and halogeton. Although normally classified as noxious weeds, their membership in the family Chenopodiaceae is in accord with their

DESERT TORTOISE MITIGATION COMPENSATION ANALYSIS
IS061411043744SAC 9
evident tolerance of saline, high-pH soils. Microhabitat variability across the western portion of the site is affected by inverted topography in which erosional remnants of clay-filled channels and depo-basins are largely barren, while bordering broad, shallow swales are choked with vegetation (as seen in Photo 4). Other than shadscale, seepweed (Suaeda moquinii) and tumbleweed, these swales frequently support dense red-brome (Bromus madritensis) (the straw colored grass in the swale shown in Photo 4).
2.2.2 Creosote Bush Scrub of the Alluvial Fans of the Eastern Edge of the HHSEGS Project Area
The alluvial ramp leading uphill to the east and northeast is modest but nevertheless reflects a real environmental gradient along which plant associations change in response to changing edaphic, topographic, and, most likely, microclimatic conditions. These changes are more subtle than that associated with the transition from saltscrub to creosote bush desert scrub (Figure 1; Photo 3), which is relatively abrupt and related to an equally abrupt change in subsurface geology. In the case of changes within the context of creosote bush desert scrub, the following factors contribute to this generally east-west environmental gradient:
� Increasing elevation, which, even if only by several tens of feet (Figure 2), moderates extreme winter low temperatures caused by cold-air pooling in basins on still winter nights (for example, Beatley, 1975)
� Increasing depth of sandy alluvium, which, relative to the calcareous clays at greater depth (Photo 2), is a substrate that favors a suite of desert shrubs, rather than just halophytes
� Greater number and depth of desert washes, which, in turn, directly affects increased microtopographic variability
� Increased frequency and depth of discontinuous sand sheets, which tend to accumulate in the downwind portion of topographic lows
� Increasing clast size of the alluvium
Therefore, although occurring over short distances (Figure 2), the environmental changes along the gradient occupying the last mile or less of the eastern portion of the HHSEGS site are not inconsequential and, along with the abrupt change in substrate, account for the fact that the eastern approximately 33 percent of the HHSEGS project area is higher diversity desert scrub, and higher quality desert tortoise habitat.
With increasing frequency and depth of washes, sediments that may be more suitable for desert tortoise burrows (Photo 1) are exposed in the eastern portion of the HHSEGS site, at least to a modest degree (Photo 5). Perennial diversity increases with the increased frequency of desert riparian species such as cheeseweed (Ambrosia salsola), bladdersage (Salazaria mexicana), and limited mesquite (Prosopis glandulosa) near the state line (Photo 5). Discontinuous sand sheets support perennial grasses including big galleta (Pleuraphis rigida) and rice-grass (Stipa hymenoides) while the interfluves support an increasingly diverse creosote bush desert scrub with the addition of such species as ephedra (Ephedra nevadensis), ratany (Krameria erecta) and indigo bush (Psorothamnus fremontii). These and other associates join an increasing density and number of burrobush and creosote bush shrubs to comprise a scrub community that, while still desert scrub, is notably more productive than that to the west of the dividing line between shadscale and creosote bush desert scrub (Figure 1).
3.0 Desert Tortoise Survey Results The plant community present on the project site is a function of soil type, land use patterns, and many other ecological and environmental factors, and is one of the determining factors of the site’s suitability for desert tortoise. If conditions were comparable across the site and in the surrounding area, density of tortoise and their sign (tracks, burrows, scats, skeletons) would be expected to be fairly uniform throughout these areas. However, results of the desert tortoise survey completed for the site (Sundance Biology, Inc. [Sundance], 2011) indicate substantial differences in the detection rates of tortoise and sign inside and outside the site boundary, as well as both between and within the two major plant communities. The survey found only two desert tortoise within the project boundary (both near the eastern border) where 100 percent coverage surveys were completed using transects spaced at 30 feet. By contrast, 11 tortoise (adult, immature and juvenile) were detected in the area east of the project boundary where transects spaced at 30 feet were used out to 150 meters from the boundary, and a much less comprehensive transect sampling approach was used to assess the area up to 1,600 meters from the boundary, with single 30-foot-wide transects located at 200, 400, 600, 1,200, and 1,600 meters from the site boundary.

DESERT TORTOISE MITIGATION COMPENSATION ANALYSIS
IS061411043744SAC 10
Sundance (2011) indicated that the majority of the tortoise sign (burrows, scat, and tracks) was recorded onsite, but did not address the fact that this was largely a function of sampling effort as opposed to a similarity in habitat quality between the in-project and out-of-project habitats. The physical conditions and plant communities change dramatically from west to east, as described in Section 2.0, which is consistent with the findings within the project area of only two tortoise, and sign that could be generated by a very low density tortoise population (12 scats and 5 track sets.
Table 1 presents an analysis of relative desert tortoise densities based on unit of survey effort and calculated from the data collected by Sundance in the wildlife survey (Sundance, 2011). Acreages of the zone-of-influence (ZOI) transects were calculated on the basis of a 30-foot transect width, which is the width used in the other areas for assessment survey. Densities are based on the number of adult desert tortoises detected per acre surveyed. The relative densities are for comparison between the areas of this survey and are not estimates of total tortoise population resident in each area.
The data present a clear pattern of declining desert tortoise population moving from east to west. No desert tortoise was found in shadscale scrub areas on or near the HHSEGS site (that is, in the burrowing owl survey buffer or along the ZOI transects west of the site). The desert tortoise population density of the Mojave Desert scrub on the site is one fifty-sixth (1/56) the density of the ZOI east of the site in Nevada. It is one-eighth (1/8) the density of the burrowing owl buffer zone in the Mojave Desert scrub along the eastern edge of the site. Desert tortoise density in the shadscale scrub areas is effectively zero, although some transient use occurs.
TABLE 1 Relative Densities of Adult Desert Tortoise Among Distinct Areas and Vegetation Types, Based on Unit of Survey Effort
Area Surveyed Vegetation Community
Acres Surveyed
Adult Tortoises
Density (Tortoise/Acre) Acre/Tortoise
Relative Densities
Project Site 3,258 2 0.0006 1,629
Mojave Desert Scrub 1,611 2 0.0012 806 1
Shadscale Scrub 1,647 0 0 0
Burrowing Owl Survey Buffer (offsite)
652 6 0.0092 109
Mojave Desert Scrub 600 6 0.0100 100 8
Shadscale Scrub 52 0 0 0
Zone of Influence (offsite)
182 7 0.0385 26
Mojave Desert Scrub 100 7 0.0700 14 56
Shadscale Scrub 82 0 0 0
Source: Sundance, 2011
Furthermore, the density estimates provided by Sundance are inherently inflated because five tortoise, observed outside the project boundary, were used in the U.S. Fish and Wildlife Service (USFWS) predictive model (USFWS, 2010) to estimate density of tortoise within the project area. These results appear to be interpreted by the CEC to suggest that the project may support more tortoise than would be reasonably expected to occur in the compromised site. Density of tortoise using the USFWS model (2010) calculated using only the tortoise detected onsite would be estimated at 3.8 (95% CI 0.94 to 15.14).Using the same formula that CEC used, the project site may support between 0 to 7 juvenile tortoises (that is, a total population range between 1 and 22 adults, subadults, and juveniles).
Using the CEC’s calculation to estimate the number of eggs, approximately 0 to 74 eggs would be expected on the site in a given year. However, fewer eggs are likely to be onsite at any given time because it is likely that not all females are of reproduction age or elected to produce eggs during any given year. The point estimates and confidence intervals for desert tortoise and eggs are presented in Table 2.

DESERT TORTOISE MITIGATION COMPENSATION ANALYSIS
IS061411043744SAC 11
TABLE 2 Estimated Number of Desert Tortoise on the Project Site (95 percent confidence values)
Adult and Sub-adultsa Juvenile Estimatesb Eggsc Total Adult/Sub-adult and Juvenile
Lower Upper Lower Upper (Min-Max) Lower Upper
1 15 0 16 0 - 74 1 31
a Value based on formula recommended by USFWS. Numbers reflect the 95 percent confidence interval. b Values based on the equations of Turner et al., 1987. Equation assumes that juveniles account for approximately 31.1 to 51.1 percent of the overall tortoise population. If P = Percentage of juveniles in population, A = Number of adults, and J = Number of juveniles then P = J / (J + A). Therefore J = PA/ (1 – P). c Assumes a 1:1 sex ratio and that all females present would clutch in a given year. Assumes average clutches per reproductive female in a given year (1.6, see Turner et al. 1987, multiplied by the average number of eggs found in a clutch (5.8; see USFWS, 1994).
The correspondence of desert tortoise sign with vegetation communities also supports the pattern expected from the analysis of soil and vegetation communities described above, including that the western margin of Mojave Desert scrub community is sparsely occupied and of marginal quality as it grades into the shadscale scrub community. The conclusion that can and should be drawn from these analyses is that the project site is distinctly different than the area outside the project boundary in its ability to support desert tortoise and, therefore, its quality and importance to the species is low relative to the habitat to the east. The difference in density within and outside the project boundary does not support the CEC finding that the Mojave Desert scrub located within the project site is high-quality habitat warranting a 3:1 mitigation ratio for replacement of lost habitat. Furthermore, the greatest use onsite is in the far east, not throughout the Mojave Desert scrub community.
The Applicant suggests the following hierarchy of factors be used to divide tortoise habitat quality on the project:
� Primary Division: Between soil types Qa (Qa1 and Qa2) and Qb (Qf and Qbf)
� Secondary Division: High concentrations of the noxious halophytic weed Halogeton glomeratus
� Tertiary Division: Distribution and concentrations of tortoise sign
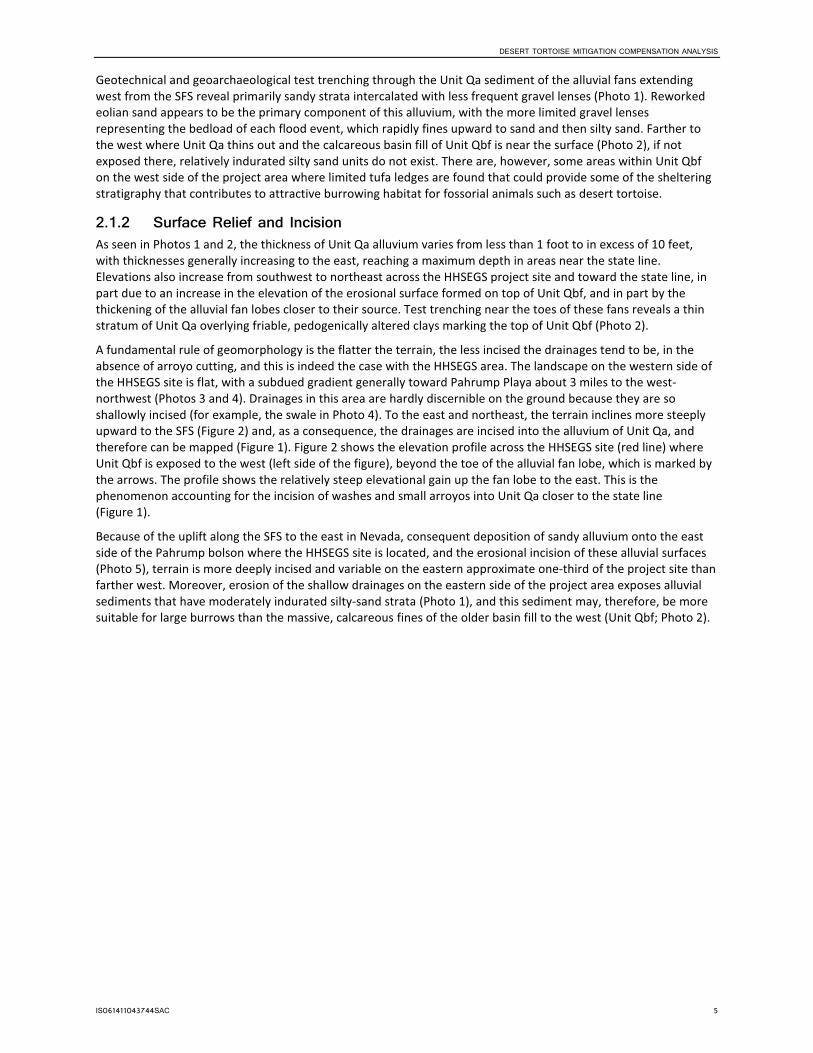
This results in three compensation ratios for the HHSEGS site, corresponding to Figure 3:
� 1.5:1 in the most concentrated tortoise use areas in Qa1, which are consistent with the greater concentration of washes
� 1:1 over most of the remainder of Qa soil types, plus Qb areas with lower halogeton concentrations, including those areas with scattered tortoise sign
� 0.5:1 throughout the remainder of the high-halogeton areas, which also coincides with the remainder of the Qb soil type.
The proposed total acreage of compensation for the project is detailed in Table 3.
TABLE 3 Total Proposed Compensation Acreage for the HHSEGS project
Compensation Ratio Impact Acreage Acres to be Acquired
0.5:1 1,248 624
1:1 1,664 1,664
1.5:1 362 543
Total 3,274 2,831

Figu
re 3
Mitig
atio
n Ra
tios
Hid
den
Hill
s S
olar
Ele
ctric
Gen
erat
ing
Sys
tem
SAC
\\Z
ION
\SA
CG
IS\P
RO
J\S
OLA
RP
RO
JEC
TS\H
IDD
EN
HIL
LS\M
APFI
LES\
2012
\DE
SER
T_TO
RTO
ISE_
MAP
S\D
T_M
EMO
_JU
LY20
12\F
IGU
RE
3_M
ITIG
ATIO
NR
ATIO
S.M
XD
SS
CO
PE
S 7/
13/2
012
7:27
:54
AM
VIC
INIT
Y M
AP
XX
XX X X
XX
X
WW
WW W W
WW
W
"
""
"" "
""
"
"
"
"
"
"
/
//
// /
//
/
/
/
/
/
/
# *
!
!!
!
!!!
!!
!!
!
!!
!!!!
!!
!!
!!
!!
!
!!
!!
!!
!!
!
!!
!!
!!
!
!!!
!!
!!
!!!
!!
!!
!
!
!
!!
!!
!! !
!!
!
!!
!
!
!!
!
!!
!
!
!!
!
!!
!
!
(
((
(
(((
((
((
(
((
((((
((
((
((
((
(
((
((
((
((
(
((
((
((
(
(((
((
((
(((
((
((
(
(
(
((
((
(( (
((
(
((
(
(
((
(
((
(
(
((
(
((
(
(
$$
$
$
$
$
$
$$
$
$
++
+
+
+
+
+
++
+
+
Qa1
Qa1
Qa2
Qa2
Qf/Q
bf
Qbf
STATELIN
E
FAULT
SYSTEM
Teco
pa R
d
CALIFORNIA
NEVADA
SCARPSSALT
BUSH
SCRUB
CREOSOTE
BUSH SCRUB
Sola
r Pla
nt 2
Sola
r Pla
nt 1
Com
mon
Are
a
02,
000
1,00
0
Feet
LEG
EN
D
Torto
ise
Dat
a$+
Live
Tor
tois
e!(
Torto
ise
Burr
ow# *
Torto
ise
Car
cass
"/To
rtois
e Sc
at
XWTo
rtois
e Tr
acks
Vege
tatio
n Zo
ne B
ound
ary
(eco
tone
) ba
sed
on s
oil t
ypes
: Sh
adsc
ale
scru
b to
wes
t, cr
eoso
te b
ush
scru
b to
eas
t
Miti
gatio
n R
atio
s1.
5:1
– A
reas
of c
once
ntra
ted
torto
ise
use
in Q
a11:
1 –
Are
as o
f low
er h
alog
eton
con
cent
ratio
n w
ith s
catte
red
torto
ise
sign
in Q
a an
d Q
b ar
eas
0.5:
1 –
Are
as o
f hig
h ha
loge
ton
conc
entra
tion,
co
rres
pond
s to
rem
aind
er o
f Qb
soil
type
Del
inea
ted
Was
hes
and
Sm
all A
rroy
os20
0ft B
uffe
rH
HSE
GS
Bou
ndar
y
^̀
HH
SEG
SLO
CAT
ION
$
Qa1
- H
oloc
ene
allu
vium
from
the
north
east
Qa2
- H
oloc
ene
allu
vium
from
the
east
Qf
- Q
uate
rnar
y (L
ate
Ple
isto
cene
and
H
oloc
ene?
) flu
vial
dep
osits
Qbf
- Q
uate
rnar
y (L
ate
Ple
isto
cene
or
o
lder
) bas
in fi
ll

DESERT TORTOISE MITIGATION COMPENSATION ANALYSIS
IS061411043744SAC 13
4.0 Mitigation Ratios on CEC-regulated Projects In the Preliminary Staff Assessment, CEC Staff stated that the mitigation ratio of 3:1 for HHSEGS “… is consistent with past Energy Commission mitigation requirements for projects with impacts to desert tortoise (for example, High Desert Power Plant Project, Calico Solar Energy Project, and the Victorville 2 Hybrid Power Project), and with Incidental Take Permits issued by CDFG for other non-Energy Commission jurisdiction projects in the region.” The Applicant reviewed these projects and found that the mitigation ratios were not a simple 3:1 ratio but ranged from 0 to 5:1. Table 4 provides a summary of the ratios for each project.
TABLE 4 Comparison of Conditions and Mitigation Ratios at Various CEC Project Sites
Project and Mitigation
Ratio(s) Description and Rationale
Victorville 2 Hybrid Power Project (07-AFC-1)
Ratio: 3:1
Final Commission Decision
July 2008
CEC-800-2008-003-CMF
Staff-recommended 3:1 mitigation ratio for combined listed species (desert tortoise and Mohave ground squirrel) with additional consideration of burrowing owl, and creosote rings. Two desert tortoises were observed onsite and four additional tortoises were found in the zone-of-influence transects. Eight tortoises had been found in a slightly earlier survey in an area overlapping the project site. The project is in native habitat, approximately 3 miles from designated critical habitat and a Desert Wildlife Management Area (DWMA). Staff noted that, compared to other projects in the Victor Valley, the proposed project site has relatively low habitat disturbance, trash, and OHV use, and a higher diversity of desert animal species. Finally, we note that the California Department of Fish and Game’s (CDFG) earlier consultations with the Applicant—prior to establishing Mohave ground squirrel presence—informed the Applicant of a 1.5:1 ratio for desert tortoise alone. All of these factors indicate that compensation at a ratio of 3:1 is required to mitigate the project’s impacts to multiple sensitive biological resources.
Calico Solar Project (08-AFC-13C)
Ratio 1:1, 3:1, and 5:1
August 2010
The Biological Opinion, dated 08 August 2010, stated that the compensation ratio was 1:1. In the Commission Decision, dated 12 November 2010, compensation was set at 1:1 for the project area south of the BNSF railroad tracks, 3:1 for the project area north of the tracks, and 5:1 for an additional area north of the tracks that had the highest numbers of tortoise observations (Commission Decision: Page 123). In this reduced footprint addressed in the Commission Decision, an estimated 22 tortoises would occupy the site (Commission Decision: Page 44). “Habitat north of the railroad … constitutes good quality habitat and supports moderate densities of desert tortoises in some areas.” Habitat quality south of the railroad to I-40 provides lower quality habitat and has been subject to long-term disturbance. Nonetheless, tortoise sign was observed there (Commission Decision: Page 45).
High Desert Power Project (97-AFC-01)
Ratio 0 to 4:1
Final Commission Decision
May 2000
High Desert’s 2081 permit, No. 2081-1999-050-6 adopted a 1:1 compensation ratio for combined desert tortoise and Mohave ground squirrel for the power plant and linears, excluding the second, 32-mile natural gas pipeline. During later workshops with CEC, the applicant agreed to a ratio of 0 to 2:1 for the power plant and linears (except the second natural gas pipeline) (Final Staff Assessment, 21 January 2000: Page 340). For the latter pipeline, the final ratio was 1.8:1 overall, varying from 1:1 to 4:1 along the pipeline (Final Commission Decision, 03 May 2000: Page 138). (It’s notable that Staff recommended slightly higher ratios than the CEC ultimately agreed to.) The variation in the ratio is because some of the route was in designated critical habitat. Also, the compensation is for both desert tortoises and Mohave ground squirrel (Final Staff Assessment, 21 January 2000: Page 340

DESERT TORTOISE MITIGATION COMPENSATION ANALYSIS
IS061411043744SAC 14
TABLE 4 Comparison of Conditions and Mitigation Ratios at Various CEC Project Sites
Project and Mitigation
Ratio(s) Description and Rationale
Beacon Solar Energy Project (08-AFC-2)
Ratio: ~0.25:1 and 3:1
Final Commission Decision
August 2010
CEC-800-2010-005 CMF
Staff-recommended compensation of 115 acres for combined listed species (desert tortoise and Mohave ground squirrel). This included 15 acres at 3:1 for 5 acres of higher-quality, occupied habitat on the linears, and 100 acres for the incidental take of animals during construction and operation. No live desert tortoises were found within the plant site boundary during the 2007 and 2008 protocol-level surveys, although three tortoises were observed immediately outside the site during protocol surveys and other activities. A small amount of other desert tortoise sign was detected within the plant site boundary that included an depredated juvenile carcass, a deteriorated adult burrow, and two other sets of old (more than 4 years since death) bone and carapace fragments. Outside the plant site, two live desert tortoises were observed north of the plant site, one associated with a burrow. The site is a former agricultural operation that is largely barren with slight regrowth; only 21 percent of the site is disturbed or regrowth scrub. The presence of transient desert tortoises in this poor habitat was deemed to likely be attributable to the proximity of the adjoining native habitat outside of the plant site rather than reflecting use by resident individuals.
Abengoa Mojave Solar Project (09-AFC-5)
Ratio: 0.27:1 (430-acre habitat loss:
118 acres mitigation)
Final Commission Decision
September 2010
CEC-800-2010-008 – CMF
The protocol surveys did not identify a resident population of desert tortoise within the project area. However, in 2006 a single live tortoise was observed in the project area. The project abuts and/or is surrounded by two DWMAs on two sides. While the majority of the 1,765-acre proposed project area is disturbed and lacks suitable forage and burrow sites for desert tortoise, there were 430 acres of ruderal and/or disturbed saltbush and creosote bush scrub. Condition of Certification BIO-15 required the project owner to mitigate for this habitat loss and incidental take of the desert tortoise by acquiring no less than 118.2 acres of land.
Blythe Solar Power Project (09-AFC-6)
Ratio: 1:1
Final Commission Decision
September 2010
CEC-800-2010-009-CMF
Project owner required to provide compensatory mitigation at a 1:1 ratio for impacts to 6,958 acres of low- to moderate-quality, occupied desert tortoise habitat and fragmentation of surrounding habitat, adjusted to reflect the final project footprint. One desert tortoise was observed on the western part of the project disturbance area and five were observed west of the site in the buffer area. Fresh/recent tortoise sign was concentrated primarily in the western half of the project and west. Densities were not estimated, but were very low on the site, based on tortoise sign, and unevenly distributed.

DESERT TORTOISE MITIGATION COMPENSATION ANALYSIS
IS061411043744SAC 15
TABLE 4 Comparison of Conditions and Mitigation Ratios at Various CEC Project Sites
Project and Mitigation
Ratio(s) Description and Rationale
Genesis Solar Energy Project (09-AFC-8)
Ratio: 1:1 and 5:1
Final Commission Decision
September 2010
CEC-800-2010-011 CMF
The evidence showed that the project disturbance area is currently unoccupied by desert tortoise and the northwestern portion of the GSEP site is suitable or marginally suitable habitat, while the remainder of the site is not habitat for desert tortoise. CEC, BLM, CDFG and USFWS staff agreed that the habitat within the project disturbance area is of lower quality closer to the Ford playa and is higher quality toward the upper bajadas, but considered the entire GSEP site to contain suitable habitat for desert tortoise and could potentially be occupied by this species in the future. The solar plant site is not within critical habitat or a DWMA, although the linear features, south of Interstate-10 intersected both.
Mitigation for direct impacts as follows:
On the solar plant site: 1:1 On the linears within DWMA/Critical Habitat: 5:1
Palen Solar Power Project (09-AFC-07)
Ratio: 1:1 and 5:1
Final Commission Decision
December 2010
CEC-800-2010-010 CMF
Potential direct impacts to the desert tortoise from the proposed project include: (1) the permanent loss of 3,738 acres of low to moderate quality occupied habitat, including 201 acres of designated critical habitat within the Chuckwalla Desert Tortoise Critical Habitat Unit.
Mitigation for direct impacts as follows: Within Critical Habitat 228 acres at 5:1 = 1,140 acres Outside Critical Habitat 3,909 acres at 1:1 = 3,909 Desert Tortoise Total 4,137
Total Desert Tortoise Mitigation = 5,049 acres
Rice Solar Energy Project (09-AFC-10)
Ratio: 1:1 and 3:1
Final Commission Decision
December 2010
CEC-800-2010-019 CMF
Staff, in consultation with USFWS, BLM, and CDFG biologists, determined that a mitigation ratio of 1:1 would reduce permanent and long-term impacts to approximately 1,412 acres of lower-quality habitat at the solar generator site to less than significant. For permanent and long-term impacts to approximately 37 acres of higher-quality habitat along the generator tie-line, access road, and at the interconnector substation, a mitigation ratio of 3:1 would reduce impacts to less than significant.
Recorded during protocol surveys of solar site and transmission line route in 2009: 7 tortoises, 91 shell-skeletal remains, 66 burrows, 3 egg shell fragment locations, and 56 scat events. Most of the live desert tortoise occurrences were noted in the ZOI transects surrounding the solar field site and transmission line. Recent desert tortoise sign was concentrated in the northwest portion of the solar field site and along the southern half of the transmission line route. In the ZOI transects, recent sign was most abundant to the north and west of the solar field site, and along the southern half of the transmission line route.
Palmdale Hybrid Power Project (08-AFC-9)
Ratio: No compensation.
Final Commission Decision
August 2011
CEC-800-2011-005 CMF
No compensation was required for desert tortoise.
Desert tortoise or their sign were not located on the power plant site; however, one burrow that potentially could be used by a tortoise was found in 2008 on the 3,960-foot ZOI transect for the power plant site, west of the site. This burrow was overgrown with vegetation and had no sign of recent use (e.g., scat, tracks, etc.). Habitat quality is Low on the power plant site and moderate on the transmission line
HHSEGS is most similar to the Blythe Solar Power Project (BSPP), in that most of the habitat is actually offsite and deteriorates rapidly away from this habitat, onto the project site. Unlike BSPP, however, HHSEGS actually has areas

DESERT TORTOISE MITIGATION COMPENSATION ANALYSIS
IS061411043744SAC 16
that are highly marginal, or could even be considered non-habitat, used only transitionally. Therefore, using the criterion of precedence based on other projects, a 1:1 ratio would be most appropriate.
5.0 Conclusions and Recommendations The topographic, geologic, ecologic, and botanical circumstances at the HHSEGS site are consistent with the desert tortoise survey results and support the finding that the habitat quality for desert tortoise is extremely low in the western portions of the site and transitions toward more suitable habitat to the east. The results of this analysis indicate that the analysis of the site ecology, as well as the tortoise survey data, can and should be used to indicate the areas of relative importance to desert tortoise, and thus serve as a better indicator of habitat quality than the coarse-scale habitat classification provided by Garcia and Associates (CH2M HILL, 2011).
Based on these findings and precedent established on recent CEC-authorized projects, a 3:1 mitigation ratio for replacement of lost habitat is inappropriate for HHSEGS. Precedent suggests that a 1:1 mitigation ratio be required by CEC for impacts to desert tortoise habitat on this site, with consideration given to areas that may warrant a 0.5:1 ratio, such as areas of extensive weed infestation that render existing conditions unsuitable for supporting desert tortoise and thus do not warrant replacement through mitigation, and 1:1, such as areas with lower halogeton concentration with scattered tortoise sign.
6.0 References Beatley, J. C. 1974. Effects of rainfall and temperature on the distribution and behavior of Larrea tridentata (creosote bush) in the Mojave Desert of Nevada. Ecology 55: 245-261.
Beatley, J. C. 1975. Climates and vegetation pattern across the Mojave/Great Basin Desert transition of southern Nevada. American Midland Naturalist: 93: 53-70.
Beatley, J. C. 1976. Vascular plants of the Nevada Test Site, and central-southern Nevada. National Technical Information Service Report TID-26881, 308 p.
CH2M HILL. 2011. Spring 2011 Botanical Resources survey of the Hidden Hills Solar Energy Generating System Site. Prepared by CH2M HILL with data collected by Garcia and Associates. December 13.
Lundstrom, S. C., S. A. Mahan, R. J. Blakely, J. B. Paces, O. D. Young, J. B. Workman, and G. L. Dixon. 2002. Geologic Map of the Mound Spring Quadrangle, Nye and Clark Counties, Nevada, and Inyo County, California. U. S. Geological Survey, Miscellaneous Field Studies Map MF–2339. Version 1.0. Denver, CO.
Scheirer, D. S., D. S. Sweetkind and J. J. Miller. 2010. Multiple phases of basin formation along the Stateline fault system in the Pahrump and Mesquite Valleys, Nevada and California. Geosphere 6(2): 93-129.
Shmida, A., M. Evenari, and I. Noy-Meir. 1986. Hot desert ecosystems: an integrated view. In Hot deserts and arid shrublands, B (M. Evenari et al., Eds.), pp. 379-387. Elsevier, Amsterdam.
Sundance Biology, Inc. 2011. Presence/Absence Survey for the Desert Tortoise (Gopherus agassizii) and other Sensitive Wildlife on the Proposed Hidden Hills SEGS Project, Inyo County, California. November 30.
Turner, F.B., K.H. Berry, D.C. Randall, and G.C. White. 1987. Population ecology of the desert tortoise at Goffs, California, 1983-1986. Report to Southern California Edison Co., Rosemead, California.
U.S. Fish and Wildlife Service (USFWS). 2010. Preparing for any action that may occur within the range of the Mojave desert tortoise (Gopherus agassizii). Carlsbad, CA
U.S. Fish and Wildlife Service (USFWS). 1994. Desert Tortoise (Mojave Population) Recovery Plan. U.S. Fish and Wildlife Service, Portland, Oregon.

*indicates change
BEFORE THE ENERGY RESOURCES CONSERVATION AND DEVELOPMENT COMMISSION OF THE STATE OF CALIFORNIA
1516 NINTH STREET, SACRAMENTO, CA 95814 1-800-822-6228 – WWW.ENERGY.CA.GOV
APPLICATION FOR CERTIFICATIONFOR THE HIDDEN HILLS SOLAR ELECTRICGENERATING SYSTEM
DOCKET NO. 11-AFC-02PROOF OF SERVICE(Revised 6/18/2012)
APPLICANTBrightSource EnergyStephen Wiley1999 Harrison Street, Suite 2150Oakland, CA [email protected]
BrightSource EnergyBradley BrownlowMichelle L. Farley1999 Harrison Street, Suite 2150Oakland, CA [email protected]@brightsourceenergy.com
BrightSource EnergyClay JensenGary Kazio410 South Rampart Blvd., Suite 390Las Vegas, NV [email protected]@brightsourceenergy.com
APPLICANTS’ CONSULTANTSStrachan Consulting, LLCSusan StrachanP.O. Box 1049Davis, CA [email protected]
CH2MHillJohn Carrier2485 Natomas Park Drive, Suite 600 Sacramento, CA [email protected]
COUNSEL FOR APPLICANTEllison, Schneider and Harris, LLPChris EllisonJeff HarrisSamantha Pottenger2600 Capitol Avenue, Suite 400Sacramento, CA [email protected]@[email protected]
INTERVENORSJon William ZellhoeferP.O. Box 34Tecopa, CA [email protected]
Center for Biological DiversityLisa T. Belenky, Sr. Attorney351 California Street, Ste. 600San Francisco, CA 94104e-mail service [email protected]
Center for Biological DiversityIleene Anderson, Public LandsDesert DirectorPMB 4478033 Sunset BoulevardLos Angeles, CA 90046e-mail service [email protected]
Old Spanish Trail AssociationJack Prichett857 Nowita PlaceVenice, CA [email protected]
INTERVENORS (con’t.)Cindy R. MacDonald3605 Silver Sand CourtN. Las Vegas, NV 89032e-mail service [email protected]
INTERESTED AGENCIESCalifornia [email protected]
Great Basin Unified APCDDuane OnoDeputy Air Pollution Control Officer157 Short StreetBishop, CA [email protected]
County of InyoDana CromDeputy County CounselP.O. Box MIndependence, CA [email protected]
Nye CountyLorinda A. Wichman, ChairmanBoard of County SupervisorsP.O. Box 153Tonopah, NV [email protected]
Nye County Water DistrictL. Darrel LacyInterim General Manager2101 E. Calvada BoulevardSuite 100Pahrump, NV [email protected]

2
INTERESTED AGENCIES (con’t.)National Park ServiceMichael L. ElliottCultural Resources SpecialistNational Trails IntermountainRegionP.O. Box 728Santa Fe, NM 87504-0728e-mail service [email protected]
ENERGY COMMISSION –DECISIONMAKERSKAREN DOUGLASCommissioner and Presiding Membere-mail service [email protected]
CARLA PETERMANCommissioner and Associate [email protected]
Ken CelliHearing [email protected]
Galen LemeiAdvisor to Presiding Membere-mail service [email protected]
Jim BartridgeAdvisor to Associate [email protected]
ENERGY COMMISSION –STAFFMike MonasmithSenior Project [email protected]
Richard RatliffStaff Counsel [email protected]
Kerry WillisStaff [email protected]
ENERGY COMMISSION –PUBLIC ADVISERJennifer JenningsPublic Adviser’s Officee-mail service [email protected]

3
DECLARATION OF SERVICE
I, Mary Finn, declare that on July 13, 2012, I served and filed copies of the attached Preliminary Staff AssessmentComments, Set 1, dated July 13, 2012. This document is accompanied by the most recent Proof of Service list, located on the web page for this project at: www.energy.ca.gov/sitingcases/hiddenhills/index.html.
The document has been sent to the other parties in this proceeding (as shown on the Proof of Service list) and to the Commission’s Docket Unit or Chief Counsel, as appropriate, in the following manner: (Check all that Apply)For service to all other parties:
x Served electronically to all e-mail addresses on the Proof of Service list;Served by delivering on this date, either personally, or for mailing with the U.S. Postal Service with first-class postage thereon fully prepaid, to the name and address of the person served, for mailing that same day in the ordinary course of business; that the envelope was sealed and placed for collection and mailing on that date to those addresses NOT marked “e-mail preferred.”
ANDFor filing with the Docket Unit at the Energy Commission:
x by sending an electronic copy to the e-mail address below (preferred method); ORby depositing an original and 12 paper copies in the mail with the U.S. Postal Service with first class postage thereon fully prepaid, as follows:
CALIFORNIA ENERGY COMMISSION – DOCKET UNITAttn: Docket No. 11-AFC-021516 Ninth Street, MS-4Sacramento, CA [email protected]
OR, if filing a Petition for Reconsideration of Decision or Order pursuant to Title 20, § 1720:Served by delivering on this date one electronic copy by e-mail, and an original paper copy to the Chief Counsel at the following address, either personally, or for mailing with the U.S. Postal Service with first class postage thereon fully prepaid:
California Energy CommissionMichael J. Levy, Chief Counsel1516 Ninth Street MS-14Sacramento, CA [email protected]
I declare under penalty of perjury under the laws of the State of California that the foregoing is true and correct, that I am employed in the county where this mailing occurred, and that I am over the age of 18 years and not a party to the proceeding.
Mary Finn, CH2M Hill