Embed Size (px)
Citation preview

2013-2017 Gas Access Arrangement Review –
Access Arrangement Information
Appendix 5G:
Victorian Gas Distribution Network annual material cost escalators
Submitted 30 March 2012

Victorian Gas Distribution Network annual material cost escalators 2013-17
Final Report 28 March 2012
Victorian Gas Distribution Network annual material cost escalators 2013-17
Victorian Gas Distribution Network annual material cost escalators 2013-17
Final Report 28 March 2012
Sinclair Knight Merz ABN 37 001 024 095 100 Christie St, St Leonards NSW 2065 Web: www.skmconsulting.com
COPYRIGHT: The concepts and information contained in this document are the property of SinclairKnight Merz Pty Ltd. Use or copying of this document in whole or in part without the writtenpermission of Sinclair Knight Merz constitutes an infringement of copyright.
LIMITATION: This report has been prepared on behalf of and for the exclusive use of SinclairKnight Merz Pty Ltd’s Client, and is subject to and issued in connection with the provisions of theagreement between Sinclair Knight Merz and its Client. Sinclair Knight Merz accepts no liability or responsibility whatsoever for or in respect of any use of or reliance upon this report by any thirdparty.
SINCLAIR KNIGHT MERZ
HA01649 Vic gas escalation factors final report2.docx PAGE i

Victorian Gas Distribution Network annual material cost escalators 2013-17
Contents 1. Executive Summary 1 2. Terms of Reference 6
2.1. Objective 6 2.2. Scope 6 2.3. Project Outcomes and Deliverables 7
3. Introduction 8 3.1. SKM’s relevant experience 8
4. Methodology 9 4.1. The need for Materials Cost Escalation 10
5. Updating Movements in Key Cost Drivers 12 5.1. CPI 12 5.2. The US$ to AUD Exchange rate 13 5.3. Construction Costs 14 5.4. Commodity Prices 16
6. Conclusion & recommendations 27 Appendix A Likely Effects of Carbon Pricing 30 Appendix B SKM recent experience 32
SINCLAIR KNIGHT MERZ HA01649 Vic gas escalation factors final report2.docx PAGE 2

Victorian Gas Distribution Network annual material cost escalators 2013-17
Limitation Statement
Forecasts are by nature uncertain. SKM has prepared these projections as an indication of what it considers the most likely outcome in a range of possible outcomes. These forecasts represent the author's opinion on what is considered to be reasonable forecasts and outcomes, as at the time of production of the report and based on the information set out in this report.
SKM has used a number of publicly available sources, other forecasts it believes to be credible, and its own judgement and estimates as the basis for developing the cost escalators contained in this report. The actual outcomes will depend on complex interactions of policy, technology, international markets, and multiple suppliers and end users, all subject to uncertainty and beyond the control of SKM, and hence SKM cannot warrant the projections contained in this report.
Expert Witness Compliance statement
In providing the materials cost escalators contained within this report, SKM has read and agreed to be bound by the guidelines for expert witnesses in proceedings in the Federal Court of Australia, as published by Chief Justice M.E.J. Black on 5th May 20081
In providing consultative services in other assignments, SKM acknowledges a pre-existing relationship with Victorian Gas Distribution Networks, but is confident such relationships do not compromise SKM’s objectivity in defending its professional opinion based on specialised knowledge and capabilities held in the area of developing materials cost escalation rates for the Australian energy industry.
1 Available as a download from: http://www.fedcourt.gov.au/how/prac_direction.html#current
SINCLAIR KNIGHT MERZ HA01649 Vic gas escalation factors final report2.docx PAGE 3
Victorian Gas Distribution Network annual material cost escalators 2013-17
SINCLAIR KNIGHT MERZ HA01649 Vic gas escalation factors final report2.docx PAGE 4
Document history and status Revision Date issued Reviewed by Approved by Date approved Revision type
A 3/2/2012 J Reddel B Kearney 3/2/2012 Draft for comment
B 6/3/2012 B Kearney B Kearney 6/3/2012 Final draft for review
1 13/3/2012 J Reddel B Kearney 13/3/2012 Final report
2 28/3/2012 B Kearney B Kearney 28/3/2012 (Revised) Final report
Distribution of copies Revision Copy no Quantity Issued to
A 1 1 SP Ausnet for Victorian gas distributors
B 1 1 SP Ausnet for Victorian gas distributors
1 1 1 SP Ausnet, for Victorian gas distributors
2 1 1 SP Ausnet, for Victorian gas distributors
Printed: 29 March 2012
Last saved: 29 March 2012 06:25 AM
File name: HA01649 Vic gas escalation factors final report2.docx
Author: B Kearney
Project manager: B Kearney
Name of organisation: SP Ausnet for Victorian Gas Distribution Networks
Name of project: Annual material cost escalators 2013-17
Name of document: Report
Document version: Final
Project number: HA01649

Victorian Gas Distribution Network annual material cost escalators 2013-17
1. Executive Summary Sinclair Knight Merz (SKM) was engaged by the Victorian Gas Distribution Business’ (VGDBs) to review factors likely to affect price escalation in their material costs over the period 2013-2017, using a 2011 base date for cost forecasts, and propose suitable materials cost escalation rates.
SKM understands the outputs of this assignment are likely to form an input in the development of VGDBs’ access arrangement submissions to the Australian Energy Regulator (AER) for their forthcoming regulatory control period of 2013-2017.
In previous decisions for electricity network service providers (including the most recent decisions for Aurora (draft), the NSW, Victorian and South Australian Distribution Businesses’), the AER has allowed for costs related to capex and opex provisions to be escalated in real terms. To date real price escalation of materials has not been allowed by the AER in gas access arrangement decisions, however SKM has the view that cost pressures for gas distribution are similar to those for electricity, and real price escalation is a valid component of efficient costs.
The AER has used CPI to account for the materials escalation expected to materialise in relation to gas network costs to date. The AER has recognised CPI is not a good proxy for movements in electricity network materials and labour costs, and SKM considers the same applies to gas networks, and the escalators presented in this report represent the best available information on likely future materials costs for the gas networks businesses.
The approach accepted by the AER in recent electricity network decisions modelled the changing price of equipment and project costs through combining independent forecast movements in the price of input components, with ‘weightings’ for the relative contribution of each component to final equipment/project costs. This in turn generated real cost forecasts for the regulatory control period under review.
In developing its forecast materials escalation rates for VGDBs’ annual materials costs during this assignment, SKM has maintained consistency with the methodology for modelling cost escalation as accepted by the AER in recent decisions, and the AER’s current position on cost escalation as expressed in the Aurora energy draft decision.
The Commonwealth Government has legislated for a greenhouse gas emissions trading scheme (Clean Energy Future) to commence in July 2012. Around 500 large emitters and energy users in Australia will be required to purchase permits to cover their emissions, adding to their costs and hence prices. Emissions costs will be borne by direct emitters, and embodied emissions in energy used by industry will also be a cost due to passthrough of upstream emissions from electricity
SINCLAIR KNIGHT MERZ
HA01649 Vic gas escalation factors final report2.docx PAGE 1
Victorian Gas Distribution Network annual material cost escalators 2013-17
generators and wholesale gas. These costs will flow through into materials and equipment prices, in proportion to the “embodied emissions” contained within those materials and their manufacture.
Using the carbon price and emissions intensity of materials likely to face material costs from emissions trading, SKM has modelled the additional impact of emissions trading on commodity prices. As the emissions trading scheme is now law, SKM considers this is a valid component of future costs, and considers the “with emissions trading” costs presented in this report to be the most likely costs faced by the VGDBs over the upcoming access arrangement period.
The escalation factors presented within this report represent SKM’s calculated best estimate of likely materials cost escalation components for use within project estimation to account for the predicted movement in project materials cost drivers over the periods June 2011 (base year) to 2017, relative to Australian National CPI.
The escalation factors presented are specific to the operating environment faced by the VGDBs, and are based on the most up-to-date information available at the time of compilation.
SKM had modelled escalators at three levels:
Underlying commodities (cost drivers for materials, plus labour)
Materials costs (for purchases of common network materials)
Project costs (installed costs, including materials and labour)
The tables on the following pages present the results of SKM’s analysis and modelling of future materials and project costs.
Table 1 presents the forecast escalation rates for the underlying drivers of network infrastructure plant and equipment costs.
Table 2 presents forecasts for escalation rates based on the movements in underlying cost drivers, but at the asset category and project levels.
Table 3 presents cumulative real escalators for each asset category and project type. These escalators use a July 2011 base date (the reference date for cost forecasts by the VGDBs cost estimates)2, and show the average escalation for each calendar year to the end of the forthcoming access arrangement period.
2 The escalator used for the 2011 year is a half year (i.e. escalation to the start of 2012 calendar year).
SINCLAIR KNIGHT MERZ HA01649 Vic gas escalation factors final report2.docx PAGE 2

Victorian Gas Distribution Network annual material cost escalators 2013-17
Table 1 Average annual real change in underlying network materials cost drivers
Cost Driver Name Dec‐11 Dec‐12 Dec‐13 Dec‐14 Dec‐15 Dec‐16 Dec‐17
Without emissions trading Manufacturing costs (CPI) 0.00% 0.00% 0.00% 0.00% 0.00% 0.00% 0.00% Aluminium -4.80% -7.96% 6.30% 8.45% 4.65% 2.03% 12.28% Copper 1.30% -8.30% 1.08% -0.39% -2.79% -3.22% 7.72% Steel 3.40% -6.24% 2.21% 3.67% -1.11% -0.54% 12.98% Oil 3.03% 5.91% 1.85% 9.15% 6.89% 5.19% 13.51% HDPE 1.82% 3.54% 1.11% 5.49% 4.14% 3.11% 8.11% General Labour 0.65% 1.10% 1.15% 1.65% 1.60% 1.85% 2.50% Site Labour 0.80% 0.90% 1.30% 1.80% 2.05% 2.05% 2.20% Construction Costs -0.24% -1.30% -1.24% -1.08% -0.40% 0.08% 0.56% With emissions trading Manufacturing costs (CPI) 0.00% 0.00% 0.00% 0.00% 0.00% 0.00% 0.00% Aluminium -4.80% -7.96% 7.26% 8.59% 4.81% 2.33% 12.37% Copper 1.30% -8.30% 1.11% -0.39% -2.78% -3.21% 7.73% Steel 3.40% -6.24% 2.60% 3.75% -1.01% -0.38% 13.02% Oil 3.03% 5.91% 1.85% 9.15% 6.89% 5.19% 13.51% HDPE 1.82% 3.54% 1.51% 5.49% 4.14% 3.15% 8.10% General Labour 0.65% 1.10% 1.15% 1.65% 1.60% 1.85% 2.50% Site Labour 0.80% 0.90% 1.30% 1.80% 2.05% 2.05% 2.20% Construction Costs -0.24% -1.30% -1.24% -1.08% -0.40% 0.08% 0.56% Underlying CPI CPI 3.3% 3.3% 2.7% 2.5% 2.5% 2.5% 2.5% Marginal impact of emissions trading Aluminium 0.95% 0.15% 0.17% 0.31% 0.08% Copper 0.03% 0.01% 0.01% 0.01% 0.01% Steel 0.39% 0.08% 0.10% 0.16% 0.03% HDPE 0.40% 0.00% 0.00% 0.04% 0.00%
As can be seen from the table above, the marginal carbon price impact for directly affected materials is modest but material in the context of real price escalation, in the range of 0.1% for copper to 1.7% for aluminium, with the key material for gas networks HDPE at 0.4%. Larger impacts can be seen in the year to Dec 2018 when the level of transitional assistance for emissions intensive industries is reduced, however this is beyond the time horizon for this report. It shows, however, that carbon pricing will have an impact on materials costs for gas networks, and that the transitional trade assistance is effective at reducing but not eliminating this impact in the first 5 years of the scheme.
SINCLAIR KNIGHT MERZ HA01649 Vic gas escalation factors final report2.docx PAGE 3

Victorian Gas Distribution Network annual material cost escalators 2013-17
Table 2 Average annual real change in cost of materials and projects
Cost Driver Name Dec‐11 Dec‐12 Dec‐13 Dec‐14 Dec‐15 Dec‐16 Dec‐17
Without emissions trading Materials and labour HDPE Pipe 1.36% 2.66% 0.83% 4.12% 3.10% 2.33% 6.08% Steel Pipe (protected) 1.74% -3.05% 1.13% 1.95% -0.47% -0.21% 6.65% Copper fittings and products 0.78% -4.98% 0.65% -0.24% -1.67% -1.93% 4.63% Plastic fittings and products 0.91% 1.77% 0.55% 2.74% 2.07% 1.56% 4.05% Meters 0.75% -1.66% 0.50% 0.71% -0.36% -0.27% 2.98% Regulators 0.75% -1.66% 0.50% 0.71% -0.36% -0.27% 2.98% Meter upstands 1.70% -3.12% 1.11% 1.84% -0.56% -0.27% 6.49% Pipe laying 0.28% -0.45% 0.07% 0.32% 0.48% 0.80% 1.89% Meter installation 0.80% 0.90% 1.30% 1.80% 2.05% 2.05% 2.20% Regulator installation 0.80% 0.90% 1.30% 1.80% 2.05% 2.05% 2.20% Installed project costs HDPE Distribution Pipe installed 0.48% 0.13% 0.21% 1.01% 0.95% 1.07% 2.63% Steel distribution main installed 0.57% -0.97% 0.28% 0.65% 0.29% 0.60% 2.84% PE Service installed (excl meter) 0.92% 0.63% 1.22% 1.97% 1.84% 1.81% 2.92% Meter installed 0.81% 0.48% 0.91% 1.77% 1.45% 1.35% 2.86% Regulator installed 0.79% -0.63% 0.84% 1.26% 0.71% 0.67% 2.94% With emissions trading Materials and labour HDPE Pipe 1.36% 2.66% 1.13% 4.12% 3.11% 2.36% 6.07% Steel Pipe (protected) 1.74% -3.05% 1.33% 1.99% -0.42% -0.13% 6.67% Copper fittings and products 0.78% -4.98% 0.67% -0.23% -1.67% -1.92% 4.64% Plastic fittings and products 0.91% 1.77% 0.75% 2.74% 2.07% 1.58% 4.05% Meters 0.75% -1.66% 0.58% 0.73% -0.34% -0.24% 2.99% Regulators 0.75% -1.66% 0.58% 0.73% -0.34% -0.24% 2.99% Meter upstands 1.70% -3.12% 1.30% 1.88% -0.51% -0.19% 6.51% Pipe laying 0.28% -0.45% 0.07% 0.32% 0.48% 0.80% 1.89% Meter installation 0.80% 0.90% 1.30% 1.80% 2.05% 2.05% 2.20% Regulator installation 0.80% 0.90% 1.30% 1.80% 2.05% 2.05% 2.20% Installed project costs HDPE Distribution Pipe installed 0.48% 0.13% 0.27% 1.01% 0.95% 1.08% 2.63% Steel distribution main installed 0.57% -0.97% 0.33% 0.65% 0.30% 0.62% 2.85% PE Service installed (excl meter) 0.92% 0.63% 1.27% 1.97% 1.85% 1.82% 2.92% Meter installed 0.81% 0.48% 0.98% 1.77% 1.46% 1.36% 2.86% Regulator installed 0.79% -0.63% 0.89% 1.26% 0.72% 0.69% 2.95%
SINCLAIR KNIGHT MERZ HA01649 Vic gas escalation factors final report2.docx PAGE 4

Victorian Gas Distribution Network annual material cost escalators 2013-17
Table 3 Cumulative real increase in cost of materials and projects (Jul-11 = 1.0)
Cost Driver Name Dec‐11 Dec‐12 Dec‐13 Dec‐14 Dec‐15 Dec‐16 Dec‐17
Without emissions trading Materials and labour HDPE Pipe 1.007 1.034 1.042 1.085 1.119 1.145 1.214 Steel Pipe (protected) 1.009 0.978 0.989 1.008 1.003 1.001 1.068 Copper fittings and products 1.004 0.954 0.960 0.958 0.942 0.924 0.966 Plastic fittings and products 1.005 1.022 1.028 1.056 1.078 1.095 1.139 Meters 1.004 0.987 0.992 0.999 0.995 0.993 1.022 Regulators 1.004 0.987 0.992 0.999 0.995 0.993 1.022 Meter upstands 1.009 0.977 0.988 1.006 1.000 0.998 1.062 Pipe laying 1.001 0.997 0.998 1.001 1.006 1.014 1.033 Meter installation 1.004 1.013 1.026 1.045 1.066 1.088 1.112 Regulator installation 1.004 1.013 1.026 1.045 1.066 1.088 1.112 Installed project costs HDPE Distribution Pipe installed 1.002 1.004 1.006 1.016 1.026 1.037 1.064 Steel distribution main installed 1.003 0.993 0.996 1.002 1.005 1.011 1.040 PE Service installed (excl meter) 1.005 1.011 1.023 1.043 1.063 1.082 1.113 Meter installed 1.004 1.009 1.018 1.036 1.051 1.065 1.096 Regulator installed 1.004 0.998 1.006 1.019 1.026 1.033 1.063 With emissions trading Materials and labour HDPE Pipe 1.007 1.034 1.045 1.088 1.122 1.149 1.218 Steel Pipe (protected) 1.009 0.978 0.991 1.011 1.006 1.005 1.072 Copper fittings and products 1.004 0.954 0.960 0.958 0.942 0.924 0.967 Plastic fittings and products 1.005 1.022 1.030 1.058 1.080 1.097 1.142 Meters 1.004 0.987 0.993 1.000 0.997 0.994 1.024 Regulators 1.004 0.987 0.993 1.000 0.997 0.994 1.024 Meter upstands 1.009 0.977 0.990 1.008 1.003 1.001 1.066 Pipe laying 1.001 0.997 0.998 1.001 1.006 1.014 1.033 Meter installation 1.004 1.013 1.026 1.045 1.066 1.088 1.112 Regulator installation 1.004 1.013 1.026 1.045 1.066 1.088 1.112 Installed project costs HDPE Distribution Pipe installed 1.002 1.004 1.006 1.017 1.026 1.037 1.064 Steel distribution main installed 1.003 0.993 0.996 1.003 1.006 1.012 1.041 PE Service installed (excl meter) 1.005 1.011 1.024 1.044 1.063 1.083 1.114 Meter installed 1.004 1.009 1.019 1.037 1.052 1.066 1.097 Regulator installed 1.004 0.998 1.007 1.019 1.027 1.034 1.064
SINCLAIR KNIGHT MERZ HA01649 Vic gas escalation factors final report2.docx PAGE 5

Victorian Gas Distribution Network annual material cost escalators 2013-17
2. Terms of Reference This section presents the Terms of Reference for this assignment.
2.1. Objective
The objective of this assignment is to provide assistance to VGDBs in preparation of their regulatory proposals, in particular through the production of an independent consultant’s report, to be used as supporting documentation in the Regulatory Submission process, which documents the process undertaken by SKM’s in:
Identifying the relevant direct and indirect inputs to the capital and operating expenditure programs over the upcoming access arrangement period, for which there are credible forecasts;
Describing the properties of each forecast (e.g. when it was made, who it was made by, for what purpose it was made), and select and explain the choice of point estimate for each forecast;
Identifying the drivers behind each of the aforementioned forecasts;
Examining each of the main items of plant, equipment, and services for the Victorian networks and establishing a suitable percentage contribution of each of the individual direct and indirect input components of the item;
Deriving a weighted average escalation factor, using the above information, for each main item of the VGDBs expenditure; and
Identify the impact of greenhouse (carbon) emissions trading on materials costs.
2.2. Scope
The scope of the study prescribes that the assignment, and associated final report, will:
Follow the approach adopted by the AER in recent electricity network decisions;
Describe the annual material escalation factor for relevant indirect and direct inputs into standard gas distribution assets (eg. PE, steel, labour etc) for the next regulatory control period;
Describe the annual material escalator factor for each standard distribution asset class;
Describe the forecasting methodology used by SKM including the key drivers likely to impact on material escalation over the next regulatory control period;
Disclose any external information relied on by SKM in reaching its conclusions;
Describe SKM’s relevant expertise in relation to the scope of works.
SINCLAIR KNIGHT MERZ HA01649 Vic gas escalation factors final report2.docx PAGE 6
Victorian Gas Distribution Network annual material cost escalators 2013-17
2.2.1. Carbon price impact on cost escalators
SKM’s modelling of forecast material costs escalation rates for gas network assets has been enhanced to allow the modelling to include the likely impacts of carbon pricing on network infrastructure costs. This additional future cost pressure will become relevant through the implementation of Australia’s Clean Energy Future (CEF) emissions trading scheme in 2012.
The intended operation of the CEF will impose additional costs on greenhouse gas emitters, which will flow through to prices of services, materials and equipment in proportion to the embodied emissions and emissions from upstream energy production and transformation.
SKM has modelled the likely range of additional costs to be imposed by the CEF, using carbon intensity data, CEF permit price modelling by Treasury, and the effect of industry assistance for Emissions Intensive Trade Exposed (EITE) industries through allocation of free permits during the first 5 years of the CEF scheme. SKM considers these costs to be a credible and even likely source of cost pressures on the efficient costs of network operators in the upcoming regulatory control period.
Further detail on the methodology for modelling impacts of a CEF are contained in Appendix A
2.3. Project Outcomes and Deliverables
The primary deliverable for this assignment is a clear and concise independent consultancy report, compiled expressly for, and with specific relevance to, VGDBs.
The report includes:
a section providing a detailed account of the SKM methodology applied during each stage of the analysis; (Chapter 3)
a detailed account of all information and assumptions (e.g.: the basis of CPI figures) made by SKM during the development of its materials cost escalators, including the source of such information and assumptions; (throughout Chapter 3 and Chapter 5)
a consistent system of presenting the historical and forecast values and numbers (e.g.: real terms in financial year format); (throughout Chapter 5); and
An account of SKM’s recommendations; (Chapter 6 ).
SKM also notes that this report;
Was developed with the aim of being provided to the AER in support of VGDBs’ access arrangement submissions, and has therefore be produced to a standard suitable for use as a public document.
Was developed with regard to recent AER Decisions.
SINCLAIR KNIGHT MERZ HA01649 Vic gas escalation factors final report2.docx PAGE 7

Victorian Gas Distribution Network annual material cost escalators 2013-17
3. Introduction Sinclair Knight Merz (SKM) was engaged by the Victorian Gas Distribution Businesses (VGDBs) to assist in developing an enhanced understanding of the cost pressures faced by these entities through material price escalation to 2017.
The VGDBs are preparing to submit Access Arrangement proposals to the Australian Energy Regulator (AER) for the upcoming regulatory control period (2013 to 2017). An integral step to developing annual capex and opex forecasts is the production of a set of reasonable assumptions with respect to the likely rate of annual material cost escalation.
SKM has been actively researching the increasing cost of capital infrastructure works for some time, particularly in the energy industry, and has developed a cost escalation modelling process which captures the likely impact of expected movements of specific input cost drivers on future networks infrastructure pricing, providing robust cost escalation rates.
The escalation factors presented in this report represent SKM’s calculated best estimate of likely cost escalation components to account for the predicted movement in underlying drivers affecting the cost of undertaking capex and opex work relative to Australian National CPI, being the base inflation factor used by the AER.
The escalation factors presented are specific to the operating environment faced by the VGDBs, and are based on the most up-to-date information available at the time of compilation.
3.1. SKM’s relevant experience
SKM has assisted many Australian energy networks businesses, both at the transmission and distribution level, in analysing the impact of movements in commodity prices and labour on the costs of network assets, as well as in providing independent validation of their capex and opex modelling processes.
A list of SKM’s recent experience has been included in Appendix B.
SINCLAIR KNIGHT MERZ HA01649 Vic gas escalation factors final report2.docx PAGE 8
Victorian Gas Distribution Network annual material cost escalators 2013-17
4. Methodology In recent decisions for electricity network service providers the AER has allowed the costs related to capex provisions to be escalated in real terms. Prior to these decisions CPI was generally used as a proxy to account for the escalation expected in relation to these network costs.
The methodologies accepted by the AER in these decisions sought to better characterise the likely escalation in price of equipment/project costs through combining independent forecast movements in the price of input components, with ‘weightings’ for the relative contribution of each of the components to final equipment/project costs. This in turn generates real cost forecasts for the regulatory control period under review.
In its Final Decision for the NSW Electricity Distribution Businesses the AER stated that:
“In light of these external factors, it was considered that cost escalation at CPI no longer reasonably reflected a realistic expectation of the movement in some of the equipment and labour costs faced by electricity network service providers (NSPs). It was also communicated by the AER at the time of allowing real cost escalations that the regime should symmetrically allow for real cost decreases. This was to allow end users to receive the benefit of real cost reductions as well as facing the cost of real increases.”3 SKM confirms that its methodology for modelling the forecast changes in the costs of materials used in VGDBs capex and opex forecasts is consistent with the approach accepted by the AER in its recent decisions.
This section of the report provides a step by step description of the methodology employed by SKM in modelling forward capex and opex materials cost escalation. In describing this methodology, it is also considered appropriate to provide an account of the history behind SKM’s Capex Cost Escalation Model.
3 AER 2009, NSW DNSP Final Decision P478. http://www.aer.gov.au/content/index.phtml/itemId/728076
SINCLAIR KNIGHT MERZ HA01649 Vic gas escalation factors final report2.docx PAGE 9
Victorian Gas Distribution Network annual material cost escalators 2013-17
4.1. The need for Materials Cost Escalation
SKM has believed for some time that movements in the CPI did not accurately reflect the relative movements in costs associated with energy network projects, and sought to establish an enhanced understanding of specific escalation rates that captured the movements in a network service providers’ costs for the various items of plant and equipment within a typical program of capex and opex works.
This view was echoed through The World Bank’s June 2008 report entitled; “Study of Equipment Prices in the Energy Sector” which stated that;
“In the past four years, global demand has led to substantial increases in equipment and material prices in the power sector. This is mainly due to significant increases in the escalation of raw material materials and labor associated with the manufacture and fabrication of equipment”
“From 2006 to 2008 alone, energy projects financed by the World Bank experienced 30%-50% increases above the original cost estimates, requiring additional financing, a reduction in scope of the project, or schedule delays.”
The opportunity to develop an enhanced understanding of the drivers of network asset costs originally presented itself to SKM during a 2006 multi-utility strategic procurement assignment. It was from this study that SKM was able to demonstrate that prices were increasing faster than CPI, and was able to develop and calibrate a model that described this escalation.
As part of the strategic procurement study a number of network asset equipment manufacturers and/or suppliers were surveyed to provide a greater understanding of the cost drivers underlying equipment pricing.
SKM also drew on information within studies undertaken on contract cost information for a number of turnkey and contracted construction projects (including plant equipment, materials, construction, testing, and commissioning). SKM’s knowledge base of network management operational and asset procurement experience was also drawn upon during this establishment of cost drivers.
The results of SKM’s research indicated that there are a number of common factors driving the rapid rises in networks’ capital infrastructure costs.
SINCLAIR KNIGHT MERZ HA01649 Vic gas escalation factors final report2.docx PAGE 10

Victorian Gas Distribution Network annual material cost escalators 2013-17
The primary factors (in no particular order) influencing cost movements are considered to be changes in the market pricing position for:
Metals such as copper, aluminium, and steel;
Oil;
Plastics, primarily High Density Polyethylene (HDPE);
Construction costs;
Foreign exchange rates (particularly the US$ /AUD relationship); and
Wages.
Having identified these Key Cost Drivers, SKM examined each of the main items of plant equipment and materials within its database, in order to establish a suitable percentage contribution, or weighting, by which each of these underlying cost drivers were considered to influence the total price of each completed item.
In its determination and application of final cost driver weightings for these network assets, SKM drew on a wide range of information such as its knowledge of commercial rise and fall clauses contained within confidential network procurement contracts sighted by SKM during market price surveys, information passed on during its interviews with equipment suppliers and manufacturers; as well as industry knowledge held within its large internal pool of professional estimators, procurement specialists, financiers, economists, engineers and operational personnel.
With appropriate weightings developed and assigned to each component, the Key Cost Drivers thus provided a means by which changes in the forecast price of each underlying cost driver might be foreseen to affect the overall cost of the network asset itself.
While there are benefits in maintaining consistency, particularly with past precedents, SKM has incorporated improvements to its modelling method when there was a clear need, particularly in response to regulatory precedents and as improved cost information becomes available.
SINCLAIR KNIGHT MERZ HA01649 Vic gas escalation factors final report2.docx PAGE 11

Victorian Gas Distribution Network annual material cost escalators 2013-17
5. Updating Movements in Key Cost Drivers In order to remain current, forecast positions of the key cost drivers within the SKM model are updated for each assignment, to ensure the most practical recent/current date information is used as the basis of each assignment requiring the model’s application.
The following sections present a discussion of the methods by which the forecast movements of each cost driver are updated.
5.1. CPI
SKM have chosen to adopt the method of forecasting CPI used by the AER in recent electricity network decisions. This method adopts the following process:
Plot two years of forecasts from the most recent RBA Monetary Policy Statement—(the November 2011 Monetary Policy Statement, with forecasts out to Dec 2013); and
Thereafter plot CPI as the RBA inflation target’s midpoint of 2.5%.
The CPI figures used during SKM modeling are presented in Table 4.
Table 4 Forecast CPI figures
Calendar Year 2011 2012 2013 2014 2015 2016 2017
CPI Forecast 3.3% 3.3% 2.7% 2.5% 2.5% 2.5% 2.5% In seeking to understand the overall reasonableness of such a CPI forecast, SKM established that since first targeting its current range of 2-3% in 1993, the RBA has historically achieved an actual average Calendar Year CPI of 2.7%4, and over the most recent five years the actual CPI achieved during this targeting regime has resulted in an average Calendar Year CPI of 3%, both of which are higher than the expected midpoint of the target range of 2.5%. This “above the midpoint of the RBA’s targeting range” historic CPI result is illustrated through Figure 1 below.
4 ABS 6401.0 Consumer Price Index, Australia TABLES 3 and 4. CPI: Groups, Weighted Average of Eight Capital Cities.
SINCLAIR KNIGHT MERZ HA01649 Vic gas escalation factors final report2.docx PAGE 12

Victorian Gas Distribution Network annual material cost escalators 2013-17
Figure 1 RBA historic CPI targeting results
2.5%
2.7%
3.0%
0%
1%
2%
3%
4%
5%
6%
1994 1995 1996 1997 1998 1999 2000 2001 2002 2003 2004 2005 2006 2007 2008 2009 2010
Actual CPI Midpoint of RBA Target Average since targeting began Average achieved over last 5 years
SKM therefore considers that this methodology of including both the midpoint of the RBA target range, and short term forecasts provides a conservative estimate of the likely position of this network cost pressure that can reasonably be expected to materialise over the upcoming access arrangement period.
5.2. The US$ to AUD Exchange rate
The SKM Cost Escalations modelling process uses average monthly US$ / AUD$ exchange rates, to restate US$ based market prices of commodities, namely Copper, Aluminium, Steel and Oil, into their comparable Australian Dollar pricing movements. This is undertaken in order to account for any potential movements of base currency commodity market price movements through a strengthening or weakening of the Australian Dollar.
The most recent approach adopted by the AER for the AUD / US$ exchange rate was to use futures market prices as a predictor of future exchange rates. While SKM notes that futures markets are not always the most reliable predictor of actual prices, it has adopted this approach in this report.
SKM has adopted the USD/AUD exchange rate based on futures used by the AER in the November 2011 Aurora Energy draft decision (converted to calendar years), and then extrapolated to the long term average USD/AUD exchange rate over a 5 year time horizon. This can be seen in Table 5.
Table 5 Forecast AUD to US$ exchange rates
Calendar Year 2011 2012 2013 2014 2015 2016 2017
SKM forecast 1.03 1.00 0.96 0.93 0.90 0.86 0.75
SINCLAIR KNIGHT MERZ HA01649 Vic gas escalation factors final report2.docx PAGE 13

Victorian Gas Distribution Network annual material cost escalators 2013-17
5.3. Construction Costs
Construction costs are included in the model as a key driver underlying network project costs, in order to account for increases in both the labour and materials elements of the civil works or “supporting infrastructure” components of gas network capex projects. This would typically comprise individually identifiable pieces of civil works, such as pipe laying.
SKM’s initial modelling of network capex costs sought to account for the industry understanding that construction costs were escalating far in excess of CPI. The Australian Construction Industry Forum (ACIF)5 is the peak consultative organisation of the building and construction sectors in Australia. The ACIF has established the Construction Forecasting Council (CFC)6 through which it provides a tool kit of analysis and information.
In commenting on activity in construction related to the gas industry, the Construction Forecasting Council (CFC) notes that for this sector,
“Electricity and pipeline construction activity reached a very high $12 billion in 2008/09 and 2009/10, due to the start of several new projects, including many wind farms. Electricity and pipeline construction is forecast to ease back over the short term as future climate change policy direction needs to be made clearer in this sector. Electricity and pipeline construction is forecast to remain stable at a high level over the medium term”7.
This outlook is likely to sustain the market demand for related construction materials, and thus the resultant market prices. As there is now further clarity in climate change policy additional work is now expected, with a move towards gas as a fuel due to its lower greenhouse intensity.
Figure 2 illustrates the CFC’s outlook for electricity and pipeline construction demand out to 2017-18. This illustrates how Victoria is expected to experience a comparatively larger forward program of construction in this sector, particularly from 2012 when it is virtually on par with the largest state capital programs.
5 http://www.acif.com.au/ 6 http://www.cfc.acif.com.au/cfcinfo.asp 7 http://www.cfc.acif.com.au/summary.asp
SINCLAIR KNIGHT MERZ HA01649 Vic gas escalation factors final report2.docx PAGE 14

Victorian Gas Distribution Network annual material cost escalators 2013-17
Figure 2 CFC Electricity and pipeline construction outlook8
The CFC also provides a forecast of related construction costs going forward, through which annual growth rates in the cost of construction are able to be developed. These figures are provided through KPMG Econtech forecasts.
As the CFC considers electricity and pipeline construction to fall within the sector it presents entitled as “Engineering”, SKM has adopted these movements presented as Australian National “Engineering” construction cost forecasts as the likely movements in the Construction cost component of relevance to VGDBs within cost escalation modelling.
Table 6 provides the relevant excerpt of the CFC engineering construction price index, based on the most recent data available at 6/12/2011.
Table 6 CFC Forecast of Engineering construction costs (nominal)
CFC forecast title 2010-11
2011-12
2012-13
2013-14
2014-15
2015-16
2016-17
2017-18
Long-term - Engineering - Price Index (seasonally adjusted% change) Nominal 4.2% 1.8% 2.1% 1.0% 1.9% 2.3% 2.8% 3.3%Long-term - Engineering - Price Index (seasonally adjusted% change) Real (SKM calculation) 0.6% ‐0.2% ‐1.2% ‐1.5% ‐0.6% ‐0.2% ‐0.3% 0.8%
8 http://www.cfc.acif.com.au/forecast_results.asp Downloaded 6/12/2010
SINCLAIR KNIGHT MERZ HA01649 Vic gas escalation factors final report2.docx PAGE 15
Victorian Gas Distribution Network annual material cost escalators 2013-17
5.4. Commodity Prices
This section of the report presents the methodology employed by SKM in updating the commodity price inputs to its cost escalation model.
Commodity prices have been known to be volatile in recent times as they are influenced by several economic factors, such as overall levels of demand and supply as well as hedging and investment activity, each of which was effected by the Global Financial Crisis (GFC). Even outside of the period now known as the GFC, prices over a lengthy forward period such as the five year regulatory cycle can be difficult to pin down. It is therefore imperative to model these aspects of cost escalation using recent and credible data.
In seeking to develop appropriate cost escalation rates, that affectively characterize the underlying infrastructure asset cost pressures faced by network service providers within Australia, the SKM modelling methodology incorporates the use of commodity futures contract prices into cost escalation rate computations.
5.4.1. Commodities and the use of Futures contract pricing
The inclusion of Forward contracts pricing, as a means to predict likely market pricing positions of the various commodities going forward, is generally considered suitable, as these contracts represent the firm position of market participants who have actively placed money behind their predictions.
Although it may be argued that professional economists are putting valuable reputations on the line when providing their own market predictions, the AER has decided it considers forward contract markets are considered to provide greater and more immediate financial risk than the various economic forecasts that do not involve any direct financial risk to the forecasters.
SKM has thus adopted available futures prices into its forecast method, except where expressly noted. This is discussed in further detail in section 5.4.3.
5.4.2. Credible views of a range of Professional forecasters
It was established that the price of Oil futures contracts were available that covered the majority of the revenue control period under investigation. However in the case of other inputs such as copper and aluminium, London Metals Exchange (LME) futures contracts only go out as far as 27 months.
In order to estimate prices beyond this corresponding 27 month date, it is necessary to revert to economic forecasts as the most robust source of future price expectations. SKM considers this to be superior to “trend” based analysis approaches.
SINCLAIR KNIGHT MERZ HA01649 Vic gas escalation factors final report2.docx PAGE 16

Victorian Gas Distribution Network annual material cost escalators 2013-17
SKM’s methodology conforms to the approach accepted by the AER in the most recent Aurora Draft Decision in utilising Consensus Economics’ quarterly publication “Energy and Metals Consensus Forecasts” as its source from which the long-term position of the Copper and Aluminium market prices are sourced.
Consensus Economics Inc.9 is a leading international economic survey organization based in the United Kingdom. Its publication “Energy & Metals Consensus Forecasts” is a subscription based comprehensive quarterly survey of over 30 of the world’s most prominent commodity forecasters.
These quarterly reports provide details of the price forecasts, of each professional analyst surveyed, for the next 10 quarters. “Energy & Metals Consensus Forecasts” also provides the “mean” or “consensus” of these various individual market predictions. In doing so, the publication allows the user to gather an overall market perception, without the need to apply a weighting to individual predictions in terms of gauging the organisation’s perceived strength in forecasting, historical accuracy or such.
In developing Calendar Year price movements for Copper and Aluminium, SKM uses a method of linear interpolation, between the relevant 27 month LME contract prices and the Consensus Economics long term predictions of price movements, as described in section 5.4.3.
9 http://www.consensuseconomics.com/index.htm
SINCLAIR KNIGHT MERZ HA01649 Vic gas escalation factors final report2.docx PAGE 17

Victorian Gas Distribution Network annual material cost escalators 2013-17
5.4.3. SKM’s Application of Futures Contracts and Long-term Forecasts
When updating the position of the Key Cost drivers, SKM employs various combinations of futures contract prices and a range of views from credible forecasting professionals to develop likely Year to December price positions of specific key cost components.
5.4.3.1. Aluminium and Copper
When updating the position of the Key Cost drivers of Aluminium and Copper within its model, SKM undertakes a seven step approach to produce specific data points between which linear interpolation is applied in order to arrive at the implied Calendar Year future pricing positions.
Because of the volatility in daily spot and futures market prices, SKM uses monthly averages of prices within its modelling process. The steps involved are:
1. Plot the average of the last 30 days of LME Spot prices
2. Plot the average 3 month LME contract price
3. Plot the average 15 month LME contract price
4. Plot the average 27 month LME contract price
5. Plot the Consensus Long-Term Forecasts position (taken as 7.5 years from survey date10)
6. Apply linear interpolation between plot points.
7. Identify the Corresponding June points in the interpolated results, and feed these prices into the model.
This methodology is illustrated in Figure 3 (Note that all figures are illustrative only and do not refer to the actual position/price of any particular commodity).
Figure 3 Diagram of methodology - Steps 1-5 (left) and Steps 6-7 (right)
$500
$700
$900
$1,100
$1,300
$1,500
$1,700
$1,900
$2,100
0 3 6 9 12 15 18 21 24 27 30 33 36 39 42 45 48 51 54 57 60 63 66 69 72 75 78 81 84 87 90
Mark
e
t
Pri
c
e
Months
Avg LME Spot Avg LME 3 Month
Avg LME 15 Month Avg LME 27 Month
Consensus LongTerm Forecast (Taken as 7.5 years)
$500
$700
$900
$1,100
$1,300
$1,500
$1,700
$1,900
$2,100
0 3 6 9 12 15 18 21 24 27 30 33 36 39 42 45 48 51 54 57 60 63 66 69 72 75 78 81 84 87 90
Mark
e
t
Pri
c
e
Months
Avg LME Spot Avg LME 3 Month
Avg LME 15 Month Avg LME 27 Month
Consensus LongTerm Forecast (Taken as 7.5 years) SKM Interpolation
JUNEJUNE
JUNE
JUNEJUNE
JUNEJUNE
JUNE
10 The Consensus Long-term forecast is listed in the publication as a 5 – 10 year position. In an attempt to apply this in a reasonable manner, SKM consider the position to refer to the mid-point of this range, being 7.5 years, or 90 months hence.
SINCLAIR KNIGHT MERZ HA01649 Vic gas escalation factors final report2.docx PAGE 18

Victorian Gas Distribution Network annual material cost escalators 2013-17
The average year to December input numbers used during SKM’s modelling of the Copper and Aluminium market prices are presented in Table 7 and Table 8.
Table 7 Real AUD based price of Copper
AUD (2011) 2011 2012 2013 2014 2015 2016 2017
Copper 8561 7850 7935 7904 7684 7436 8011Annual Change 1.3% ‐8.3% 1.1% ‐0.4% ‐2.8% ‐3.2% 7.7%
Table 8 Real AUD based price of Aluminium
AUD (2011) 2011 2012 2013 2014 2015 2016 2017
Aluminium 2326 2326 2326 2326 2326 2326 2326Annual Change ‐4.8% ‐8.0% 6.3% 8.4% 4.6% 2.0% 12.3%
5.4.4. Oil
World Oil markets provide future contracts with settlement dates sufficiently far forward to cover the duration of the upcoming access arrangement period, and this has been adopted by the AER as its preferred approach to forecasting future oil prices.
SKM has researched the reliability of oil futures as a predictor of actual oil prices, and has formed the view that futures markets are not a reliable predictor or robust foundation for future price forecasts. There is a body of literature devoted to analysing this issue11 and the conclusion that futures do not accurately predict prices, and that other methods are more reliable, is well established.
For example, the US Federal Reserve12 concluded that:
More commonly used methods of forecasting the nominal price of oil based on the price of oil futures or the spread of the oil futures price relative to the spot price cannot be recommended. There is no reliable evidence that oil futures prices significantly lower the MSPE relative to the no-change forecast at short horizons, and long-term futures prices often cited by policymakers are distinctly less accurate than the no-change forecast.
11 Including What do we learn from the price of crude oil futures?, Alquist & Kilian, JOURNAL OF APPLIED ECONOMETRICS, February 2010.
12 Forecasting the Price of Oil, Board of Governors of the Federal Reserve System, International Finance Discussion Papers, July 2011
SINCLAIR KNIGHT MERZ HA01649 Vic gas escalation factors final report2.docx PAGE 19

Victorian Gas Distribution Network annual material cost escalators 2013-17
Discussions SKM had for this project with oil traders have provided further insights into the oil futures market, and that beyond 6-12 months the use of oil futures is principally not to hedge future oil prices, but rather to hedge other risks at a known price (regardless of whether it is likely to be the actual price on the settlement date). Futures contracts tend to follow the current spot price up and down, with a curve upwards or downwards reflecting current (short term) market sentiment.
This is illustrated in Figure 4 below, with the blue line showing the spot price, with 4 years of futures prices shown at annual intervals. The “flat” nature of the futures price curve is clearly seen, with only a small upward or downward trend in the early period, and with the current spot price clearly shown to be the primary determinant of futures prices as far as 4 years ahead.
Figure 4 Oil (Brent13) futures compared to spot (blue) 2005 - 2012
0
20
40
60
80
100
120
140
160
2005 2006 2007 2008 2009 2010 2011 2012 2013 2014 2015
Source Morgan Stanley Commodities
Forward contract volumes beyond 1 year are low and the market is relatively illiquid, further highlighting the unsuitability of using futures prices as the basis of long term price expectations. As the chart below illustrates, beyond 3-6 months volumes and liquidity are very low:
13 While the chart refers to Brent futures, arbitrage opportunities ensure price disparities between WTI, Brent and other indices are low or with short term deviations related to specific supply constraints.
SINCLAIR KNIGHT MERZ HA01649 Vic gas escalation factors final report2.docx PAGE 20

Victorian Gas Distribution Network annual material cost escalators 2013-17
Figure 5 Forward market volumes showing open contracts and traded volumes
In order to find a more reliable and robust source of future oil prices, SKM has compared actual prices against historical predictions of WTI price using three sources:
NYMEX futures contracts
The US Energy Information Administration (EIA) Annual Energy Outlook
Consensus economics “Energy and Metals Consensus Forecasts”
The results are shown in Figure 6 below:
SINCLAIR KNIGHT MERZ HA01649 Vic gas escalation factors final report2.docx PAGE 21

Victorian Gas Distribution Network annual material cost escalators 2013-17
Figure 6 Oil (Nymex) spot (red) compared to futures prices, EIA and Consensus Economics forecasts 2008 - 2011
40
50
60
70
80
90
100
110
Dec
‐08
Jan‐09
Feb‐09
Mar‐09
Apr‐09
May‐09
Jun‐09
Jul‐0
9
Aug
‐09
Sep‐09
Oct‐09
Nov
‐09
Dec
‐09
Jan‐10
Feb‐10
Mar‐10
Apr‐10
May‐10
Jun‐10
Jul‐1
0
Aug
‐10
Sep‐10
Oct‐10
Nov
‐10
Dec
‐10
Jan‐11
Feb‐11
Mar‐11
Apr‐11
May‐11
Jun‐11
Jul‐1
1
Aug
‐11
Sep‐11
Oct‐11
Nov
‐11
Dec
‐11
NYMEX WTI Spot (actual)
Fut @ Dec 08
Fut @ Dec 09
Fut @ Dec 10
Fut @ Dec 11
EIA 2009
EIA 2010
EIA 2011
EIA 2012
CE @ Jan 09
CE @ Jan 10
CE @ Jan 11
CE @ Jan 12
While none of these sources can claim to be wholly reliable, SKM has found that beyond a 1 year time horizon, economic forecasts are more reliable than futures prices:
Table 9 Average error in predicting future spot price (2008 – 2010)
Time forward from base date Futures EIA CE
1 yr 10% 20% 12%
2 yr 16% 22% 16%
3yr 31% 24% 24%
Based on these results, SKM has used a revised method to predict oil prices, similar to that used for aluminium14 and copper. From the results above, SKM has used futures prices for the first year, an average of futures and consensus economics prices for the second year, and an average of EIA and consensus economics prices for the 3rd and subsequent years. The resultant forecast for oil prices used as the basis for calculating escalation is shown in Table 10 below.
14 SKM notes the AER has previously accepted that long term (90month) LME aluminium futures were not based on a future outlook for actual aluminium prices, and that this contract could be discarded and replaced with economic forecasts which are likely to be more reliable.
SINCLAIR KNIGHT MERZ HA01649 Vic gas escalation factors final report2.docx PAGE 22

Victorian Gas Distribution Network annual material cost escalators 2013-17
Table 10 Nominal USD oil prices to 2017
Jun-12 Jun-13 Jun-14 Jun-15 Jun-16 Jun-17 Futures 100 99 95 94 EIA 98 107 117 126 131 138 CE 98 103 103 106 107 106 SKM Weighted 100 101 110 116 119 122
SKM’s modelling has resulted in market prices and forecast escalation factors as presented below.
Table 11 Real AUD based price of Oil
AUD (2011) 2011 2012 2013 2014 2015 2016 2017
Oil 92 97 99 108 116 122 138annual change 3.0% 5.9% 1.8% 9.1% 6.9% 5.2% 13.5%
5.4.5. HDPE
SKM has sought to understand the drivers for HDPE prices, being a key material cost for gas networks as the primary distribution pipe material. HDPE is generally manufactured from ethane feedstock (and less commonly naptha derived from petrochemicals), with ethane prices strongly linked to other energy prices.
Australia manufactures approximately half its HDPE requirements locally, with the remainder imported, and is thus exposed to international prices. As part of policy analysis related to carbon pricing the Commonwealth government found that HDPE was an internationally trade exposed commodity, and thus while no local exchange pricing data is available in the public domain, SKM considers international pricing data provides an accurate indicator of Australian prices.
Up to April 2011 the London Metals Exchange traded PE, and hence robust pricing data is available for the period 2004 to 2011. These contracts were discontinued in 2011, leaving no transparent market price and futures prices, and no reliable economic forecasts of HDPE prices SKM was able to identify.
Hence there is a need to find a price driver for HDPE prices that can be used as the basis for predictions of future prices. Research and analysis by SKM has identified oil prices as the primary driver for HDPE prices, with strong correlation in price movements in oil. Ethane and HDPE,.
The Figure 7 below shows the clear linkage between oil, ethane and HDPE prices. SKM research has shown oil is the most actively traded and largest value commodity of these, and hence can be expected to be the primary driver of price of the other two.
SINCLAIR KNIGHT MERZ HA01649 Vic gas escalation factors final report2.docx PAGE 23

Victorian Gas Distribution Network annual material cost escalators 2013-17
Figure 7 LME HDPE, Ethylene (LHS) and Oil prices (RHS) 2003-2011
0
20
40
60
80
100
120
140
160
0
500
1000
1500
2000
2500Oct‐03
Aug‐04
Jun‐05
Apr‐06
Feb‐07
Dec‐07
Oct‐08
Aug‐09
Jun‐10
Apr‐11
Plastemart HDPE Pipe
Plastemart Ethylene
Nymex oil
Previous work undertaken by SKM MMA on gas prices in Australia has also revealed that ethane contracts in Australia are increasingly linked to world energy prices, with a move by suppliers to insert rise and fall clauses linked to oil and other indicators.
SKM has analysed historic oil and HDPE prices over the period 2004 to 2011, and found that oil price movements were a reliable predictor of HDPE price movements. Figure 8 below clearly demonstrates the correlation between movements in HDPE price and oil price.
Figure 8 Correlation between HDPE and Oil price movements 2004-2011 (SKM analysis)
‐60%
‐40%
‐20%
0%
20%
40%
60%
Jan‐04
Jul‐0
4
Jan‐05
Jul‐0
5
Jan‐06
Jul‐0
6
Jan‐07
Jul‐0
7
Jan‐08
Jul‐0
8
Jan‐09
Jul‐0
9
Jan‐10
Jul‐1
0
Jan‐11
HDPE %
Oil %
SINCLAIR KNIGHT MERZ HA01649 Vic gas escalation factors final report2.docx PAGE 24

Victorian Gas Distribution Network annual material cost escalators 2013-17
By comparing per cent price movements on a 6 month rolling average with the previous 6 months, SKM found that HDPE prices moved at 0.6 times USD oil prices, with an R2 value of 0.73 and 95% confidence interval of 0.08.
Based on this analysis, SKM considers oil prices to be a reliable predictor of future HDPE prices in Australia, using a 0.6 factor applied to the per cent change in oil price. Using this method SKM has determined the following outlook for HDPE prices as an input cost driver for HDPE pipes:
Table 12 Real AUD based price change of HDPE
AUD (2011) 2011 2012 2013 2014 2015 2016 2017 annual change 1.8% 3.5% 1.1% 5.5% 4.1% 3.1% 8.1%
5.4.6. Steel
Steel manufacturing is an energy intensive process of production, with energy representing approximately 20% of the final cost of production15. In addition, coal is used as an input to the steel making process.
An application of the methodology used for Oil, Copper and Aluminium was not possible due to the lack of a liquid Steel futures market. SKM note that the LME commenced trading in steel futures in February 2008, however, SKM considers the LME steel futures are still not yet sufficiently liquid to provide a robust price outlook.
SKM has selected the Consensus Economics forecast to be the best currently available outlook for steel prices. Consensus provides quarterly forecast prices in the short term, and a “long term” (5-10 year) price. Steel prices for all historical periods are taken from an average of the Bloomberg US and EU steel prices.
The most recent Consensus Survey available at the time of compiling this report was their January 2012 Survey. This publication provided quarterly forecast market prices for steel for 2012-13, as well as a Long-term forecast pricing position.
Consensus Economics provides two separate forecasts for Steel, both being for Hot Rolled Coil (HRC) variety, with the first being relative to the USA domestic market and the other the European domestic market.
The Consensus Economics US HRC price forecasts are presented US$ per Short Ton. As historical prices are all quoted in US$ per Metric Tonne, it is necessary to convert these prices into their
15 American Iron and Steel institute, “Saving one barrel of oil per ton” October 2005.
SINCLAIR KNIGHT MERZ HA01649 Vic gas escalation factors final report2.docx PAGE 25

Victorian Gas Distribution Network annual material cost escalators 2013-17
Metric Tonne equivalent. This is a simple operation with the US HRC prices multiplied by a factor of 1.1023, being the standard conversion rate for the number of short tons per Metric Tonne. Once converted to their Metric Tonne pricing position, SKM uses the average of these two forecasts (US HRC and EU HRC) as its Steel price inputs to the cost escalation modelling process.
The figures used as inputs to SKM’s modelling are presented in Table 13, and are consistent with the methodology accepted by the AER in recent electricity network decisions.
Table 13 Relative Real AUD Pricing position of average HRC steel prices
AUD (2011) 2011 2012 2013 2014 2015 2016 2017
Steel Avg 782 733 749 777 768 764 863 Annual Change 3.4% ‐6.2% 2.2% 3.7% ‐1.1% ‐0.5% 13.0%
SINCLAIR KNIGHT MERZ HA01649 Vic gas escalation factors final report2.docx PAGE 26

Victorian Gas Distribution Network annual material cost escalators 2013-17
6. Conclusion & recommendations The SKM cost escalation modelling methodology provides a rigorous and transparent process through which reasonable and appropriate cost escalation rates are able to be developed in relation to the prices of network plant and equipment.
The escalation factors established during this assignment were developed with specific consideration of the operating environment faced by the client, being VGDBs, and were based on the most up-to-date information available at the time of compilation.
These escalation rates therefore constitute SKM’s calculated opinion of appropriate materials cost escalation rates that can reasonably be expected to affect VGDBs over the Calendar Year periods 2011 to 2017 inclusive. The results of SKM’s modelling during this assignment are presented in Table 14 below.
Table 14 Average annual real change in underlying network materials cost drivers
Cost Driver Name Dec‐11 Dec‐12 Dec‐13 Dec‐14 Dec‐15 Dec‐16 Dec‐17
Without emissions trading Manufacturing costs (CPI) 0.00% 0.00% 0.00% 0.00% 0.00% 0.00% 0.00% Aluminium -4.80% -7.96% 6.30% 8.45% 4.65% 2.03% 12.28% Copper 1.30% -8.30% 1.08% -0.39% -2.79% -3.22% 7.72% Steel 3.40% -6.24% 2.21% 3.67% -1.11% -0.54% 12.98% Oil 3.03% 5.91% 1.85% 9.15% 6.89% 5.19% 13.51% HDPE 1.82% 3.54% 1.11% 5.49% 4.14% 3.11% 8.11% General Labour 0.65% 1.10% 1.15% 1.65% 1.60% 1.85% 2.50% Site Labour 0.80% 0.90% 1.30% 1.80% 2.05% 2.05% 2.20% Construction Costs -0.24% -1.30% -1.24% -1.08% -0.40% 0.08% 0.56% With emissions trading Manufacturing costs (CPI) 0.00% 0.00% 0.00% 0.00% 0.00% 0.00% 0.00% Aluminium -4.80% -7.96% 7.26% 8.59% 4.81% 2.33% 12.37% Copper 1.30% -8.30% 1.11% -0.39% -2.78% -3.21% 7.73% Steel 3.40% -6.24% 2.60% 3.75% -1.01% -0.38% 13.02% Oil 3.03% 5.91% 1.85% 9.15% 6.89% 5.19% 13.51% HDPE 1.82% 3.54% 1.51% 5.49% 4.14% 3.15% 8.10% General Labour 0.65% 1.10% 1.15% 1.65% 1.60% 1.85% 2.50% Site Labour 0.80% 0.90% 1.30% 1.80% 2.05% 2.05% 2.20% Construction Costs -0.24% -1.30% -1.24% -1.08% -0.40% 0.08% 0.56% Underlying CPI CPI 3.3% 3.3% 2.7% 2.5% 2.5% 2.5% 2.5% Marginal impact of emissions trading Aluminium 0.95% 0.15% 0.17% 0.31% 0.08% Copper 0.03% 0.01% 0.01% 0.01% 0.01% Steel 0.39% 0.08% 0.10% 0.16% 0.03% HDPE 0.40% 0.00% 0.00% 0.04% 0.00%
SINCLAIR KNIGHT MERZ HA01649 Vic gas escalation factors final report2.docx PAGE 27

Victorian Gas Distribution Network annual material cost escalators 2013-17
In exerting expected cost pressures on VGDBs, SKM concluded that these escalation rates form a component of efficient prices for a Victorian gas distribution business. SKM therefore recommends that VGDBs take account of these materials cost escalation rates within their forward capex and opex forecasts. The modelled impact on materials and projects are presented in the tables below, showing both annual change, and cumulative real escalation factors from a July 2011 base date.
Table 15 Average annual real change in cost of materials and projects
Cost Driver Name Dec‐11 Dec‐12 Dec‐13 Dec‐14 Dec‐15 Dec‐16 Dec‐17
Without emissions trading Materials and labour HDPE Pipe 1.36% 2.66% 0.83% 4.12% 3.10% 2.33% 6.08% Steel Pipe (protected) 1.74% -3.05% 1.13% 1.95% -0.47% -0.21% 6.65% Copper fittings and products 0.78% -4.98% 0.65% -0.24% -1.67% -1.93% 4.63% Plastic fittings and products 0.91% 1.77% 0.55% 2.74% 2.07% 1.56% 4.05% Meters 0.75% -1.66% 0.50% 0.71% -0.36% -0.27% 2.98% Regulators 0.75% -1.66% 0.50% 0.71% -0.36% -0.27% 2.98% Meter upstands 1.70% -3.12% 1.11% 1.84% -0.56% -0.27% 6.49% Pipe laying 0.28% -0.45% 0.07% 0.32% 0.48% 0.80% 1.89% Meter installation 0.80% 0.90% 1.30% 1.80% 2.05% 2.05% 2.20% Regulator installation 0.80% 0.90% 1.30% 1.80% 2.05% 2.05% 2.20% Installed project costs HDPE Distribution Pipe installed 0.48% 0.13% 0.21% 1.01% 0.95% 1.07% 2.63% Steel distribution main installed 0.57% -0.97% 0.28% 0.65% 0.29% 0.60% 2.84% PE Service installed (excl meter) 0.92% 0.63% 1.22% 1.97% 1.84% 1.81% 2.92% Meter installed 0.81% 0.48% 0.91% 1.77% 1.45% 1.35% 2.86% Regulator installed 0.79% -0.63% 0.84% 1.26% 0.71% 0.67% 2.94% With emissions trading Materials and labour HDPE Pipe 1.36% 2.66% 1.13% 4.12% 3.11% 2.36% 6.07% Steel Pipe (protected) 1.74% -3.05% 1.33% 1.99% -0.42% -0.13% 6.67% Copper fittings and products 0.78% -4.98% 0.67% -0.23% -1.67% -1.92% 4.64% Plastic fittings and products 0.91% 1.77% 0.75% 2.74% 2.07% 1.58% 4.05% Meters 0.75% -1.66% 0.58% 0.73% -0.34% -0.24% 2.99% Regulators 0.75% -1.66% 0.58% 0.73% -0.34% -0.24% 2.99% Meter upstands 1.70% -3.12% 1.30% 1.88% -0.51% -0.19% 6.51% Pipe laying 0.28% -0.45% 0.07% 0.32% 0.48% 0.80% 1.89% Meter installation 0.80% 0.90% 1.30% 1.80% 2.05% 2.05% 2.20% Regulator installation 0.80% 0.90% 1.30% 1.80% 2.05% 2.05% 2.20% Installed project costs HDPE Distribution Pipe installed 0.48% 0.13% 0.27% 1.01% 0.95% 1.08% 2.63% Steel distribution main installed 0.57% -0.97% 0.33% 0.65% 0.30% 0.62% 2.85% PE Service installed (excl meter) 0.92% 0.63% 1.27% 1.97% 1.85% 1.82% 2.92% Meter installed 0.81% 0.48% 0.98% 1.77% 1.46% 1.36% 2.86% Regulator installed 0.79% -0.63% 0.89% 1.26% 0.72% 0.69% 2.95%
SINCLAIR KNIGHT MERZ HA01649 Vic gas escalation factors final report2.docx PAGE 28

Victorian Gas Distribution Network annual material cost escalators 2013-17
Table 16 Cumulative real increase in cost of materials and projects (Jul-11 = 1.0) (average increase over the year to December)
Cost Driver Name Dec‐11 Dec‐12 Dec‐13 Dec‐14 Dec‐15 Dec‐16 Dec‐17
Without emissions trading Materials and labour HDPE Pipe 1.007 1.034 1.042 1.085 1.119 1.145 1.214 Steel Pipe (protected) 1.009 0.978 0.989 1.008 1.003 1.001 1.068 Copper fittings and products 1.004 0.954 0.960 0.958 0.942 0.924 0.966 Plastic fittings and products 1.005 1.022 1.028 1.056 1.078 1.095 1.139 Meters 1.004 0.987 0.992 0.999 0.995 0.993 1.022 Regulators 1.004 0.987 0.992 0.999 0.995 0.993 1.022 Meter upstands 1.009 0.977 0.988 1.006 1.000 0.998 1.062 Pipe laying 1.001 0.997 0.998 1.001 1.006 1.014 1.033 Meter installation 1.004 1.013 1.026 1.045 1.066 1.088 1.112 Regulator installation 1.004 1.013 1.026 1.045 1.066 1.088 1.112 Installed project costs HDPE Distribution Pipe installed 1.002 1.004 1.006 1.016 1.026 1.037 1.064 Steel distribution main installed 1.003 0.993 0.996 1.002 1.005 1.011 1.040 PE Service installed (excl meter) 1.005 1.011 1.023 1.043 1.063 1.082 1.113 Meter installed 1.004 1.009 1.018 1.036 1.051 1.065 1.096 Regulator installed 1.004 0.998 1.006 1.019 1.026 1.033 1.063 With emissions trading Materials and labour HDPE Pipe 1.007 1.034 1.045 1.088 1.122 1.149 1.218 Steel Pipe (protected) 1.009 0.978 0.991 1.011 1.006 1.005 1.072 Copper fittings and products 1.004 0.954 0.960 0.958 0.942 0.924 0.967 Plastic fittings and products 1.005 1.022 1.030 1.058 1.080 1.097 1.142 Meters 1.004 0.987 0.993 1.000 0.997 0.994 1.024 Regulators 1.004 0.987 0.993 1.000 0.997 0.994 1.024 Meter upstands 1.009 0.977 0.990 1.008 1.003 1.001 1.066 Pipe laying 1.001 0.997 0.998 1.001 1.006 1.014 1.033 Meter installation 1.004 1.013 1.026 1.045 1.066 1.088 1.112 Regulator installation 1.004 1.013 1.026 1.045 1.066 1.088 1.112 Installed project costs HDPE Distribution Pipe installed 1.002 1.004 1.006 1.017 1.026 1.037 1.064 Steel distribution main installed 1.003 0.993 0.996 1.003 1.006 1.012 1.041 PE Service installed (excl meter) 1.005 1.011 1.024 1.044 1.063 1.083 1.114 Meter installed 1.004 1.009 1.019 1.037 1.052 1.066 1.097 Regulator installed 1.004 0.998 1.007 1.019 1.027 1.034 1.064
SINCLAIR KNIGHT MERZ HA01649 Vic gas escalation factors final report2.docx PAGE 29

Victorian Gas Distribution Network annual material cost escalators 2013-17
Appendix A Likely Effects of Carbon Pricing Legislation passed in 2011 by Australian Parliament will introduce a Clean Energy Future scheme (emissions trading scheme) that would impose costs on emitters of greenhouse gases from July 2012.
Transitional assistance for “trade exposed emissions intensive” industries will reduce the CEF impact on some emissions intensive industries such as aluminium for the first 5 years of operation of the scheme.
The effect of CEF on cost drivers is modelled through the assignment of a greenhouse intensity to each of the cost drivers. These factors are multiplied by projected emissions permit prices to derive an additional “carbon price” effect for each of the individual input drivers. The model allows for different treatment of Emissions Intensive Trade Exposed (EITE) commodities (e.g. Aluminium); in line with proposed compensation measures included in the December 2008 CEF White Paper and subsequent policy announcements.
The elements of carbon pricing that were included in this modelling are:
Projected Australian permit prices (based on Treasury modelling)
Emissions coefficients (actual emissions, or embodied emissions)16
Current prices (to normalise additional carbon costs in per unit terms)
Percentage of costs passed through (to take account of Emissions Intensive Trade Exposed (EITE) transitional assistance).
The calculations are summarised in the table and chart below. As the base price inputs to the escalation model are nominal, SKM has used nominal permit prices as the primary CEF input to the cost escalation model.
16 SKM has based its assessment of emissions intensity on the Commonwealth Government’s assessment of emissions intensity of EITE industries, using actual Australian manufacturing data.
SINCLAIR KNIGHT MERZ HA01649 Vic gas escalation factors final report2.docx PAGE 30
Victorian Gas Distribution Network annual material cost escalators 2013-17
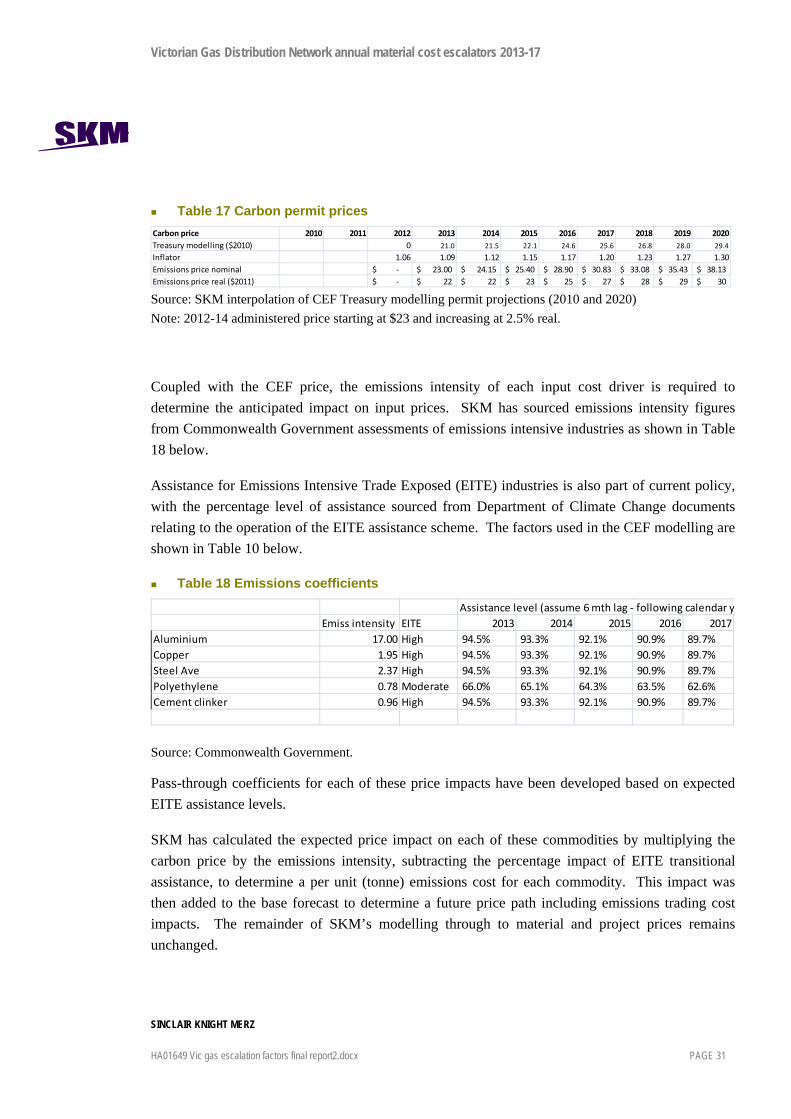
Table 17 Carbon permit prices Carbon price 2010 2011 2012 2013 2014 2015 2016 2017 2018 2019 2020Treasury modelling ($2010) 0 21.0 21.5 22.1 24.6 25.6 26.8 28.0 29.4
Inflator 1.06 1.09 1.12 1.15 1.17 1.20 1.23 1.27 1.30Emissions price nominal ‐$ 23.00$ 24.15$ 25.40$ 28.90$ 30.83$ 33.08$ 35.43$ 38.13$ Emissions price real ($2011) ‐$ 22$ 22$ 23$ 25$ 27$ 28$ 29$ 30$ Source: SKM interpolation of CEF Treasury modelling permit projections (2010 and 2020) Note: 2012-14 administered price starting at $23 and increasing at 2.5% real.
Coupled with the CEF price, the emissions intensity of each input cost driver is required to determine the anticipated impact on input prices. SKM has sourced emissions intensity figures from Commonwealth Government assessments of emissions intensive industries as shown in Table 18 below.
Assistance for Emissions Intensive Trade Exposed (EITE) industries is also part of current policy, with the percentage level of assistance sourced from Department of Climate Change documents relating to the operation of the EITE assistance scheme. The factors used in the CEF modelling are shown in Table 10 below.
Table 18 Emissions coefficients
Assistance level (assume 6 mth lag ‐ following calendar yEmiss intensity EITE 2013 2014 2015 2016 2017
Aluminium 17.00 High 94.5% 93.3% 92.1% 90.9% 89.7% Copper 1.95 High 94.5% 93.3% 92.1% 90.9% 89.7% Steel Ave 2.37 High 94.5% 93.3% 92.1% 90.9% 89.7% Polyethylene 0.78 Moderate 66.0% 65.1% 64.3% 63.5% 62.6% Cement clinker 0.96 High 94.5% 93.3% 92.1% 90.9% 89.7%
Source: Commonwealth Government.
Pass-through coefficients for each of these price impacts have been developed based on expected EITE assistance levels.
SKM has calculated the expected price impact on each of these commodities by multiplying the carbon price by the emissions intensity, subtracting the percentage impact of EITE transitional assistance, to determine a per unit (tonne) emissions cost for each commodity. This impact was then added to the base forecast to determine a future price path including emissions trading cost impacts. The remainder of SKM’s modelling through to material and project prices remains unchanged.
SINCLAIR KNIGHT MERZ HA01649 Vic gas escalation factors final report2.docx PAGE 31
Victorian Gas Distribution Network annual material cost escalators 2013-17
Appendix B SKM recent experience SKM has assisted several electricity utilities, both at the transmission and distribution level, in analysing the impact of movements in commodity prices and labour on the costs of network assets, as well as in providing independent validation of their capex and opex modelling processes.
These projects have included:
Joint VIC DNSPs (JEN, UED, SP AusNet, CP & PC) - 2010 SKM provided updates of cost escalation rates modelled for the Victorian Distribution companies. These updated rates were included in revised submissions to the AER.
Country Energy Gas Networks – 2010 SKM was engaged to provide a Due Diligence of the Country Energy regional Gas network in Wagga Wagga (NSW). A section of this study involved reviewing the modelling undertaken to develop cost escalation rates for plant and equipment within the Gas industry.
Ergon Energy – 2010 SKM was engaged to provide an update of cost escalation rates developed the previous year. The effect of rapid movements in a number of underlying cost drivers was required to be modelled in order to provide a more recent set of outputs.
ENERGEX – 2010 SKM was engaged to provide a set of suitable cost escalation rates for ENERGEX’s capex and opex programs of work. ENERGEX had received an unsatisfactory response from the AER in relation to the cost escalation rate modelling proposed by its consultants during its initial regulatory submission, and engaged SKM to provide modelling for its revised submission. The SKM rates were received favourably by the AER.
CitiPower / PowerCor - 2009 In a separate engagement, SKM developed materials cost escalation rates for the CP / PAL opex programs.
Joint VIC DNSPs (JEN, UED, SP AusNet, CP & PC) - 2009 SKM was engaged by the Joint Victorian Distribution Network Service Providers to provide capex escalation rates for their regulatory submissions. The outputs were tailored to individual asset categories nominated by each of the participants.
SINCLAIR KNIGHT MERZ HA01649 Vic gas escalation factors final report2.docx PAGE 32

Victorian Gas Distribution Network annual material cost escalators 2013-17
ETSA Utilities – 2009(a) SKM was engaged to provide an independent review of the cost escalation rates within the South Australian DNSP’s Opex models. This project has been initiated as part of ETSA Utilities’ preparation for the submission of its revenue proposal to the AER.
TRANSCO (Philippines) – 2009 SKM was engaged to apply its cost escalation modelling experience to escalate TransCo’s internal asset unit rates to current pricing levels
ETSA Utilities – 2009(b) In a separate assignment, SKM was engaged to provide inputs to the development of materials cost escalation rates within the South Australian DNSP’s capex model, as part of ETSA Utilities’ preparation for the submission of its revenue proposal to the AER.
Transend Networks – 2009 SKM was engaged to investigate the long-term average transmission network materials and labour cost escalation rates in Tasmania.
ElectraNet – 2009 SKM was engaged to apply its cost escalation modelling experience to escalate ElectraNet’s internal opex model unit rates to current pricing levels.
Ergon Energy – 2009 SKM was engaged to provide an update of cost escalation rates developed the previous year. The effect of rapid movements in a number of underlying cost drivers was required to be modelled in order to provide a more recent set of outputs. The resulting cost escalation rates are to be included as part of Ergon Energy’s official revenue proposal to the AER.
Ergon Energy – 2008 SKM was engaged to map key cost drivers within its model, to internal opex cost estimation unit rates within Ergon Energy models.
Ergon Energy – 2008 SKM undertook Stage 2 of the Ergon assignment relating to Electricity Industry Labour, Commodity and Asset Price & Cost Indices. During this period the SKM cost escalation model underwent extensive enhancements.
SINCLAIR KNIGHT MERZ HA01649 Vic gas escalation factors final report2.docx PAGE 33

Victorian Gas Distribution Network annual material cost escalators 2013-17
SINCLAIR KNIGHT MERZ HA01649 Vic gas escalation factors final report2.docx PAGE 34
Transend – 2008 SKM were engaged to provide cost escalators factors in order to promote Transend’s most recent asset valuation , having been based in June 2006 AUD$ terms, to June 2008 amounts as part of the TNSP’s regulatory proposal.
TransGrid – 2008 During this assignment, SKM reviewed TransGrid’s Capex model, corrected errors in their methodology, and provided an independent validation for use during TransGrid’s revenue proposal to the AER.
ActewAGL - 2008 SKM to provided an independent assessment of the escalation factors that apply to ActewAGL’s capital works programmes and projects going forward over the period 2007/8 to 2013/14. This was included in ActewAGL’s submission to the AER.
Ergon – 2008 SKM undertook Stage 1 of the Ergon assignment relating to Electricity Industry Labour, Commodity and Asset Price & Cost Indices.
AER – 2007/2008 In July 2007, SKM was engaged by the Australian Energy Regulator (AER) to review the regulatory revenue proposal submitted by ElectraNet for their next regulatory reset period 2008 to 2013.
During this assignment the SKM model was both updated and enhanced through consideration of elements presented by ElectraNet. The AER again accepted the SKM view to cost escalation index design.
SP AusNet - 2007 SKM was engaged by SP AusNet to analyse the likely drivers of cost escalation on capital expenditure forecasts over the remaining two years of their current determination (2006/07 and 2007/08), and for the next regulatory reset period (2008/09 to 2012/13, commencing 1 April 2008).
The SKM SP AusNet assignment set the precedent for above CPI escalation of capex costs. The AER accepted the SKM methodology noting that it produced robust figures.
ENERGEX - 2007 SKM was engaged by ENERGEX to provide forward estimates of budget figures relating to the ENERGEX Program of Works.
ENERGEX - 2005 SKM conducted a multi-utility study of equipment procurement strategies and prices, which examined current market and contract costs for a variety of assets including power transformers, circuit breakers, current and voltage transformers and conductor.