Embed Size (px)
Citation preview
SPI PowerNet Pty Ltd
Electricity Transmission
Revenue Proposal
2014/15 – 2016/17
Appendix 2A:
Asset Management Strategy 10-01
Submitted: 28 February 2013
Asset Management Strategy
Victorian Electricity Transmission Network
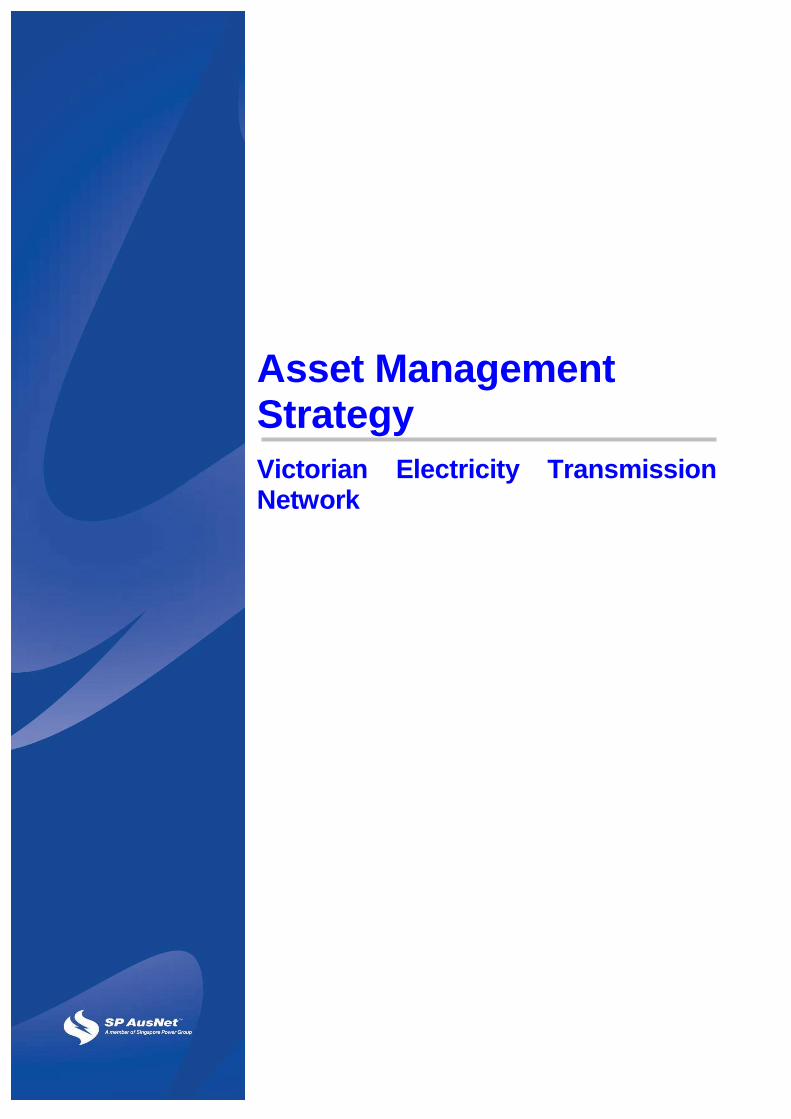
ISSUE/AMENDMENT STATUS
5 12/12/06 Editorial review following feedback from Regulatory & Business Strategy group.
G. Lukies
D. Postlethwaite
G. Towns
6 23/02/07 Editorial following external review.
Published to support TRR submission.
D. Postlethwaite
G. Lukies
G. Towns
7 13/03/07 Editorial update and format. D. Postlethwaite
G. Lukies
G. Towns
8 23/08/10 New AM Policy and formal approval by GGM NSD
D Postlethwaite A Parker
9 23/02/11 Integrate STEM into AMS Objectives P.Bryant D. Postlethwaite
10 08/02/13 Major review and update C. Rabbitte
J. Dyer
D. Meade
D. Postlethwaite
This template is for generating internal and external documents belonging to SP AusNet and may or may not contain all available information on the subject matter this document purports to address. The information contained in this document is subject to review and SP AusNet may amend this document at any time. Amendments will be indicated in the Amendment Table, but SP AusNet does not undertake to keep this document up to date. To the maximum extent permitted by law, SP AusNet makes no representation or warranty (express or implied) as to the accuracy, reliability, or completeness of the information contained in this document, or its suitability for any intended purpose. SP AusNet (which, for the purposes of this disclaimer, includes all of its related bodies corporate, its officers, employees, contractors, agents and consultants, and those of its related bodies corporate) shall have no liability for any loss or damage (be it direct or indirect, including liability by reason of negligence or negligent misstatement) for any statements, opinions, information or matter (expressed or implied) arising out of, contained in, or derived from, or for any omissions from, the information in this document.
This document is the responsibility of Network Strategy and Development Division, SP AusNet. Please contact the indicated owner of the document with any inquiries. D Postlethwaite SP AusNet Level 31, 2 Southbank Boulevard Melbourne Victoria 3006 Ph: (03) 9695 6000
SP AusNet AMS 10-01
Asset Management Strategy – Victorian Electricity Transmission Network
ISSUE 10 8/2/2013 3/ 68
UNCONTROLLED WHEN PRINTED
Foreword
SP AusNet owns and operates the Victorian electricity transmission network, directly serving the
energy needs of Australia’s second largest economy. SP AusNet also serves the National
Electricity Market (NEM) via the national transmission grid.
This network transfers bulk power from NEM generators to the electricity distributors who
service in excess of 2.4 million Victorian households and businesses. It interconnects high
voltage customers such as the Portland Aluminium Smelter and the transmission networks of
neighbouring New South Wales, South Australia and Tasmania. In total, this network transferred
over 46,870 GW1 hours of energy in 2011/12 and serviced a peak demand of 9,190 MW2.
The Australian Energy Market Operator (AEMO) and Victoria’s electricity distributors jointly plan
the augmentation of Victoria’s electricity transmission network. They forecast that continuing
augmentation is necessary to meet the 1.4% p.a. growth in Victorian electricity consumption and
the 1.6% p.a. growth in maximum demand over the next decade1.
SP AusNet exists to:
“Provide our customers with superior network and energy solutions”.
Our asset management vision is to be a:
“leader in the asset management of energy networks”.
Our asset management mission is to:
“deliver energy associated services, safely, reliably, efficiently and sustainably to
enhance the lives of our customers and employees”.
This Asset Management Strategy (AMS) is a key tool in achieving the SP AusNet vision. This
AMS facilitates delivery of agreed performance levels and optimised asset life cycles.
With a time horizon of 2020, this AMS and its supporting documentation provide the technical
direction for responsible stewardship of Victoria’s electricity transmission assets on behalf of the
NEM, energy generators, stakeholders, regulators, government and energy users.
1 National Electricity Forecasting Report (NEFR) 2012 2 Victorian Annual Planning Report 2012
SP AusNet AMS 10-01
Asset Management Strategy – Victorian Electricity Transmission Network
ISSUE 10 8/2/2013 4/ 68
UNCONTROLLED WHEN PRINTED
3.1 Purpose....................................................................................................................................... 7
3.2 Scope .......................................................................................................................................... 7
3.3 AMS Structure ............................................................................................................................ 8
3.4 Relationship to Other Management Documents ...................................................................... 8
4.1 Network Overview ...................................................................................................................... 9
4.2 Victorian Planning Framework ................................................................................................ 12
4.3 Regulatory Environment .......................................................................................................... 14
5.1 Strategic context ....................................................................................................................... 15
5.2 Asset Management Process ................................................................................................... 17
5.3 Asset Management System Certification ................................................................................ 18
6.1 Network safety .......................................................................................................................... 18
6.2 Sustainability ............................................................................................................................. 19
6.3 Network risk .............................................................................................................................. 21
6.4 Performance ............................................................................................................................. 23
6.5 Augmentation ........................................................................................................................... 24
6.6 Customer Connections ............................................................................................................ 27
6.7 Advances in Technology .......................................................................................................... 28
6.8 Program delivery ...................................................................................................................... 30
8.1 Network Objectives .................................................................................................................. 31
8.2 Network Performance Summary ............................................................................................. 32
8.3 Performance Benchmarks ....................................................................................................... 33
9.1 Risk Management .................................................................................................................... 36
9.2 Electrical Safety Management System ................................................................................... 37
9.3 Health and Safety Management .............................................................................................. 37
9.4 Environmental Management ................................................................................................... 39
9.5 Condition Monitoring ................................................................................................................ 40
9.6 Plant and Equipment Maintenance ......................................................................................... 40
9.7 Asset Management Information Systems ............................................................................... 41
SP AusNet AMS 10-01
Asset Management Strategy – Victorian Electricity Transmission Network
ISSUE 10 8/2/2013 5/ 68
UNCONTROLLED WHEN PRINTED
9.8 Network Performance Monitoring ............................................................................................ 42
9.9 Operations Management ......................................................................................................... 43
9.10 Program delivery and optimisation .......................................................................................... 43
9.11 Asset Replacement and Refurbishment ................................................................................. 44
9.12 Process and Configuration Management ............................................................................... 45
9.13 Knowledge and Record Management .................................................................................... 45
9.14 Skills and Competencies ......................................................................................................... 46
10.1 Auxiliary Systems ..................................................................................................................... 46
10.2 Capacitor Banks ....................................................................................................................... 48
10.3 Circuit Breakers ........................................................................................................................ 49
10.4 Civil Infrastructure ..................................................................................................................... 49
10.5 Communication Systems ......................................................................................................... 50
10.6 Disconnectors and Earth Switches ......................................................................................... 53
10.7 Earth Grids ................................................................................................................................ 54
10.8 Gas Insulated Switchgear ........................................................................................................ 55
10.9 Infrastructure Security .............................................................................................................. 55
10.10 Power Cables ........................................................................................................................... 56
10.11 Secondary Systems ................................................................................................................. 56
10.12 Static VAR Compensators ....................................................................................................... 58
10.13 Surge Diverters......................................................................................................................... 58
10.14 Synchronous Condensers ....................................................................................................... 59
10.15 Transformers ............................................................................................................................ 59
10.16 Instrument Transformers ......................................................................................................... 62
10.17 Transmission Lines .................................................................................................................. 62
ISSUE 10 8/2/2013 6/ 68
UNCONTROLLED WHEN PRINTED
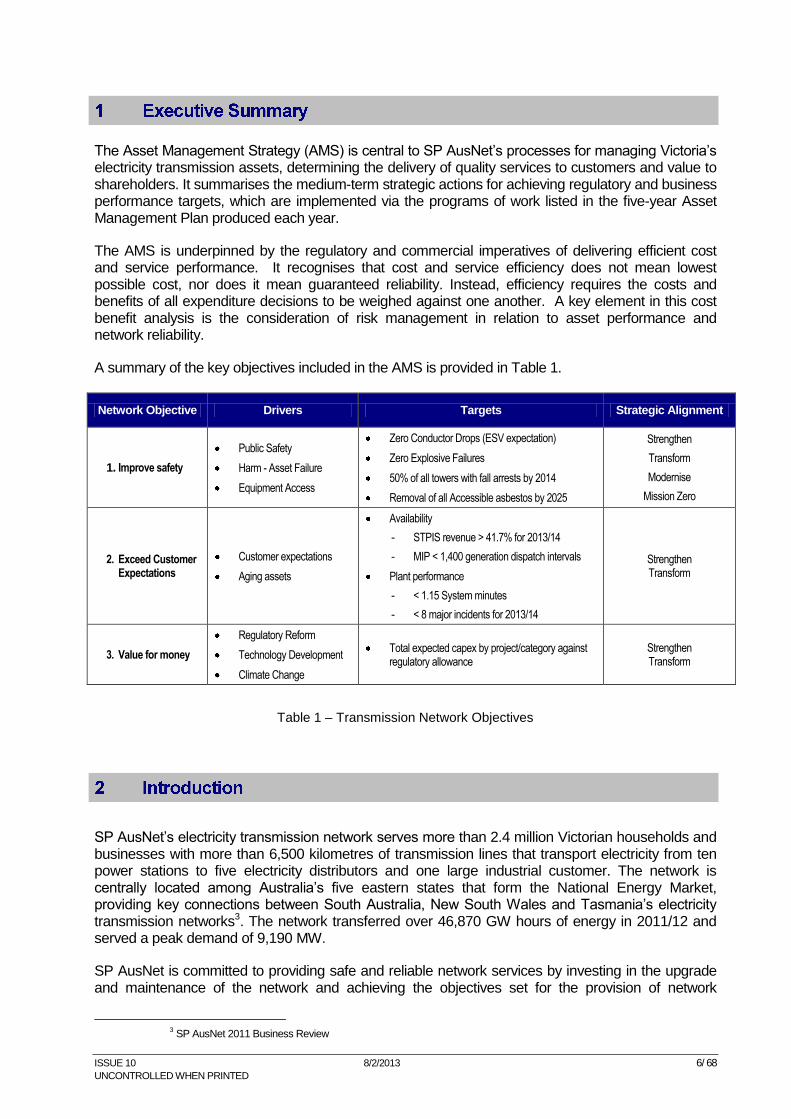
The Asset Management Strategy (AMS) is central to SP AusNet’s processes for managing Victoria’s electricity transmission assets, determining the delivery of quality services to customers and value to shareholders. It summarises the medium-term strategic actions for achieving regulatory and business performance targets, which are implemented via the programs of work listed in the five-year Asset Management Plan produced each year.
The AMS is underpinned by the regulatory and commercial imperatives of delivering efficient cost and service performance. It recognises that cost and service efficiency does not mean lowest possible cost, nor does it mean guaranteed reliability. Instead, efficiency requires the costs and benefits of all expenditure decisions to be weighed against one another. A key element in this cost benefit analysis is the consideration of risk management in relation to asset performance and network reliability.
A summary of the key objectives included in the AMS is provided in Table 1.
Network Objective Drivers Targets Strategic Alignment
1. Improve safety
Public Safety
Harm - Asset Failure
Equipment Access
Zero Conductor Drops (ESV expectation)
Zero Explosive Failures
50% of all towers with fall arrests by 2014
Removal of all Accessible asbestos by 2025
Strengthen
Transform
Modernise
Mission Zero
2. Exceed Customer Expectations
Customer expectations
Aging assets
Availability
- STPIS revenue > 41.7% for 2013/14
- MIP < 1,400 generation dispatch intervals
Plant performance
- < 1.15 System minutes
- < 8 major incidents for 2013/14
Strengthen Transform
3. Value for money
Regulatory Reform
Technology Development
Climate Change
Total expected capex by project/category against regulatory allowance
Strengthen Transform
Table 1 – Transmission Network Objectives
SP AusNet’s electricity transmission network serves more than 2.4 million Victorian households and businesses with more than 6,500 kilometres of transmission lines that transport electricity from ten power stations to five electricity distributors and one large industrial customer. The network is centrally located among Australia’s five eastern states that form the National Energy Market, providing key connections between South Australia, New South Wales and Tasmania’s electricity transmission networks3. The network transferred over 46,870 GW hours of energy in 2011/12 and served a peak demand of 9,190 MW.
SP AusNet is committed to providing safe and reliable network services by investing in the upgrade and maintenance of the network and achieving the objectives set for the provision of network
3 SP AusNet 2011 Business Review
ISSUE 10 8/2/2013 7/ 68
UNCONTROLLED WHEN PRINTED
services through pricing determinations and other regulatory instruments. The Asset Management Strategy documents SP AusNet’s holistic approach to management of the network assets, and establishes the linkages with and between the underpinning detailed strategies, processes and plans.
The approach seeks to deliver optimal electricity transmission network performance at efficient cost by ensuring that all decisions to augment, replace or maintain network assets are economically justified. Decisions taken must appropriately consider all relevant criteria including:
a. safety, b. demand for network services, c. performance and condition of network assets, d. objective of maintaining quality, reliability and security of supply, e. desirability of improving quality, reliability and security of supply, f. technological advancements, g. the changing nature of generation and demand resulting from energy efficiency and
climate change drivers, h. the direct challenges of climate change impacts on network assets.
SP AusNet welcomes feedback from stakeholders on this document.
The electricity transmission AMS and its supporting documentation provide robust technical direction for the responsible stewardship of electricity transmission assets. SP AusNet is steward of these assets on behalf of Victoria’s energy users, generators, shareholders, regulators, government and the National Electricity Market (NEM) more broadly. The AMS has the following key functions:
It sets the framework for SP AusNet’s holistic approach to management of the network assets, and in so doing establishes the linkages with and between the underpinning detailed strategies, processes and plans;
It provides important context for management strategies, by taking into account the demand for network services, the condition of network assets, and expected trends into the future. It therefore also has regard to the network augmentation planning process;
As the output of a strategic assessment process, the AMS sets out the significant asset management focus areas, and associated management strategies, for each asset class.
The Asset Management Strategy (AMS) is central to SP AusNet’s processes for delivery of network services to customers safely and reliably in accordance with SP AusNet’s Asset Management Policy, which is included in Appendix A.
This AMS covers SP AusNet’s electricity transmission assets operating across Victoria, including:
Transmission lines4, power cables and associated easements and access tracks;
Terminal stations, switching stations, communication stations and depots including associated electrical plant5, buildings and civil infrastructure;
Protection, control, metering and communications equipment;
Related functions and facilities such as spares, maintenance and test equipment; and
4 500 kV, 330 kV, 275 kV and 220 kV transmission lines and cables
5 500 kV, 330 kV, 275 kV, 220 kV, 66 kV and 22 kV switchgear and transformers
ISSUE 10 8/2/2013 8/ 68
UNCONTROLLED WHEN PRINTED
Asset management processes and systems such as System Control and Data Acquisition (SCADA) and asset management information systems (including MAXIMO).
More specifically, the AMS relates to electricity transmission sites and facilities:
Listed in the Network Agreement between SPI PowerNet Pty Ltd (then PowerNet Victoria) and the Australian Energy Market Operator (AEMO) (then the Victorian Power Exchange) 1994;
Listed in 1994 Connection Agreements between SPI PowerNet Pty Ltd and connected parties, largely consisting of generators, direct connect customers and distributors; and
Listed in various supplementary network and connection agreements, detailing SPI PowerNet Pty Ltd unregulated transmission assets.
This AMS excludes the assets and infrastructure owned by:
Generators;
Exit customers; and
Other companies providing transmission services within Victoria.
This AMS also excludes SP AusNet‘s corporate processes and associated information technology systems such as business communication, human resources and financial management systems. It does not include information on corporate offices or general business equipment such as computers and motor vehicles.
This document is structured as follows:
Introduction
Document Overview – Defines the purpose, scope, structure, relationship with other management documents.
Victorian Transmission System Overview – Provides an overview of the transmission network, Victorian planning framework and regulatory environment.
Asset Management Framework - Describes the strategic context, asset management processes and certification.
Asset Management Drivers – Outlines the drivers influencing asset management decisions and network performance.
Network Vision
Network Objectives and Performance – Summarises the transmission network objectives and historic performance against key metrics.
Process and System Strategies – Overview of major strategies required to manage the transmission network as a whole.
Plant Strategies - Overview of detailed plant specific asset management strategies including current and future capital and operational requirements.
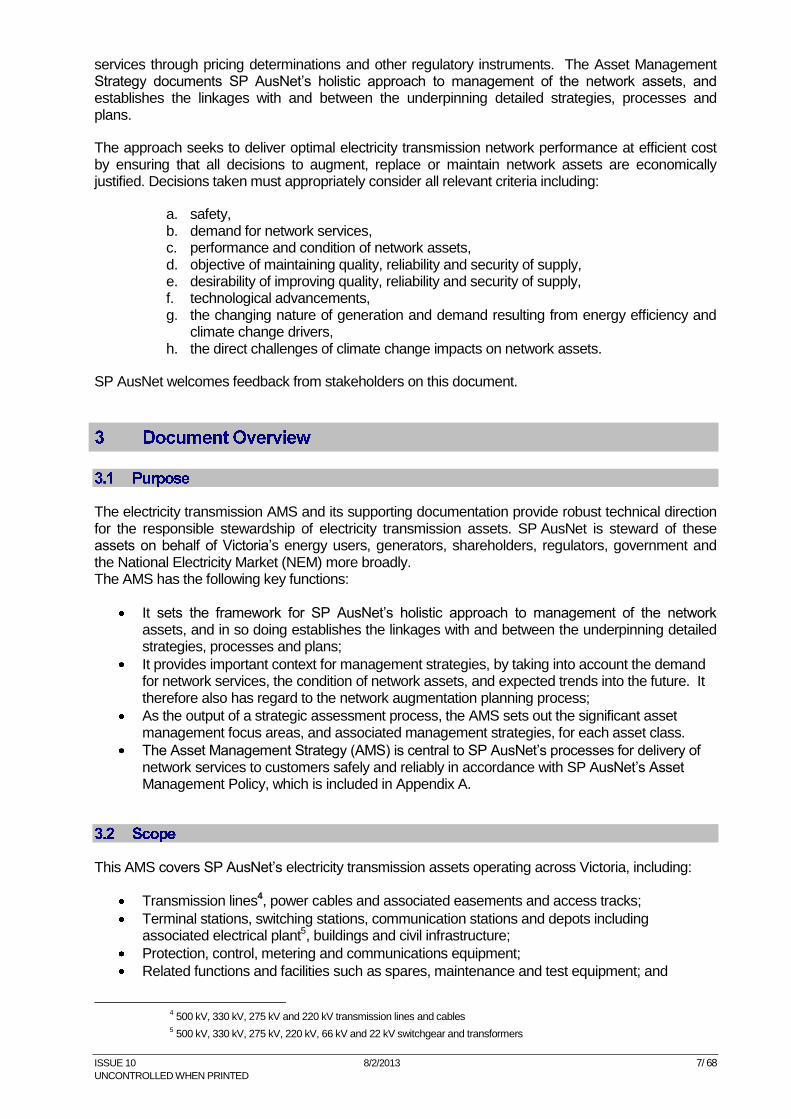
The electricity transmission asset management strategy is one of a number of asset management related documents developed and published by SP AusNet in relation to its transmission network. The asset management strategy presents an all-encompassing strategy for the transmission network, with this overarching strategy being supported by more detailed plant-specific strategies as depicted in Figure 1.
ISSUE 10 8/2/2013 9/ 68
UNCONTROLLED WHEN PRINTED
Figure 1 - AMS document interdependencies
This section provides a summary of the following areas:
Network overview;
Victorian planning framework; and
Regulatory environment.
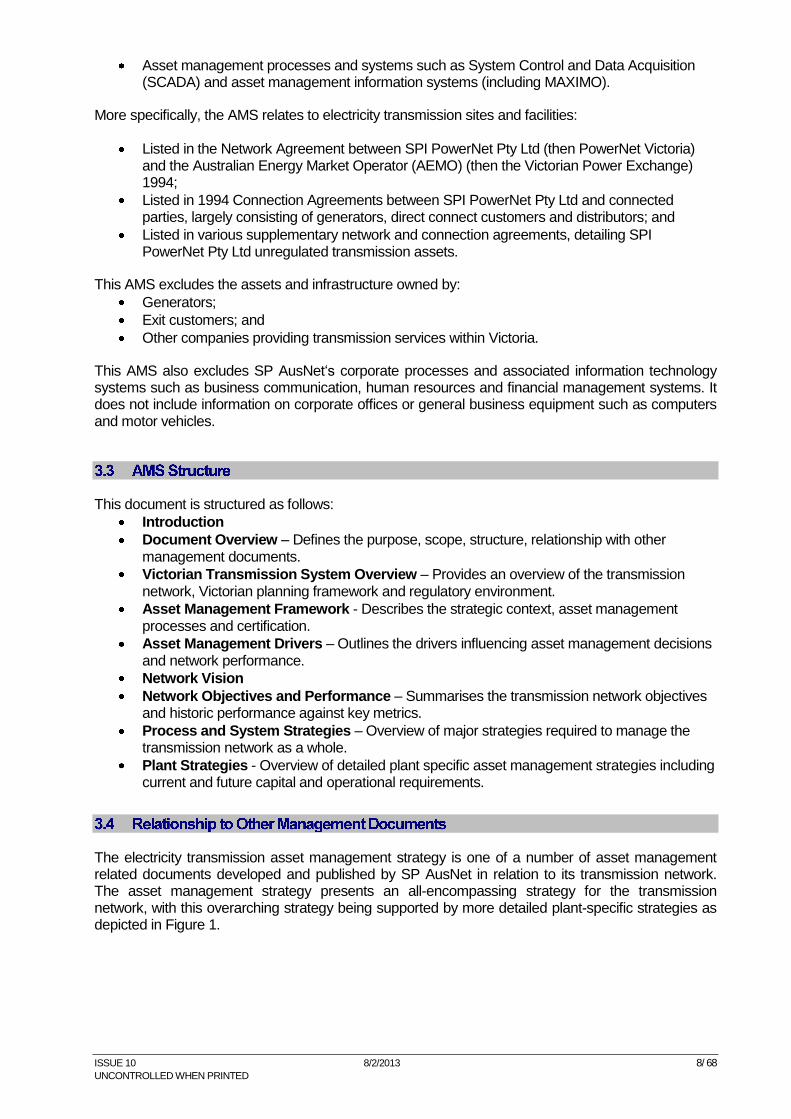
SP AusNet’s electricity transmission network serves more than 2.4 million Victorian households and businesses with more than 6,500 kilometres of transmission lines that transport electricity from power stations to electricity distributors and large customers. The general electricity supply arrangement in Victoria is illustrated in Figure 2.
Figure 2 – Illustration of Victorian Electricity Supply Arrangements
ISSUE 10 8/2/2013 10/ 68
UNCONTROLLED WHEN PRINTED
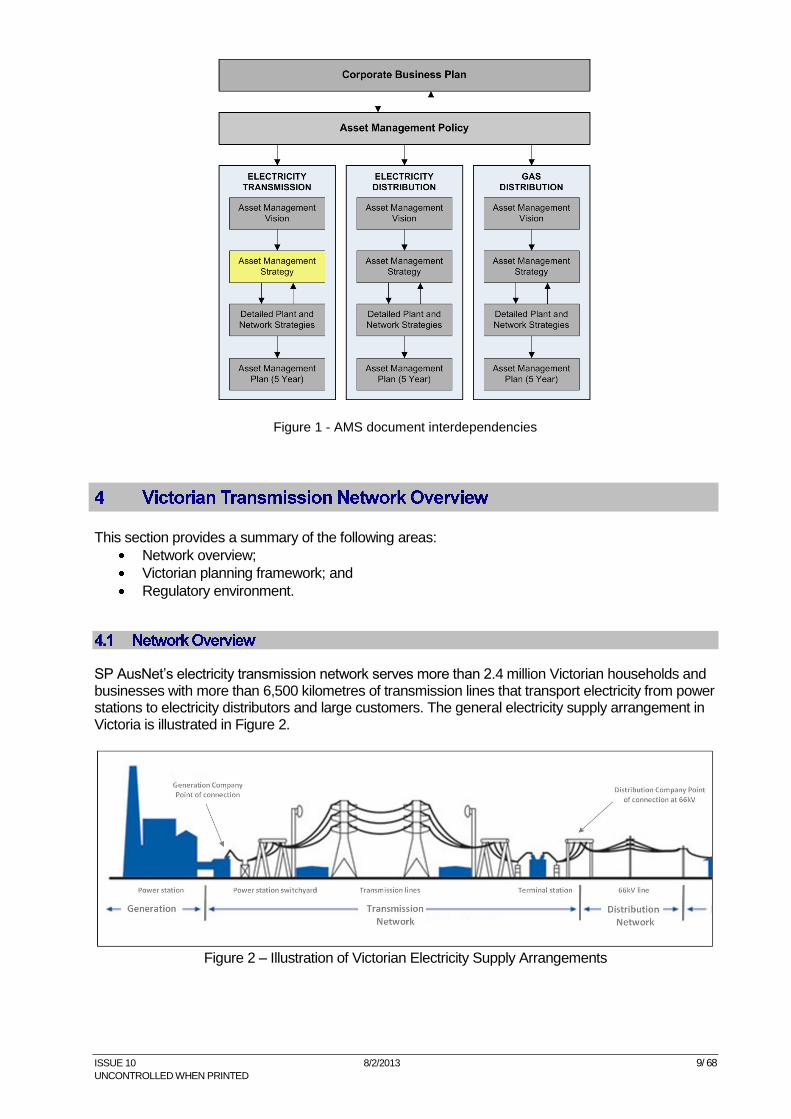
The Victorian electricity transmission network is depicted in Figure 3.
Figure 3 – Victorian Electricity Transmission Network
The network is centrally located among Australia’s five eastern states that form the National Energy Market (NEM), providing key connections between South Australia, New South Wales and Tasmania’s electricity transmission networks. The NEM interconnections include:
Two 330 kV lines from Dederang Terminal Station, to the Murray Switching Station (NSW)
One 330 kV line from Wodonga Terminal Station to Jindera (NSW)
One 220 kV line from Red Cliffs Terminal Station to Buronga (NSW)
Two 275 kV lines from Heywood Terminal Station to South East Substation (SA)
One 220 kV circuit from Red Cliffs Terminal Station to Berri (SA)
One 300 kV circuit from Loy Yang to Bell Bay (TAS)
ISSUE 10 8/2/2013 11/ 68
UNCONTROLLED WHEN PRINTED
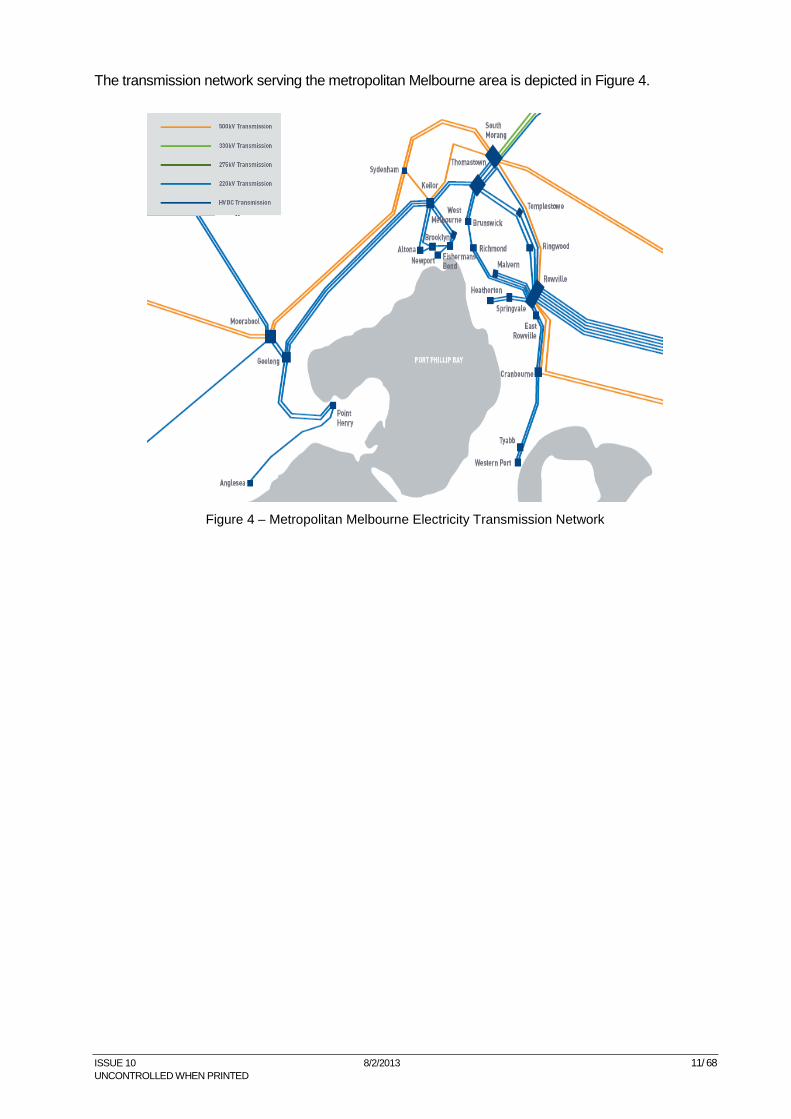
The transmission network serving the metropolitan Melbourne area is depicted in Figure 4.
Figure 4 – Metropolitan Melbourne Electricity Transmission Network
ISSUE 10 8/2/2013 12/ 68
UNCONTROLLED WHEN PRINTED
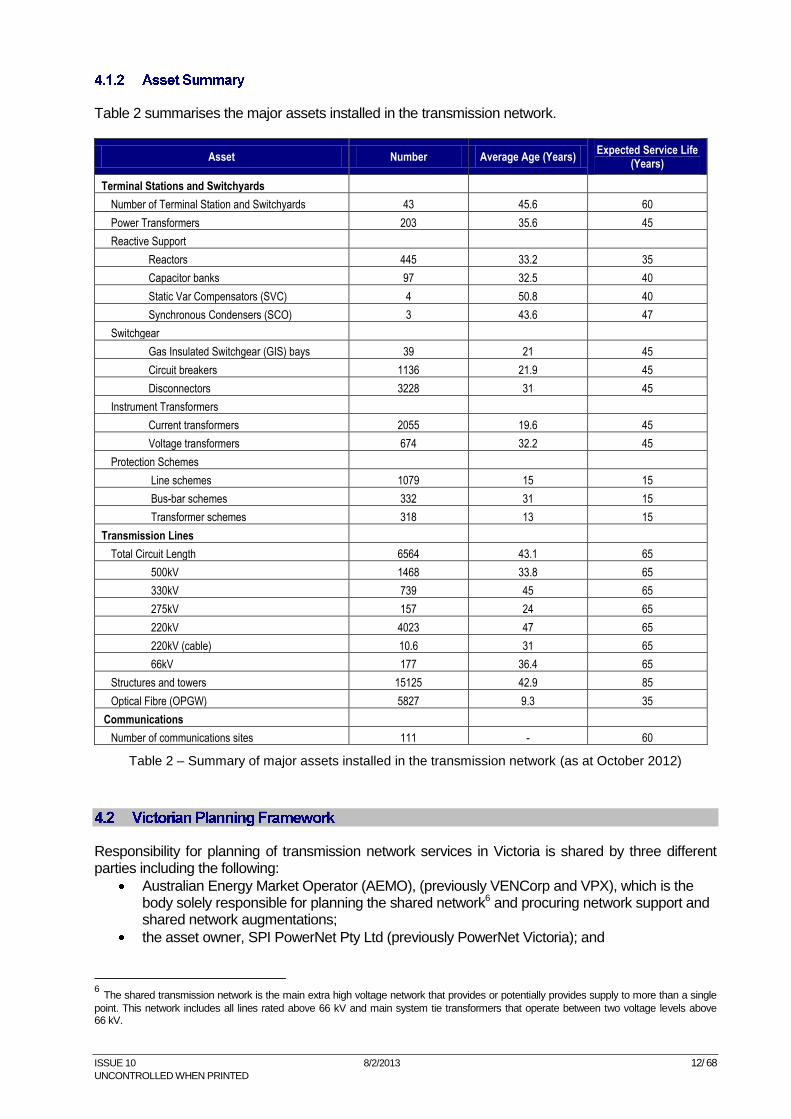
Table 2 summarises the major assets installed in the transmission network.
Asset Number Average Age (Years) Expected Service Life
(Years)
Terminal Stations and Switchyards
Number of Terminal Station and Switchyards 43 45.6 60
Power Transformers 203 35.6 45
Reactive Support
Reactors 445 33.2 35
Capacitor banks 97 32.5 40
Static Var Compensators (SVC) 4 50.8 40
Synchronous Condensers (SCO) 3 43.6 47
Switchgear
Gas Insulated Switchgear (GIS) bays 39 21 45
Circuit breakers 1136 21.9 45
Disconnectors 3228 31 45
Instrument Transformers
Current transformers 2055 19.6 45
Voltage transformers 674 32.2 45
Protection Schemes
Line schemes 1079 15 15
Bus-bar schemes 332 31 15
Transformer schemes 318 13 15
Transmission Lines
Total Circuit Length 6564 43.1 65
500kV 1468 33.8 65
330kV 739 45 65
275kV 157 24 65
220kV 4023 47 65
220kV (cable) 10.6 31 65
66kV 177 36.4 65
Structures and towers 15125 42.9 85
Optical Fibre (OPGW) 5827 9.3 35
Communications
Number of communications sites 111 - 60
Table 2 – Summary of major assets installed in the transmission network (as at October 2012)
Responsibility for planning of transmission network services in Victoria is shared by three different parties including the following:
Australian Energy Market Operator (AEMO), (previously VENCorp and VPX), which is the body solely responsible for planning the shared network6 and procuring network support and shared network augmentations;
the asset owner, SPI PowerNet Pty Ltd (previously PowerNet Victoria); and
6 The shared transmission network is the main extra high voltage network that provides or potentially provides supply to more than a single
point. This network includes all lines rated above 66 kV and main system tie transformers that operate between two voltage levels above 66 kV.
ISSUE 10 8/2/2013 13/ 68
UNCONTROLLED WHEN PRINTED
the transmission customers (distribution companies, generation companies and directly-connected industrial customers) which are responsible for planning and directing the augmentation of their respective transmission connection facilities.
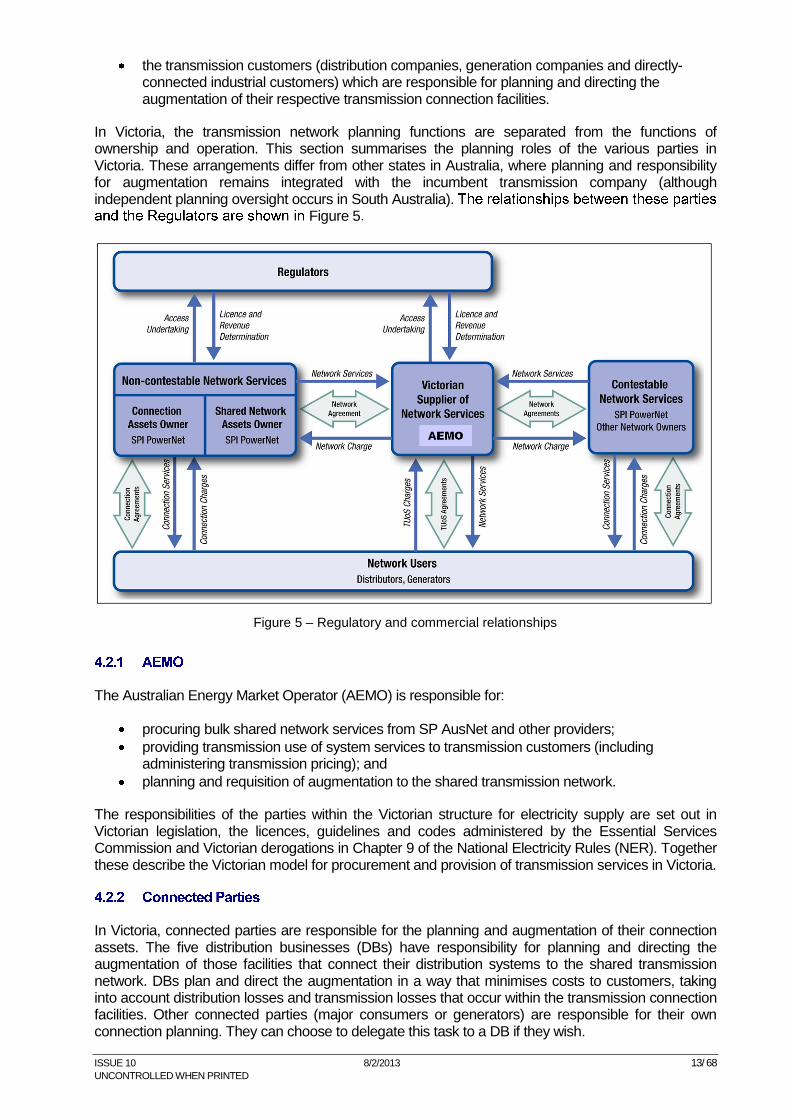
In Victoria, the transmission network planning functions are separated from the functions of ownership and operation. This section summarises the planning roles of the various parties in Victoria. These arrangements differ from other states in Australia, where planning and responsibility for augmentation remains integrated with the incumbent transmission company (although independent planning oversight occurs in South Australia).
Figure 5
Figure 5 – Regulatory and commercial relationships
The Australian Energy Market Operator (AEMO) is responsible for:
procuring bulk shared network services from SP AusNet and other providers;
providing transmission use of system services to transmission customers (including administering transmission pricing); and
planning and requisition of augmentation to the shared transmission network.
The responsibilities of the parties within the Victorian structure for electricity supply are set out in Victorian legislation, the licences, guidelines and codes administered by the Essential Services Commission and Victorian derogations in Chapter 9 of the National Electricity Rules (NER). Together these describe the Victorian model for procurement and provision of transmission services in Victoria.
In Victoria, connected parties are responsible for the planning and augmentation of their connection assets. The five distribution businesses (DBs) have responsibility for planning and directing the augmentation of those facilities that connect their distribution systems to the shared transmission network. DBs plan and direct the augmentation in a way that minimises costs to customers, taking into account distribution losses and transmission losses that occur within the transmission connection facilities. Other connected parties (major consumers or generators) are responsible for their own connection planning. They can choose to delegate this task to a DB if they wish.
ISSUE 10 8/2/2013 14/ 68
UNCONTROLLED WHEN PRINTED
In the event that a new connection or augmentation of an existing connection is required the connected parties must consult with and meet the reasonable technical requirements of AEMO, SP AusNet and other effected parties.
Each year the DBs publish the Transmission Connection Planning Report that assesses network planning criteria, the risks of lost load and options for meeting forecast demand.
The Victorian transmission network is subject to economic and technical regulation, which is the responsibility of the Australian Energy Regulator (AER) and Energy Safe Victoria (ESV) respectively.
Economic regulation is subject to a national regulatory framework, which is governed by the National Electricity Law (NEL) and contained in the National Electricity Rules (Rules). The Australian Energy Markets Commission (AEMC) has responsibility for development of the Rules, and the AER is responsible for regulation of industry participants in accordance with the Rules. The AER's regulatory functions and powers are conferred upon it by the NEL and it must act in accordance with its obligations under the Rules (as must industry participants).
The AER’s key responsibilities include:
regulating the revenues of transmission network service providers and distribution network service providers;
monitoring the electricity wholesale market;
monitoring compliance with the national electricity law, national electricity rules and national electricity regulations;
investigating breaches or possible breaches of provisions of the national electricity law, rules and regulations and instituting and conducting enforcement proceedings against relevant market participants;
establishing service standards for electricity transmission network service providers;
establishing ring-fencing guidelines for business operations with respect to regulated transmission services; and
exempting network service providers from registration.
Regulatory proposals (i.e. revenue applications) to the AER are assessed against, amongst other things, the operating expenditure objective and the capital expenditure objective (clauses 6A.6.6 (a) and 6A.6.7 (a) of the Rules). Accordingly network businesses are required to submit the total forecast operating expenditure and capital expenditure. The applicable criteria for the expenditure forecasts are:
meet or manage the expected demand for standard control services over that period;
comply with all applicable regulatory obligations or requirements associated with the provision of standard control services;
maintain the quality, reliability and security of supply of standard control services; and
maintain the reliability, safety and security of the distribution system through the supply of standard control services.
ESV is an independent Victorian statutory authority. The responsibilities of ESV relevant to electricity networks are:
safety of electricity supply including generation, transmission and distribution;
safety of electrical installations in industrial, commercial and domestic premises;
ISSUE 10 8/2/2013 15/ 68
UNCONTROLLED WHEN PRINTED
safety of electrical workers by the registration of contractors and the licensing of electrical workers on the attainment of an appropriate level of electrical safety competency;
safety of electrical equipment by ensuring it meets minimum required electricity safety standards before sale;
the education of the community and the electricity industry on the safe use of electricity through a strong and focussed awareness campaign;
investigation and analysis of incidents and accidents to identify trends and develop preventative measures; and
protection against the corrosion of underground or underwater structures from the potential leakage of stray electric current.
The Council of Australian Governments has initiated the development of a regulatory framework for national safety regulation of energy networks. The Electricity Safety Act (1998) requires SP AusNet to “design, construct, operate, maintain and decommission its supply network to minimise the hazards and risks to the safety of any person arising from the supply network; having regard to the:
a) severity of the hazard or risk in question; and b) state of knowledge about the hazard or risk and any ways of removing or mitigating the hazard or
risk; and c) availability and suitability of ways to remove or mitigate the hazard or risk; and d) cost of removing or mitigating the hazard or risk”.
This section provides relevant context and background to the AMS through summaries of the following areas:
Strategic context;
Asset management process; and
Asset management system certification.
SP AusNet’s purpose is to:
“provide our customers with superior network and energy solutions”.
This purpose acknowledges that the nature of the energy sector will change fundamentally over the next decade, responding to community expectations of safety and reliability, climatic change and emerging technologies.
ISSUE 10 8/2/2013 16/ 68
UNCONTROLLED WHEN PRINTED
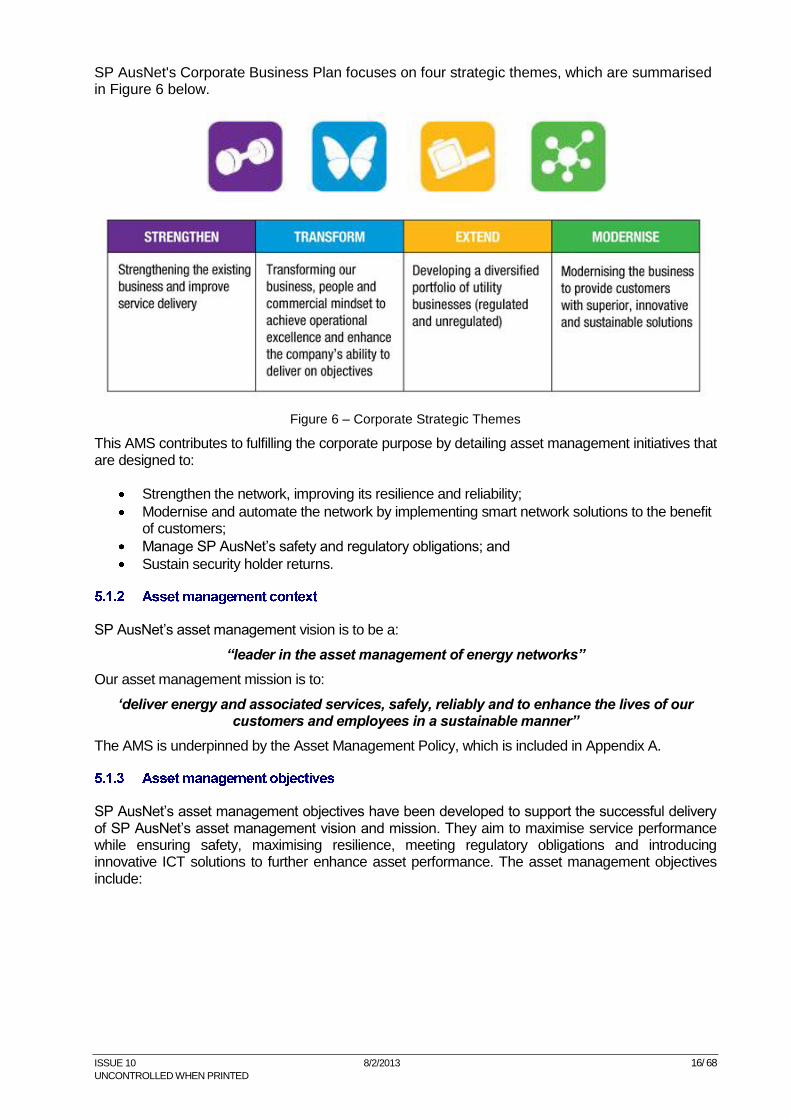
SP AusNet's Corporate Business Plan focuses on four strategic themes, which are summarised in Figure 6 below.
Figure 6 – Corporate Strategic Themes
This AMS contributes to fulfilling the corporate purpose by detailing asset management initiatives that are designed to:
Strengthen the network, improving its resilience and reliability;
Modernise and automate the network by implementing smart network solutions to the benefit of customers;
Manage SP AusNet’s safety and regulatory obligations; and
Sustain security holder returns.
SP AusNet’s asset management vision is to be a:
“leader in the asset management of energy networks”
Our asset management mission is to:
‘deliver energy and associated services, safely, reliably and to enhance the lives of our customers and employees in a sustainable manner”
The AMS is underpinned by the Asset Management Policy, which is included in Appendix A.
SP AusNet’s asset management objectives have been developed to support the successful delivery of SP AusNet’s asset management vision and mission. They aim to maximise service performance while ensuring safety, maximising resilience, meeting regulatory obligations and introducing innovative ICT solutions to further enhance asset performance. The asset management objectives include:
ISSUE 10 8/2/2013 17/ 68
UNCONTROLLED WHEN PRINTED
Outperform regulatory benchmarks;
Enhance network safety;
Meet energy and maximum demand growth;
Comply with regulatory obligations;
Improve network reliability commensurate with risk and cost; and
Modernise networks using integrated ICT platforms and smart networks to enhance service offerings.
The asset management objectives are supported by specific objectives for the transmission network, which are detailed in Section 8.
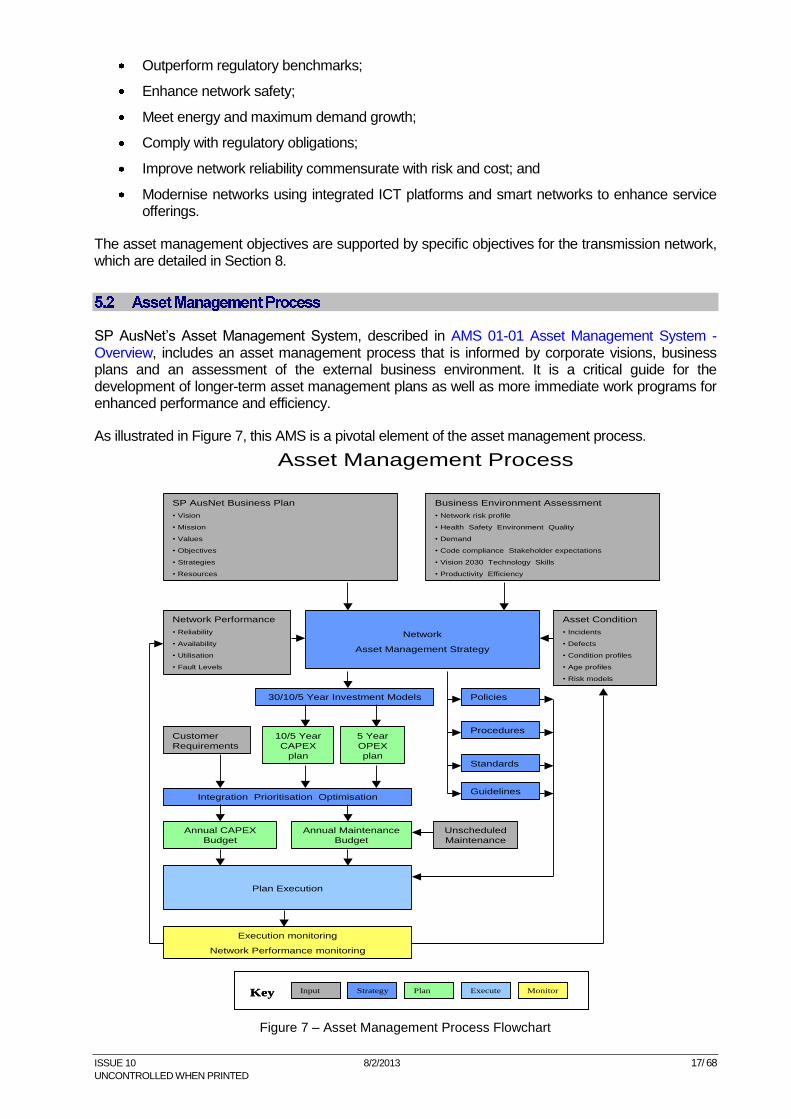
SP AusNet’s Asset Management System, described in AMS 01-01 Asset Management System -Overview, includes an asset management process that is informed by corporate visions, business plans and an assessment of the external business environment. It is a critical guide for the development of longer-term asset management plans as well as more immediate work programs for enhanced performance and efficiency.
As illustrated in Figure 7, this AMS is a pivotal element of the asset management process.
Asset Management Process
SP AusNet Business Plan
• Vision
• Mission
• Values
• Objectives
• Strategies
• Resources
Business Environment Assessment
• Network risk profile
• Health Safety Environment Quality
• Demand
• Code compliance Stakeholder expectations
• Vision 2030 Technology Skills
• Productivity Efficiency
Network Performance
• Reliability
• Availability
• Utilisation
• Fault Levels
Asset Condition
• Incidents
• Defects
• Condition profiles
• Age profiles
• Risk models
Network
Asset Management Strategy
Standards
Procedures
Policies30/10/5 Year Investment Models
Customer
Requirements
10/5 Year
CAPEX
plan
5 Year
OPEX
plan
Integration Prioritisation Optimisation
Annual CAPEX
Budget
Annual Maintenance
Budget
Plan Execution
Execution monitoring
Network Performance monitoring
Guidelines
Unscheduled
Maintenance
Input Strategy Plan ExecuteKey MonitorInput Strategy Plan ExecuteKey Monitor
Figure 7 – Asset Management Process Flowchart
ISSUE 10 8/2/2013 18/ 68
UNCONTROLLED WHEN PRINTED
SP AusNet’s three energy networks are accredited to the British Standards Institution's Publically Available Specification 55 1:2008 (PAS 55). PAS 55 is the internationally recognised standard for the optimised management of physical infrastructure assets to achieve a desired and sustainable outcome. The transmission asset management practices have continued to retain certification since 2008. It is applied where physical assets are a critical factor in achieving business objectives and effective service delivery, and permits organisations to assess their asset management systems in a similar manner to other management systems, such as ISO 9000 and ISO 14001. PAS 55 implements a risk management focussed approach to asset management.
Accreditation demonstrates robust and transparent asset management policies, processes, procedures, practices and a sustainable performance framework. Accreditation is an indicator that SP AusNet remains an effective, efficient and competent asset manager able to demonstrate an advanced level of Asset Management process maturity.
This section highlights the significant drivers for future network investment to achieve customer, regulatory and shareholder expectations. SP AusNet is accountable for responding to these drivers in accordance with legislative and other regulatory instruments. The key asset management drivers include the following:
Network safety;
Sustainability;
Network risk;
Performance;
Augmentation;
Advances in technology; and
Skills and resources.
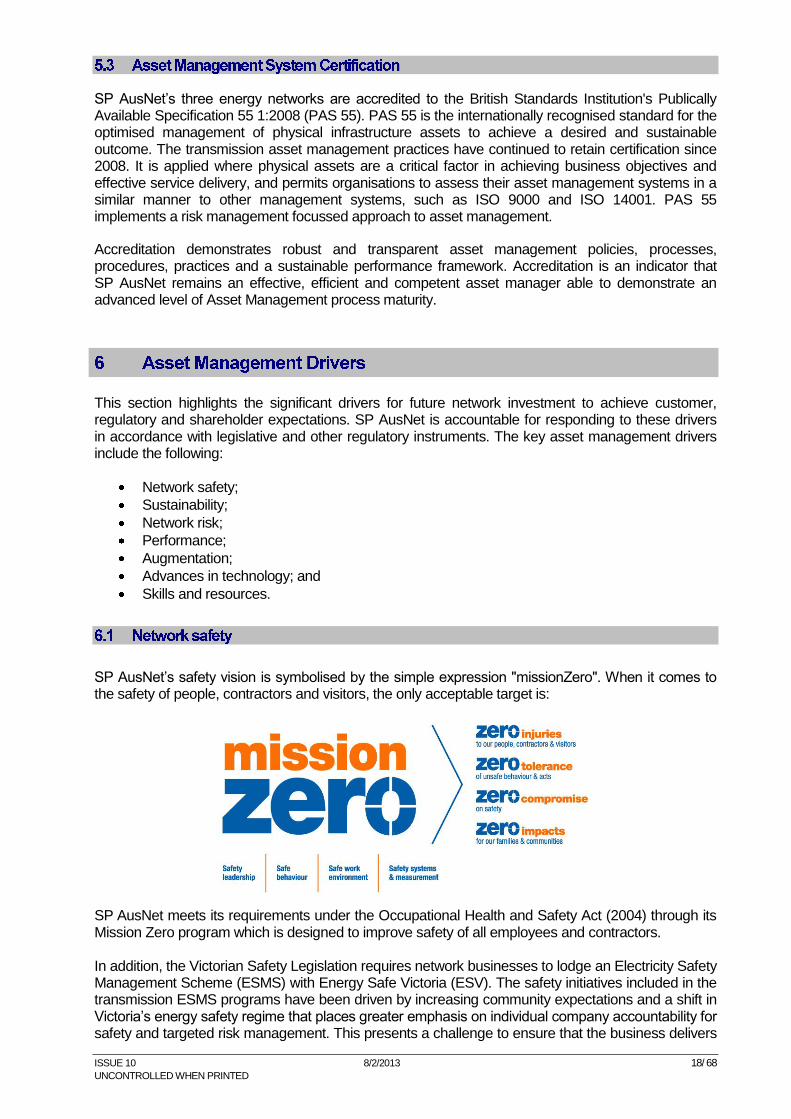
SP AusNet’s safety vision is symbolised by the simple expression "missionZero". When it comes to the safety of people, contractors and visitors, the only acceptable target is:
SP AusNet meets its requirements under the Occupational Health and Safety Act (2004) through its Mission Zero program which is designed to improve safety of all employees and contractors. In addition, the Victorian Safety Legislation requires network businesses to lodge an Electricity Safety Management Scheme (ESMS) with Energy Safe Victoria (ESV). The safety initiatives included in the transmission ESMS programs have been driven by increasing community expectations and a shift in Victoria’s energy safety regime that places greater emphasis on individual company accountability for safety and targeted risk management. This presents a challenge to ensure that the business delivers
ISSUE 10 8/2/2013 19/ 68
UNCONTROLLED WHEN PRINTED
the safety program works as agreed with ESV. Failing to deliver has become more transparent and will result in compliance directives.
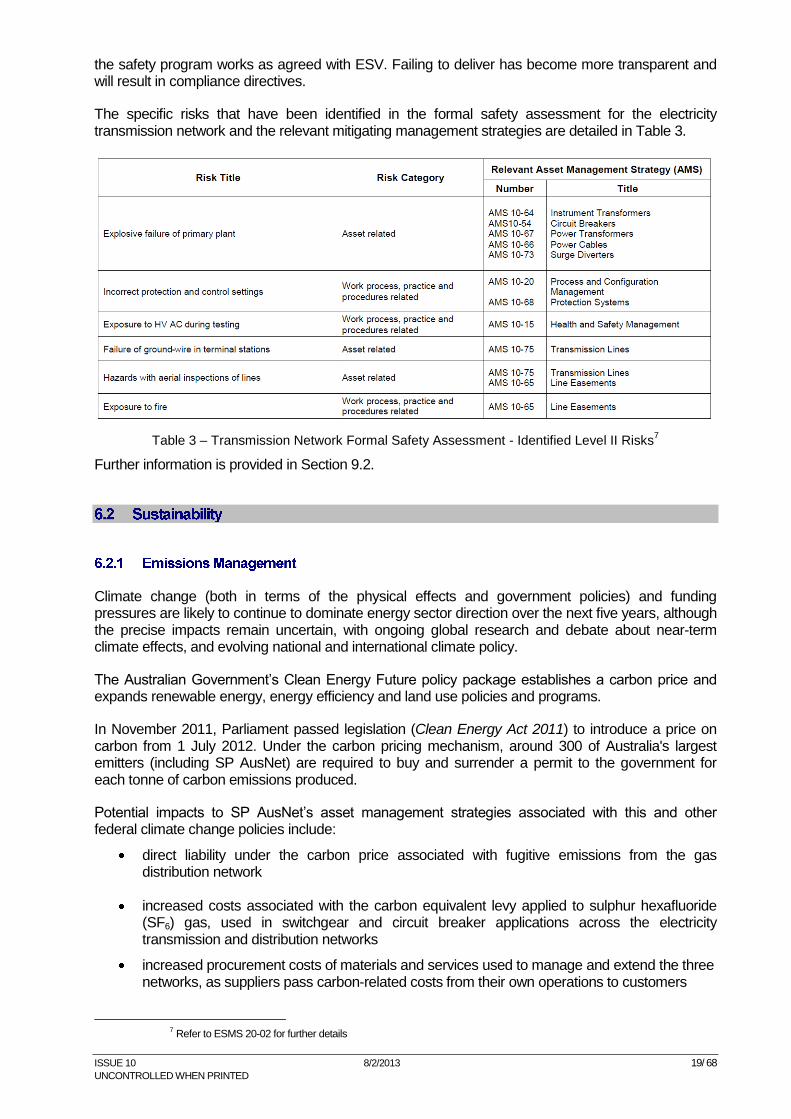
The specific risks that have been identified in the formal safety assessment for the electricity transmission network and the relevant mitigating management strategies are detailed in Table 3.
Table 3 – Transmission Network Formal Safety Assessment - Identified Level II Risks7
Further information is provided in Section 9.2.
Climate change (both in terms of the physical effects and government policies) and funding pressures are likely to continue to dominate energy sector direction over the next five years, although the precise impacts remain uncertain, with ongoing global research and debate about near-term climate effects, and evolving national and international climate policy.
The Australian Government’s Clean Energy Future policy package establishes a carbon price and expands renewable energy, energy efficiency and land use policies and programs.
In November 2011, Parliament passed legislation (Clean Energy Act 2011) to introduce a price on carbon from 1 July 2012. Under the carbon pricing mechanism, around 300 of Australia's largest emitters (including SP AusNet) are required to buy and surrender a permit to the government for each tonne of carbon emissions produced.
Potential impacts to SP AusNet’s asset management strategies associated with this and other federal climate change policies include:
direct liability under the carbon price associated with fugitive emissions from the gas distribution network
increased costs associated with the carbon equivalent levy applied to sulphur hexafluoride (SF6) gas, used in switchgear and circuit breaker applications across the electricity transmission and distribution networks
increased procurement costs of materials and services used to manage and extend the three networks, as suppliers pass carbon-related costs from their own operations to customers
7 Refer to ESMS 20-02 for further details
ISSUE 10 8/2/2013 20/ 68
UNCONTROLLED WHEN PRINTED
emissions reduction targets for Victorian brown coal-fired generators, which may lead to the closure or modification of high emission coal-fired power stations;
changes to energy demand and consumer energy consumption patterns and increased installation of solar power, use of electric vehicles etc.
SP AusNet focuses on protection of the immediate environment in which it operates through the AS/NZS ISO 14001 certified environmental management system. The environmental management system is the principle tool through which SP AusNet identifies environmental risks, develops and implements solutions and monitors success in controlling such risks. Key programs in the environmental management system include the management of vegetation, SF6 gas leaks, oil discharges, Poly chlorinated biphenyls (PCB) management, electromagnetic fields and noise abatement.
Further information on SP AusNet’s environmental management system is provided in Section 7.5 and in EMS 10-01 Environmental Management.
SP AusNet works toward building meaningful relationships and dialogue with community groups through the social investment strategy which include initiatives such as partnering with community organisations such as the Country Fire Authority. Efforts have been made to improve the visual appearance of existing installations and amending the design of new installations through community engagement. SP AusNet’s commitment to community engagement is demonstrated through the collaborative approach taken whilst establishing designs for the RTS, BTS and WMTS station rebuilds.
The nature of the energy sector will change fundamentally over the next decade, responding to community expectations of safety and reliability, climatic change and emerging technologies. The systems, processes, tools and the appropriate employee skills set used to deliver transmission services will need to adapt to the changing operating environment as it continually evolves.
More immediately, the industry faces skill shortages through retirement of an aging workforce. The retirement profile, together with a projected increase in network expenditures, is driving the increasing demand for knowledge-management, skills-transfer, training and recruitment.
ISSUE 10 8/2/2013 21/ 68
UNCONTROLLED WHEN PRINTED
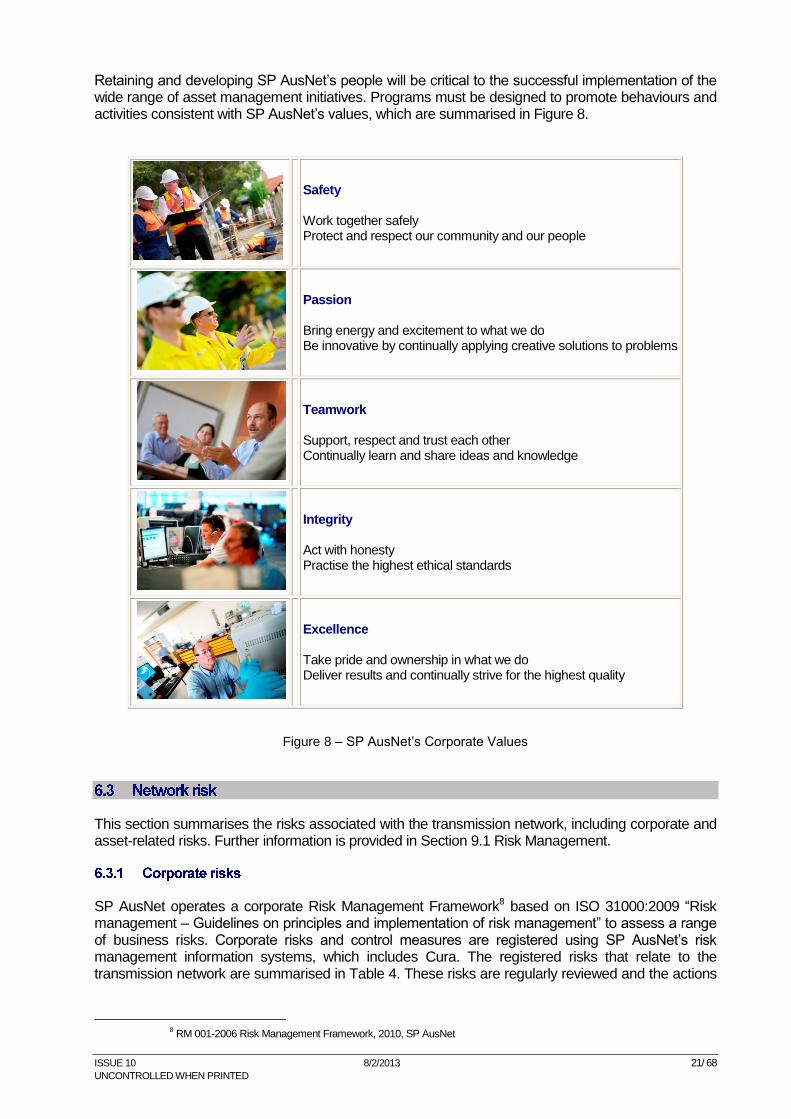
Retaining and developing SP AusNet’s people will be critical to the successful implementation of the wide range of asset management initiatives. Programs must be designed to promote behaviours and activities consistent with SP AusNet’s values, which are summarised in Figure 8.
Safety Work together safely Protect and respect our community and our people
Passion Bring energy and excitement to what we do Be innovative by continually applying creative solutions to problems
Teamwork Support, respect and trust each other Continually learn and share ideas and knowledge
Integrity Act with honesty Practise the highest ethical standards
Excellence Take pride and ownership in what we do Deliver results and continually strive for the highest quality
Figure 8 – SP AusNet’s Corporate Values
This section summarises the risks associated with the transmission network, including corporate and asset-related risks. Further information is provided in Section 9.1 Risk Management.
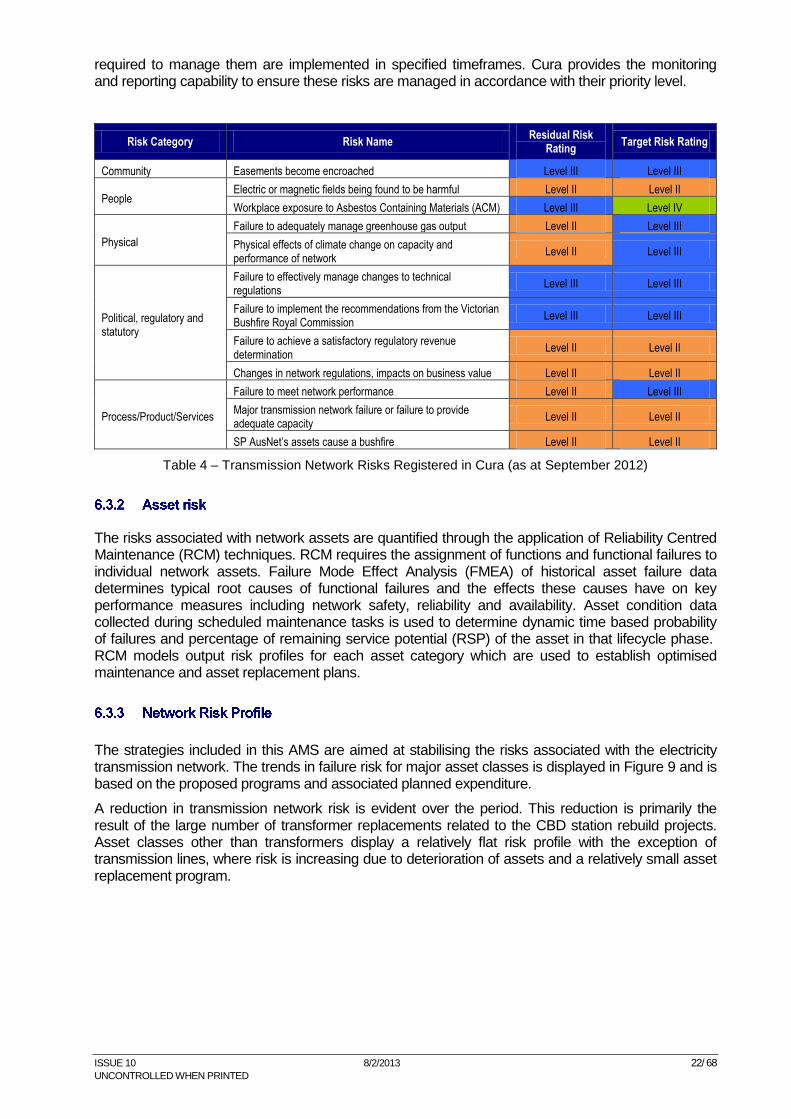
SP AusNet operates a corporate Risk Management Framework8 based on ISO 31000:2009 “Risk management – Guidelines on principles and implementation of risk management” to assess a range of business risks. Corporate risks and control measures are registered using SP AusNet’s risk management information systems, which includes Cura. The registered risks that relate to the transmission network are summarised in Table 4. These risks are regularly reviewed and the actions
8 RM 001-2006 Risk Management Framework, 2010, SP AusNet
ISSUE 10 8/2/2013 22/ 68
UNCONTROLLED WHEN PRINTED
required to manage them are implemented in specified timeframes. Cura provides the monitoring and reporting capability to ensure these risks are managed in accordance with their priority level.
Risk Category Risk Name Residual Risk
Rating Target Risk Rating
Community Easements become encroached Level III Level III
People Electric or magnetic fields being found to be harmful Level II Level II
Workplace exposure to Asbestos Containing Materials (ACM) Level III Level IV
Physical
Failure to adequately manage greenhouse gas output Level II Level III
Physical effects of climate change on capacity and performance of network
Level II Level III
Political, regulatory and statutory
Failure to effectively manage changes to technical regulations
Level III Level III
Failure to implement the recommendations from the Victorian Bushfire Royal Commission
Level III Level III
Failure to achieve a satisfactory regulatory revenue determination
Level II Level II
Changes in network regulations, impacts on business value Level II Level II
Process/Product/Services
Failure to meet network performance Level II Level III
Major transmission network failure or failure to provide adequate capacity
Level II Level II
SP AusNet’s assets cause a bushfire Level II Level II
Table 4 – Transmission Network Risks Registered in Cura (as at September 2012)
The risks associated with network assets are quantified through the application of Reliability Centred Maintenance (RCM) techniques. RCM requires the assignment of functions and functional failures to individual network assets. Failure Mode Effect Analysis (FMEA) of historical asset failure data determines typical root causes of functional failures and the effects these causes have on key performance measures including network safety, reliability and availability. Asset condition data collected during scheduled maintenance tasks is used to determine dynamic time based probability of failures and percentage of remaining service potential (RSP) of the asset in that lifecycle phase. RCM models output risk profiles for each asset category which are used to establish optimised maintenance and asset replacement plans.
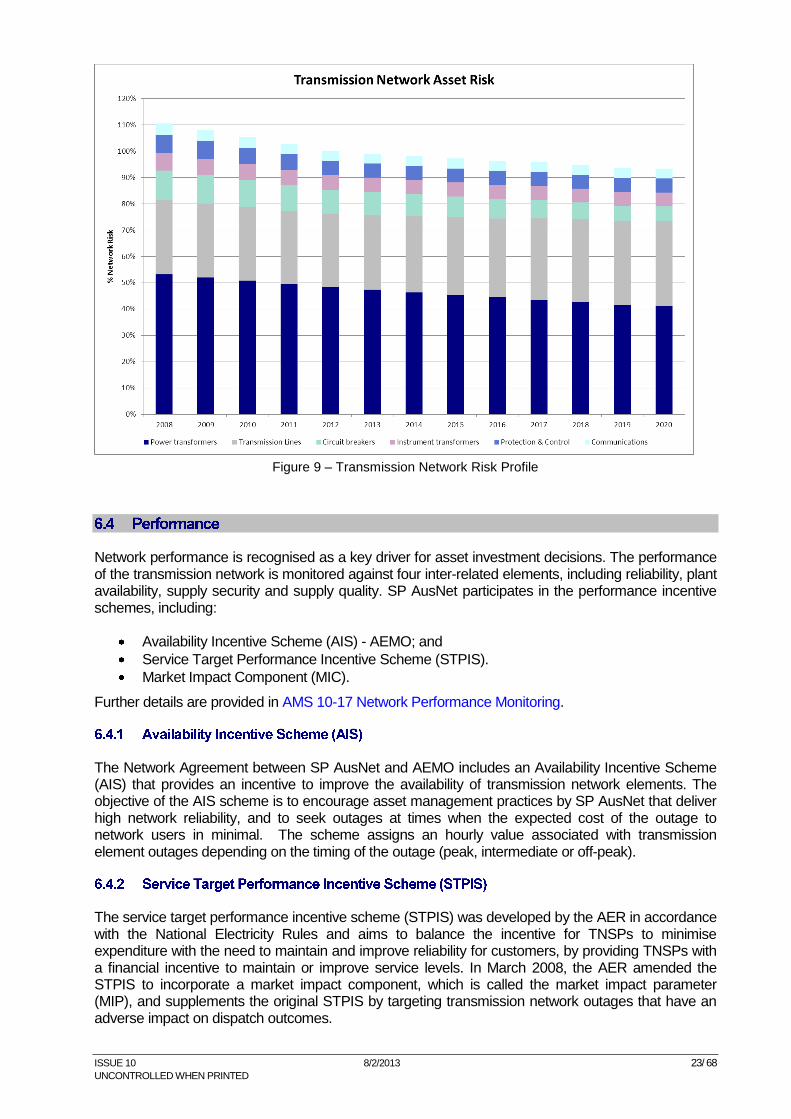
The strategies included in this AMS are aimed at stabilising the risks associated with the electricity transmission network. The trends in failure risk for major asset classes is displayed in Figure 9 and is based on the proposed programs and associated planned expenditure.
A reduction in transmission network risk is evident over the period. This reduction is primarily the result of the large number of transformer replacements related to the CBD station rebuild projects. Asset classes other than transformers display a relatively flat risk profile with the exception of transmission lines, where risk is increasing due to deterioration of assets and a relatively small asset replacement program.
ISSUE 10 8/2/2013 23/ 68
UNCONTROLLED WHEN PRINTED
Figure 9 – Transmission Network Risk Profile
Network performance is recognised as a key driver for asset investment decisions. The performance of the transmission network is monitored against four inter-related elements, including reliability, plant availability, supply security and supply quality. SP AusNet participates in the performance incentive schemes, including:
Availability Incentive Scheme (AIS) - AEMO; and
Service Target Performance Incentive Scheme (STPIS).
Market Impact Component (MIC).
Further details are provided in AMS 10-17 Network Performance Monitoring.
The Network Agreement between SP AusNet and AEMO includes an Availability Incentive Scheme (AIS) that provides an incentive to improve the availability of transmission network elements. The objective of the AIS scheme is to encourage asset management practices by SP AusNet that deliver high network reliability, and to seek outages at times when the expected cost of the outage to network users in minimal. The scheme assigns an hourly value associated with transmission element outages depending on the timing of the outage (peak, intermediate or off-peak).
The service target performance incentive scheme (STPIS) was developed by the AER in accordance with the National Electricity Rules and aims to balance the incentive for TNSPs to minimise expenditure with the need to maintain and improve reliability for customers, by providing TNSPs with a financial incentive to maintain or improve service levels. In March 2008, the AER amended the STPIS to incorporate a market impact component, which is called the market impact parameter (MIP), and supplements the original STPIS by targeting transmission network outages that have an adverse impact on dispatch outcomes.
ISSUE 10 8/2/2013 24/ 68
UNCONTROLLED WHEN PRINTED
The MIC provides an incentive to TNSPs to minimise planned transmission outages that can affect the NEM spot price. It measures the number of dispatch intervals where an outage on the TNSP’s network results in a network outage constraint with a marginal value greater than $10/MWh.
The MIC currently operates as a bonus only scheme which provides a TNSP with a payment of up to two per cent of its MAR in each calendar year. A TNSP receives the full two per cent payment if it can reduce the number of dispatch intervals with a marginal value greater than $10/MWh to zero. The payment which a TNSP receives in each calendar year is calculated by measuring the TNSP’s annual performance against the target. The asymmetric nature of the scheme means there is no revenue at risk for the TNSP.
Network augmentation investments are driven by growth in electricity consumption and demand, and rising fault levels. AEMO is responsible for the planning and justification of transmission network augmentation projects. SP AusNet works closely with AEMO in planning future asset replacement programs ensuring that alignment with planned augmentation works is optimised.
The transmission network transferred over 46,870 GW9 hours of energy in 2011/12 and serviced a peak demand of 9,190 MW10. The peak demand was 5.2% lower than the previous year reflecting the mild summer temperatures experienced.
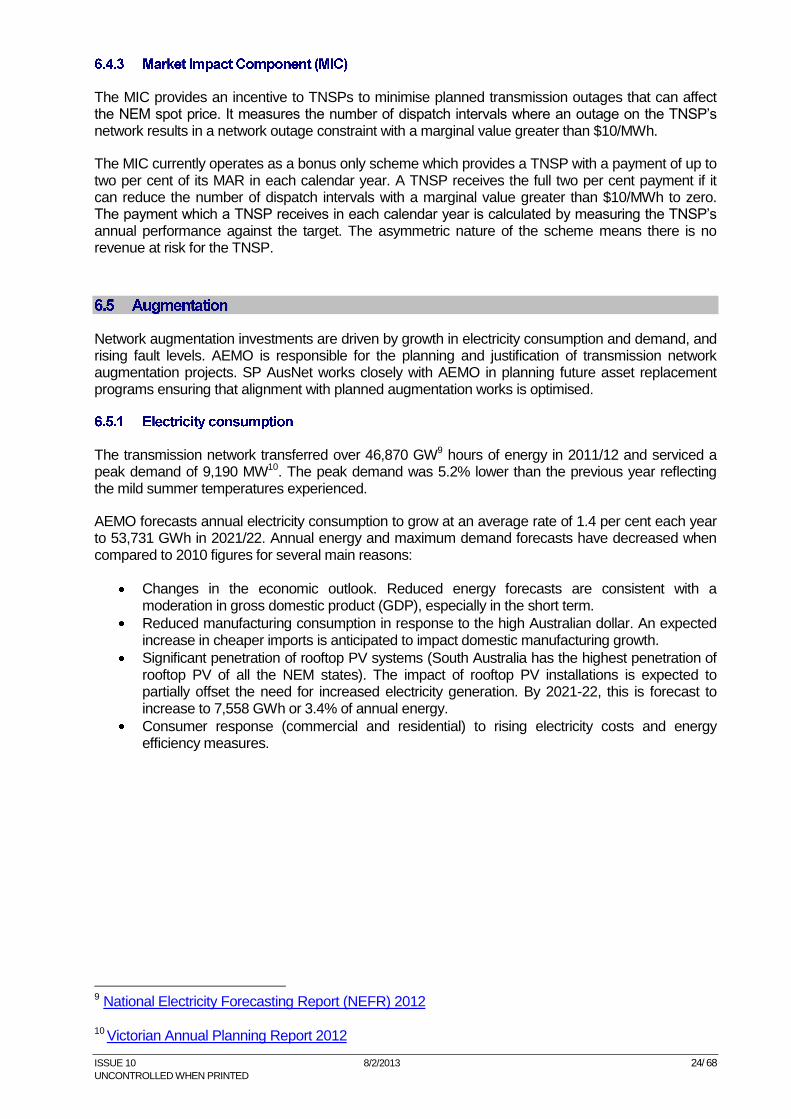
AEMO forecasts annual electricity consumption to grow at an average rate of 1.4 per cent each year to 53,731 GWh in 2021/22. Annual energy and maximum demand forecasts have decreased when compared to 2010 figures for several main reasons:
Changes in the economic outlook. Reduced energy forecasts are consistent with a moderation in gross domestic product (GDP), especially in the short term.
Reduced manufacturing consumption in response to the high Australian dollar. An expected increase in cheaper imports is anticipated to impact domestic manufacturing growth.
Significant penetration of rooftop PV systems (South Australia has the highest penetration of rooftop PV of all the NEM states). The impact of rooftop PV installations is expected to partially offset the need for increased electricity generation. By 2021-22, this is forecast to increase to 7,558 GWh or 3.4% of annual energy.
Consumer response (commercial and residential) to rising electricity costs and energy efficiency measures.
9 National Electricity Forecasting Report (NEFR) 2012
10 Victorian Annual Planning Report 2012
ISSUE 10 8/2/2013 25/ 68
UNCONTROLLED WHEN PRINTED
Figure 10 below, presents AEMO’s energy forecast to 2020/21 based on a medium growth scenario.
Figure 10 – Energy forecast (medium scenario) (GWh)
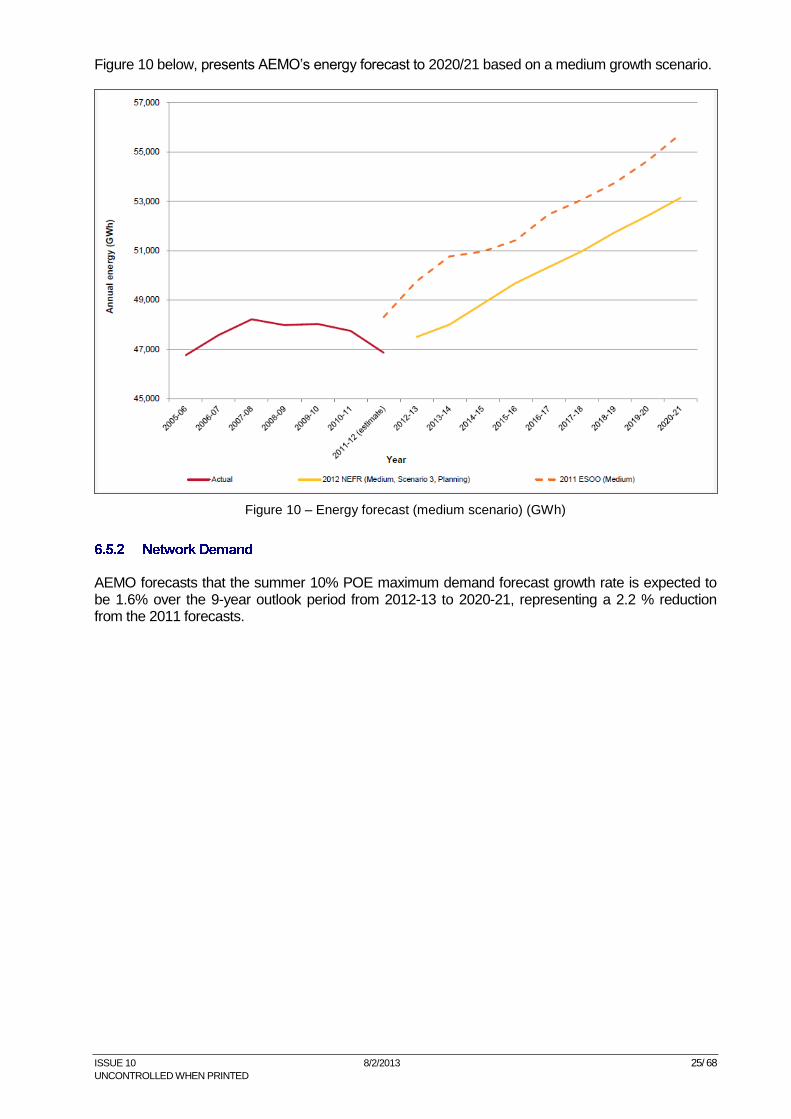
AEMO forecasts that the summer 10% POE maximum demand forecast growth rate is expected to be 1.6% over the 9-year outlook period from 2012-13 to 2020-21, representing a 2.2 % reduction from the 2011 forecasts.
ISSUE 10 8/2/2013 26/ 68
UNCONTROLLED WHEN PRINTED
Figure 11 below, compares the 2011 medium scenario and the 2012 medium economic growth scenario summer 10%, 50% and 90% POE maximum demand forecasts.
Figure 11 – Summer Maximum Demand Forecast (medium scenario) (MW)
AEMO is responsible for ensuring that fault levels at all terminal stations in the electricity declared shared network (DSN) are within their fault level interrupt capabilities. The fault level interrupt capability is determined either from terminal station equipment limits (rating of the lowest rated circuit breaker), or those set out in the National Electricity Rules (NER) or connection agreements. AEMO’s analysis of terminal station fault levels is as follows: Fault levels at 500 kV, 330 kV, and 275 kV voltage levels are:
well below the fault level interrupt capability of the terminal stations (in the range of 20%-61% of the limit), and
unlikely to constrain development at any of these voltage levels within the foreseeable future.
Fault levels at the 220 kV voltage level are:
approaching the fault level interrupt capability at a number of terminal stations; and
above 95% of the fault level interrupt capability of four terminal stations. This indicates that augmentations at or in the vicinity of these stations may include fault level mitigation.
Fault levels at 66 kV and 22 kV levels are:
approaching the fault level interrupt capability at a number of terminal stations; and
above 95% of the fault level interrupt capability at eight terminal stations. This indicates that augmentations at or in the vicinity of these stations may include fault level mitigation.
ISSUE 10 8/2/2013 27/ 68
UNCONTROLLED WHEN PRINTED
Further details of fault level calculations for terminal stations are available in the 2012 Victorian Annual Planning Report published by AEMO.
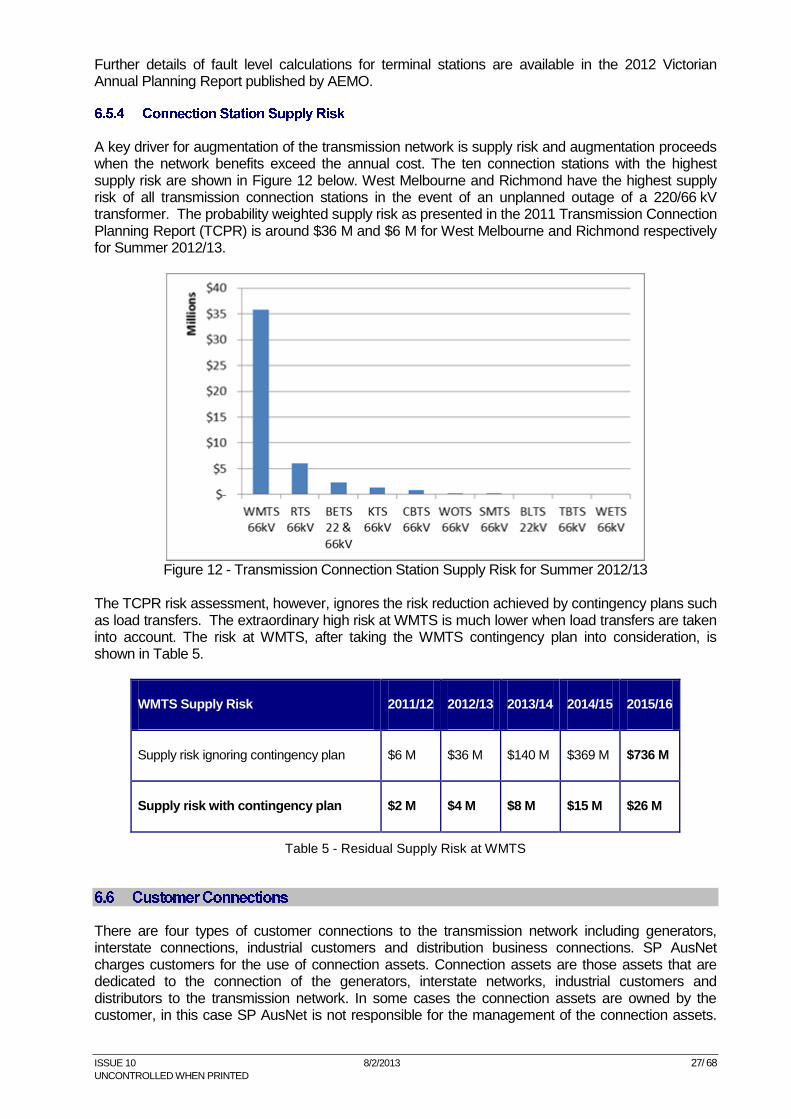
A key driver for augmentation of the transmission network is supply risk and augmentation proceeds when the network benefits exceed the annual cost. The ten connection stations with the highest supply risk are shown in Figure 12 below. West Melbourne and Richmond have the highest supply risk of all transmission connection stations in the event of an unplanned outage of a 220/66 kV transformer. The probability weighted supply risk as presented in the 2011 Transmission Connection Planning Report (TCPR) is around $36 M and $6 M for West Melbourne and Richmond respectively for Summer 2012/13.
Figure 12 - Transmission Connection Station Supply Risk for Summer 2012/13
The TCPR risk assessment, however, ignores the risk reduction achieved by contingency plans such as load transfers. The extraordinary high risk at WMTS is much lower when load transfers are taken into account. The risk at WMTS, after taking the WMTS contingency plan into consideration, is shown in Table 5.
WMTS Supply Risk 2011/12 2012/13 2013/14 2014/15 2015/16
Supply risk ignoring contingency plan $6 M $36 M $140 M $369 M $736 M
Supply risk with contingency plan $2 M $4 M $8 M $15 M $26 M
Table 5 - Residual Supply Risk at WMTS
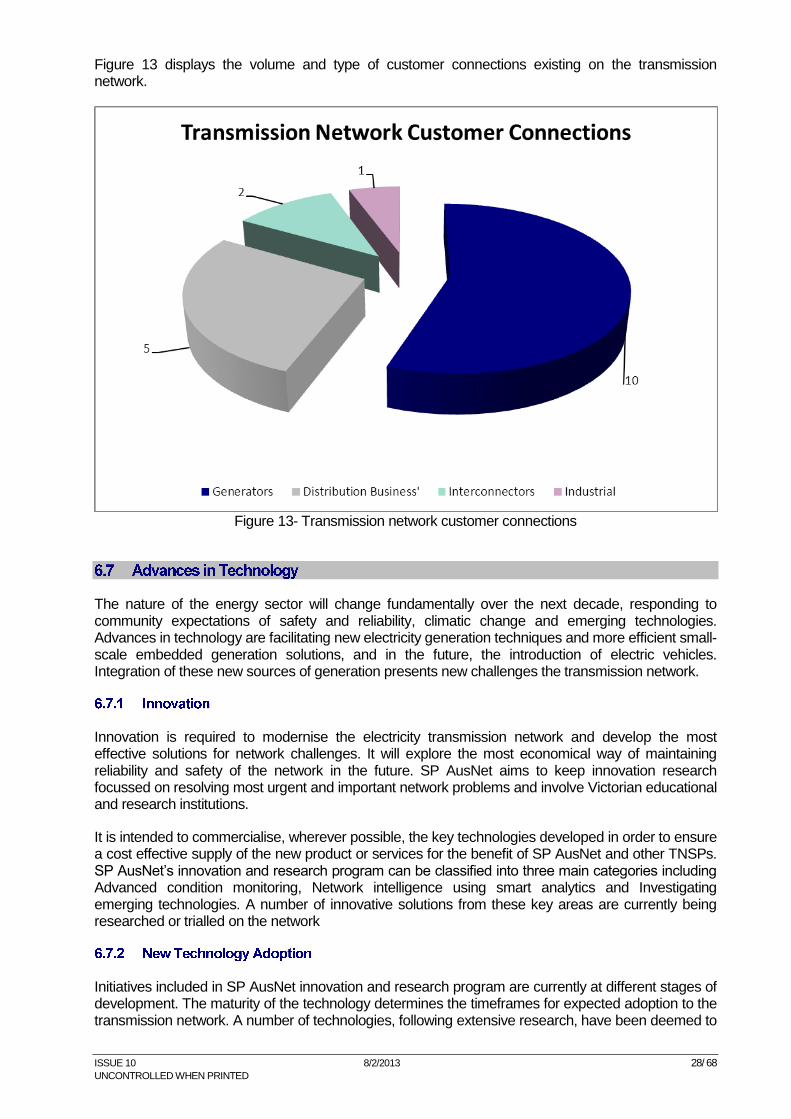
There are four types of customer connections to the transmission network including generators, interstate connections, industrial customers and distribution business connections. SP AusNet charges customers for the use of connection assets. Connection assets are those assets that are dedicated to the connection of the generators, interstate networks, industrial customers and distributors to the transmission network. In some cases the connection assets are owned by the customer, in this case SP AusNet is not responsible for the management of the connection assets.
ISSUE 10 8/2/2013 28/ 68
UNCONTROLLED WHEN PRINTED
Figure 13 displays the volume and type of customer connections existing on the transmission network.
Figure 13- Transmission network customer connections
The nature of the energy sector will change fundamentally over the next decade, responding to community expectations of safety and reliability, climatic change and emerging technologies. Advances in technology are facilitating new electricity generation techniques and more efficient small-scale embedded generation solutions, and in the future, the introduction of electric vehicles. Integration of these new sources of generation presents new challenges the transmission network.
Innovation is required to modernise the electricity transmission network and develop the most effective solutions for network challenges. It will explore the most economical way of maintaining reliability and safety of the network in the future. SP AusNet aims to keep innovation research focussed on resolving most urgent and important network problems and involve Victorian educational and research institutions.
It is intended to commercialise, wherever possible, the key technologies developed in order to ensure a cost effective supply of the new product or services for the benefit of SP AusNet and other TNSPs. SP AusNet’s innovation and research program can be classified into three main categories including Advanced condition monitoring, Network intelligence using smart analytics and Investigating emerging technologies. A number of innovative solutions from these key areas are currently being researched or trialled on the network
Initiatives included in SP AusNet innovation and research program are currently at different stages of development. The maturity of the technology determines the timeframes for expected adoption to the transmission network. A number of technologies, following extensive research, have been deemed to
ISSUE 10 8/2/2013 29/ 68
UNCONTROLLED WHEN PRINTED
present considerable benefits and so are currently being trialled for use on the network. These technologies include the following:
Portable radio frequency scanning
Online monitoring of partial discharge at terminal stations
Aerial surveying image processing
Smart analytics for asset data
Radio frequency based line fault detection
Portable x-ray
Additional innovative technologies are considered to be at an evolutionary stage and still require considerable levels of investment and development. Additional research is required to determine the cost effectiveness and suitability of these technologies before adoption to the transmission network. Developing technologies which are currently being monitored by SP AusNet are listed below:
HVDC lines and converters
EHV cable technology
High temperature conductors
Inexpensive modular station builds
FACTS devices and power electronics
Wireless Sensor Network (WSN) system for Substations
Line Fault Detection System
Polymer Insulator Diagnostics
Innovation Strategies:
Monitor progress of new technologies
Develop innovation and research program focussed on producing innovative solutions to the critical and urgent network problems
Keep innovation program targeted and outcome focussed
Collaborate with educational and research organisations to leverage investment into Research and Development (R&D)
Provide right culture for innovation i.e., flexibility but delivery focus
Commercialise innovation to enable wide spread deployment at the least cost
Step change in the innovation program to deliver meaningful outcome in a timely manner
Further information can be found in AMS 10-20 Process and Configuration Management
The dominant trend in secondary systems is toward the application of digital technology devices and systems with in-built intelligence and integrated functionality. These digital technology platforms add value by:
Increasing functionality, reliability and availability through the use of microprocessors, solid-state devices, digital technology and optic fibre-based communication systems
Lowering per function costs whilst increasing performance capability
Embedding intelligent diagnostic software that optimises operation and improves asset management
Rationalising equipment via functional integration and multiple signal processing capability
Providing remote management facilities for network elements based on real-time data communications
IEC61850 is an electrical substation design standard which is widely seen as an enabler for the modernisation of high speed protection and control systems by integrating a number of functions into a smaller number of intelligent electronic devices.
ISSUE 10 8/2/2013 30/ 68
UNCONTROLLED WHEN PRINTED
The standard is also being evaluated as a potential driver for the replacement of secondary cabling with serial communications over optic fibre. IEC61850 capability is becoming readily available in relays and will enable the introduction of an IEC61850 “Station Bus” at Terminal Stations within the next few years.
Protection systems designed using IEC61850 are more likely to be economic at Greenfield sites and where major rebuilds are being implemented. The IEC61850 “Process Bus” is expected to become feasible for newly designed stations and for station upgrades in the medium to long-term.
The asset management strategies included in this document will require an increase in projected capital expenditure compared with historical levels.
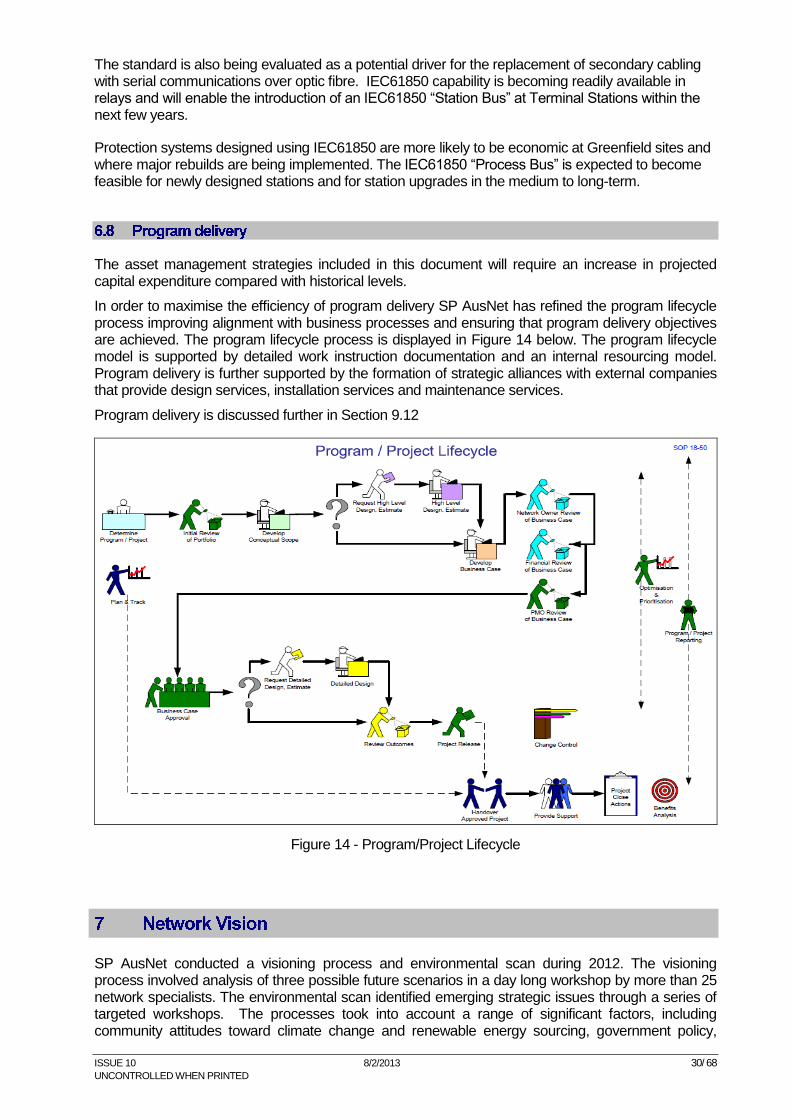
In order to maximise the efficiency of program delivery SP AusNet has refined the program lifecycle process improving alignment with business processes and ensuring that program delivery objectives are achieved. The program lifecycle process is displayed in Figure 14 below. The program lifecycle model is supported by detailed work instruction documentation and an internal resourcing model. Program delivery is further supported by the formation of strategic alliances with external companies that provide design services, installation services and maintenance services.
Program delivery is discussed further in Section 9.12
Figure 14 - Program/Project Lifecycle
SP AusNet conducted a visioning process and environmental scan during 2012. The visioning process involved analysis of three possible future scenarios in a day long workshop by more than 25 network specialists. The environmental scan identified emerging strategic issues through a series of targeted workshops. The processes took into account a range of significant factors, including community attitudes toward climate change and renewable energy sourcing, government policy,
ISSUE 10 8/2/2013 31/ 68
UNCONTROLLED WHEN PRINTED
customer growth and energy needs, and future technology advances and applications. For the purposes of the AMS, the conclusions from the processes provide an important reference for prudent strategy. This is particularly so as the visioning process forecast a number of significant challenges for the electricity transmission network over the next 25 years.
Key influences identified are:
demand may continue to grow, leading to continuing expansion of transmission network infrastructure however, this is not certain;
future transmission networks may be constructed quite differently to existing networks due to the nature and location of generators, the maturity of technologies such DC transmission and the uncertain need for networks that will last more than 50 years;
the continuing development of information technologies (IT) and tools (robotics) along with the proliferation of network information from sensors, meters and analysis tools; and
ongoing technical skills shortages.
In response to these influences, SP AusNet will need to continue to evolve and change in a number of areas including:
the development of tools and systems that make available information readily available to users. This will include users in the field, network operators and customers, asset managers and technical specialists;
improving understanding of new technologies and approaches such as HVDC transmission, robotic network inspections, modular stations and new materials;
continuing to broaden skills that supplement traditional electricity network engineering skills and better enable activities such as environmental management, stakeholder engagement, robotics, and data analysis; and
increasing the use of network modelling, predictive modelling, and integrated asset management tools. Use of more advanced tools will better enable management of risk from an ageing network, improve economic decision making and reduce the cost of network services.
This section details the transmission network objectives and the metrics used to measure network performance.
The AMS is focused on delivering optimal transmission network performance at efficient costs. The AMS ensures that all decisions to replace or maintain network assets are justified on an economic basis.
The transmission network objectives have been developed to enable the successful delivery of the asset management vision and mission.
ISSUE 10 8/2/2013 32/ 68
UNCONTROLLED WHEN PRINTED
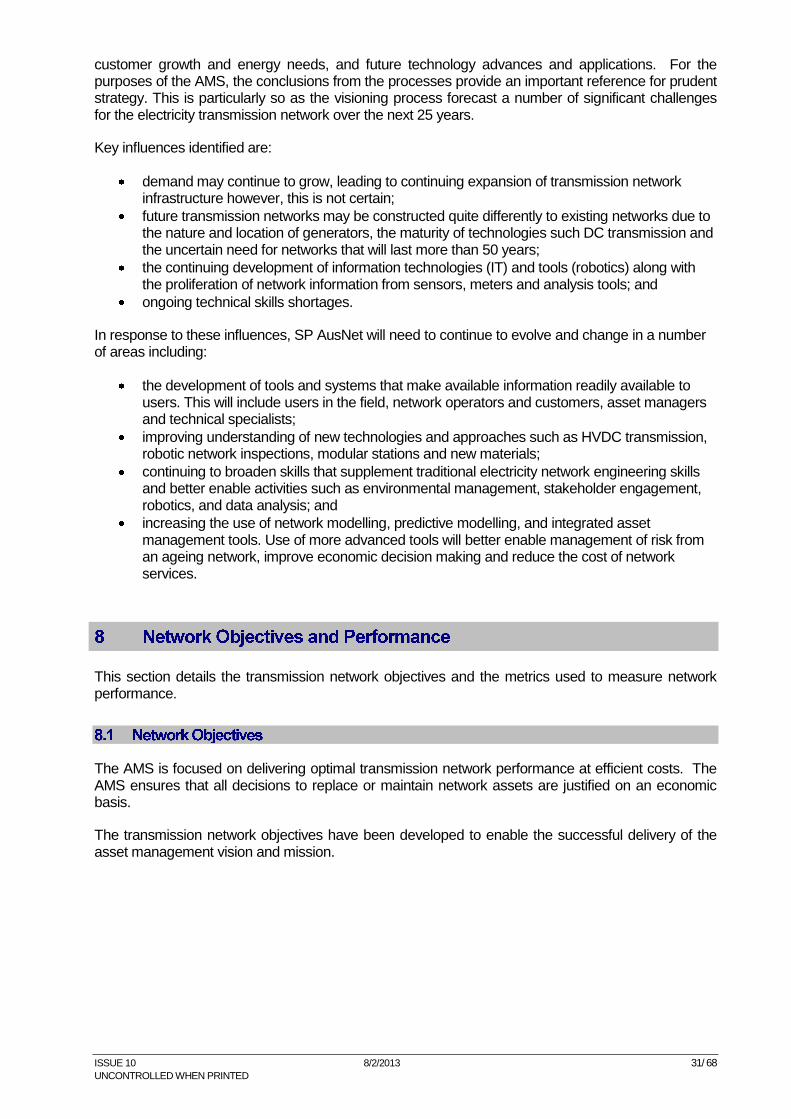
The network objectives are detailed in Error! Reference source not found..
Network Objective Drivers Targets Strategic Alignment
1. Improve safety
Public Safety
Harm - Asset Failure
Equipment Access
Zero Conductor Drops (ESV expectation)
Zero Explosive Failures
50% of all towers with fall arrests by 2014
Removal of all Accessible asbestos by 2025
Strengthen
Transform
Modernise
Mission Zero
2. Exceed Customer Expectations
Customer expectations
Aging assets
Availability
- STPIS revenue > 41.7% for 2013/4
- MIP < 1,400 generation dispatch intervals
Plant performance
- < 1.15 System minutes
- < 8 major incidents for 2013/14
Strengthen Transform
3. Value for money
Regulatory Reform
Technology Development
Climate Change
Total expected capex by project/category against regulatory allowance
Strengthen Transform
Table 6 - Transmission Network Objectives
This section provides a summary of the performance of the transmission network in terms of STPIS and system incidents.
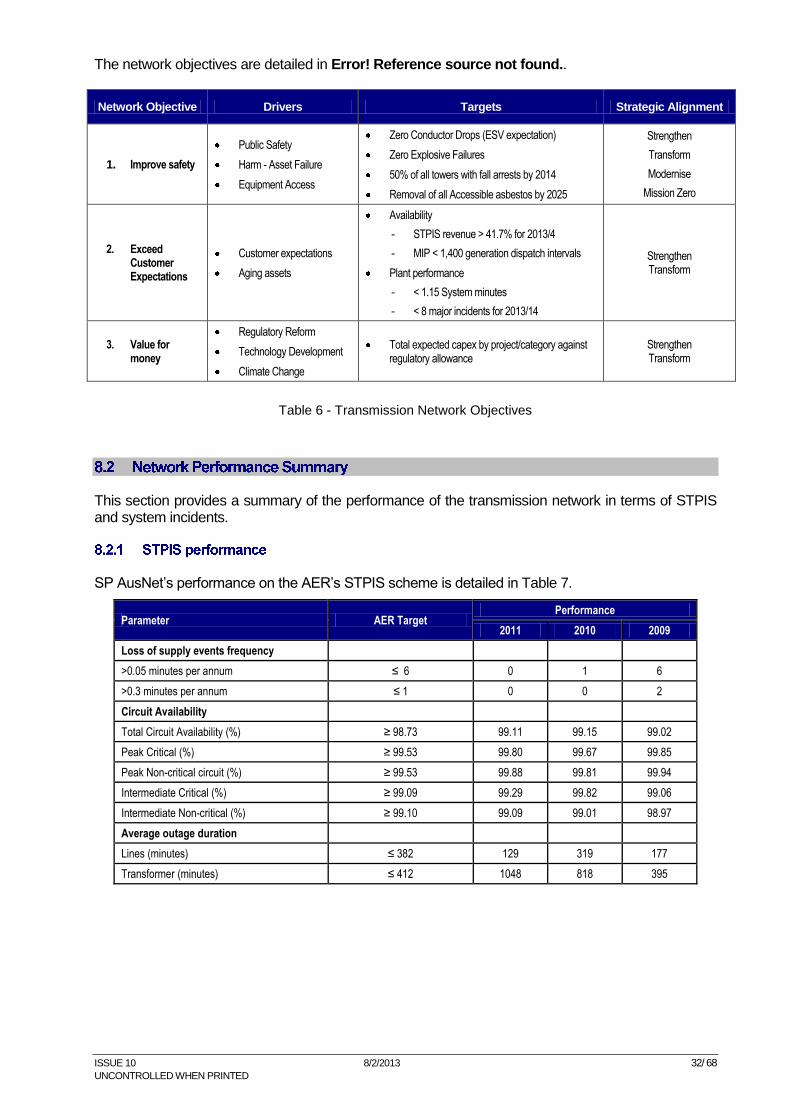
SP AusNet’s performance on the AER’s STPIS scheme is detailed in Table 7.
Parameter AER Target Performance
2011 2010 2009
Loss of supply events frequency
>0.05 minutes per annum ≤ 6 0 1 6
>0.3 minutes per annum ≤ 1 0 0 2
Circuit Availability
Total Circuit Availability (%) ≥ 98.73 99.11 99.15 99.02
Peak Critical (%) ≥ 99.53 99.80 99.67 99.85
Peak Non-critical circuit (%) ≥ 99.53 99.88 99.81 99.94
Intermediate Critical (%) ≥ 99.09 99.29 99.82 99.06
Intermediate Non-critical (%) ≥ 99.10 99.09 99.01 98.97
Average outage duration
Lines (minutes) ≤ 382 129 319 177
Transformer (minutes) ≤ 412 1048 818 395
ISSUE 10 8/2/2013 33/ 68
UNCONTROLLED WHEN PRINTED
Table 7 - STIPS Performance History
SP AusNet’s performance on the AER’s MIC scheme is detailed in Table 8.
Parameter AER Target Performance
2011 2010 2009
Market Impact Parameter
Dispatch Intervals (>$10/MWh Marginal change) 869 1573 2088 1439
Table 8 - STIPS Performance History
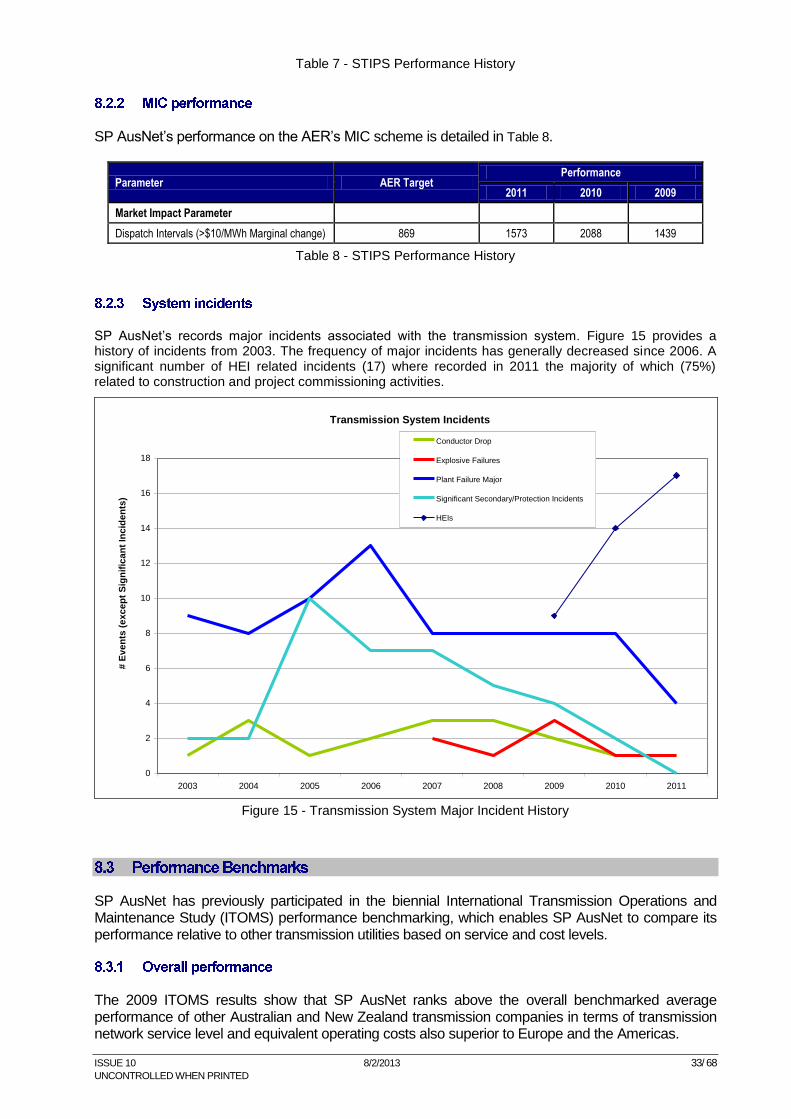
SP AusNet’s records major incidents associated with the transmission system. Figure 15 provides a history of incidents from 2003. The frequency of major incidents has generally decreased since 2006. A significant number of HEI related incidents (17) where recorded in 2011 the majority of which (75%) related to construction and project commissioning activities.
Transmission System Incidents
0
2
4
6
8
10
12
14
16
18
2003 2004 2005 2006 2007 2008 2009 2010 2011
# E
ve
nts
(e
xc
ep
t S
ign
ific
an
t In
cid
en
ts)
Conductor Drop
Explosive Failures
Plant Failure Major
Significant Secondary/Protection Incidents
HEIs
Figure 15 - Transmission System Major Incident History
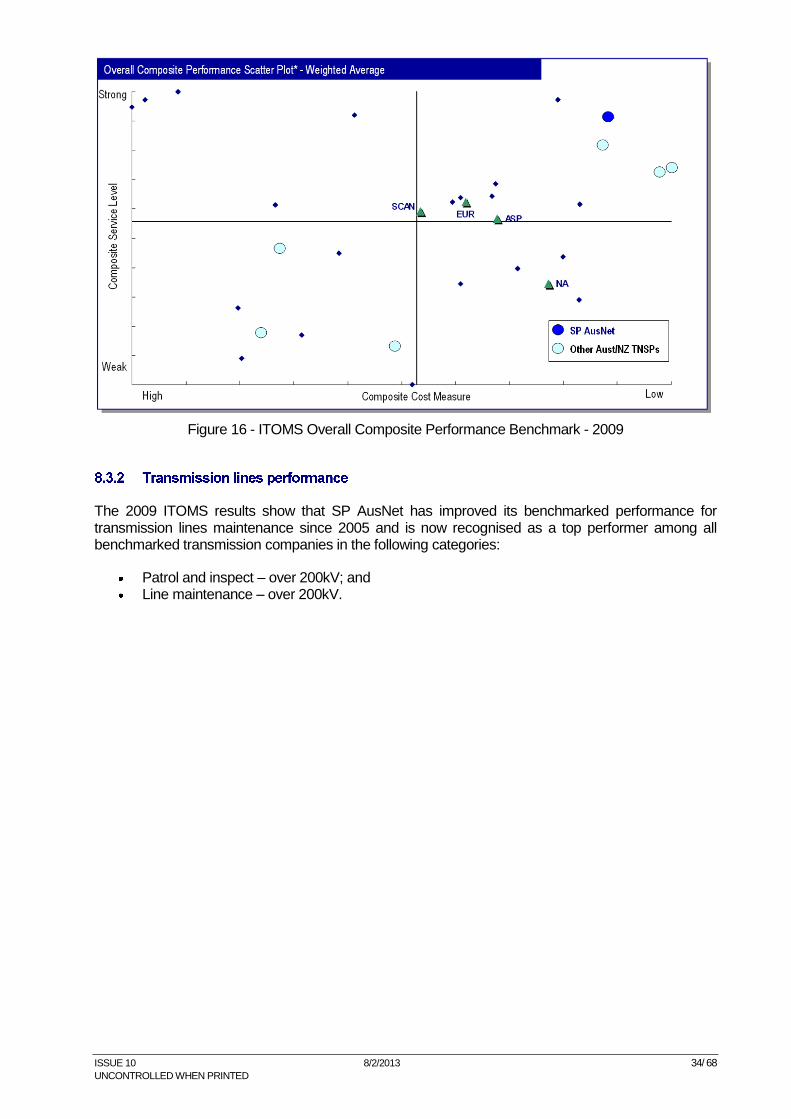
SP AusNet has previously participated in the biennial International Transmission Operations and Maintenance Study (ITOMS) performance benchmarking, which enables SP AusNet to compare its performance relative to other transmission utilities based on service and cost levels.
The 2009 ITOMS results show that SP AusNet ranks above the overall benchmarked average performance of other Australian and New Zealand transmission companies in terms of transmission network service level and equivalent operating costs also superior to Europe and the Americas.
ISSUE 10 8/2/2013 34/ 68
UNCONTROLLED WHEN PRINTED
Figure 16 - ITOMS Overall Composite Performance Benchmark - 2009
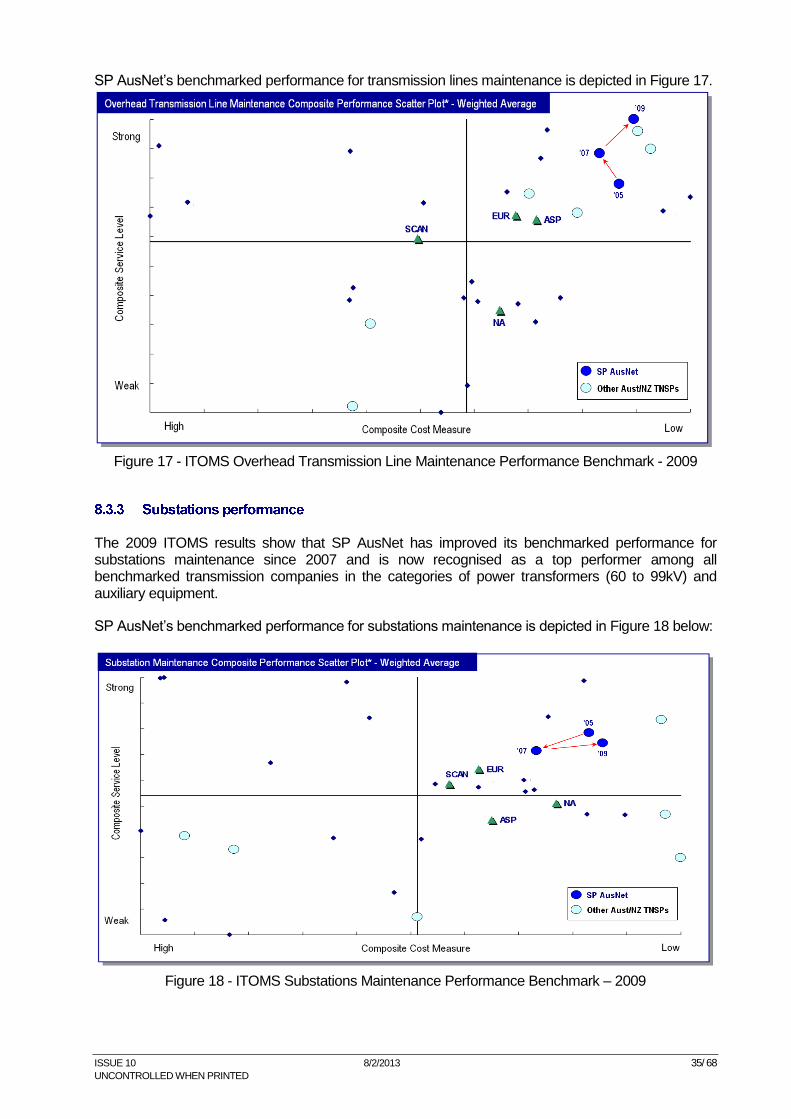
The 2009 ITOMS results show that SP AusNet has improved its benchmarked performance for transmission lines maintenance since 2005 and is now recognised as a top performer among all benchmarked transmission companies in the following categories:
Patrol and inspect – over 200kV; and
Line maintenance – over 200kV.
ISSUE 10 8/2/2013 35/ 68
UNCONTROLLED WHEN PRINTED
SP AusNet’s benchmarked performance for transmission lines maintenance is depicted in Figure 17.
Figure 17 - ITOMS Overhead Transmission Line Maintenance Performance Benchmark - 2009
The 2009 ITOMS results show that SP AusNet has improved its benchmarked performance for substations maintenance since 2007 and is now recognised as a top performer among all benchmarked transmission companies in the categories of power transformers (60 to 99kV) and auxiliary equipment.
SP AusNet’s benchmarked performance for substations maintenance is depicted in Figure 18 below:
Figure 18 - ITOMS Substations Maintenance Performance Benchmark – 2009
ISSUE 10 8/2/2013 36/ 68
UNCONTROLLED WHEN PRINTED
This section of the AMS provides a summary of issues relating to SP AusNet’s processes and systems for the management of transmission assets. These issues are documented in full in the foundation level of resource documents. Each of the following sub-sections details issues and provides a summary of key strategies for their management.
The September 2011 re-certification of electricity transmission asset management practices to British Standard Institute’s Publically Available Specification 55 (PAS 55-1:2008) Asset Management together with the March 2011 certification of the electricity distribution and gas practices completed the alignment of asset management systems across the regulated energy networks.
In concluding the reviews the auditors, said “SP AusNet remains an effective, efficient and competent Asset Manager. It operates an appropriate and effective Asset Management System which is now developing a good level of consistency across electricity transmission, electricity distribution and gas distribution networks under its control”.
The auditors, AMCL Pty Ltd, assessed the maturity of SP AusNet’s asset management practices as “fully effective and are being integrated throughout the business”.
The requirements for PAS 55 in the coming twelve months are to participate in a surveillance audit to be conducted by AMCL Pty Ltd in March 2013.
Development of an international standard for asset management based on BSI PAS 55: 2008 is well advanced with release scheduled for 2014. SP AusNet’s asset management system will be due for re-accreditation around the time of the scheduled ISO 55000 release in March 2014. This may be appropriate timing for a transition from PAS 55 to ISO 55000.
SP AusNet operates a corporate Risk Management Framework11 designed to ISO 31000:2009 “Risk management – Guidelines on principles and implementation of risk management”, to assess a range of business risks under the following categories:
Financial;
Regulatory;
Safety;
Environmental; and
Corporate Image.
By adopting common metrics across the broad range of business risks and investment portfolios, SP AusNet can more effectively manage business risks and optimise network outcomes and objectives.
The risks associated with network assets are quantified through the application of Reliability Centred Maintenance (RCM) techniques. RCM requires the assignment of functions and functional failures to individual network assets. Failure Mode Effect Analysis (FMEA) of historical asset failure data determines typical root causes of functional failures and the effects these causes have on key performance measures including network safety, reliability and availability. Asset condition data collected during scheduled maintenance tasks is used to determine dynamic time based probability of failures and percentage of remaining service potential (RSP) of the asset in that lifecycle phase. RCM models output risk profiles for each asset category which are used to establish optimised maintenance and asset replacement plans.
11
RM 001-2006 Risk Management Framework, 2010, SP AusNet
ISSUE 10 8/2/2013 37/ 68
UNCONTROLLED WHEN PRINTED
A brief summary of each of these processes can be found in section 7.7 and more specific information can be found in the individual plant strategies referenced in section 8.
Key strategies for the management of business and asset risks include:
Continuous development and implementation of systems and processes to monitor and assess network performance and risks;
Maintenance of Emergency Operations Management Plans, the Mutual Aid Plan and Disaster Recovery Plans through SP AusNet’s Integrated Response and Contingency System, SPIRACS12;
Maintain and continue to develop a consistent culture of risk management principles and techniques within the business and industry;
Maintain standardised asset design, installation, operation and maintenance procedures;
Establish contingency and risk mitigation plans where network risks have been identified as unacceptable;
Utilise economic net benefit modelling and program prioritisation techniques; and
Manage risks ‘So far as is practicable’ (SFAIP)
SP AusNet maintains an accepted Electricity Safety Management Scheme (ESMS) as required under the Electricity Safety Act 1998 and in compliance with the Electricity Safety (Management) Regulations 2010. The ESMS forms an outcome based regulatory framework against which ESV maintain regular audits to monitor SP AusNet’s compliance.
In summary the scheme contains information on:
Executive officers responsible for the network;
A description of the location, extent and scope of the scheme;
A formal safety assessment including methodology, hazards identified and measures to reduce those hazards;
A description of the management scheme including content, responsibilities, formal policy, technical standards applied and an asset management plan detailing the change management process;
A system authorising access to the network and preventing access by unauthorised persons;
Emergency preparedness plans;
Monitoring, auditing and reviewing processes;
Key Performance Indicators;
Incident reporting and investigation processes;
Competence and training;
Record keeping; and
Reporting procedures for serious incidents.
Further information can be found in ESMS 10-03 Safety Management System.
The SP AusNet safety vision is:
12
30-4006 SP AusNet’s Integrated Response and Contingency System
ISSUE 10 8/2/2013 38/ 68
UNCONTROLLED WHEN PRINTED
“Safety is our way of life. Protect and respect our people and community. Together we must achieve missionZero”
The SP AusNet health and safety management system complies with the Occupational Health and Safety Act (2004) and fulfils the requirements of AS/NZS 4801 Occupational Health and Safety Management Systems by enabling a framework to manage health and safety across our business. The primary aim of the health and safety management system is to establish an integrated, sustained and systematic approach to safety management in all areas of our activities. The strategy for managing health and safety over the next five years is:
Through the setting of objectives and targets, and the incorporation of continuous improvement processes the Health and Safety Management System will be reviewed, and shaped for the future.
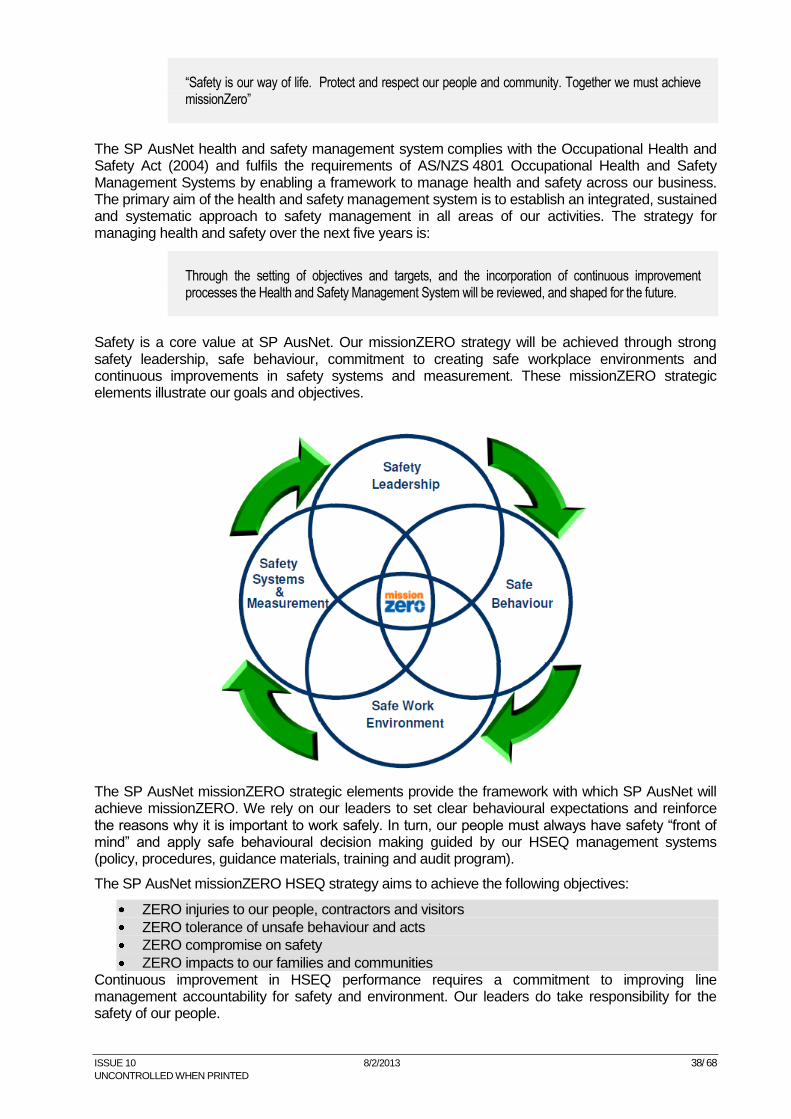
Safety is a core value at SP AusNet. Our missionZERO strategy will be achieved through strong safety leadership, safe behaviour, commitment to creating safe workplace environments and continuous improvements in safety systems and measurement. These missionZERO strategic elements illustrate our goals and objectives.
The SP AusNet missionZERO strategic elements provide the framework with which SP AusNet will achieve missionZERO. We rely on our leaders to set clear behavioural expectations and reinforce the reasons why it is important to work safely. In turn, our people must always have safety “front of mind” and apply safe behavioural decision making guided by our HSEQ management systems (policy, procedures, guidance materials, training and audit program).
The SP AusNet missionZERO HSEQ strategy aims to achieve the following objectives:
ZERO injuries to our people, contractors and visitors
ZERO tolerance of unsafe behaviour and acts
ZERO compromise on safety
ZERO impacts to our families and communities Continuous improvement in HSEQ performance requires a commitment to improving line management accountability for safety and environment. Our leaders do take responsibility for the safety of our people.
ISSUE 10 8/2/2013 39/ 68
UNCONTROLLED WHEN PRINTED
The SP AusNet HSEQ plan has been developed in consultation with the executive and forms the basis of the SP AusNet vision and applies to all SP AusNet operations. Further information can be found in the Health, Safety, Environment and Quality (HSEQ) plan 2012-2013.
For further information please refer to AMS 10-15 Health and Safety Management.
SP AusNet is committed to being an innovative leader in the management of environmental issues associated with energy delivery infrastructure for gas and electricity networks in Victoria. In accordance with the core values of SP AusNet’s Environmental Policy, the following programs have been identified as key environmental outcomes to be achieved:
Oil spill risk to be mitigated;
Asbestos risk to be reduced by 2025;
Noise abatement at Terminal Stations to be managed.
Network electrical losses to be reduced; and
Minimisation of SF6 release to atmosphere
Success of the above initiatives can be reflected in achievement of SP AusNet’s corporate target of zero environmental compliance notices.
Strategies include:
Management of oil discharge:
o Bunding of all plant >1000 litres;
o Bunding of plant <1000 litres where environmental risk evident;
o Regular inspection and maintenance of plant;
o Remote monitoring and alarm of selected bunded installations;
o Reporting and monitoring of oil spills;
o Maintenance of oil clean-up and mitigation procedures and training;
o Investigation into the use of bio gradable vegetable oils for transformer insulation; and
Management of asbestos containing materials where practicable:
o Enhancement of the asbestos register;
o Planned removal of asbestos, particularly during terminal station augmentation;
o Removal of friable asbestos containing materials;
o Maintenance of asbestos handling procedures and training;
Noise abatement:
o Monitor noise levels of ‘noisy’ stations;
o Selection of plant with low noise characteristics;
o Maintain existing land buffers around stations;
Greenhouse gas reduction:
o Monitor and implement where practicable, alternatives to and minimisation of atmospheric release of SF6;
Vegetation management:
ISSUE 10 8/2/2013 40/ 68
UNCONTROLLED WHEN PRINTED
o Compliance with regulations, codes and guidelines, including annual submission of a Vegetation Management Plan to the ESV for approval;
o Maintenance of vegetation management systems and training;
o Participation and consultation with community forums and stakeholders groups;
o Establishment of sustainable vegetation practices within easements;
o Communication to stakeholders of suitable vegetation species within easements.
For further information please refer to AMS 10-14 Environmental Management.
SP AusNet utilises online and off-line condition monitoring (CM) techniques to continuously improve levels of network reliability and safety. The asset condition information is critical for the optimisation of maintenance plans and prioritisation of asset replacement programs.
SP AusNet has successfully introduced portable RF scanning techniques to reduce safety risks associated with explosive failure of primary plant equipment. Further safety and reliability improvements have been achieved through the use of multiple non-invasive scanning technologies for annual inspections of stations plant. Furthermore SP AusNet has developed a leading edge technology for condition assessment of transmission line conductor and associated hardware using aerial survey and automated image processing. This technology supports the development of risk based asset replacement programs for the ageing transmission line conductor fleet.
SP AusNet is committed to further development of condition monitoring techniques including the enhancement of recently adopted technologies and through close monitoring of emerging technologies.
Key Strategies:
Continue to provide asset condition data and early warnings using CM techniques.
Deploy and enhance the CM technologies recently developed to exploit their full potential.
Develop new CM techniques and devices for non-invasive scanning technologies. Develop inspection methods which are cost efficient but provide early warning.
Extend the use of Particle Discharge scanning technologies in terminal stations and include in condition monitoring analysis.
Continue and build collaboration with educational and research organisation to develop innovative CM techniques by supporting applied research work and leveraging other Research and Development (R&D) funding available.
For further information please refer to AMS 10-13 Condition Monitoring.
SP AusNet asset maintenance strategies ensure the safe and reliable operation of the transmission network assets. The asset maintenance strategies are developed using engineering best practice, incorporating manufacturer recommendations, and are in accordance with ESV guidelines. SP AusNet’s maintenance strategies are reflected in the Electrical Safety Management System which has been accepted by ESV.
SP AusNet maintenance programs are primarily managed via MAXIMO, a Computerised Maintenance Management Systems (CMMS). Predominantly, the asset maintenance plan is enacted based on a recurrent nature, and is categorised into scheduled maintenance (OMS), corrective unscheduled maintenance (OMU) and emergency maintenance (OME) tasks.
ISSUE 10 8/2/2013 41/ 68
UNCONTROLLED WHEN PRINTED
The highest volume of tasks completed as part of asset maintenance plan are scheduled maintenance tasks which involve time based inspection, or overhauls of network assets. During these tasks condition based data is collected to allow for predictive corrective maintenance to be carried out. Issues or defects identified through asset inspection, or overhaul process are rectified as corrective maintenance tasks within predefined timeframes, depending on the level risk associated with the defect. Corrective maintenance can also involve investigation and resolution of equipment monitoring alarms received via the SCADA system. Emergency maintenance tasks require urgent attention and are usually triggered by fault events which adversely affect the overall availability of the transmission network.
SP AusNet also manages a program of Non-recurrent maintenance works. These works include tasks that do not meet the financial criteria for capitalisation, and have work scopes that are too large or specialised to be included in the normal maintenance plan (for recurrent works). They are not time or operation based and are generally non-repetitive, one-off projects or programs put in place to address specific problems. Examples include tower-corrosion mitigation works.
Reliability Centred Maintenance (RCM) techniques have been used to develop plant asset replacement models. Scheduled maintenance intervals and work instruction steps can be optimised through the application of RCM methodologies. The effectiveness of RCM based maintenance plans depends upon the quality of asset failure and condition data collected during inspection tasks. This requirement has identified the need for improvements in order to progress the efficiency and effectiveness of current plant and equipment maintenance strategies. SP AusNet has introduced the initial stages of predictive based maintenance through the use of condition monitoring techniques.
Key Strategies:
Continue to shift towards predictive based maintenance and condition monitoring technologies where possible.
Use RCM methodologies to review the efficiency of maintenance inspection frequencies and maintenance work instruction steps. Use RCM models to demonstrate the benefit of RCM based inspection programmes
Continue to influence network design ensuring that maintainability is a key consideration when selecting assets and determining site or station layouts
Consolidate maintenance tasks where economic with a focus on reduction of maintenance re work and travel time.
Ensure that, where economic, new assets have built-in condition monitoring and self-testing facilities.
Progressively refine the use of handheld devices to enable field personnel to more easily collate asset failure and condition data. Ensure that data captured during maintenance tasks supports the implementation of RCM techniques.
Periodically review spare equipment and ensure appropriate stocks are held at strategic locations to support both scheduled and unscheduled maintenance.
For further information please refer to AMS 10-19 Plant and Equipment Maintenance.
SP AusNet’s main asset management information systems are MAXIMO for asset and work management, TRESIS for relay settings, Ratings Database Repository (RADAR) for plant and equipment ratings and Field Mobile Inspection (FMI) for recording asset inspections.
The progressive development of asset management information systems is coordinated by the Enterprise Asset Management (EAM) program within the Business Systems Asset Management Strategy.
The key drivers of improvement in information systems are:
ISSUE 10 8/2/2013 42/ 68
UNCONTROLLED WHEN PRINTED
Improving data quality for informed operation and strategic decision making
Increasing costs of supporting disparate, customised, non-interfaced systems
High risks associated with reliance on the ‘local knowledge’ of a mature-aged workforce
Repeatable, transparent and auditable processes to assure compliance to regulatory and safety obligations
Replacement of obsolete legacy systems
Key development strategies include:
Consider the requirements of the EAM and provide support for Project Workout.
Extend the electronic collection of data via mobile computing devices and automatic links between MAXIMO and SCADA.
Determine data that is used by more than one system e.g. GIS and EAM and determine which system is going to be the owner of that data and the source of truth for that data.
Progressively implement the Enterprise Asset Management program to form a single authoritative asset and inventory register incorporating works management, and logistics management which includes:
Consolidation of asset data from disparate systems within MAXIMO
De-commission disparate systems
Have common processes across the business for the same functions across the asset life cycle.
As necessary, establish links from MAXIMO to other systems to facilitate automatic updates
Establish web browser architecture to facilitate remote access by authorised stakeholders to view information and reports.
Implement a flexible reporting capability that caters for routine and ad hoc requests from stakeholders.
Ensure that there are appropriate data security and data recovery plans in place.
Develop the presentation of EAM data in a GIS view so geography, topology and environmental factors can be combined with but not limited to asset or condition data and details of work completed or planned.
For further information please refer to AMS 10-10 Asset Management Information Systems.
The effectiveness of SP AusNet’s asset management policies and practices is measured directly by the performance of high-voltage network elements and its impact on the availability and reliability of the transmission system that it operates within. The development of these policies requires the reliable capture of accurate data, effective decision support tools for trending and analysis, and comparison with externally benchmarked performance standards.
The vision for network performance management is to raise the data collection and analysis process to a level that will maximise our return on investment during the next regulatory period.
Key Strategies:
Enhance the IT system used to calculate the measures for the AER Service Target Performance Incentive Scheme (STPIS) including MIP.
Develop the ability to model outcomes of ‘what if’ scenarios for forecasts about the impact of capital works required to connect new generator or distribution business needs and SPA’s asset replacement programs.
Develop the System Incident Report (SIR) system such that the data it provides can be more readily used to trend asset performance and extracted for benchmarking purposes.
Build improved functionality into the asset management systems for Network Performance measures through the upgrade of MAXIMO to a new Enterprise Asset Management System.
ISSUE 10 8/2/2013 43/ 68
UNCONTROLLED WHEN PRINTED
Build a robust data capture system for the various network transmission operations and maintenance benchmarking studies in which SP AusNet regularly participates.
Develop performance benchmarks for specific plant types and compare them with international rating systems such as used by the International Council for Large Electrical Systems (CIGRE).
Undertake performance analysis on power transformers, circuit breakers and isolators
For further information please refer to AMS 10-17 Network Performance Monitoring.
The operation of the overall system and of individual assets is a key part of asset management to ensure that system performance targets are achieved, the integrity of the assets is not compromised, and safety and environmental requirements are met.
Current sites have different information sent back and in differing formats together with overlap in responsibilities for systems and processes that add to the complexity of managing the transmission network.
An over-riding principle is to ensure that operational staff have access to systems that can provide them with relevant information in a format that assists them to make timely and accurate decisions.
The following strategies will provide improved operation of the network:
Maximise asset utilisation with the support of control schemes and support systems such as System Overload Control Scheme (SOCS), RADAR and Overload Shedding Scheme for Connection Assets (OSSCA).
Optimise the timing of planned asset outages with the support of systems such as POMS and MAXIMO.
Utilise proactive and real-time condition monitoring of assets.
Provide rapid fault response with the assistance of SCADA and real-time fault analysis.
Record and analyse fault events using the SIR and Defective Apparatus Report (DAR) processes.
Audit the short circuit ratings of primary plant in stations that are operating at or close to the designed rating.
For further information please refer to AMS 10-18 Operations Management.
SP AusNet has implemented a Program Lifecycle Model that sets out the process for managing programs and projects from conception, through the planning, business case approval, release, delivery and close out phases. The Program Delivery group provides management and resources to deliver the SP AusNet maintenance and capital works programs relating to network assets. More specifically the project lifecycle is supported by the following life cycle work instructions:
SOP 18-51 ELECTRICITY NETWORKS
SOP 18-53 PMO
SOP 18-54 CUSTOMER CAPEX PROJECTS
SOP 18-56 PROJECT SPONSOR
SOP 18-57 SI & SP PROGRAMS
SOP 18-66 SUPPLY IMPROVEMENT & SUMMER PREPAREDNESS Projects
The resource model includes the use of internal and external resources in the delivery of maintenance and capital works programs. Specific role descriptions are defined by:
SOP 15-09 Role Description - Project Initiator
ISSUE 10 8/2/2013 44/ 68
UNCONTROLLED WHEN PRINTED
SOP 15-10 Role Description - Project Estimation & Design
SOP 15-11 Role Description - Project Manager
SOP 15-12 Role Description - Project Sponsor
SP AusNet has formed Strategic Alliances with companies that provide design services, installation services and maintenance services. Contract arrangements are performance based with benchmarking of costs and standards to ensure that quality and value is maintained throughout the contract.
Strategies for program delivery and optimisation are:
Maintain key internal resources within the Program Delivery area to ensure that strategic works and program control services can be sustained;
Assess the synergies between the transmission and electricity distribution businesses with respect to resource planning by considering the common and similar skill areas;
Plan maintenance and capital works to ensure the efficient use of resources, the maximisation of network availability and the reduction of risks to supply security;
Provide program management resources on a functional basis, covering project control, estimation, engineering standards and field technical services;
Use unified systems which link the core project activities of planning, estimation and costing. Use the Constructability, Operability and Maintainability review process to test and confirm the appropriateness of technical decision making at key stages in the development and execution of major network augmentation, refurbishment and replacement projects;
Conduct internal Post Implementation Reviews of all projects, with key projects undergoing these reviews by independent, external consultants;
Use the zone substation design guide and the pre-qualified design service providers to ensure that engineering and quality standards are maintained;
Maintain construction resources within SP AusNet to ensure that key strategic projects can be delivered to the required schedule; and
Control and supervise all site works through the field service areas to ensure safety, network security and quality of workmanship.
In deciding between the replacement and refurbishment of assets, a range of asset management options are identified and evaluated, utility practices analysed and supporting arguments developed. Primary requirements for any replacement or refurbishment decision are a well-defined asset management strategy, a sound knowledge of asset condition and related factors affecting performance and expected technical life. SP AusNet plant maintenance strategies and their supporting asset risk models provide guidance on optimal asset management approaches for different asset classes operating on the transmission network.
Key Strategies:
Broaden and enhance the use of online condition monitoring tools and techniques to uniformly gather, analyse and rank condition assessment data for major assets including power transformers, transmission lines and circuit breakers.
Broaden and enhance the use of asset risk models to optimise the volume and timing of asset renewal programs.
Use asset risk models to determine the optimal asset management strategies for different asset classes’ specifically supporting decisions around the adoption of “run to failure” or “risk based replacement” strategies.
Refine the process used to manage ongoing changes to the selected portfolio to ensure that the business is continually resourcing the most optimal set of capital projects.
For further information please refer to AMS 10-11 Asset Replacement and Refurbishment.
ISSUE 10 8/2/2013 45/ 68
UNCONTROLLED WHEN PRINTED
Process and configuration management includes:
The standardisation of design, hardware and the configuration of protection and substation automation system.
Database management – consolidation of secondary systems data, firmware and the configuration in accessible engineering data bases.
Power system protection, control and monitoring - development of protocols for the application of standard designs, the implementation of settings and the testing of secondary devices.
Key strategies include:
Complete repeatable configuration templates for two alternative System Control and Information Management Systems (SCIMS).
Complete the development of standard bay cubicles and interfaces for typical high-voltage circuit bays in terminal stations.
Reduce the number of communication protocols used between SCIMS and IEDs.
Identify the data and relevant ports of IEDs that are accessed remotely for engineering purposes.
Implement IEC 61850 in terminal station refurbishment projects.
Develop a philosophy for Local Area Network (LAN) based engineering access to IED data (possibly using the IEC1850 standard) and implement where available.
Develop support tools for monitoring and disturbance analysis in order to maximise the benefits of a quick and accurate assessment of system conditions.
Adapt station configuration to support the introduction of ‘station to station to control centre’ network communication based on international standards.
For further information please refer to AMS 10-20 Process and Configuration Management.
The establishment of robust knowledge management systems, processes and culture is pivotal to the achievement of network performance targets, optimised life-cycle costs and a sustainable risk profile.
Knowledge and record management includes the maintenance of accurate records of asset types and locations, condition assessments from periodic inspections, risk-based testing programs and automated online condition monitoring systems.
It also includes the real-time acquisition and management of data regarding network operating parameters and event circumstances. This data will facilitate confident, safe and reliable operation of the network, the modelling of future scenarios and the forecasting of performance.
Knowledge and record management extends to include the transfer of intellectual property and informal knowledge through training and mentoring programs.
Key strategies for knowledge and record management include:
Identify policies and standards that require documentation and prioritise these for implementation.
Refine the Protection and Control Design Guide document.
Realise a compendium of supporting, secondary-system databases that is accurate, easy to use, readily manageable and that matches the applied technology.
Review the requirements of communication system documentation and produce a plan to meet organisational needs.
ISSUE 10 8/2/2013 46/ 68
UNCONTROLLED WHEN PRINTED
Review the requirements of secondary-system documentation and, in conjunction with other organisational IT initiatives, produce a plan to best meet organisational needs.
For further information please refer to AMS 10-16 Knowledge and Record Management.
SP AusNet has significantly increased its focus on ensuring that it is able to attract and retain sufficient skills and resources to deliver works program. This is not only to meet the skills and resource needs for the coming year, but with a focus on the next five year period.
It is acknowledged that the industry is experiencing skills shortages across many engineering specialisations and so targeted strategies and programs are being established and implemented to address these challenges.
Key Strategies for skills and competencies include:
Alignment of school and university programs with industry to ensure a reliable source of appropriately skilled and educated workforce.
Targeted graduate recruitment program, to support talent pipeline and meet future resource needs
Ensure adequate supply of external resources is available, through commercial panel arrangements with engineering service providers
Analyse and monitor the internal and external environments to understand resource supply state, and emerging skill requirements
Annual resource forecasting, and development of resourcing strategies to meet needs
Implemented flexible working practices to attract from broader resource pools, and also to retain highly skilled employees nearing retirement
Embed knowledge management transfer process using established frameworks, to minimise risk and spread critical skills and knowledge across resource groups
Embed competency framework in all facets of asset management capability including rotation programs to broaden experience of senior engineers across the asset base.
Recognition of skills and knowledge to encourage the development of depth in asset management expertise.
Increased visibility of career pathways and
Implement strategies to encourage diversity within workforce participation, resulting in broader resource pools.
For further information please refer to AMS 10-23 Skills and Competencies.
The following sections discuss in more detail the assets, issues and strategies selected to meet future network performance targets and to maintain a sustainable risk profile.
Station auxiliaries include diesel generators, compressed air systems, fire detection and suppression systems, secondary cables, and Direct Current (DC) power supplies and earth grids.
Terminal Station DC Supplies are critical to providing power to all protection, control, metering and SCADA systems. SP AusNet’s transmission network includes more than 240 individual DC power
ISSUE 10 8/2/2013 47/ 68
UNCONTROLLED WHEN PRINTED
supply system’s comprising batteries, battery chargers, DC power distribution switch boards, isolation, wiring and monitoring and alarm equipment. Failure of DC Supplies at a Terminal Station would have serious consequences, rendering a station uncontrollable and without protection The Australian Energy Market Operator’s (AEMO’s) Protection and Control Requirements specify duplicated and physically segregated “X” and “Y” DC batteries and chargers are provided with sufficient capacity to run identified station DC services for up to 10 hours.
In addition clause 5.1 (f) of the Electricity Network Agreement states that:
‘each terminal station must be provided with duplicated secondary Equipment such that no single electrical or mechanical failure or malfunction within the Secondary Equipment prevents that Terminal Station supplying electrical energy from the Transmission Network to Connected Parties up to relevant Ratings’13.
Most stations now have 250 V X and 250 V Y Control batteries and no longer have a 48 V Control battery, but provide the 48 V control supply via duplicated DC-DC converters from the 250 V batteries. Older station designs had separate dedicated single 250 V Control battery and 50 V Control batteries. Almost all stations have now been upgraded to have duplicated 250 V batteries. Separate control and communications batteries are provided to allow for the different rating times between control and protection functions and communication functions, but also segregate communications equipment from transients imposed by the switchyard wiring and equipment.
Batteries are subject to regular maintenance and planned replacement of cells after the expected life. Chargers are replaced on failure or as required by station augmentation. Older distribution and monitoring boards contain asbestos and so present health and safety risks.
DC systems strategies include:
Where economic replace batteries in conjunction with future Terminal Station rebuild projects.
As required replace selected batteries as part of DC Supply Upgrade Stage 3 project (XC84).
Station design is to continue to ensure that battery capacity is sufficient to meet the station load for the required period.
Regularly inspect batteries for terminal corrosion, post growth, electrolyte level, electrolyte leakage, voltage level and cleanliness.
Implement boost charging and equalisation charging in maintenance activities (as recommended by the battery manufacturers).
Periodically review innovations in battery technology for more reliable and economic energy storage options
Establish spare portable 250 V and 48 V batteries for emergency use.
For further information refer to the detailed plant strategy, AMS 10-52 Auxiliary Power Supplies.
Diesel generators provide emergency, auxiliary 415 V AC supply at critical locations (terminal stations and communications sites) in the event of total loss of normal auxiliary supplies.
The majority of diesel generators located at terminal stations are provided for black start capability and those at remote communication sites are required to reduce the risks associated with the loss of critical network communication systems.
There are currently no major issues associated with the management of diesel generators.
Key asset management strategies include:
Continue with the present maintenance and operational practices.
Assess operations and maintenance costs for worst performing diesel generators and replace where economically viable.
Assess economic feasibility of purchasing a spare generator in order to reduce dependence on hiring for planned maintenance and to provide emergency backup for existing generators.
13
Network Agreement between Power Net Victoria and Victorian Power Exchange 1997
ISSUE 10 8/2/2013 48/ 68
UNCONTROLLED WHEN PRINTED
Collate missing diesel generator data as part of future stations survey and upload to MAXIMO.
For further information refer to the AMS 10-58 Diesel Generators detailed plant strategy.
Fire detection and suppression systems are required to minimise asset damage in case of fire. All the terminal stations in SP AusNet’s transmission network are provided with fire detection and suppression systems. Fire suppression has been achieved using different systems such as water deluge systems are installed in nine terminal stations (13% of the power transformer population) and they are of the same age as the transformers they are protecting and majority have been recently assessed as in poor condition.
All terminal stations have fire hydrant systems installed. Most of the fire hydrant systems (54%) have been recently found to be not compliant with the latest Australian fire protection standards and are not in satisfactory condition. A replacement/ upgrade program is in place to address these issues and rationalise the fire hydrant systems, where oil filled equipment is no longer installed in the switchyard. Gaseous fire suppression systems are installed only in three terminal stations. They are installed at Hazelwood Terminal Station (HWTS), Rowville Terminal Station (ROTS) and South Morang Terminal Station (SMTS) and are less than six years old.
Fire suppression systems for power transformers are important as they protect these critical expensive assets in the electricity transmission network and are vital to limit the spread of fire. Fire protection measures for power transformers include bund walls to contain oil spills, fire hydrants, physical separation of transformers from other assets, fire walls between transformers and water deluge systems.
Of the power transformers installed in the terminal stations, all have oil containment bunding and fire hydrants installed. A total of 39% have fire walls, 31% possess the required physical separation and 13% have water deluge systems. A further 17% will have fire protection built during replacement of transformers in future projects. Fire walls have mainly been installed in metro terminal stations.
The strategies to address risks imposed by the fire detection and suppression systems on Victorian transmission terminal stations include:
Continue to regularly inspect and test all fire protection systems in accordance with the relevant Australian Standards (AS1851).
Progressively bring fire hydrant systems up to contemporary Australian standards.
Refurbish / replace poor condition water deluge systems.
Retrofit adequate fire protection measures for spare transformers at HWTS and SMTS.
Replace failing smoke detectors and Fire Indication Panels in Control Buildings. For further information refer to the detailed plant strategy, AMS 10-61 Fire Detection and Suppression.
SP AusNet’s transmission network includes more than 6,000 MVar of capacitors arranged in 89 Shunt Capacitor banks at 28 locations to:
Stabilise the network operating voltage particularly during heavy demand periods
Minimise electrical power losses
Optimise the utilisation of transformers and lines
Harmonic Filters in SVC
ISSUE 10 8/2/2013 49/ 68
UNCONTROLLED WHEN PRINTED
In the period prior to 2003 many capacitor cans containing Polychlorinated Biphenyls (PCB) were replaced and thus the capacitor fleet is relatively young with a mean service age of 18 years. Consistent with the service age profile the condition of capacitor banks is also good with 76% assessed as in very good or good condition, 15% assessed as in average condition and less than 10% in below average condition.
Since 2003 the volume of System Incident Reports (SIRs) and Defective Apparatus Reports (DARs) for capacitor banks have exhibited year to year variation but the long run trend is one of stable performance.
Key strategies for the continuing management of capacitor banks include:
Continue to monitor the performance of capacitor banks.
Replace capacitor cans in selected older banks in the next five years, where worsening performance is evident and subject to appropriate economic evaluations
Continue to hold sufficient spares for capacitor cans to cover in service failures.
Continue with the annual program of thermo-vision testing of capacitor banks. For further information refer to the detailed plant strategy AMS 10-53 Capacitor Banks.
The Victorian electricity transmission network’s population of 1057 circuit breakers maintain the safety, reliability, quality and security of supply from the transmission network.
Planned station rebuild projects integrating the network augmentation needs of the Australian Energy Market Operator and distribution network service providers with asset replacement needs will include the economic replacement of 273 circuit breakers over the period 2012 to 2020. The planning permits for the Richmond and West Melbourne terminal station rebuild projects require replacement of the existing outdoor air insulated switchgear with indoor gas insulated switchgear. These two committed projects comprise one third of circuit breaker replacements in the planning period.
In addition, 18 individual circuit breakers that are classified as in “very poor” condition (C5) will be replaced in situ in specific like-for-like projects.
The sum of planned replacements will reduce the average service age from 22 years in 2012 to 18 years in 2020. Key strategies in the planned renewal program, which is focussed on managing a large volume of existing “poor” condition (C4) units which will move to “very poor” (C5) condition through the planning period include:
Replace the 12 remaining air blast circuit breakers by 2014
Replace 30 ASEA HLR and S&S 514/4 minimum oil type circuit breakers by 2020
Replace 45 GEC/AEI JW419 and JW420 bulk oil type circuit breakers by 2020
Refurbish 56 SF6 live tank circuit breakers by 2020.
Replace 216 circuit breakers (220kV and 66 kV) with SF6 dead tank circuit breakers by 2020
For further information please refer to the detailed plant strategy, AMS 10-54 Circuit Breakers.
Assets within the classification of civil infrastructure include buildings, roads, surfaced areas, foundations, support structures, cable ducting, drains, fences, and water and sewerage pipes. Some of the key assets contained within the civil infrastructure classification include:
216 buildings situated at terminal stations and communications sites.
Approximately 42 kilometres of roads and including drainage pipes
Approximately 133 hectares of switchyard surfacing
ISSUE 10 8/2/2013 50/ 68
UNCONTROLLED WHEN PRINTED
More than 17km of secondary cable trenches housing more than 6000 km of cable
Water pipe networks feeding fire hydrants, transformer deluge systems and domestic water supply.
Numerous structures, earth embankments and retainer walls supporting various plant items in terminal stations and communications sites.
Approximately 56 kilometres of security fencing
Oil containment and treatment systems operating at all terminal stations
Considerable replacements of civil infrastructure assets are included in scopes for the major rebuilds proposed at RTS, BTS and WMTS. The RTS rebuild will result in the replacement of the existing drainage systems, oil containment systems, transformer racks and 220 kV landing racks. Rebuild works at BTS will incorporate the removal of existing unused buildings and the replacement of the existing drainage system, roadways and oil containment systems. New control rooms will be installed at WMTS including replacements of oil containment systems, drainage systems and minor roadways.
The principle asset management strategies are:
Perform audits of civil infrastructure assets focusing on the collation of key data such as asset condition, quantity and installation date. Data collected will be uploaded to MAXIMO
Complete all stages of the terminal station asbestos removal program involving the removal of all identified asbestos hazards by 2025.
Include in the scope of major augmentation or station re-build projects allowance for the renewal, replacement or augmentation of significant civil infrastructure, as required.
Complete the remaining stages of critical water pipework replacement program by 2020
Consider the use of relocatable buildings for new or major building refurbishments
Complete final stage of oil containment and treatment upgrade works by March 2015
Please refer to the following documents for further information: AMS 10-14 Environmental Management AMS 10-15 Health and Safety Management AMS 10-55 Civil Infrastructure AMS 10-63 Infrastructure Security
SP AusNet maintains and operates communication infrastructure and equipment at more than 110 sites primarily to provide:
Electrical protection signalling between generating stations and terminal stations
Electrical protection signalling between terminal stations and other terminal stations
Monitoring and control signalling between SP AusNet’s Customer and Energy Operations Team (CEOT), generators, terminal stations, and AEMO
Operational voice and business communication between NOC, offices, depots, terminal stations, generating stations, distribution zone substations, connected interstate transmission and generating stations and AEMO.
The communication system includes more than 350 communication bearers that transport communication services, including approximately 2100 km of fibre-optic cables, 112 km of copper supervisory cable, 54 point-to-point radio links and 55 power line carrier systems. Optical Fibre in Ground Wire (OPGW) technology, installed on transmission EHV towers, makes up the majority of fibre optic cable between operational sites, and is the preferred communications bearer technology due to its reliability, capability and long asset life. No OPGW cable is expected to require replacement in the next 10 years. Current OPGW cable is projected to be serviceable for at least 35 years.
ISSUE 10 8/2/2013 51/ 68
UNCONTROLLED WHEN PRINTED
ADSS fibre optic cables were first utilised for electricity transmission communications in approximately 1990, with a large percentage of the current population having already reached or surpassed their expected life of 18-20 years. The cables have been subject to regular accidental damage due to their location on electricity distribution poles within high road traffic areas. The repair of ADSS cables over time has resulted in an excessive number of fibre joins, impacting the optical performance of the cable.
A large proportion of copper supervisory cables have been in service for over 40 years and are exhibiting signs of increasing (insulation) failure. Many Latrobe Valley services still utilise point-to-point copper circuits between sites, and have been subject to regular failure due to water ingress and insulation breakdown. Repair has become increasingly difficult as spares and alternative circuits become limited, increasing the likelihood of extended service outage times. Recently approved OPGW/fibre replacement projects for Latrobe Valley sites will see the majority of copper supervisory cable services transferred to more reliable equivalents.
The use of Power Line Carrier (PLC) on EHV transmission lines has been progressively diminishing in the last 10 years as OPGW cable and (high-bandwidth) radio roll-outs have enabled replacement with suitable digital telecommunications equivalents. This is largely due to technical obsolescence of analogue PLC technology to deliver the (regulatory) performance, redundancy and bandwidth. Point-to-point radio systems have seen a gradual migration from Plesionchronous Digital Hierarchy (PDH) technology, with recent upgrades incorporating greater bandwidth requirements and enabling technology synchronisation (with other network elements) through the use of Synchronous Digital Hierarchy (SDH) and native Ethernet radio capability. Remaining PDH and non-Ethernet capable radios are expected to require replacement within the next 5 years, enabling redundant routes for telecommunications network elements and related services.
Extension of the point-to-point radio network is expected at interstate transmission network interconnects to provide improved resiliency/redundancy of current PLC technology at between those locations.
The current SDH network population is broken into three vendor products, with two of these vendor platforms (Nokia and Siemens - approximately 50% of the network) at end-of-life and being serviced by internal spares holdings. Wholesale replacement of these elements will be required in the next 2-3 years. The currently available SDH platform (Ericsson) is still supported by the vendor, but given the asset age profile, is anticipated to require replacement in 5-6 years.
Wave Division Multiplexer (WDM) technology continues to be utilised for leveraging optical distance and channel/fibre capacity limitations, and both vendor products in the network still provided and supported by the vendors. Some current WDM technology is anticipated to require replacement in approximately 5-6 years, with the possibility of functionality being integrated in some future SDH replacement platforms.
Packet based network technology (e.g. Asset Data Gathering network) typically requires ongoing firmware/software (“patch”) support from vendors to assist in maintaining cyber security integrity over time. Its life is therefore largely based on the ability/willingness of vendors to provide ongoing support. Typical packet based (networking) technology life-cycles are in the 5-7 year range. A large percentage of the Asset Data Gathering network is expected to require replacement in the next 5 years, including routers, switches and serial server devices, based on known end-of-support announcements or projected life estimates.
The current Operational Telephone Network (OTN) and associated control room console system were originally installed over the 2004-05 period. A majority of the OTN PBX exchanges are based on digital ISDN/QSIG technology, which is rapidly being overtaken by voice-over-IP (VoIP) equivalent technologies. The network is expected to require upgrade/replacement within the next 5 years. The analogue telecommunications channel voice frequency (VF) and teleprotection systems are end-of-life as telecommunications technology and channel devices transition to digital channel technology. The VF system replacement program is in the final phases and is targeted for completion by 2014. The only remaining VF (analogue) based channel systems will be associated with power line carrier based bearers, which will transition with the digitisation of those routes.
ISSUE 10 8/2/2013 52/ 68
UNCONTROLLED WHEN PRINTED
Other supporting communications infrastructure includes Radio Towers, DC battery systems and air conditioning. Dedicated communication (radio) sites, buildings and antenna structures are generally in good physical condition. Some sites are anticipated to require physical security hardening given their remote nature and lack of modern key access and site monitoring. Over the next 10 years, approximately 70% of communications DC battery systems are expected to require replacement either due to degradation/end-of-design life or requirement to meet increased charge capacities for equipment uptimes.
Modern telecommunications technology housed within dedicated communications room/buildings is typically rated up to a maximum temperature of 50 to 55° C, requiring fan-forced cooling and air conditioning systems to maintain optimal operating temperature. Some associated air conditioning systems are expected to require replacement within 5 years due to both age and cooling
The following is a list of investment drivers for plant:
Compliance with regulatory and performance requirements outline in the National Electricity Rules (NER) and the AEMO Standard for Power Systems Data Communications;
Availability and survivability of mission critical communications services, including during transient electricity network conditions and/or maintenance/repair works;
Physical security of remote location radio sites;
Supportability of equipment to enable effective communications network augmentation, maintenance and cyber security features.
Increasing demands for digital communications bandwidth and Ethernet/IP capability as both operational and business systems applications grow and evolve.
End-to-end timing performance of mission critical protection and control signals such that operational schemes effectively operate within constraints of plant and electricity system requirements.
Safety of personnel at radio communications sites including radio tower climbing and radio antenna/dish frequency emissions.
In consideration of the investment drivers mentioned above, including availability and performance requirements, technology lifecycle management, physical and cyber security and safety, key strategies include:
Establish risk profiles for communications bearers/channels based on NER requirements, electricity network constraints and performance incentives;
Establish 2nd and/or 3rd (independent) communications bearer to selected high risk EHV transmission sites where economic;
Consider the use and applicability of new leased and/or 3rd party services/bearers to mitigate network risk where in-house solutions are not economic.
Install OPGW fibre on new EHV line builds or refurbishments;
Maintain and/or replace existing ADSS based on end-of-life and/or physical/optical condition degradation when economic;
Complete migration of services from copper supervisory cables in Latrobe Valley, and de-commission and/or transfer ownership of cables;
Migrate fast digital tele-protection, SCADA and operational voice services from traditional PLC equipment functions to fibre (e.g. OPGW) and/or microwave radio bearers.
Consider the feasibility of modern PLC technology as an alternate communications channel route to fibre (e.g. OPGW) and/or microwave radio to address operational risk and/or regulatory requirements.
Upgrade end-of-life radio links to enable both native synchronous (TDM) and packet based (IP) communications traffic where economic.
Evaluate existing and future communications network application services, and roadmap according to requirements and capability in “next generation” architecture;
ISSUE 10 8/2/2013 53/ 68
UNCONTROLLED WHEN PRINTED
Establish “next generation” operational communications architecture standard to economically transport both synchronous and IP/Ethernet optical and electrical services, in line with core requirements;
Establish highly available substation operational Local Area Network (LAN) architecture standard, in line with existing and future requirements (e.g. IEC61850);
Upgrade Operational Telephone Network at end-of-life with economic next generation architecture, in line with NER requirements;
Upgrade CEOT control room console system to next generation equivalent, maximising economic multi-service, multi-site call management capability and integration to supporting information systems;
Complete migration of VF based signalling to digital equivalents where digital bearers technology is available (i.e. non-PLC);
Establish new station communications cabling and interfacing standard to best incorporate optical fibre interfacing, in line with economic industry practices and Australian Standards;
Establish optical fibre safety practices and guidelines in line with AS/NZS IEC 60825
Upgrade radio tower fall arrest systems to meet occupational health and safety standards;
Establish standards to manage antenna site radiation hazard records in line with best practice and ACMA/ARPANSA occupational health and safety requirements;
Bush fire-harden mountain top communications sites in line with risk assessment and established standard
Establish standard processes in line with economic ITIL practices and operational requirements;
Establish systems, processes and practices that enable a “single source of truth” for communications information and data;
Where economic consolidate various vendor Telecommunications Network/Element Management Systems, utilising virtualised server infrastructure;
Establish authentication, authorisation and accounting (AAA) architecture for telecommunications elements and NMS systems in line with enterprise IT standards;
Evaluate current security practices for IED and operational (LAN) devices in line with industry (e.g. NERC CIP, TISN) and enterprise information security standards and policies;
For further information please refer to AMS 10-56 Communication Systems.
SP AusNet has approximately 2,684 disconnectors and 1,637 earth switches installed on the Victorian electricity transmission network. Forty-one per cent of disconnectors on SP AusNet’s transmission network have provided over 40 years of service, which is significantly higher than the 5% to 20% average for other transmission network service providers.
As significant proportions of each fleet of disconnectors (33% of ≤ 66 kV, 21% of 220-330 kV and 17% of 500 kV) have been assessed as in C4 (poor condition), disconnector replacement will continue to be a significant component of the scope of circuit breaker and station refurbishment projects through the planning period. Design defects in the 220 kV ABB DBRP disconnectors and earth switches is generating high manual operating effort with potential occupational health and safety risks, as well as a performance risk of an outage caused by a switch that is unable to be opened. ABB are re-designing certain components for a major refurbishment program which will commence in 2014.
Key asset management strategies for Disconnectors and Earth Switches include:
Continue infrared surveys of disconnectors with particular attention paid to heavily loaded circuits.
The 66 kV and 220 kV disconnectors, with cap and pin insulators exceeding 40 years in age, are candidates for replacement during station rebuilds.
Replace disconnectors and earth switches if their thermal or short circuit rating is exceeded.

ISSUE 10 8/2/2013 54/ 68
UNCONTROLLED WHEN PRINTED
Where economic, include disconnector replacement in the scope of circuit breaker replacement and station re-build projects.
Install earth switches instead of earth receptacles at 220 kV and above for all future earthing installations.
Fit motorised disconnectors at 220 kV and above for all future disconnector installations.
Start to implement design modifications of the 220 kV ABB DBRP earth switches by 2014.
For further information please refer to the detailed plant strategy, AMS 10-59 Disconectors and Earth Switches.
Earth grids are installed to ensure safety of personnel, to provide a low impedance path for fault currents to protect electrical equipment and to ensure correct operation of the electrical protection schemes.
The earth grids were installed when the terminal station switchyards and communication sites were originally established. They have been progressively augmented as additional plant was installed. The condition of the earth grids can generally be regarded as good.
The ground wires that run above transmission lines were installed at the same time that the lines were constructed. The condition of some of the station ground wires is showing a level of deterioration due to surface corrosion, although testing has shown that they still have an acceptable tensile strength.
Current injection tests are carried out on new earth grids when they are installed. Earth grid current injection tests are also performed every 10 years to check the integrity of the existing terminal station grids. The majority of terminal station earth grids have been checked within the last 10 years, with the remaining sites to be completed by March 2013. These tests include the measurement of soil resistivity, step and touch potentials at key locations and earth grid impedance and potential rise.
In addition, excavations that allow checking the condition of the copper joints in earth grids are typically included in station rebuilds. In addition as a part of the recurrent maintenance program, sample below ground earth grid joints are now included in the inspection as well as switchyard surface condition.
The condition of some of the station ground wires is showing a level of deterioration due to surface corrosion, although testing has shown that they still have an acceptable tensile strength.
Key asset management strategies include:
Complete the program of current injection testing of station earth grids by 2013, complete the analysis of all historical results and identify stations that may require augmentation of their earth grids.
Continue with current injection testing and inspection of each terminal station earth grid every ten years.
Continue the program of excavation to check the condition of a representative sample of existing earth grid copper joints during terminal station augmentation or asset replacement projects.
Carry out current injection tests on selected transmission line towers that are located near to significant residential developments.
Continue to install bridge connections across termination hardware for line ground–wires that are located at power station switchyards and on 500 kV line ends.
Continue to replace deteriorated terminal station ground wires as the opportunity arises, for example, during refurbishment projects.
Continue to monitor performance of cathodic protection (CP) and impressed current cathodic protection (ICCP) systems on structures situated close to terminal stations or in areas of high corrosivity.
ISSUE 10 8/2/2013 55/ 68
UNCONTROLLED WHEN PRINTED
Ensure earth grid step and touch voltage hazard limits for operation and maintenance requirements are consistent with international limits (IEC 61936-1, IEEE 80), national limits (e.g. ESAA EG1) and are specified in the SP AusNet Station Design Manual.
For further information please refer to the detailed plant strategy, AMS 10-60 Earth Grids.
SP AusNet manages 39 bays of gas-insulated switchgear (GIS) across five terminal stations.
Since 2007, the number of GIS bays has increased by approximately 18%. Further installations are planned for Brunswick, Richmond and West Melbourne terminal stations before 2020.
The service age of GIS assets vary from one to 33 years. The general condition of SP AusNet GIS bays is “good”. About 70% of GIS bays are in condition C3 (Average) or better. There are no GIS bays in condition C5 (Very poor). No GIS bay replacements are expected before 2020.
Within the last 10 years, there was a significant peak in unplanned work orders in 2004 due to major failures and the subsequent investigations revealing systemic issues. There have been 45 work orders for 500 kV bays and one work order for 220 kV bay at ROTS. Most of the 500 kV outdoor GIS failures at SMTS and SYTS are associated with internal flashover, hydraulic leakage, SF6 leaks and mechanical interrupter failures.
Key strategies to address the issues outlined above are:
Continue monitoring the performance of all GIS to determine the need for refurbishment or replacement.
Complete refurbishment of SYTS GIS – including reducing SF6 gas leakage.
Complete SF6 sealing works at NPSD.
Review long lead time spares holdings and contingency planning. For further information please refer to the detailed plant strategy AMS 10-62 Gas Insulated Switchgear.
The Commonwealth and state governments have imposed legal responsibility on the owners and operators of critical infrastructure, such as electricity transmission network installations, to take all necessary preventative security measures to ensure the continuity of supply. SP AusNet maintains more than 100 electricity transmission network installations that are subject to security provisions, including terminal stations, communication sites, depots and offices.
Credible security threats, having potential impacts on members of the public, the broader community and on the commercial viability of SP AusNet can be broadly classified as:
Safety - of untrained persons in the vicinity of energy containing equipment
Malicious – motivated by revenge, fame, association or challenge
Criminal – profit driven and includes theft, fraud, sabotage or extortion
Terrorism – use or threat of force or violence to influence the government or public through fear or intimidation
SP AusNet’s Infrastructure Security Risk Assessment Tool (ISRAT) is used on a site-specific basis for critical infrastructure and for major sites. ISRAT is based on the principles established in:
National Guidelines for Unauthorised Entry Prevention, Energy Networks Australia, and
ISO 31000:2009, “Risk management – Guidelines on principles and implementation of risk management”.
ISSUE 10 8/2/2013 56/ 68
UNCONTROLLED WHEN PRINTED
The application of physical security control measures will be based on:
Consistent risk identification and quantification
Defence in depth
Deterrence
Delay
Detection
Response
Contingency planning
Commensurate with the assessed risk of unauthorised access and physical security policy, key strategies for the implementation of infrastructure security management include:
Upgrade existing security fencing
Continue the roll out of electric power fencing
Continue the installation of electronic access control systems
Expand and enhance CCTV surveillance cameras
Expand and enhance intrusion detection
Harden building entry points
Upgrade site lighting and controls in accordance with authorised standards For further information please refer to AMS 10-63 Infrastructure Security.
SP AusNet owns and maintains two underground power transmission cables connecting; Brunswick (BTS) – Richmond (RTS) and Eildon (EPS) – Thomastown (TTS). Additionally, there are approximately 750 interplant connection power cables installed within various terminal stations on the transmission network.
Smaller cables in the fleet are inspected visually only, as offline testing would requires uneconomic circuit outages.
Also, any work at joint bays 6, 8 and 9 on the RTS-BTS 220kV cable, which are located in the middle of Hoddle Street, would require significant and costly traffic management. Proactive inspection of these joints is aimed at ensuring such unplanned maintenance works are avoided at these locations.
In the period between 2005 and 2007, a small number of faults occurred on the 22 kV paper/lead cables. These cables have now been repaired or replaced.
SP AusNet’s key asset management strategies for Power Cables include:
Combine cable replacement, where possible, with other capital works. Otherwise, repair or replace based on condition.
Develop and implement an oil filled cable contingency plan to help manage the impact of a fault on one of the oil filled cables.
Update cable asset records and fault response plan. For further information refer to the AMS 10-66 Power Cables detailed plant strategy.
Protection assets are combined in systems to detect electrical faults on the transmission network and, via the operation of circuit breakers, rapidly disconnect faulted circuits from sound circuits. Protection systems are designed to protect operators and the public from hazardous electrical conditions, limit damage to network equipment and maintain the network’s electrical operating parameters within selected limits to ensure reliable energy supplies to consumers.
ISSUE 10 8/2/2013 57/ 68
UNCONTROLLED WHEN PRINTED
Secondary assets include devices to measure the network’s electrical operating parameters and monitor the function and condition of selected primary network assets. This data is essential for the effective tactical operation of the network, commercial agreements between connected parties and the strategic management of primary assets. Examples include revenue metering, power quality monitoring, transformer loading and temperature, circuit breaker operation, insulating oil degradation and prevailing weather.
Control assets are arranged in systems to provide automatic or remote manual control of the function of primary assets. These systems are essential for the effective and efficient control of power flows within the network and include functions such as transformer voltage regulation and cooling system control, reactive voltage control, load shedding and runback schemes.
Secondary system technologies evolve rapidly. In a relatively short period of time electromagnetic technology was superseded by analogue electronics, then by digital electronics and further by microprocessors, which integrated multiple functions. Intelligent electronic devices with flexible integration, programmability and configurability are now in use.
Consequently, secondary assets become uneconomic within a typical timeframe of 15 years because they are no longer supported by manufacturers, are technically incompatible with interfacing equipment or are unable to provide the functionality established in industry standards or regulation.
Renewal of the secondary system is commonly incorporated into the scope of works for the major terminal station renewal projects. Key secondary system asset management strategies include:
Replacing transformer protection at WOTS and KTS and upgrading transformer protection at FBTS and MLTS
Replacing bus protection at HOTS and MLTS and upgrading bus protection at HWPS, HWTS, LYPS and SMTS
Replacing line protection of HWTS-SMTS, ROTS-SMTS, DDTS-WOTS and DDTS-SMTS extra high voltage lines
Replacing 220 kV line differential protection and distance protection in selected metropolitan and non-metropolitan schemes
Replacing pilot wire protection of HWPS-HWTS and HWPS-JLTS lines
Replacing obsolete 66 kV feeder protection at ATS, GTS, HOTS and WOTS
Replacing SVC protection at HOTS, KGTS and ROTS
Installing 500 kV circuit breaker management relays at KTS, LYPS, SYTS, SMTS, MLTS and HWTS, installing 330kV CB Management: relays at DDTS, SMTS and WOTS, installing 220 kV circuit breaker management relays at MLTS and ERTS
Replacing PLC based CB Controls and Auto Close Schemes
Replacing reactive plant control at HOTS, KGTS, ROTS BLTS, FBTS, SMTS and TSTS
Replacing older under-frequency load shedding schemes
Progressively replace revenue meters from 2018
Replacing obsolete and unreliable tower weather stations
Replacing obsolete and unsupported Remote Terminal Unit (RTUs) For further information refer to AMS 10-68 Secondary Systems.
ISSUE 10 8/2/2013 58/ 68
UNCONTROLLED WHEN PRINTED
SP AusNet has four Static VAR Compensators (SVCs) installed; at Rowville (ROTS), Horsham (HOTS) and Kerang (KGTS) terminal stations. SVCs are required for dynamic voltage control at critical locations on the transmission network.
The SVC serves to regulate system voltages by using the Thyristor Controlled Reactor (TCR) to consume VARs from the network under capacitive loading conditions. Conversely, under inductive loading conditions the SVC uses the Thyristor Switched Capacitor (TSC) to add VARs to the network. The use of the SVC facilitates continuous voltage stability enabling the network to withstand unplanned outage events such as the loss of a line following lightning strike.
The control systems (including thyristors) on three of the four SVCs date back to initial construction and consist of obsolete technology which is unsupported by the manufacturer (ASEA). Obsolescence of these control systems increases existing risks associated with failure as fault rectification works are slow and difficult resulting in extended unplanned outages.
Unplanned outages of SCVs constrain the network’s energy transfer capability, increasing the cost of electricity which negatively impacts energy consumers and the wider community. Furthermore, failure of the SVC control system at KGTS in 2008 resulted in an availability incentive scheme financial penalty equating to $894k. Risk assessments reveal that replacement of the three remaining ASEA control systems would be prudent.
SP AusNet’s key asset management strategies for SVCs include:
Continue with scheduled maintenance and existing inspection procedures
Introduce regular Partial Discharge (PD) testing on the ROTS No.2 and HOTS SVCs for the years leading to their upgrades.
Replace the reactive plant controls of the KGTS SVC with new Alstom controls and thyristors by 2013.
Replace the reactive plant controls of the ROTS No. 2 SVC with new Alstom controls and thyristors by 2018.
Replace the reactive plant controls of the HOTS SVC with new Alstom controls and thyristors by 2019.
For further information refer to the detailed plant strategy AMS 10-71 Static VAR Compensators.
Surge diverters are a device used on electrical power systems to protect expensive items of plant that are susceptible to internal failure due to transient lightning or voltage surges during switching. SP AusNet’s population of 2205 surge diverters has increased by 20% during last 5 years due to network growth and increased use of surge diverters instead of protective air gaps at the extra high voltages of 220 kV, 275 kV, 330 kV and 500 kV.
More than 50% of surge diverters are fitted to 66kV line exits. The surge diverter population is predominantly gapless metal oxide (approximately 95%) and the remainder are gapped silicon carbide (approximately 5%).
The condition of 95% of surge diverters is satisfactory. There are only 118 surge diverters that are assessed as in “very poor” and “poor” condition. All these are silicon carbide type surge diverters with porcelain housings.
Key asset management strategies include:
Complete replacement of silicon carbide type of surge diverters by 2020.
Investigate first generation porcelain housed metal oxide surge diverters for condition deterioration
Implement an online condition assessment program to benchmark the condition of metal oxide surge diverters.
ISSUE 10 8/2/2013 59/ 68
UNCONTROLLED WHEN PRINTED
Further information can be found in AMS 10-73 Surge Diverters.
SP AusNet as a transmission network service provider currently has three synchronous condensers in service in electricity transmission network. The synchronous condenser installed at Brooklyn Terminal Station (BLTS) in 1971, was refurbished in 2005/2006 and is currently providing an adequate level of service. The remaining two synchronous condensers at Fisherman’s Bend (FBTS) and Templestowe (TSTS) terminal stations, both installed in 1967, are now becoming unreliable, present several safety hazards to workers and are nearing the end of their economic lives.
The Australian Energy Market Operator (AEMO) has determined that the function of the three synchronous condensers is essential to the safe and reliable operation of the shared electricity transmission network in Victoria. AEMO has requested that the existing condensers are kept in operation14 and AEMO and SP AusNet have jointly determined that refurbishment of the existing units is currently the most economical method to maintain essential dynamic reactive support functionality for the foreseeable future.
During refurbishment, the occupational health and safety performance of the synchronous condensers and their supporting equipment will be improved and online condition monitoring equipment will be installed. This monitoring equipment will reduce unnecessary maintenance and will help to better evaluate the condensers’ in-service condition.
Five principle strategies have been developed for the continued management of synchronous condensers:
Keep the existing synchronous condensers in service for up to 15 years, nominally until 2025.
Complete the refurbishment of the BLTS synchronous condenser including occupational health and safety issues and 5-year condition monitoring tests and installation of on-line condition monitoring systems.
Initiate a major refurbishment of the FBTS and TSTS synchronous condensers and ancillary systems.
Install online condition monitoring systems on the BLTS, FBTS and TSTS and transition to condition based maintenance practices
In conjunction with AEMO, develop a longer-term reactive support plan for the Victorian electricity transmission network
For further information refer to the detailed plant strategy AMS 10-74 Synchronous Condensers.
Power transformers and oil filled reactors are an essential component of the Victorian electricity transmission network. SP AusNet’s power transformer and oil filled reactor fleet includes a total of 143 transformer banks with ratings from 35 MVA to 1000 MVA. These transformer banks include 90 single-phase and 113 three-phase transformers, operating at 66kV, 220 kV, 330 kV and 500 kV.
SP AusNet assets include a total of 143 transformer banks with ratings from 35 MVA to 1000 MVA. These are made up of 90 single-phase and 113 three-phase transformers, operating at 66kV, 220 kV, 330 kV and 500 kV. The majority of the power transformer fleet can be classed as either main tie transformers or connection transformers but also includes special purpose transformers for reactive plant such as Static Var Compensators and Synchronous Condensers.
14
AEMO Direction: Synchronous Condenser Refurbishment Project - Letter to Alastair Parker 4/5/2012
ISSUE 10 8/2/2013 60/ 68
UNCONTROLLED WHEN PRINTED
With the exception of four 35 MVA transformers at Kerang (KGTS) and Red Cliffs terminal stations (RCTS), and a 55 MVA transformer at Yallourn power station (YPS), all 220 kV and 330 kV transformers installed prior to 1964 are of single-phase construction and, in many instances, there are compatible spare single-phase units available on site. From 1964, all the 220 kV transformers installed have been of three-phase construction, with the standard size of metropolitan 220/66 kV transformers being 150 MVA.
SP AusNet has reduced energy losses in the Victorian electricity transmission network by progressively replacing single-phase transformers with more efficient three-phase units. Importantly, replacement of single-phase units extends maintenance cycles and rationalisation reduces the probability of transformer failures.
Whilst transformer units are rationalised as technology matures the number of transformer banks and connection points required continues to grow. Pertinent to the fact that the Victorian transmission network is still growing; the average utilisation of connection transformers is now 23% higher than in 1994/1995.
High growth in electricity consumers in the metropolitan Melbourne growth corridors, increasing penetration of domestic air conditioning and the probabilistic techniques employed by the Australian Energy Market Operator and the electricity distributors in planning the capacity of connection assets have driven high utilisation of power transformers over the last decade. The high ambient temperatures, during the extended drought, coupled with high utilisation have negatively impacted the maintenance, reliability and the condition of power transformers.
The volume of unplanned maintenance on power transformers over the period 2006 to 2011 is 85% higher than the period 2000 to 2005. Six major failures of power transformers at Keilor, Morwell, Mount Beauty and Thomastown terminal stations since 2004 have driven the Victorian failure rate above the CIGRE Australia average of 0.4% per annum. Above-average deterioration has been measured in the core and coils of 14% of the power transformer fleet.
Reliability centred maintenance models show that a reactive management approach; such as “Do Nothing” or “Replace on Failure” is neither prudent nor economic with an associated increase in failure risk of 72% forecast over the next ten years. Continuing investment in power transformer refurbishment and replacement is necessary to economically manage failure risks which are being driven by the value of unserved energy, declining reliability and measurable deterioration.
In summary, components of 81 transformers are expected to be refurbished and 66 units, including 48 single-phase units, are scheduled to be replaced over the period from 2012 to 2017. Approximately 75% of replacements are being completed under major projects or station rebuilds to ensure efficiency of delivery. Implementation of this selective refurbishment and replacement strategy, addressing both failure frequency and consequences will meet obligations of the Electricity System Code (ESC)15.
The strategies outlined in this section are applicable to both power transformers and oil filled reactors.
Continue to monitor paper degradation indicators and trend the rates of degradation and early indicators of insulation breakdown in order to adjust replacement plans on a 12 monthly cycle with a 6 yearly offline electrical analysis
Continue to revise transformer cyclic ratings as network loading profiles and transformer condition changes by assessing load profile every 5 years and adjusting transformer ratings to suit the cyclic load profile.
Perform autopsies on selected retired transformers to verify physical condition and deterioration model for the remaining fleet and link key deterioration indicators to support best
15
Electricity System Code 2000
ISSUE 10 8/2/2013 61/ 68
UNCONTROLLED WHEN PRINTED
practice replacement. The Morwell B1, Keilor B1 and Thomastown B3 will be assessed to provide a view of 25 units in service
Continue to monitor ageing by-products in the oil to assess condition of the transformer.
Treat insulating oil where economically justified to ensure ongoing reliability for suitable transformers.
Continue replacement program for SRBP and Oil paper bushings identified as being in poor condition and where economically justified replace in standalone projects.
Continue to refurbish EHV bushings where technically feasible and economic for use as strategic spares
Continue the program to repair all significant oil leaks and oil damaged wiring on transformers
Continue to paint and treat corrosion on transformers which exhibit poor external condition as where identified above
Further develop analysis of oil samples for early indicators of diverter switch wear or impending failure. Align maintenance cycles with industry best practice based on duration and number of operations reducing intrusive maintenance with condition assessment techniques as defined in:
o SMI 80-01-02 Transformer Condition Monitoring in Terminal and Zone Substations o Transformers, Regulators, and, Oil Filled Reactors and Neutral Earth
Compensators Including On Load Tap Changers: Installation and Overhaul - PGI-TRANS/OLTC
Investigate and overhaul problematic OLTC, such as Trafo-Union (Fuji Transformers) and ABB UC types (SVTS B4)
Continue use of New Vacuum Technology for new transformers to overcome oil contamination from contact wear as per design and tender agreements
Continue the prioritised program to replace the unreliable types of analogue winding temperature indicators with accurate digital type with remote indication at Network Operating Centre Condition Monitoring and Diagnostic Testing
Continue to install on-board condition monitoring, cooler control and limited dissolved gas monitoring on all new transformers as per tender specification
Investigate and replace faulty sensors/cards on older Hydran (online dissolved gas and moisture monitors) under project: Transformers – On-Line Gas and Moisture [Hydran M2] Analyser Replacement
Continue to identify and salvage critical spares from retired transformers to support the remaining fleet of transformers where like components are available
Continue the standardisation of transformer components where possible to maximise compatibility with spare transformer components
Continue to hold appropriate contingency spare transformers in order to provide a satisfactory network contingency response16
16
‘System Contingency Plan for Transmission Assets’.
ISSUE 10 8/2/2013 62/ 68
UNCONTROLLED WHEN PRINTED
Instrument transformers provide accurate measurements of the operating voltages and currents necessary for the safe, reliable and economic protection and control of the Victorian electricity transmission network and its interconnections with the National Electricity Market. SP AusNet’s single-phase post-type instrument transformer fleet consists of 2951 units including current transformers (CTs), voltage transformers (VTs) and capacitive voltage transformers (CVTCCs) operating at voltages of 66 kV, 220 kV, 330 kV and 500 kV.
The majority of units in service are of oil-insulated porcelain-housed construction. A small number of instrument transformers are SF6 gas insulated units, but this number is expected to increase in coming years. The volume of instrument transformers in service continues to increase with expansion of the network. However, this increase has been moderated over the last decade by replacement of deteriorated post-type CTs with toroidal CTs located within the bushings of new dead tank 220 kV and 66 kV circuit breakers.
Over the last decade there have been significant replacements of both current transformers and voltage transformers as part of major asset replacement projects and in smaller projects focussed on managing specific supply risks to consumers, safety risks to workers and collateral plant damage risks within terminal stations. This replacement program has forestalled explosive failures and reduced the average service age of instrument transformers to 18 years. However, there are 290 instrument transformers operating at 220 kV and 66 kV with service ages greater than 40 years; which suggests they will approach the end of their useful lives by 2020.
Condition assessments based on dissolved gas analysis (DGA) confirm deterioration in over 188 single-phase extra high voltage CTs and over 30 high voltage CTs. Reliability centred maintenance models clearly demonstrate that a reactive management approach; such as “Do Nothing” or “Replace on Failure” is neither prudent nor an economic strategy for the management of these deteriorated units. RCM models show that reactive management will increase the failure risk by 62% over the next ten years. In comparison to recent years a smaller but continuing investment in instrument transformer replacement is necessary to economically manage failure risks which are being driven by worker safety associated with explosive failure modes, the rising value of unserved energy and declining reliability due to measurable deterioration.
Implementation of the following risk-based selective replacement strategy, addressing both failure frequency and consequences will meet obligations of the Electricity Safety Act and the National Electricity Rules:
Replace three remaining 220 kV Tyree CTs
Replace remaining fifty-four Mitsubishi 500 kV CTs by 2022
Replace remaining fleet of six 66 kV and twenty-seven t 220 kV Ducon CTs
Replace 14 remaining IMBA Type ASEA CTs
Replace 39 Plessey Ducon 220 kV CVTs For further information refer to AMS 10-64 Instrument Transformers.
Asset management strategies for transmission line assets are separated into four logical asset classes including structures, structure footings, conductor and insulators.
The Victorian transmission line easements are approximately 6,500 kilometres in length and cover a total area of approximately 21,600 hectares.
Transmission line easements are legally held by SPI PowerNet Pty. Ltd. and provide safe passage for line workers and machinery to transmission lines so that maintenance activities can be performed.
ISSUE 10 8/2/2013 63/ 68
UNCONTROLLED WHEN PRINTED
The volume of transmission line easements has increased marginally in recent years mainly to accommodate connections of new generators and the extension of the transmission network to the desalination plant at Wonthaggi.
Benefits of asset management strategies for line easements include:
Reduced health and safety risks through the removal of non-compliant dwellings and developments from line easements
Widening of transmission line easements on critical corridors will improve the reliability and availability of the network especially during bushfire events
Increased maintenance of access tracks is essential to ensure the delivery of transmission lines asset replacement programs which are expected to increase over the next 20 years
Key Asset Management Strategies include:
Develop risk management plans aimed at reducing risks associated with non-compliant developments on line easements so far as is practicable (SFAIP)17 by March 2014.
Perform feasibility studies on the implementation of easement widening programs on critical corridors by March 2014.
Include inspection of underground cable routes in line easement maintenance programmes including the CBTS – WGI 220kV route.
Increase levels of access track maintenance to ensure adequate access required as part of future asset replacement programs.
For further information refer to AMS 10-65 Line Easements.
There are approximately 13,000 transmission lines structures in service on the transmission network, 96 per cent of these structures are steel lattice towers situated along transmission line easements. The average age of the structure population is 43 years and approximately 4 per cent of the fleet exceed a service age of 60 years.
The condition of transmission structures is generally good however some structures are exposed to extremely corrosive environments and as a result are deteriorating rapidly. Performance levels of structures have improved in recent years with the Mean Time Between Failure (MTBF) increasing steadily to its current rate of 1.9 years. Reductions in the number of tower collapse events has been achieved through replacement programs targeting light suspension towers built using early designs which have inadequate strength to withstand high intensity wind events.
The key issues associated with structures include:
48 structures require replacement due to health and safety risks caused by proximity to road ways and inadequate strength to withstand high intensity wind events
Corrosion of transmission line structures is higher in some areas due to exposure to harsh environmental conditions especially in coastal regions or areas of industrial pollution.
Some structures are very costly to replace and so alternative asset management practices such as structure painting are required
1.5 per cent of transmission line structures contain members displaying established signs of corrosion or worse. This includes bolts exhibiting condition grades C3 and C4.
4.7 per cent of transmission line structures contain bolts displaying established signs of corrosion or worse. This includes bolts exhibiting condition grades C3, C4 and C5.
Functional failures of structures adjacent to roads, rail crossings or public areas presents higher health and safety risks
Maintenance of structures exposes line workers to risks associated with working at heights and working close to live electrical apparatus
Structure members can be damaged following impact from vehicles and farming machinery or can be removed by unauthorised third parties.
17
Electrical Safety Act
ISSUE 10 8/2/2013 64/ 68
UNCONTROLLED WHEN PRINTED
The majority of the structure fleet are built to out-dated design standards18.
The key asset management strategies for transmission line structures include:
Replace 48 structures demonstrating high risk of functional failure due to inadequate design by 2020.
Continue to install fall arrest systems on remaining structures with 50% complete by 2014 and final completion by 2020.
Complete the installation of fall arrest systems on rack structures in terminal stations by 2020.
Paint 34 structures which are economic by 2020
Continue to replace corroded or damaged steel members and bolts as part of corrective and scheduled maintenance programs
Complete trial and implement the use of Field Mobile Inspection (FMI) technologies for the collation of condition assessment data. These technologies must facilitate automatic updates of MAXIMO databases.
Perform structural modelling of existing Structures to assist with the development of asset replacement programs
For further information refer to the detailed plant strategies, AMS 10-77 Transmission Lines Structures and AMS 10-65 Line Easements.
Transmission line structures are anchored and supported by structure footings. There are two types of transmission structure footings; direct buried galvanised steel and fully encased concrete. Generally steelwork exposed to soil corrodes more quickly than steelwork encased by concrete. Corrosion has been observed to be most severe in the top 100mm of soil where oxygen penetrates most freely. In order to prevent the deterioration of footings protective coatings called SOX are applied to the exposed areas.
The key issues associated with structures footings include:
Structure foundations corrode at ground line due to a mix of air and moisture.
Structure foundations can be compromised by flooding due wet weather events.
Corrosion of direct buried steel foundations is accelerated by electrical currents circulating between structure earths and a nearby terminal station earth grid or from stray currents from DC traction supplies. Cathodic protection systems are necessary to mitigate this effect in selected locations.
Electrical fault currents may discharge through the tower foundations and create earth potential rise (EPR) at the tower legs and in soil surrounding the structure foundations and drive increased line trip events.
Intrusive inspection of structure foundations is labour intensive, time consuming and may compromise footing strength when excavated.
Structure foundation legs can be damaged by vehicles or farming machinery.
The key asset management strategies associated with transmission line structure footings include:
Continue to perform visual inspection of structure foundations as part of the 37 month inspection cycle
Continue to perform life extension works on damaged or corroded foundations identified as part of the SOXS programme until completion in 2025.
Complete earth resistance testing of HWPS-ROTS 220kV No.1 and 2 lines in 2013 using findings to develop risk based testing program.
Continue the program of inspections for cathodic protection systems. The effectiveness of cathodic protection systems shall be maintained by inspecting the condition of anodes
18
AS/NZS 7000:2010 Overhead Line Design – Detailed Procedures
ISSUE 10 8/2/2013 65/ 68
UNCONTROLLED WHEN PRINTED
Complete trial and implement the use of Field Mobile Inspection (FMI) technologies to automatically update MAXIMO with condition assessment data by 2014.
For further information refer to the detailed plant strategies, AMS 10-78 Transmission Lines Structure Foundations and AMS 10-65 Line Easements.
The total route length of EHV phase conductor on the transmission network exceeds 6,500 kilometres. The phase conductors operate at four standard voltages including 500kV, 330kV, 220kV and 66kV. EHV conductors are protected from lightning strike by over 7,460 kilometres of ground-wire and OPGW. There are three different types of phase conductors in use on the transmission network including aluminium conductor steel reinforced (ACSR), all aluminium conductor (AAC) and all aluminium alloy conductor (AAAC). There are three different types of ground-wire in use on the transmission network including steel, ACSR and OPGW.
The average age of the phase conductor fleet is 43 years with five per cent of the fleet exceeding a service age of 60 years. Condition assessments and recent failure events reveal that expected service lives of conductor can be reduced by much as 60 per cent by the corrosivity of the environment. This reduction has been observed on the HYTS-APD 500kV line which suffered a conductor failure after 23 years of service due to excessive corrosion. Conductor condition is generally good however significant proportions of the population are displaying signs of corrosion and are expected to require remedial action or replacement over the next 20 to 30 years.
The average age of ground wire is 32 years, 25 per cent of the ground wire population has been replaced with OPGW since 1987 which has reduced the average age when compared to conductor. Steel and ACSR ground wire are displaying deteriorating condition and substantial replacements are forecast over the next 20 year period. Corrosion of phase conductor is of concern as current inspection methods fail to provide accurate condition grades for ACSR especially. The ability to assess mid span conductor condition is difficult during tower climbing inspections highlighting the need to utilise specialised condition assessment techniques.
The key issues associated with conductor and ground-wire are as follows:
Approximately 20 per cent of the conductor and ground-wire fleet have been in service for more than 50 years, this figure will increase to 48 per cent by 2020.
Corrosion of transmission line conductor and ground-wire is higher in some areas due to exposure to harsh environmental conditions which can reduce expected service life by more than 50 per cent.
Six per cent of transmission line conductor and ground-wire spans are displaying established signs of corrosion and require remedial action within ten years.
Functional failure of conductors and ground-wire on spans crossing road or rail corridors present significant public health and safety risks
Current condition assessment techniques for ACSR may not accurately assess the true condition of the internal steel strands. More advanced technologies offer more objective alternatives such as the use of OHLCD units and the application of the SAIP system which can improve the accuracy of condition data collected.
Accurately assessing the condition of mid span sections of conductor and ground-wire during tower climbing inspections is very difficult. More advanced technologies such as the use of OHLCD units and the application the SAIP system are alternatives which can improve the accuracy of condition data collected.
The key asset management strategies associated with transmission line conductor include:
Replace ten kilometres of conductor by April 2017. Replacement of conductor will initially take place on a section of HYTS – APD 500kV line between tower 578 and 591.
ISSUE 10 8/2/2013 66/ 68
UNCONTROLLED WHEN PRINTED
Replace 35 kilometres of ground-wire by April 2017. Ground-wire replacements will address the highest risk spans as a priority.
Refine existing RCM methodologies to optimise asset replacement programs extending to 2030.
Import asset data including installation dates and condition assessment grades into MAXIMO by 2013
Complete trial and implement the use of the Field Mobile Inspection (FMI) system as the primary means of capturing condition assessment data.
Replace or repair defective conductor and ground-wire assets as part of corrective maintenance tasks
Quantify correlations between reductions in conductor UTS and contributing factors such as condition and age through a conductor sampling and testing program.
Continue to collect and test samples of conductor joints and terminations.
Introduce the use of Smart Aerial Image Processing (SAIP) technology to assess the condition of conductor and ground-wire by 2013
Continue selective Overhead Line Corrosion Detection (OHLCD) tests of ACSR using results obtained to assess validity of current condition assessment techniques
Complete Aerial Laser Surveys (ALS) using LIDAR laser technology on the remaining 20 per cent of transmission lines by 2014
Develop and implement a risk management plan for all transmission line spans identified as not meeting current design standard by 2015
For further information refer to AMS 10-79 Transmission Lines Conductors and AMS 10-65 Line Easements.
A total of 89,525 transmission line insulator strings are in service on the transmission, the majority of insulator strings are comprised of a number of linked discs made from either porcelain or glass with steel pins to form a continuous string. Since 2006 polymeric insulator strings have been introduced on the network, polymeric insulator now comprises 37 per cent of the insulator fleet. The average age of the transmission line insulator population has decreased from 32 years in 2000 to 20 years in 2012 due to a risk based replacement program which began in 2006.
The transmission line insulator fleet has improved in recent times and is now generally in good condition, however, there a small proportion of the fleet presents high risk of failure due to poor condition and location. The frequency of major insulator failures has diminished since the start of the 2006 risk based replacement program. This program targeted replacements on condition, location and insulation type. Although performance levels of insulators are improving some key issues remain, such as:
Replacement of 2.3 per cent of the insulator fleet is economically viable by 2017.
Corrosion of transmission line insulators is higher in some areas due to exposure to harsh environmental conditions
1.1 per cent of transmission line insulators are displaying established signs of corrosion. This includes insulators exhibiting condition grades C4 and C5.
Some transmission line insulators are relatively old which means that the probability of hidden failure modes is increasing due to the adverse affects of thermal cycling and cement growth
Transmission line insulator condition grading techniques do not currently assess internal condition of the insulator shed or the adverse affects of cement growth and thermal cycling on porcelain insulators. Growth of cement and thermal cycling can cause functional failures; methods for measuring the affects of these phenomenons on mechanical and electrical performance have not been established.
Functional failure of insulators on structures adjacent to road or rail crossings presents health and safety risks
ISSUE 10 8/2/2013 67/ 68
UNCONTROLLED WHEN PRINTED
Volumes of polymeric composite insulators on the transmission line network are increasing due to insulator replacement program. Policies for assessing the condition and the remaining expected service life of these insulators require further development.
The key asset management strategies associated with transmission line insulators include:
Selectively replace high failure risk insulator strings representing up to 2.3% of line insulator fleet by 2017.
Introduce fail-safe design concepts for insulation systems on transmission line structures adjacent to high risk roadways and railways or proof test all insulator fittings prior to installation on towers across roads and railways
Perform testing of older insulators to quantify the adverse affects of thermal cycling and cement growth on electrical and mechanical performance. Adjust condition grading techniques to incorporate these affects.
Import all relevant technical asset data including condition assessment grades into MAXIMO. Technical data should include as a minimum:
o insulator type o size o age o volume of insulator strings o performance history o road/rail crossings o condition
Complete trial and implement the Field Mobile Inspection (FMI) electronic system as the primary tool for capturing condition assessment data which updates MAXIMO as part of automated process.
Continue to replace porcelain, glass or mixed string insulators containing more than one electrically flat discs.
Develop policies for inspection, maintenance and ultimate replacement of polymeric insulators considering expected service life. These policies must include a condition assessment methodology.
For further information refer to the detailed plant strategies, AMS 10-75 Insulators and AMS 10-65 Line Easements.
ISSUE 10 8/2/2013 68/ 68
UNCONTROLLED WHEN PRINTED
The Asset Management Strategy is central to SP AusNet’s processes for delivery of transmission network services to customers safely and reliably in accordance with SP AusNet’s Asset Management Policy, which is shown in the following Figure 19.
Figure 19 - SP AusNet’s Asset Management Policy