Embed Size (px)
Citation preview
Olympic Dam Expansion Draft Environmental Impact Statement 2009 Appendix Q 97
APPENDIX Q6
Benchmarking social services and living costs

Olympic Dam Expansion Draft Environmental Impact Statement 2009 Appendix Q98
Olympic Dam Expansion Draft Environmental Impact Statement 2009 Appendix Q 99
Q6 BENCHMARKING SOCIAL SERVICES AND LIVING COSTS
This appendix benchmarks employment in social services and living costs in Roxby Downs with comparable mining communities
across Australia. This information supports Chapter 19, Social Environment, of the Draft EIS.
Q6.1 APPROACH
The approach used to benchmark employment in social services and living costs in mining communities across Australia involved
the following key activities.
A review was undertaken of mining communities around Australia to select areas that were most comparable to Roxby Downs
based on (see Section Q6.3 for selection criteria details):
mines operating in South Australia, Queensland, Western Australia, Northern Territory, New South Wales and Victoria,
and the local government areas in which they operate
the number of people employed in mining
population size
the degree of remoteness
the number of towns (classified as an urban centre/locality or state suburb by the Australian Bureau of Statistics) in the
identified local government area
demography
the size of the residential and long distance commute / fly-in fly-out populations.
Local government areas (LGAs) were used as the basis of the review, with the exception of Nhulunbuy Statistical Local Area (SLA),
which falls within unincorporated land in the Northern Territory and is managed by a public corporation, and Groote Eyelandt
(SLA), also part of the Northern Territory (see Figure Q6.4).
As there are relatively few large-scale mining operations in South Australia, population size was used as the basis for the
initial selection of LGAs rather than employment in mining. The review was also confined to incorporated areas in regional
South Australia (i.e. LGAs outside the Outer Adelaide Statistical Division), excluding the Kangaroo Island LGA.
Areas considered to be most comparable to Roxby Downs were chosen for this review. No comparable LGAs to Roxby Downs
were identified in South Australia, and consequently, no South Australian LGAs have been benchmarked.
Social services, living costs and other community characteristics were benchmarked based on:
employment by government/non-government employer, industry and occupation. Where data is available regarding hours
worked, the number of full-time equivalent (FTE) positions has been calculated
ratios of students per school and students per teacher
housing costs (including monthly housing loan repayments, weekly rental costs, average house sales, the value of building
approvals, and housing affordability for key public sector workers)
the cost of purchasing 37 grocery items from the major supermarket in selected LGAs
quality of life, as measured by 10 variables including health, the housing market, internet access, employment, income,
education, volunteering and crime.
Comparisons between areas are generally made on a per capita basis (as a rate per 1,000 population), other standardised ratio
(e.g. population per general medical practitioner or student to teacher ratios), or ranked score. Rates per capita are calculated
on the basis of the estimated resident population (or children aged 5–16 years old for the student/school teacher comparison).
Sources of information used in this analysis include:
Australian Bureau of Statistics (ABS 2007a, 2007b, 2007c, 2007d, 2007e and 2007f) government reports and websites
mining company reports and websites
local government reports and websites
a survey undertaken for the Draft EIS of the cost of purchasing 37 common grocery items
reports by BankWest on key worker housing affordability and quality of life (2008a and 2008b).
Further details on the methodology for selecting LGAs for comparative purposes can be found in Section Q6.3.
•
•
•
•
•
•
•
•
•
•
•
•
•
•
•
•
•
Olympic Dam Expansion Draft Environmental Impact Statement 2009 Appendix Q100
Q6.2 LIMITATIONS AND ASSUMPTIONS
There are a number of limitations in comparing employment in social services across communities.
While LGAs were selected on the basis of their similarity to Roxby Downs, inherent differences in social and economic
characteristics, geographic location (including proximity to other towns) and state/territory policies, and models and standards
of service delivery will affect the level of service provided.
Mining towns also vary in terms of the size of the residential population and the long distance commute/fly-in fly out (FIFO)
workforce. This can influence the level and type of services that are provided. For example, policing, health and recreation services
are likely to take into account the FIFO population, while schools, childcare and family services are more likely to reflect the
resident population. In general, the estimated resident population (ABS 2007a) has been used to calculate employment rates
per 1,000 people, except where services are only used by a specific population group.
In addition, some services (e.g. some specialist health services and family welfare services supplied to Roxby Downs) may be
provided on an outreach or visiting basis and will not be reflected in local employment data. The number of people employed in
these industries who live locally may therefore not reflect the actual level of service provided. Employment levels will nonetheless
indicate local service availability and have therefore been included in the analysis.
The opposite situation may also apply – where services (or people employed in those services) are located in one area – but serve
a broader population catchment. LGAs, rather than towns, have therefore been used to compare areas, to maximise the likelihood
of employment being within the area, and to take account of the broader catchment area of services.
The review was undertaken using information available in the public domain and obtained from sources such as the ABS,
local councils and mining companies. In some instances, data sets were incomplete, or could not be independently verified.
In order to present the benchmarking information as consistently and accurately as possible, only data that comes from
a citeable source has been used.
Olympic Dam Expansion Draft Environmental Impact Statement 2009 Appendix Q 101
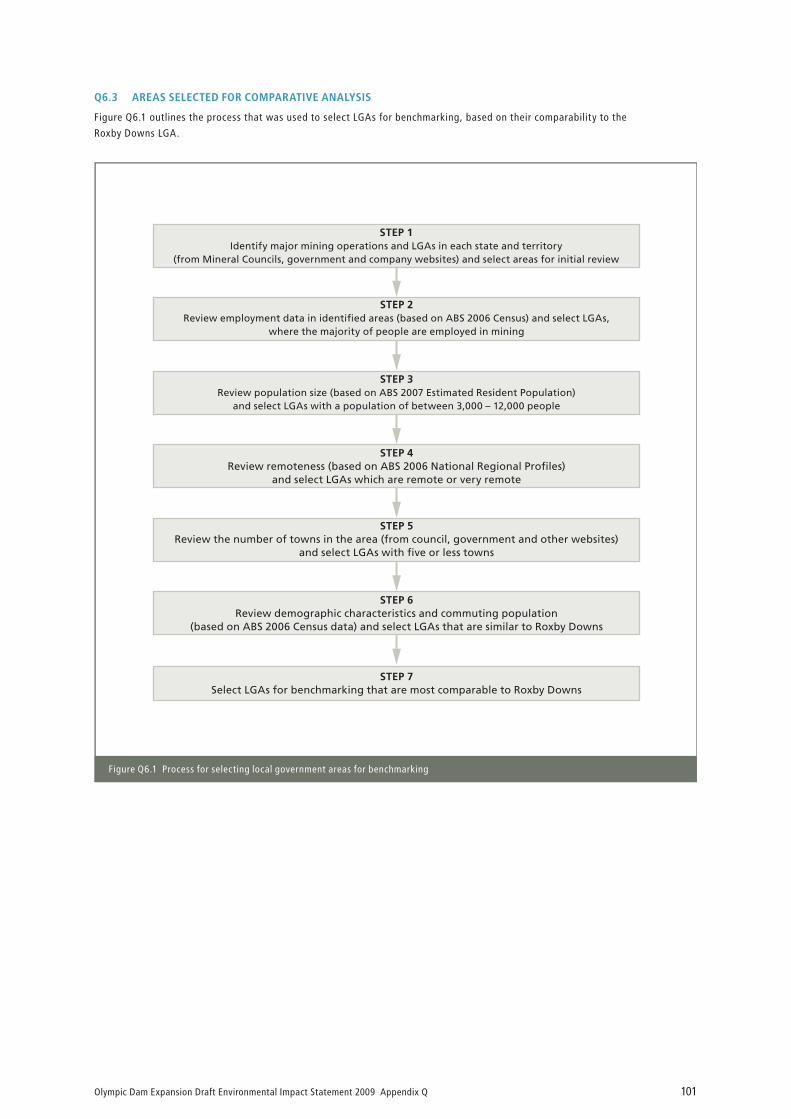
Q6.3 AREAS SELECTED FOR COMPARATIVE ANALYSIS
Figure Q6.1 outlines the process that was used to select LGAs for benchmarking, based on their comparability to the
Roxby Downs LGA.
STEP 1Identify major mining operations and LGAs in each state and territory
(from Mineral Councils, government and company websites) and select areas for initial review
STEP 2Review employment data in identified areas (based on ABS 2006 Census) and select LGAs,
where the majority of people are employed in mining
STEP 3Review population size (based on ABS 2007 Estimated Resident Population)
and select LGAs with a population of between 3,000 – 12,000 people
STEP 4Review remoteness (based on ABS 2006 National Regional Profiles)
and select LGAs which are remote or very remote
STEP 5Review the number of towns in the area (from council, government and other websites)
and select LGAs with five or less towns
STEP 6Review demographic characteristics and commuting population
(based on ABS 2006 Census data) and select LGAs that are similar to Roxby Downs
STEP 7Select LGAs for benchmarking that are most comparable to Roxby Downs
Figure Q6.1 Process for selecting local government areas for benchmarking
Olympic Dam Expansion Draft Environmental Impact Statement 2009 Appendix Q102
Coober Pedy
Prominent Hill
Olympic Dam
Leigh Creek
Beverley
Honeymoon
Cooper Basin
Eucla BasinGawler Craton
Lambina
FlindersIsland
WhyallaPortPirie
Roxby Downs
PortLincoln
Port Augusta
Mount Gambier
Ceduna
Pennshaw
Kingscote
Coffin Bay
Cummins
Coorong
Tatiara
Ceduna
Mid MurrayMannum
NaracoorteLucindale
NorthernAreas
YorkePeninsula
CopperCoast
RenmarkParinga
Coober Pedy
Berri Barmera
Lower EyrePeninsula
Unincorporated SA
KangarooIsland
Wakefield
Grant
Clare andGilbert Valleys
Goyder
Outer AdelaideStatistical Division
AdelaideStatisticalDivision
Operating mine
Prospect
Mining lease
Exploration lease
Proclaimed Precious Stones Field
Local Government Area
Unincorporated SA
Statistical Division
Existing Olympic Dam Special Mining Lease
Existing Roxby Downs Municipality
EIS Study Area
OLYMPIC DAM
Andamooka
AndamookaProclaimed Precious
Stone Field
Roxby Downs
Inset
see inset
0 50 100 150 200 250
km
SpencerGulf
GulfSt
Vincent
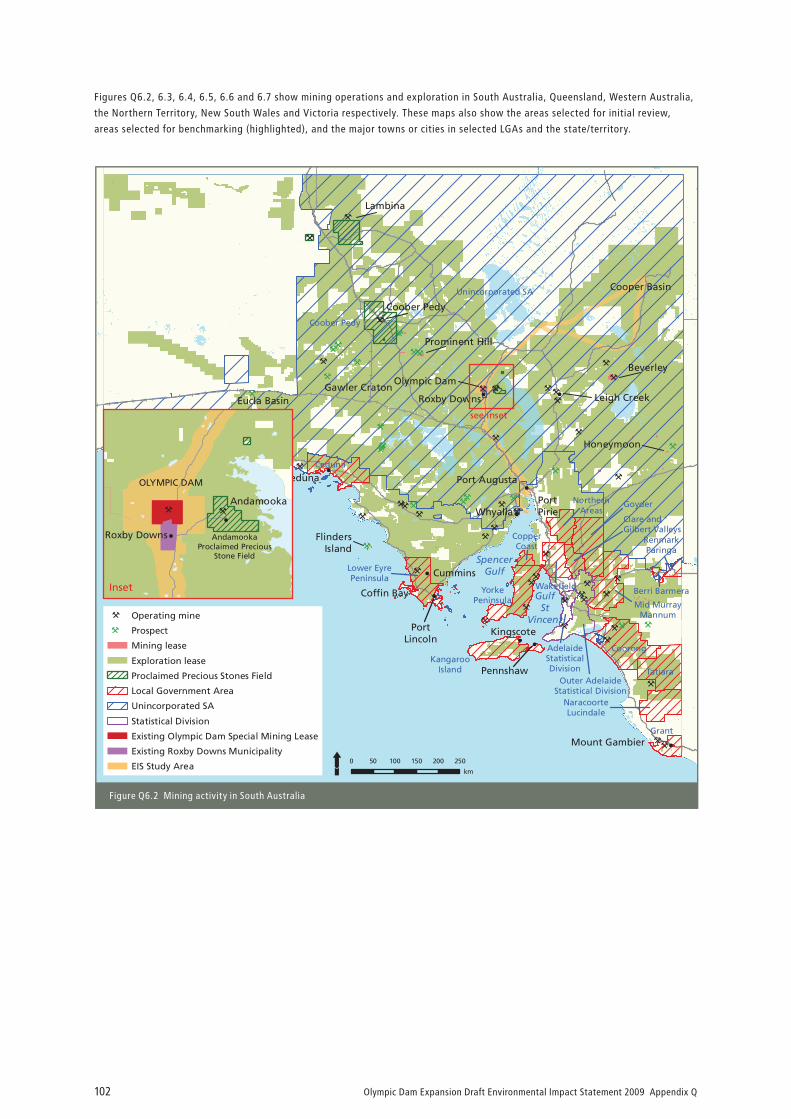
Figure Q6.2 Mining activity in South Australia
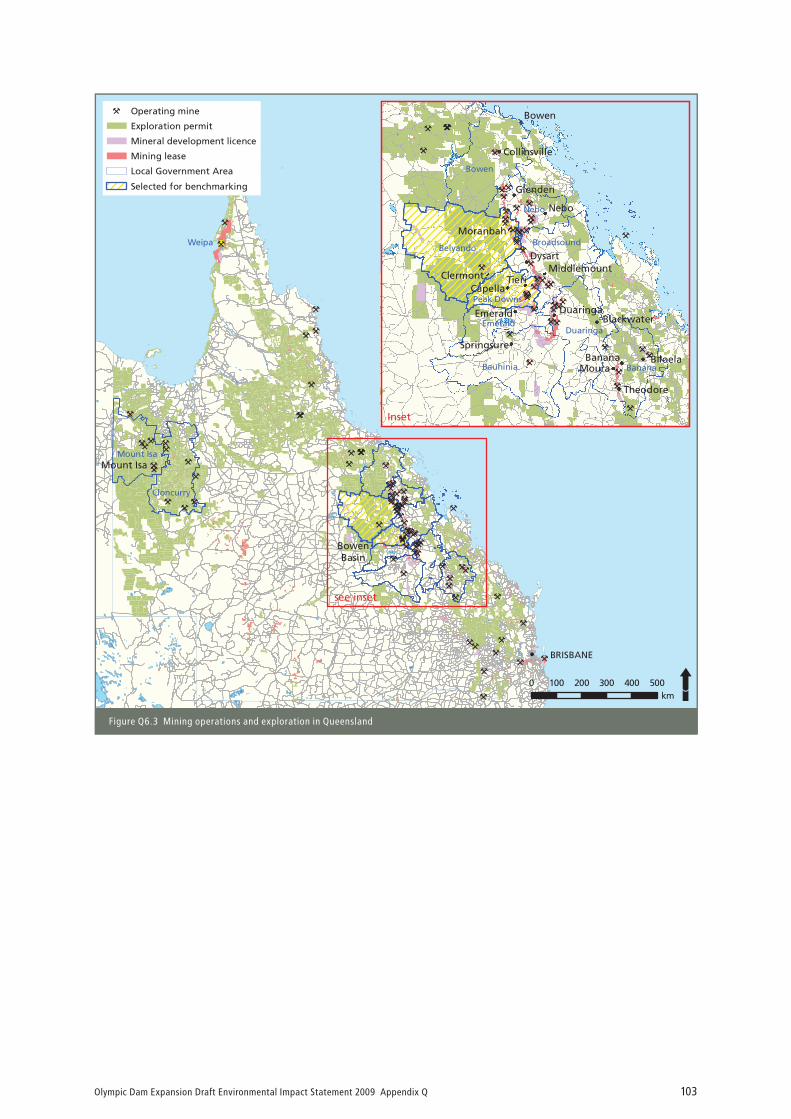
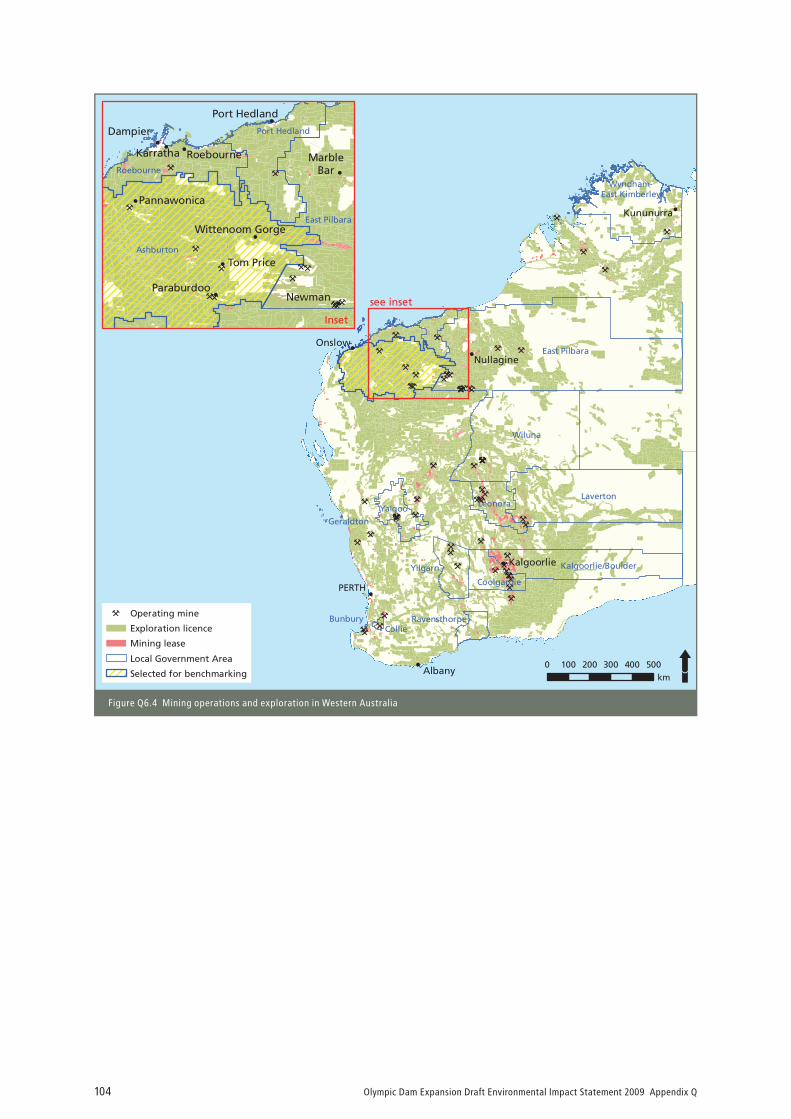
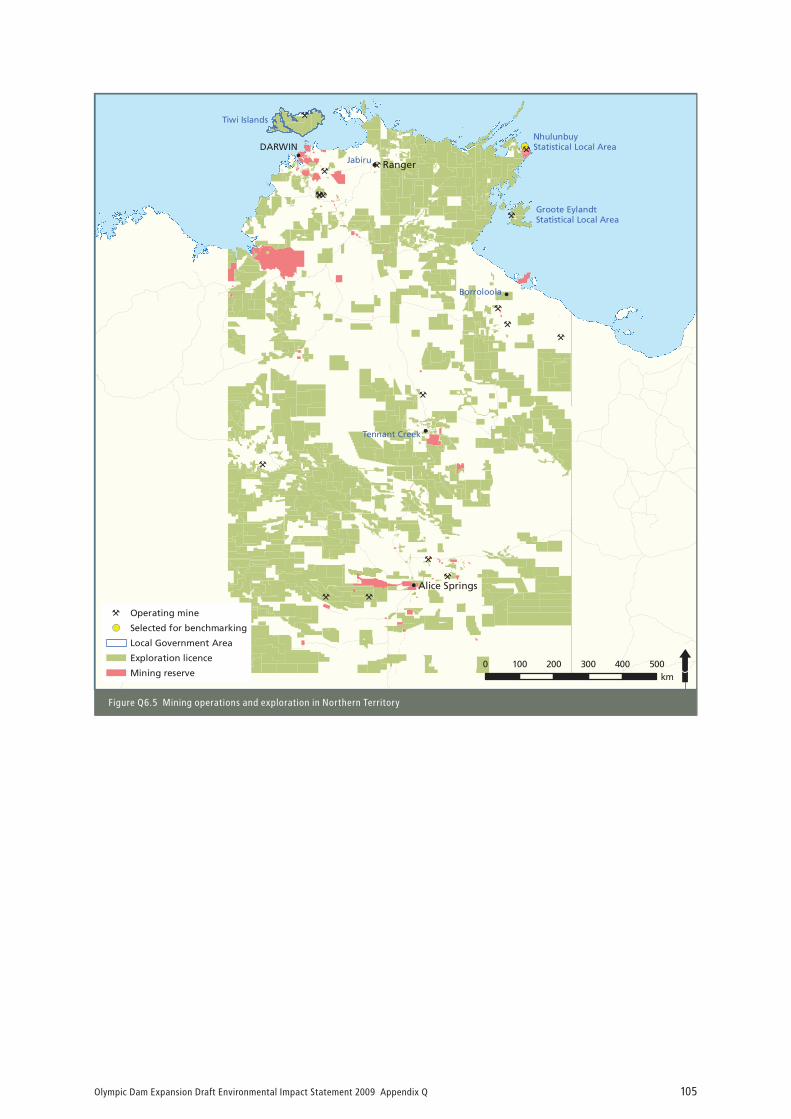
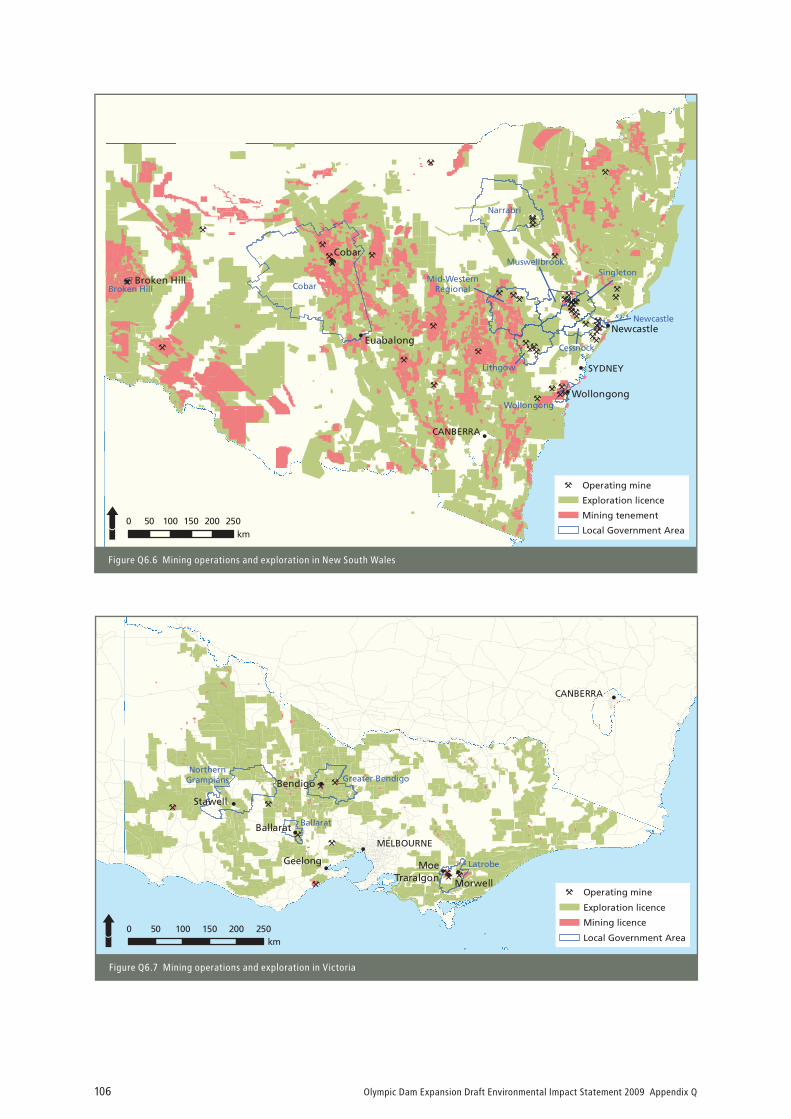
Figures Q6.2, 6.3, 6.4, 6.5, 6.6 and 6.7 show mining operations and exploration in South Australia, Queensland, Western Australia,
the Northern Territory, New South Wales and Victoria respectively. These maps also show the areas selected for initial review,
areas selected for benchmarking (highlighted), and the major towns or cities in selected LGAs and the state/territory.
Olympic Dam Expansion Draft Environmental Impact Statement 2009 Appendix Q 103
Mount Isa
BowenBasin
BRISBANE
Cloncurry
Mount Isa
Weipa
Banana
Duaringa
Bowen
Nebo
Moura
Tieri
Dysart
Emerald
Capella
Glenden
Theodore
Moranbah
Springsure
Blackwater
Collinsville
Clermont
Biloela
Middlemount
Belyando
Bowen
Bauhinia
Emerald
Banana
Duaringa
Broadsound
Nebo
Peak Downs
see inset
Inset
0 100 200 300 400 500km
Operating mine
Exploration permit
Mineral development licence
Mining lease
Local Government Area
Selected for benchmarking
Figure Q6.3 Mining operations and exploration in Queensland
Olympic Dam Expansion Draft Environmental Impact Statement 2009 Appendix Q104
Onslow
PERTH
Albany
Kununurra
Kalgoorlie
East Pilbara
Wiluna
Laverton
Kalgoorlie/Boulder
Wyndham-East Kimberley
Yilgarn
Leonora
Coolgardie
RavensthorpeBunbury
Yalgoo
Geraldton
Nullagine
Collie
0 100 200 300 400 500km
Operating mine
Exploration licence
Mining lease
Local Government Area
Selected for benchmarking
Newman
Dampier
Karratha
Tom Price
Paraburdoo
MarbleBar
Port Hedland
Wittenoom Gorge
Roebourne
Pannawonica
Ashburton
Port Hedland
Roebourne
East Pilbara
Inset
see inset
Figure Q6.4 Mining operations and exploration in Western Australia
Olympic Dam Expansion Draft Environmental Impact Statement 2009 Appendix Q 105
DARWIN
Alice Springs
Groote EylandtStatistical Local Area
NhulunbuyStatistical Local Area
Ranger
Tennant Creek
Borroloola
Jabiru
Tiwi Islands
0 100 200 300 400 500km
Operating mine
Selected for benchmarking
Local Government Area
Exploration licence
Mining reserve
Figure Q6.5 Mining operations and exploration in Northern Territory
Olympic Dam Expansion Draft Environmental Impact Statement 2009 Appendix Q106
Cobar
Wollongong
Broken Hill
Newcastle
SYDNEY
CANBERRA
Euabalong
Cobar
Narrabri
Mid-WesternRegional
Cessnock
Wollongong
Newcastle
Broken Hill
Lithgow
SingletonMuswellbrook
0 50 100 150 200 250km
Operating mine
Exploration licence
Mining tenement
Local Government Area
Figure Q6.6 Mining operations and exploration in New South Wales
Ballarat
Bendigo
CANBERRA
MELBOURNE
Morwell
Stawell
MoeTraralgon
Geelong
NorthernGrampians Greater Bendigo
Latrobe
Ballarat
0 50 100 150 200 250km
Operating mine
Exploration licence
Mining licence
Local Government Area
Figure Q6.7 Mining operations and exploration in Victoria

Olympic Dam Expansion Draft Environmental Impact Statement 2009 Appendix Q 107
Table Q6.1 outlines the criteria that were used to compare areas.
Table Q6.1 Selection criteria for benchmarking
Selection criteria Mining/other
(2006)1
Population size
(2006)2
Remoteness3 Towns in the LGA/
SLA4
Demography (2006)5
Considered for
benchmarking
Majority of the
working population
employed in mining
or mining related
(except in SA)
Between 3,000 and
12,000 people
Greater than 30% of
the population living
in a remote or very
remote area
5 or less towns in the
LGA
High compatibility
(see Table Q6.3)
1 2006 Census of Population and Housing, place of usual residence, industry of employment by occupation (ABS 2007b) and industry of employment – mining related industries (Quickstats, ABS 2007c). This criterion was not applied in the selection of LGAs for benchmarking in South Australia.
2 Estimated resident population (ABS 2007a). Only LGAs in regional South Australia (i.e. not in the Adelaide or Outer Adelaide Statistical Divisions) were included for review, with the exception of Kangaroo Island.
3 Proportion of the population living in a remote area, based on the 2001 Census of Population and Housing, National Regional Profiles (ABS 2006a).4 Based on local government reports and websites, and identified as urban centres, localities or suburbs by the ABS. 5 2006 Census of Population and Housing (ABS 2007b and 2007c).
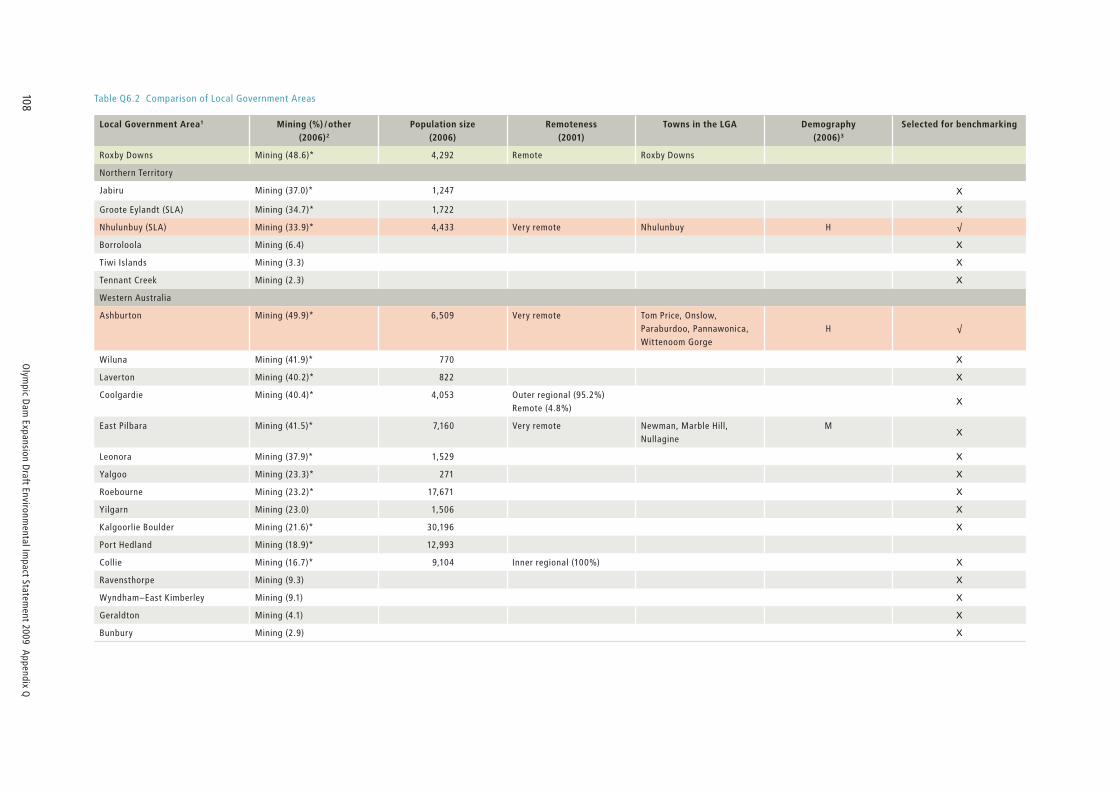
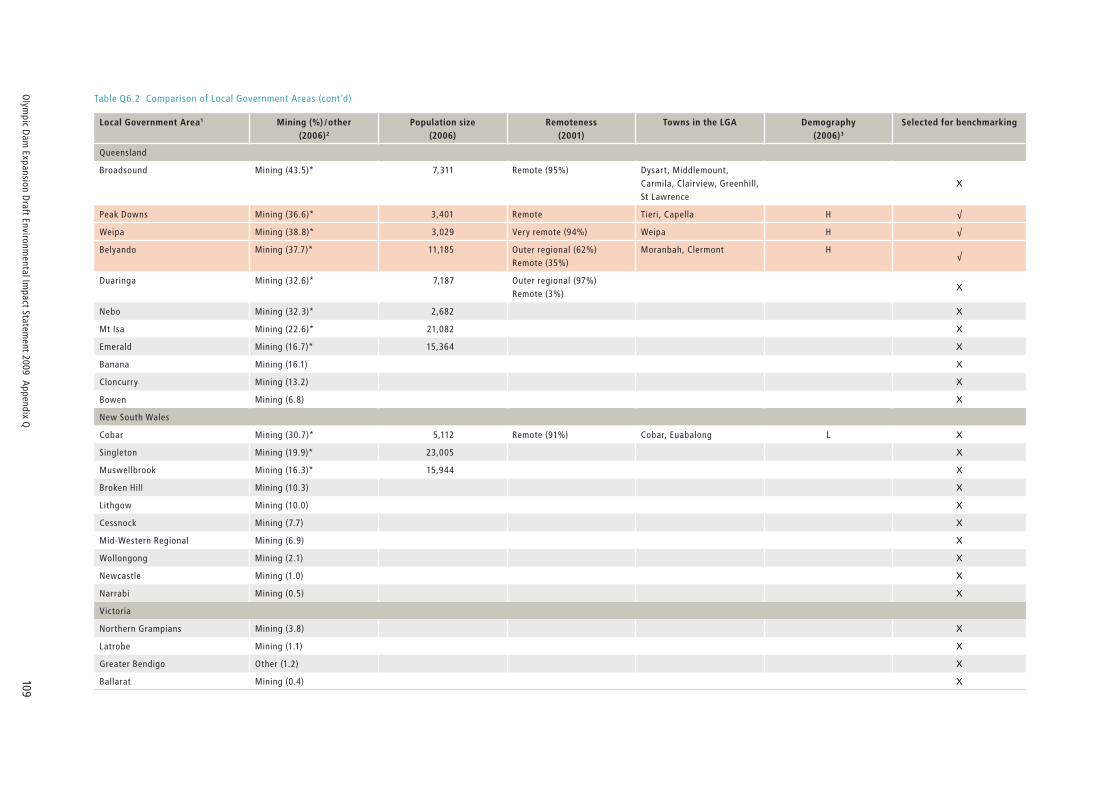
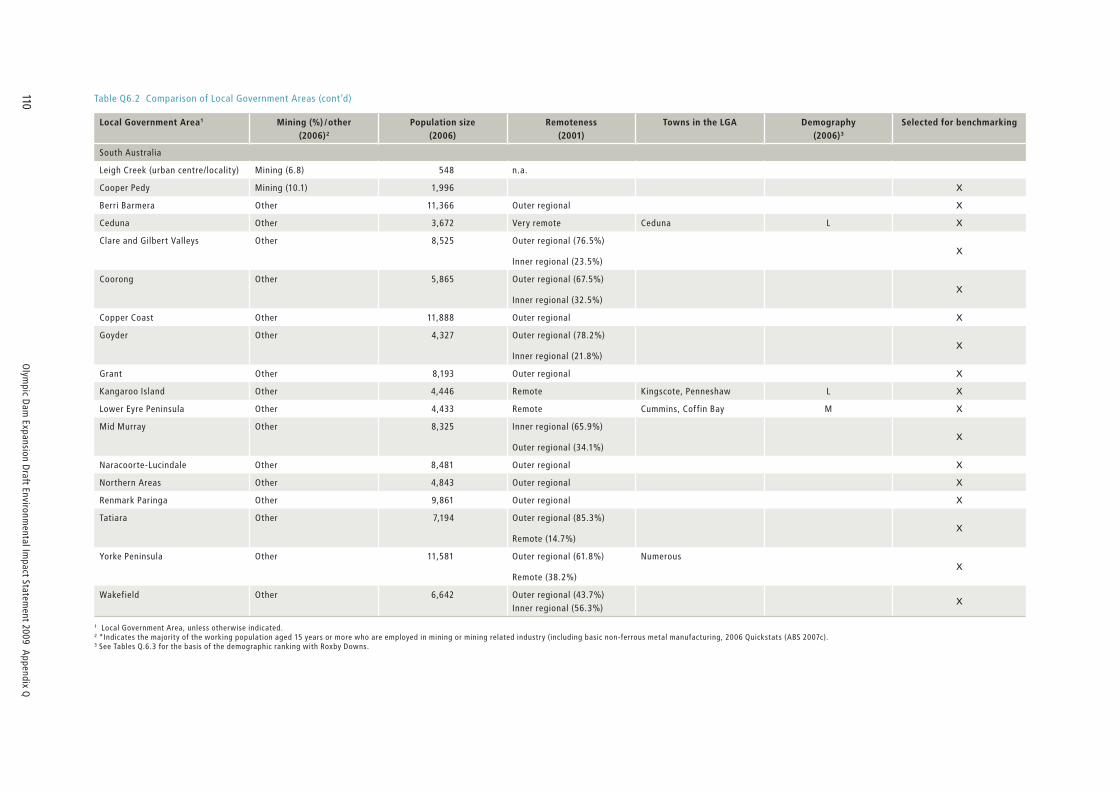
Table Q6.2 outlines the areas that were initially reviewed for benchmarking and shows the basis on which areas were
progressively selected (or rejected). Areas highlighted in Table Q6.2 have been selected for benchmarking, based on their
comparability to Roxby Downs.
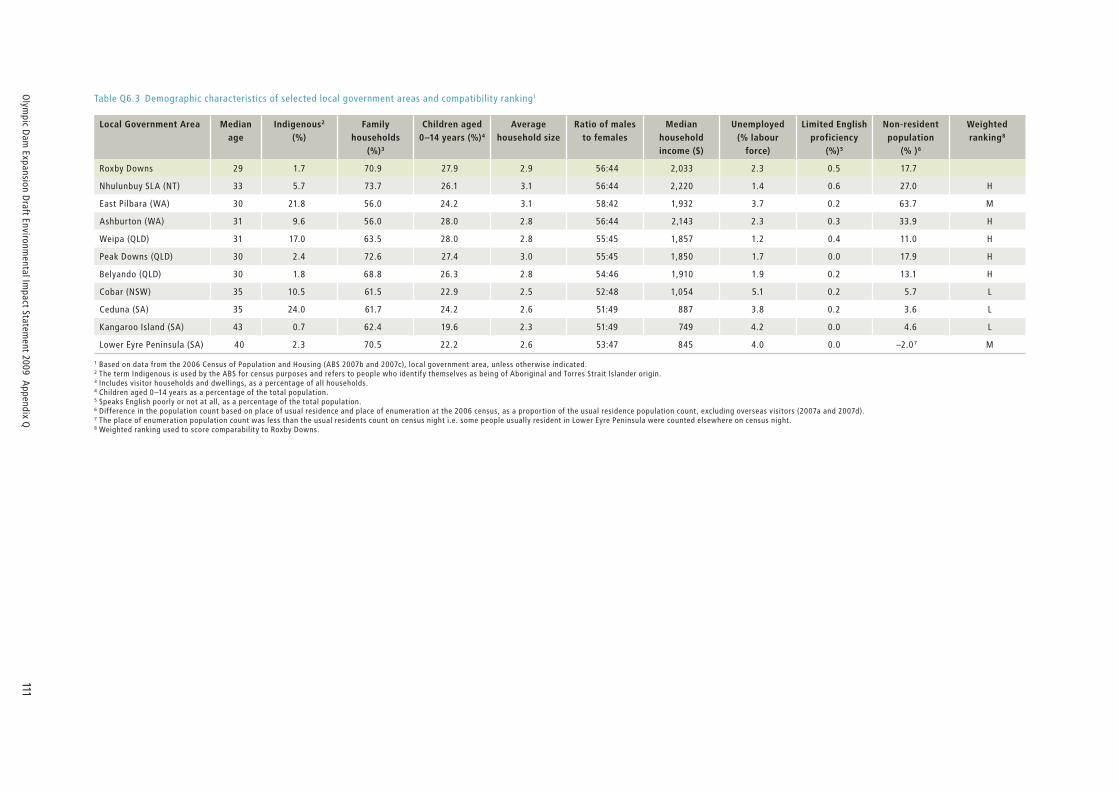
Table Q6.3 shows the demographic characteristics of areas initially considered most comparable to Roxby Downs, from which the
final selection was made. These characteristics reflect the distinctive demographic features of Roxby Downs, and are key factors
influencing the demand for social services. The final selection of areas was based on a weighted ranking of these demographic
characteristics and their similarity to Roxby Downs.
Based on this review, the following mining areas were selected for comparison with Roxby Downs:
Queensland: Peak Downs, Belyando and Weipa LGAs
Western Australia: Ashburton LGA
Northern Territory: Nhulunbuy SLA.
•
•
•
Olym
pic D
am
Exp
an
sion
Dra
ft En
viron
men
tal Im
pa
ct State
men
t 200
9 A
pp
en
dix Q
108 Table Q6.2 Comparison of Local Government Areas
Local Government Area1 Mining (%) /other
(2006)2
Population size
(2006)
Remoteness
(2001)
Towns in the LGA Demography
(2006)3
Selected for benchmarking
Roxby Downs Mining (48.6)* 4,292 Remote Roxby Downs
Northern Territory
Jabiru Mining (37.0)* 1,247 X
Groote Eylandt (SLA) Mining (34.7)* 1,722 X
Nhulunbuy (SLA) Mining (33.9)* 4,433 Very remote Nhulunbuy H √
Borroloola Mining (6.4) X
Tiwi Islands Mining (3.3) X
Tennant Creek Mining (2.3) X
Western Australia
Ashburton Mining (49.9)* 6,509 Very remote Tom Price, Onslow,
Paraburdoo, Pannawonica,
Wittenoom Gorge
H √
Wiluna Mining (41.9)* 770 X
Laverton Mining (40.2)* 822 X
Coolgardie Mining (40.4)* 4,053 Outer regional (95.2%)
Remote (4.8%)X
East Pilbara Mining (41.5)* 7,160 Very remote Newman, Marble Hill,
Nullagine
MX
Leonora Mining (37.9)* 1,529 X
Yalgoo Mining (23.3)* 271 X
Roebourne Mining (23.2)* 17,671 X
Yilgarn Mining (23.0) 1,506 X
Kalgoorlie Boulder Mining (21.6)* 30,196 X
Port Hedland Mining (18.9)* 12,993
Collie Mining (16.7)* 9,104 Inner regional (100%) X
Ravensthorpe Mining (9.3) X
Wyndham–East Kimberley Mining (9.1) X
Geraldton Mining (4.1) X
Bunbury Mining (2.9) X
Olym
pic D
am
Exp
an
sion
Dra
ft En
viron
men
tal Im
pa
ct State
men
t 200
9 A
pp
en
dix Q
109
Local Government Area1 Mining (%) /other
(2006)2
Population size
(2006)
Remoteness
(2001)
Towns in the LGA Demography
(2006)3
Selected for benchmarking
Queensland
Broadsound Mining (43.5)* 7,311 Remote (95%) Dysart, Middlemount,
Carmila, Clairview, Greenhill,
St Lawrence
X
Peak Downs Mining (36.6)* 3,401 Remote Tieri, Capella H √
Weipa Mining (38.8)* 3,029 Very remote (94%) Weipa H √
Belyando Mining (37.7)* 11,185 Outer regional (62%)
Remote (35%)
Moranbah, Clermont H√
Duaringa Mining (32.6)* 7,187 Outer regional (97%)
Remote (3%)X
Nebo Mining (32.3)* 2,682 X
Mt Isa Mining (22.6)* 21,082 X
Emerald Mining (16.7)* 15,364 X
Banana Mining (16.1) X
Cloncurry Mining (13.2) X
Bowen Mining (6.8) X
New South Wales
Cobar Mining (30.7)* 5,112 Remote (91%) Cobar, Euabalong L X
Singleton Mining (19.9)* 23,005 X
Muswellbrook Mining (16.3)* 15,944 X
Broken Hill Mining (10.3) X
Lithgow Mining (10.0) X
Cessnock Mining (7.7) X
Mid-Western Regional Mining (6.9) X
Wollongong Mining (2.1) X
Newcastle Mining (1.0) X
Narrabi Mining (0.5) X
Victoria
Northern Grampians Mining (3.8) X
Latrobe Mining (1.1) X
Greater Bendigo Other (1.2) X
Ballarat Mining (0.4) X
Table Q6.2 Comparison of Local Government Areas (cont’d)
Olym
pic D
am
Exp
an
sion
Dra
ft En
viron
men
tal Im
pa
ct State
men
t 200
9 A
pp
en
dix Q
110
Local Government Area1 Mining (%) /other
(2006)2
Population size
(2006)
Remoteness
(2001)
Towns in the LGA Demography
(2006)3
Selected for benchmarking
South Australia
Leigh Creek (urban centre/locality) Mining (6.8) 548 n.a.
Cooper Pedy Mining (10.1) 1,996 X
Berri Barmera Other 11,366 Outer regional X
Ceduna Other 3,672 Very remote Ceduna L X
Clare and Gilbert Valleys Other 8,525 Outer regional (76.5%)
Inner regional (23.5%)X
Coorong Other 5,865 Outer regional (67.5%)
Inner regional (32.5%)X
Copper Coast Other 11,888 Outer regional X
Goyder Other 4,327 Outer regional (78.2%)
Inner regional (21.8%)X
Grant Other 8,193 Outer regional X
Kangaroo Island Other 4,446 Remote Kingscote, Penneshaw L X
Lower Eyre Peninsula Other 4,433 Remote Cummins, Coffin Bay M X
Mid Murray Other 8,325 Inner regional (65.9%)
Outer regional (34.1%)X
Naracoorte-Lucindale Other 8,481 Outer regional X
Northern Areas Other 4,843 Outer regional X
Renmark Paringa Other 9,861 Outer regional X
Tatiara Other 7,194 Outer regional (85.3%)
Remote (14.7%)X
Yorke Peninsula Other 11,581 Outer regional (61.8%)
Remote (38.2%)
Numerous X
Wakefield Other 6,642 Outer regional (43.7%)
Inner regional (56.3%) X
1 Local Government Area, unless otherwise indicated.2 *Indicates the majority of the working population aged 15 years or more who are employed in mining or mining related industry (including basic non-ferrous metal manufacturing, 2006 Quickstats (ABS 2007c).3 See Tables Q.6.3 for the basis of the demographic ranking with Roxby Downs.
Table Q6.2 Comparison of Local Government Areas (cont’d)
Olym
pic D
am
Exp
an
sion
Dra
ft En
viron
men
tal Im
pa
ct State
men
t 200
9 A
pp
en
dix Q
111
Table Q6.3 Demographic characteristics of selected local government areas and compatibility ranking1
Local Government Area Median
age
Indigenous2
(%)
Family
households
(%)3
Children aged
0–14 years (%)4
Average
household size
Ratio of males
to females
Median
household
income ($)
Unemployed
(% labour
force)
Limited English
proficiency
(%)5
Non-resident
population
(% )6
Weighted
ranking8
Roxby Downs 29 1.7 70.9 27.9 2.9 56:44 2,033 2.3 0.5 17.7
Nhulunbuy SLA (NT) 33 5.7 73.7 26.1 3.1 56:44 2,220 1.4 0.6 27.0 H
East Pilbara (WA) 30 21.8 56.0 24.2 3.1 58:42 1,932 3.7 0.2 63.7 M
Ashburton (WA) 31 9.6 56.0 28.0 2.8 56:44 2,143 2.3 0.3 33.9 H
Weipa (QLD) 31 17.0 63.5 28.0 2.8 55:45 1,857 1.2 0.4 11.0 H
Peak Downs (QLD) 30 2.4 72.6 27.4 3.0 55:45 1,850 1.7 0.0 17.9 H
Belyando (QLD) 30 1.8 68.8 26.3 2.8 54:46 1,910 1.9 0.2 13.1 H
Cobar (NSW) 35 10.5 61.5 22.9 2.5 52:48 1,054 5.1 0.2 5.7 L
Ceduna (SA) 35 24.0 61.7 24.2 2.6 51:49 887 3.8 0.2 3.6 L
Kangaroo Island (SA) 43 0.7 62.4 19.6 2.3 51:49 749 4.2 0.0 4.6 L
Lower Eyre Peninsula (SA) 40 2.3 70.5 22.2 2.6 53:47 845 4.0 0.0 –2.07 M
1 Based on data from the 2006 Census of Population and Housing (ABS 2007b and 2007c), local government area, unless otherwise indicated.2 The term Indigenous is used by the ABS for census purposes and refers to people who identify themselves as being of Aboriginal and Torres Strait Islander origin.3 Includes visitor households and dwellings, as a percentage of all households. 4 Children aged 0–14 years as a percentage of the total population.5 Speaks English poorly or not at all, as a percentage of the total population.6 Difference in the population count based on place of usual residence and place of enumeration at the 2006 census, as a proportion of the usual residence population count, excluding overseas visitors (2007a and 2007d). 7 The place of enumeration population count was less than the usual residents count on census night i.e. some people usually resident in Lower Eyre Peninsula were counted elsewhere on census night.8 Weighted ranking used to score comparability to Roxby Downs.
Olympic Dam Expansion Draft Environmental Impact Statement 2009 Appendix Q112
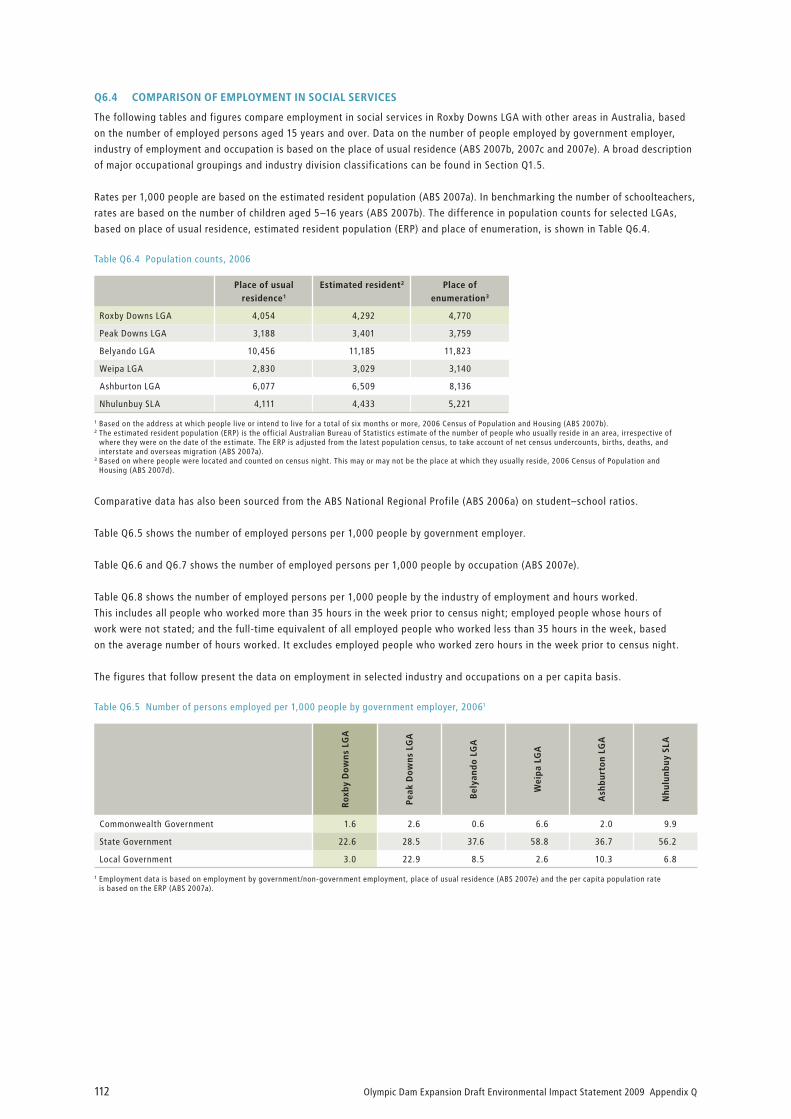
Q6.4 COMPARISON OF EMPLOYMENT IN SOCIAL SERVICES
The following tables and figures compare employment in social services in Roxby Downs LGA with other areas in Australia, based
on the number of employed persons aged 15 years and over. Data on the number of people employed by government employer,
industry of employment and occupation is based on the place of usual residence (ABS 2007b, 2007c and 2007e). A broad description
of major occupational groupings and industry division classifications can be found in Section Q1.5.
Rates per 1,000 people are based on the estimated resident population (ABS 2007a). In benchmarking the number of schoolteachers,
rates are based on the number of children aged 5–16 years (ABS 2007b). The difference in population counts for selected LGAs,
based on place of usual residence, estimated resident population (ERP) and place of enumeration, is shown in Table Q6.4.
Table Q6.4 Population counts, 2006
Place of usual
residence1
Estimated resident2 Place of
enumeration3
Roxby Downs LGA 4,054 4,292 4,770
Peak Downs LGA 3,188 3,401 3,759
Belyando LGA 10,456 11,185 11,823
Weipa LGA 2,830 3,029 3,140
Ashburton LGA 6,077 6,509 8,136
Nhulunbuy SLA 4,111 4,433 5,221
1 Based on the address at which people live or intend to live for a total of six months or more, 2006 Census of Population and Housing (ABS 2007b). 2 The estimated resident population (ERP) is the official Australian Bureau of Statistics estimate of the number of people who usually reside in an area, irrespective of
where they were on the date of the estimate. The ERP is adjusted from the latest population census, to take account of net census undercounts, births, deaths, and interstate and overseas migration (ABS 2007a).
3 Based on where people were located and counted on census night. This may or may not be the place at which they usually reside, 2006 Census of Population andHousing (ABS 2007d).
Comparative data has also been sourced from the ABS National Regional Profile (ABS 2006a) on student–school ratios.
Table Q6.5 shows the number of employed persons per 1,000 people by government employer.
Table Q6.6 and Q6.7 shows the number of employed persons per 1,000 people by occupation (ABS 2007e).
Table Q6.8 shows the number of employed persons per 1,000 people by the industry of employment and hours worked.
This includes all people who worked more than 35 hours in the week prior to census night; employed people whose hours of
work were not stated; and the full-time equivalent of all employed people who worked less than 35 hours in the week, based
on the average number of hours worked. It excludes employed people who worked zero hours in the week prior to census night.
The figures that follow present the data on employment in selected industry and occupations on a per capita basis.
Table Q6.5 Number of persons employed per 1,000 people by government employer, 20061
Ro
xb
y D
ow
ns
LGA
Pe
ak
Do
wn
s LG
A
Be
lya
nd
o L
GA
We
ipa
LG
A
Ash
bu
rto
n L
GA
Nh
ulu
nb
uy S
LA
Commonwealth Government 1.6 2.6 0.6 6.6 2.0 9.9
State Government 22.6 28.5 37.6 58.8 36.7 56.2
Local Government 3.0 22.9 8.5 2.6 10.3 6.8
1 Employment data is based on employment by government/non-government employment, place of usual residence (ABS 2007e) and the per capita population rateis based on the ERP (ABS 2007a).
Olympic Dam Expansion Draft Environmental Impact Statement 2009 Appendix Q 113
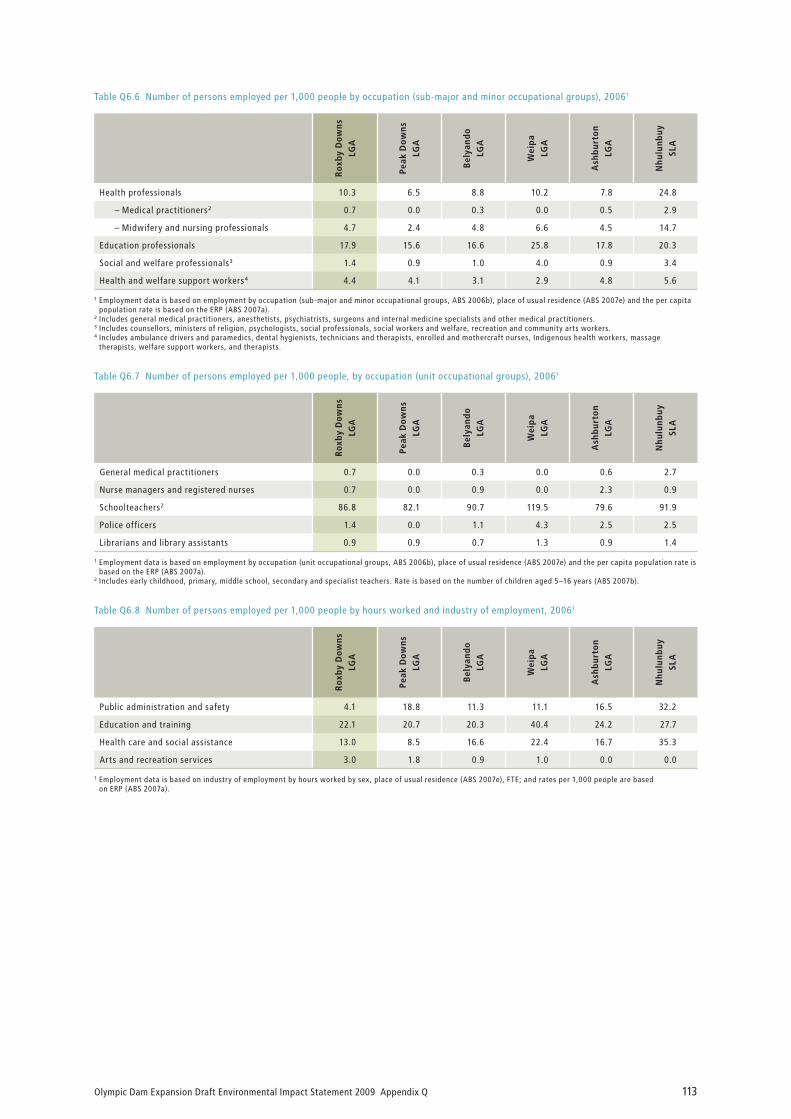
Table Q6.6 Number of persons employed per 1,000 people by occupation (sub-major and minor occupational groups), 20061
Ro
xb
y D
ow
ns
LGA
Pe
ak
Do
wn
s
LGA
Be
lya
nd
o
LGA
We
ipa
LGA
Ash
bu
rto
n
LGA
Nh
ulu
nb
uy
SL
A
Health professionals 10.3 6.5 8.8 10.2 7.8 24.8
– Medical practitioners2 0.7 0.0 0.3 0.0 0.5 2.9
– Midwifery and nursing professionals 4.7 2.4 4.8 6.6 4.5 14.7
Education professionals 17.9 15.6 16.6 25.8 17.8 20.3
Social and welfare professionals3 1.4 0.9 1.0 4.0 0.9 3.4
Health and welfare support workers4 4.4 4.1 3.1 2.9 4.8 5.6
1 Employment data is based on employment by occupation (sub-major and minor occupational groups, ABS 2006b), place of usual residence (ABS 2007e) and the per capita population rate is based on the ERP (ABS 2007a).
2 Includes general medical practitioners, anesthetists, psychiatrists, surgeons and internal medicine specialists and other medical practitioners. 3 Includes counsellors, ministers of religion, psychologists, social professionals, social workers and welfare, recreation and community arts workers.4 Includes ambulance drivers and paramedics, dental hygienists, technicians and therapists, enrolled and mothercraft nurses, Indigenous health workers, massage
therapists, welfare support workers, and therapists.
Table Q6.7 Number of persons employed per 1,000 people, by occupation (unit occupational groups), 20061
Ro
xb
y D
ow
ns
LGA
Pe
ak
Do
wn
s
LGA
Be
lya
nd
o
LGA
We
ipa
LGA
Ash
bu
rto
n
LGA
Nh
ulu
nb
uy
SL
A
General medical practitioners 0.7 0.0 0.3 0.0 0.6 2.7
Nurse managers and registered nurses 0.7 0.0 0.9 0.0 2.3 0.9
Schoolteachers2 86.8 82.1 90.7 119.5 79.6 91.9
Police officers 1.4 0.0 1.1 4.3 2.5 2.5
Librarians and library assistants 0.9 0.9 0.7 1.3 0.9 1.4
1 Employment data is based on employment by occupation (unit occupational groups, ABS 2006b), place of usual residence (ABS 2007e) and the per capita population rate is based on the ERP (ABS 2007a).
2 Includes early childhood, primary, middle school, secondary and specialist teachers. Rate is based on the number of children aged 5–16 years (ABS 2007b).
Table Q6.8 Number of persons employed per 1,000 people by hours worked and industry of employment, 20061
Ro
xb
y D
ow
ns
LGA
Pe
ak
Do
wn
s
LGA
Be
lya
nd
o
LGA
We
ipa
LGA
Ash
bu
rto
n
LGA
Nh
ulu
nb
uy
SL
A
Public administration and safety 4.1 18.8 11.3 11.1 16.5 32.2
Education and training 22.1 20.7 20.3 40.4 24.2 27.7
Health care and social assistance 13.0 8.5 16.6 22.4 16.7 35.3
Arts and recreation services 3.0 1.8 0.9 1.0 0.0 0.0
1 Employment data is based on industry of employment by hours worked by sex, place of usual residence (ABS 2007e), FTE; and rates per 1,000 people are basedon ERP (ABS 2007a).
Olympic Dam Expansion Draft Environmental Impact Statement 2009 Appendix Q114
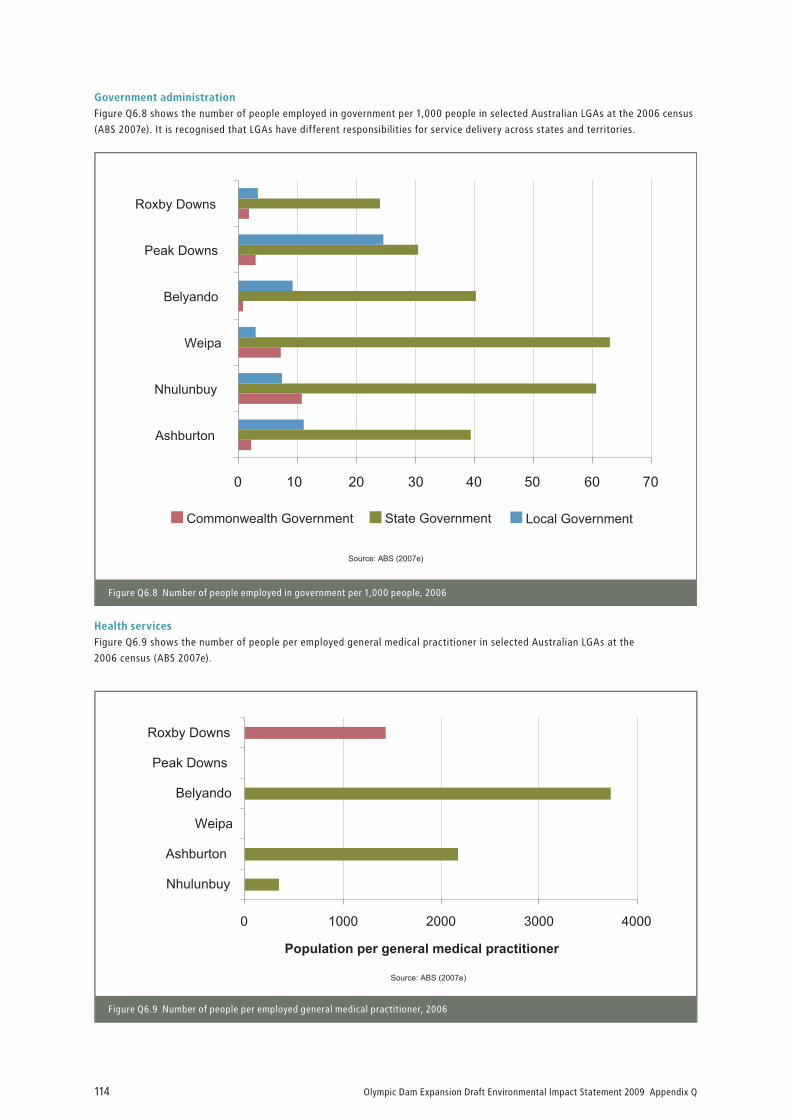
Government administration
Figure Q6.8 shows the number of people employed in government per 1,000 people in selected Australian LGAs at the 2006 census
(ABS 2007e). It is recognised that LGAs have different responsibilities for service delivery across states and territories.
Health services
Figure Q6.9 shows the number of people per employed general medical practitioner in selected Australian LGAs at the
2006 census (ABS 2007e).
Source: ABS (2007e)
0 1000 2000 3000 4000
Nhulunbuy
Ashburton
Weipa
Belyando
Peak Downs
Roxby Downs
Population per general medical practitioner
Figure Q6.9 Number of people per employed general medical practitioner, 2006
Source: ABS (2007e)
0 10 20 30 40 50 60 70
Ashburton
Nhulunbuy
Weipa
Belyando
Peak Downs
Roxby Downs
Commonwealth Government State Government Local Government
Figure Q6.8 Number of people employed in government per 1,000 people, 2006
Olympic Dam Expansion Draft Environmental Impact Statement 2009 Appendix Q 115
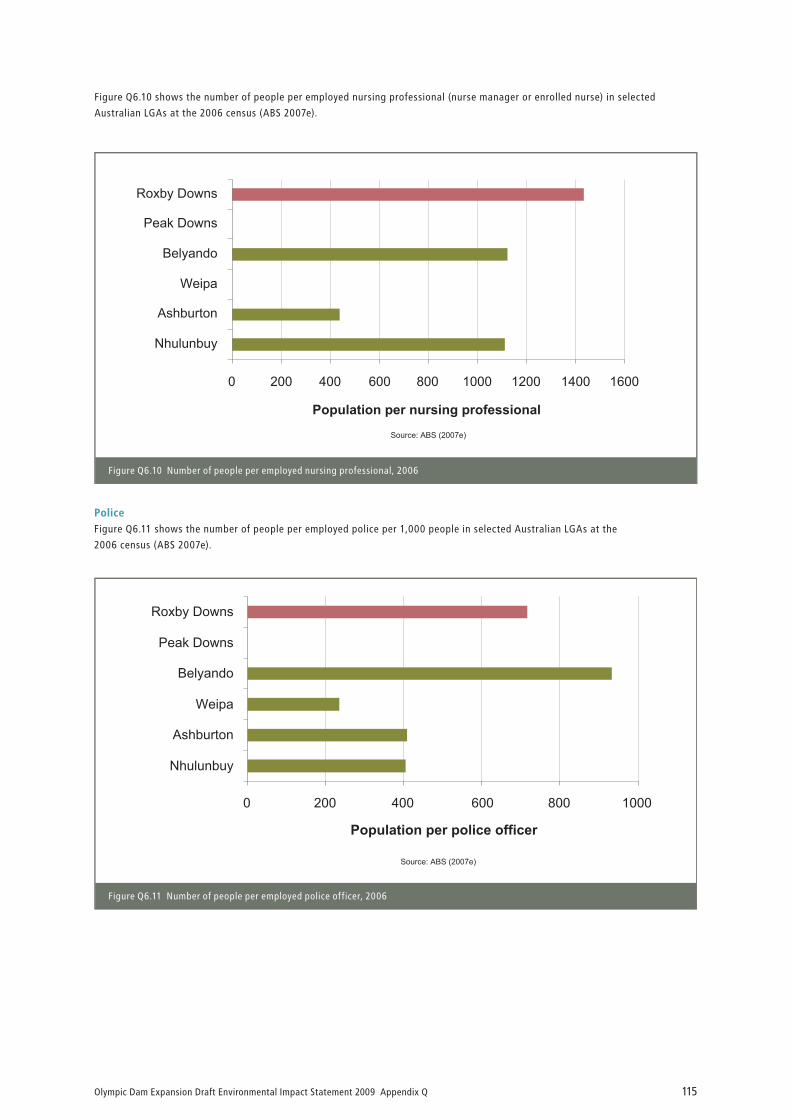
Police
Figure Q6.11 shows the number of people per employed police per 1,000 people in selected Australian LGAs at the
2006 census (ABS 2007e).
Source: ABS (2007e)
Population per nursing professional
0 200 400 600 800 1000 1200 1400 1600
Nhulunbuy
Ashburton
Weipa
Belyando
Peak Downs
Roxby Downs
Figure Q6.10 Number of people per employed nursing professional, 2006
Figure Q6.10 shows the number of people per employed nursing professional (nurse manager or enrolled nurse) in selected
Australian LGAs at the 2006 census (ABS 2007e).
Source: ABS (2007e)
0 200 400 600 800 1000
Nhulunbuy
Ashburton
Weipa
Belyando
Peak Downs
Roxby Downs
Population per police officer
Figure Q6.11 Number of people per employed police officer, 2006
Olympic Dam Expansion Draft Environmental Impact Statement 2009 Appendix Q116
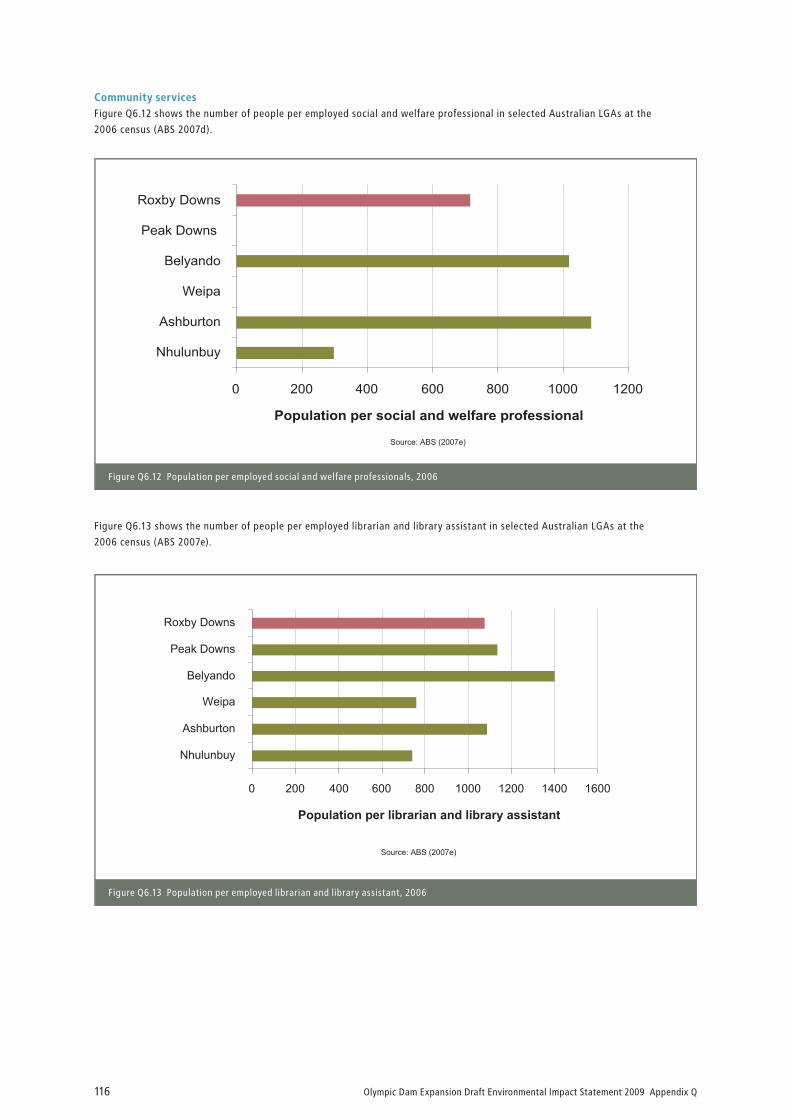
Community services
Figure Q6.12 shows the number of people per employed social and welfare professional in selected Australian LGAs at the
2006 census (ABS 2007d).
Source: ABS (2007e)
0 200 400 600 800 1000 1200
Nhulunbuy
Ashburton
Weipa
Belyando
Peak Downs
Roxby Downs
Population per social and welfare professional
Figure Q6.12 Population per employed social and welfare professionals, 2006
Figure Q6.13 shows the number of people per employed librarian and library assistant in selected Australian LGAs at the
2006 census (ABS 2007e).
Source: ABS (2007e)
Population per librarian and library assistant
0 200 400 600 800 1000 1200 1400 1600
Nhulunbuy
Ashburton
Weipa
Belyando
Peak Downs
Roxby Downs
Figure Q6.13 Population per employed librarian and library assistant, 2006
Olympic Dam Expansion Draft Environmental Impact Statement 2009 Appendix Q 117
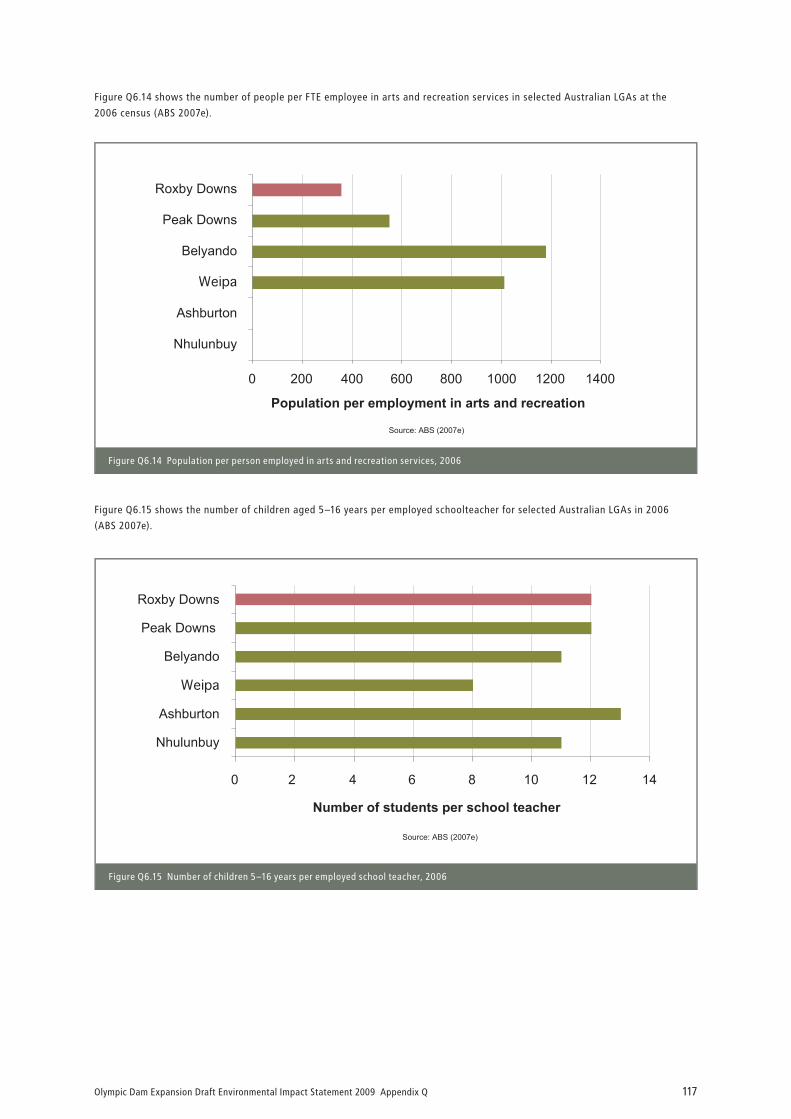
Figure Q6.15 shows the number of children aged 5–16 years per employed schoolteacher for selected Australian LGAs in 2006
(ABS 2007e).
Source: ABS (2007e)
0 200 400 600 800 1000 1200 1400
Nhulunbuy
Ashburton
Weipa
Belyando
Peak Downs
Roxby Downs
Population per employment in arts and recreation
Figure Q6.14 Population per person employed in arts and recreation services, 2006
Figure Q6.14 shows the number of people per FTE employee in arts and recreation services in selected Australian LGAs at the
2006 census (ABS 2007e).
Source: ABS (2007e)
Number of students per school teacher
0 2 4 6 8 10 12 14
Nhulunbuy
Ashburton
Weipa
Belyando
Peak Downs
Roxby Downs
Figure Q6.15 Number of children 5–16 years per employed school teacher, 2006
Olympic Dam Expansion Draft Environmental Impact Statement 2009 Appendix Q118
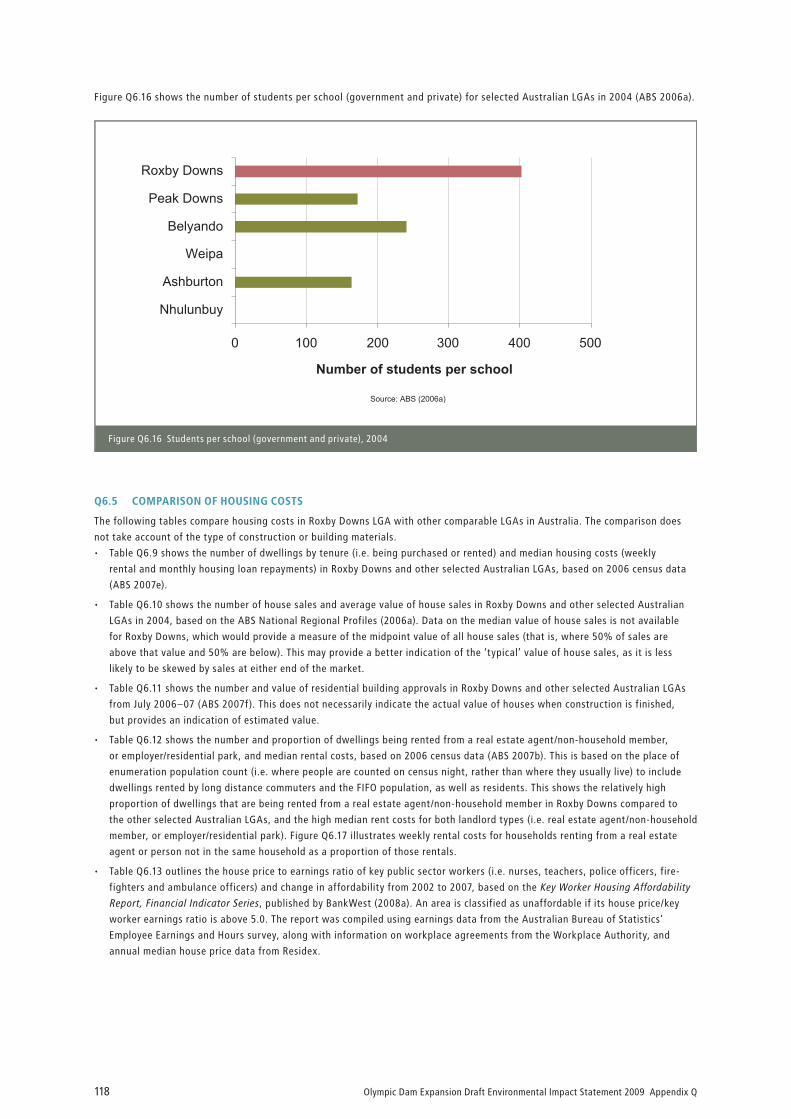
Figure Q6.16 shows the number of students per school (government and private) for selected Australian LGAs in 2004 (ABS 2006a).
Source: ABS (2006a)
0 100 200 300 400 500
Nhulunbuy
Ashburton
Weipa
Belyando
Peak Downs
Roxby Downs
Number of students per school
Figure Q6.16 Students per school (government and private), 2004
Q6.5 COMPARISON OF HOUSING COSTS
The following tables compare housing costs in Roxby Downs LGA with other comparable LGAs in Australia. The comparison does
not take account of the type of construction or building materials.
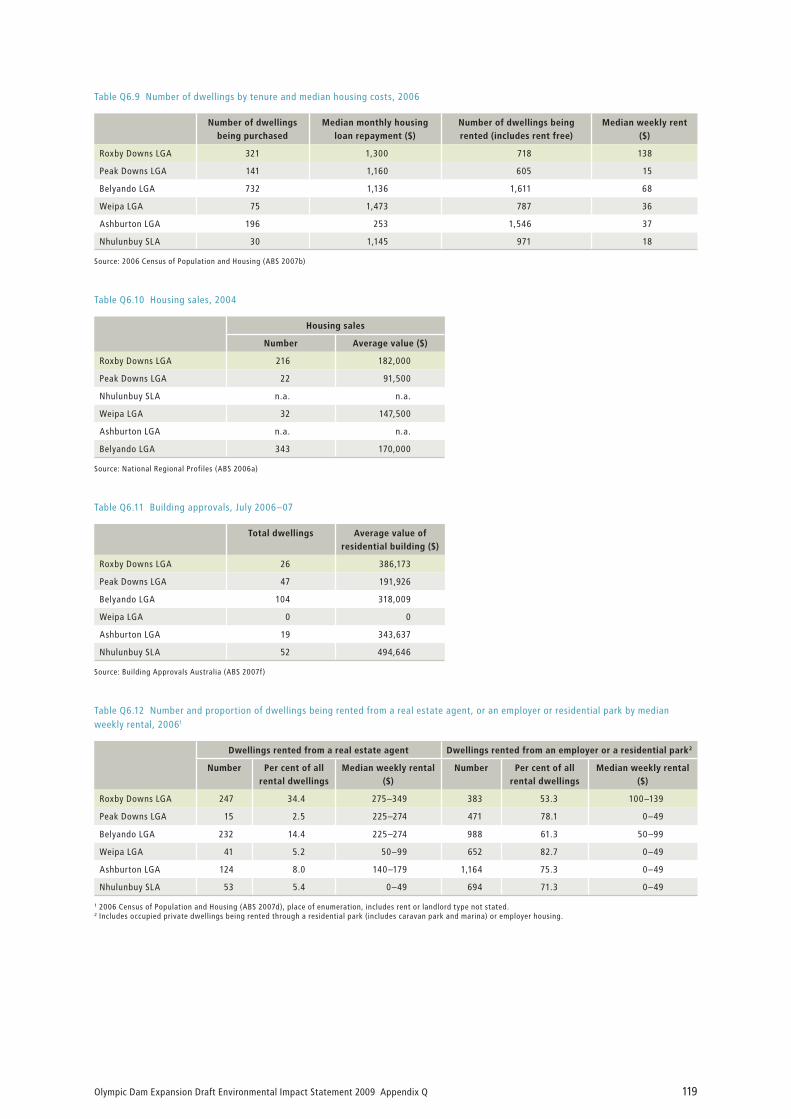
Table Q6.9 shows the number of dwellings by tenure (i.e. being purchased or rented) and median housing costs (weekly
rental and monthly housing loan repayments) in Roxby Downs and other selected Australian LGAs, based on 2006 census data
(ABS 2007e).
Table Q6.10 shows the number of house sales and average value of house sales in Roxby Downs and other selected Australian
LGAs in 2004, based on the ABS National Regional Profiles (2006a). Data on the median value of house sales is not available
for Roxby Downs, which would provide a measure of the midpoint value of all house sales (that is, where 50% of sales are
above that value and 50% are below). This may provide a better indication of the ‘typical’ value of house sales, as it is less
likely to be skewed by sales at either end of the market.
Table Q6.11 shows the number and value of residential building approvals in Roxby Downs and other selected Australian LGAs
from July 2006–07 (ABS 2007f). This does not necessarily indicate the actual value of houses when construction is finished,
but provides an indication of estimated value.
Table Q6.12 shows the number and proportion of dwellings being rented from a real estate agent/non-household member,
or employer/residential park, and median rental costs, based on 2006 census data (ABS 2007b). This is based on the place of
enumeration population count (i.e. where people are counted on census night, rather than where they usually live) to include
dwellings rented by long distance commuters and the FIFO population, as well as residents. This shows the relatively high
proportion of dwellings that are being rented from a real estate agent/non-household member in Roxby Downs compared to
the other selected Australian LGAs, and the high median rent costs for both landlord types (i.e. real estate agent/non-household
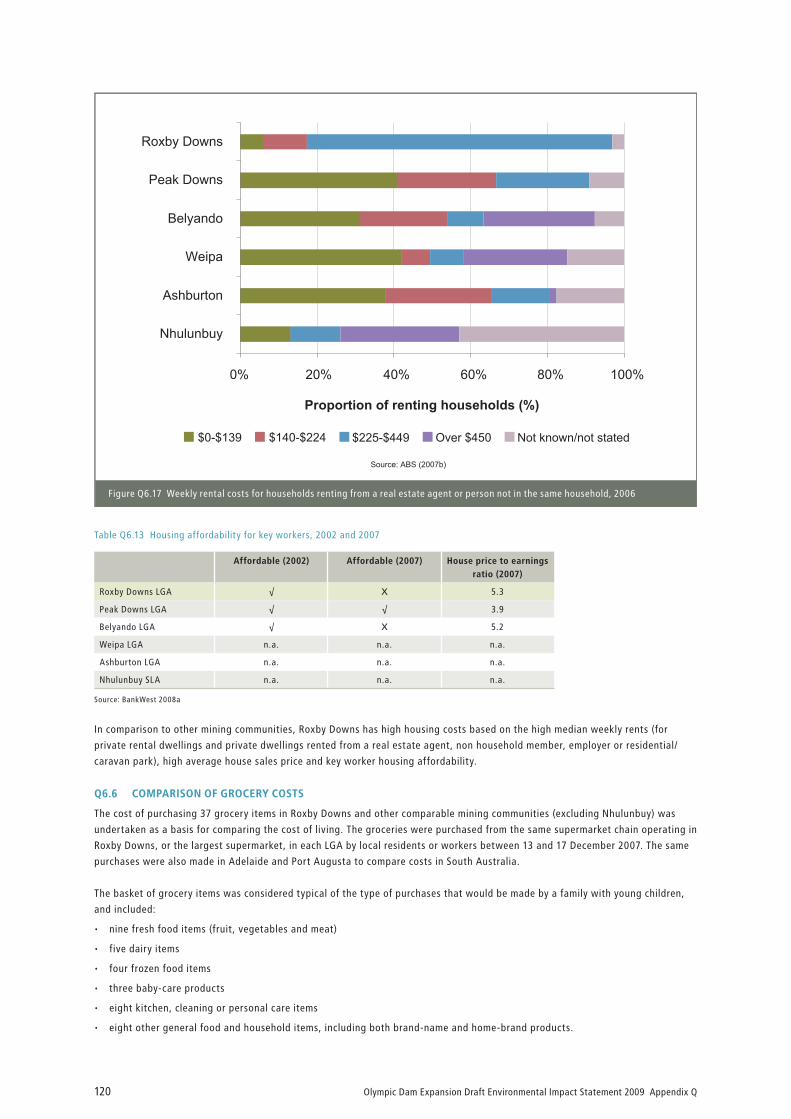
member, or employer/residential park). Figure Q6.17 illustrates weekly rental costs for households renting from a real estate
agent or person not in the same household as a proportion of those rentals.
Table Q6.13 outlines the house price to earnings ratio of key public sector workers (i.e. nurses, teachers, police officers, fire-
fighters and ambulance officers) and change in affordability from 2002 to 2007, based on the Key Worker Housing Affordability
Report, Financial Indicator Series, published by BankWest (2008a). An area is classified as unaffordable if its house price/key
worker earnings ratio is above 5.0. The report was compiled using earnings data from the Australian Bureau of Statistics’
Employee Earnings and Hours survey, along with information on workplace agreements from the Workplace Authority, and
annual median house price data from Residex.
•
•
•
•
•
Olympic Dam Expansion Draft Environmental Impact Statement 2009 Appendix Q 119
Table Q6.9 Number of dwellings by tenure and median housing costs, 2006
Number of dwellings
being purchased
Median monthly housing
loan repayment ($)
Number of dwellings being
rented (includes rent free)
Median weekly rent
($)
Roxby Downs LGA 321 1,300 718 138
Peak Downs LGA 141 1,160 605 15
Belyando LGA 732 1,136 1,611 68
Weipa LGA 75 1,473 787 36
Ashburton LGA 196 253 1,546 37
Nhulunbuy SLA 30 1,145 971 18
Source: 2006 Census of Population and Housing (ABS 2007b)
Table Q6.10 Housing sales, 2004
Housing sales
Number Average value ($)
Roxby Downs LGA 216 182,000
Peak Downs LGA 22 91,500
Nhulunbuy SLA n.a. n.a.
Weipa LGA 32 147,500
Ashburton LGA n.a. n.a.
Belyando LGA 343 170,000
Source: National Regional Profiles (ABS 2006a)
Table Q6.11 Building approvals, July 2006–07
Total dwellings Average value of
residential building ($)
Roxby Downs LGA 26 386,173
Peak Downs LGA 47 191,926
Belyando LGA 104 318,009
Weipa LGA 0 0
Ashburton LGA 19 343,637
Nhulunbuy SLA 52 494,646
Source: Building Approvals Australia (ABS 2007f)
Table Q6.12 Number and proportion of dwellings being rented from a real estate agent, or an employer or residential park by median
weekly rental, 20061
Dwellings rented from a real estate agent Dwellings rented from an employer or a residential park2
Number Per cent of all
rental dwellings
Median weekly rental
($)
Number Per cent of all
rental dwellings
Median weekly rental
($)
Roxby Downs LGA 247 34.4 275–349 383 53.3 100–139
Peak Downs LGA 15 2.5 225–274 471 78.1 0–49
Belyando LGA 232 14.4 225–274 988 61.3 50–99
Weipa LGA 41 5.2 50–99 652 82.7 0–49
Ashburton LGA 124 8.0 140–179 1,164 75.3 0–49
Nhulunbuy SLA 53 5.4 0–49 694 71.3 0–49
1 2006 Census of Population and Housing (ABS 2007d), place of enumeration, includes rent or landlord type not stated.2 Includes occupied private dwellings being rented through a residential park (includes caravan park and marina) or employer housing.
Olympic Dam Expansion Draft Environmental Impact Statement 2009 Appendix Q120
Table Q6.13 Housing affordability for key workers, 2002 and 2007
Affordable (2002) Affordable (2007) House price to earnings
ratio (2007)
Roxby Downs LGA √ X 5.3
Peak Downs LGA √ √ 3.9
Belyando LGA √ X 5.2
Weipa LGA n.a. n.a. n.a.
Ashburton LGA n.a. n.a. n.a.
Nhulunbuy SLA n.a. n.a. n.a.
Source: BankWest 2008a
In comparison to other mining communities, Roxby Downs has high housing costs based on the high median weekly rents (for
private rental dwellings and private dwellings rented from a real estate agent, non household member, employer or residential/
caravan park), high average house sales price and key worker housing affordability.
Q6.6 COMPARISON OF GROCERY COSTS
The cost of purchasing 37 grocery items in Roxby Downs and other comparable mining communities (excluding Nhulunbuy) was
undertaken as a basis for comparing the cost of living. The groceries were purchased from the same supermarket chain operating in
Roxby Downs, or the largest supermarket, in each LGA by local residents or workers between 13 and 17 December 2007. The same
purchases were also made in Adelaide and Port Augusta to compare costs in South Australia.
The basket of grocery items was considered typical of the type of purchases that would be made by a family with young children,
and included:
nine fresh food items (fruit, vegetables and meat)
five dairy items
four frozen food items
three baby-care products
eight kitchen, cleaning or personal care items
eight other general food and household items, including both brand-name and home-brand products.
•
•
•
•
•
•
Source: ABS (2007b)
0% 20% 40% 60% 80% 100%
Nhulunbuy
Ashburton
Weipa
Belyando
Peak Downs
Roxby Downs
Proportion of renting households (%)
$0-$139 $140-$224 $225-$449 Over $450 Not known/not stated
Figure Q6.17 Weekly rental costs for households renting from a real estate agent or person not in the same household, 2006
Olympic Dam Expansion Draft Environmental Impact Statement 2009 Appendix Q 121
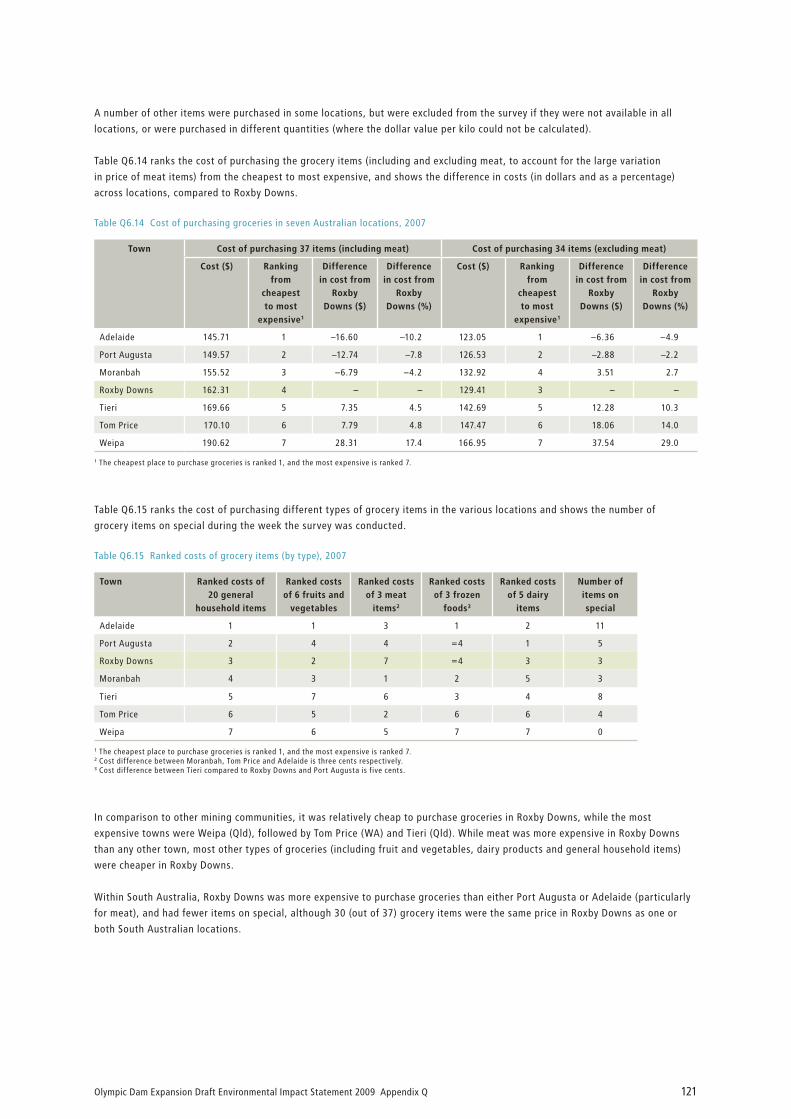
A number of other items were purchased in some locations, but were excluded from the survey if they were not available in all
locations, or were purchased in different quantities (where the dollar value per kilo could not be calculated).
Table Q6.14 ranks the cost of purchasing the grocery items (including and excluding meat, to account for the large variation
in price of meat items) from the cheapest to most expensive, and shows the difference in costs (in dollars and as a percentage)
across locations, compared to Roxby Downs.
Table Q6.14 Cost of purchasing groceries in seven Australian locations, 2007
Town Cost of purchasing 37 items (including meat) Cost of purchasing 34 items (excluding meat)
Cost ($) Ranking
from
cheapest
to most
expensive1
Difference
in cost from
Roxby
Downs ($)
Difference
in cost from
Roxby
Downs (%)
Cost ($) Ranking
from
cheapest
to most
expensive1
Difference
in cost from
Roxby
Downs ($)
Difference
in cost from
Roxby
Downs (%)
Adelaide 145.71 1 –16.60 –10.2 123.05 1 –6.36 –4.9
Port Augusta 149.57 2 –12.74 –7.8 126.53 2 –2.88 –2.2
Moranbah 155.52 3 –6.79 –4.2 132.92 4 3.51 2.7
Roxby Downs 162.31 4 – – 129.41 3 – –
Tieri 169.66 5 7.35 4.5 142.69 5 12.28 10.3
Tom Price 170.10 6 7.79 4.8 147.47 6 18.06 14.0
Weipa 190.62 7 28.31 17.4 166.95 7 37.54 29.0
1 The cheapest place to purchase groceries is ranked 1, and the most expensive is ranked 7.
Table Q6.15 ranks the cost of purchasing different types of grocery items in the various locations and shows the number of
grocery items on special during the week the survey was conducted.
Table Q6.15 Ranked costs of grocery items (by type), 2007
Town Ranked costs of
20 general
household items
Ranked costs
of 6 fruits and
vegetables
Ranked costs
of 3 meat
items2
Ranked costs
of 3 frozen
foods3
Ranked costs
of 5 dairy
items
Number of
items on
special
Adelaide 1 1 3 1 2 11
Port Augusta 2 4 4 =4 1 5
Roxby Downs 3 2 7 =4 3 3
Moranbah 4 3 1 2 5 3
Tieri 5 7 6 3 4 8
Tom Price 6 5 2 6 6 4
Weipa 7 6 5 7 7 0
1 The cheapest place to purchase groceries is ranked 1, and the most expensive is ranked 7.2 Cost difference between Moranbah, Tom Price and Adelaide is three cents respectively.3 Cost difference between Tieri compared to Roxby Downs and Port Augusta is five cents.
In comparison to other mining communities, it was relatively cheap to purchase groceries in Roxby Downs, while the most
expensive towns were Weipa (Qld), followed by Tom Price (WA) and Tieri (Qld). While meat was more expensive in Roxby Downs
than any other town, most other types of groceries (including fruit and vegetables, dairy products and general household items)
were cheaper in Roxby Downs.
Within South Australia, Roxby Downs was more expensive to purchase groceries than either Port Augusta or Adelaide (particularly
for meat), and had fewer items on special, although 30 (out of 37) grocery items were the same price in Roxby Downs as one or
both South Australian locations.
Olympic Dam Expansion Draft Environmental Impact Statement 2009 Appendix Q122
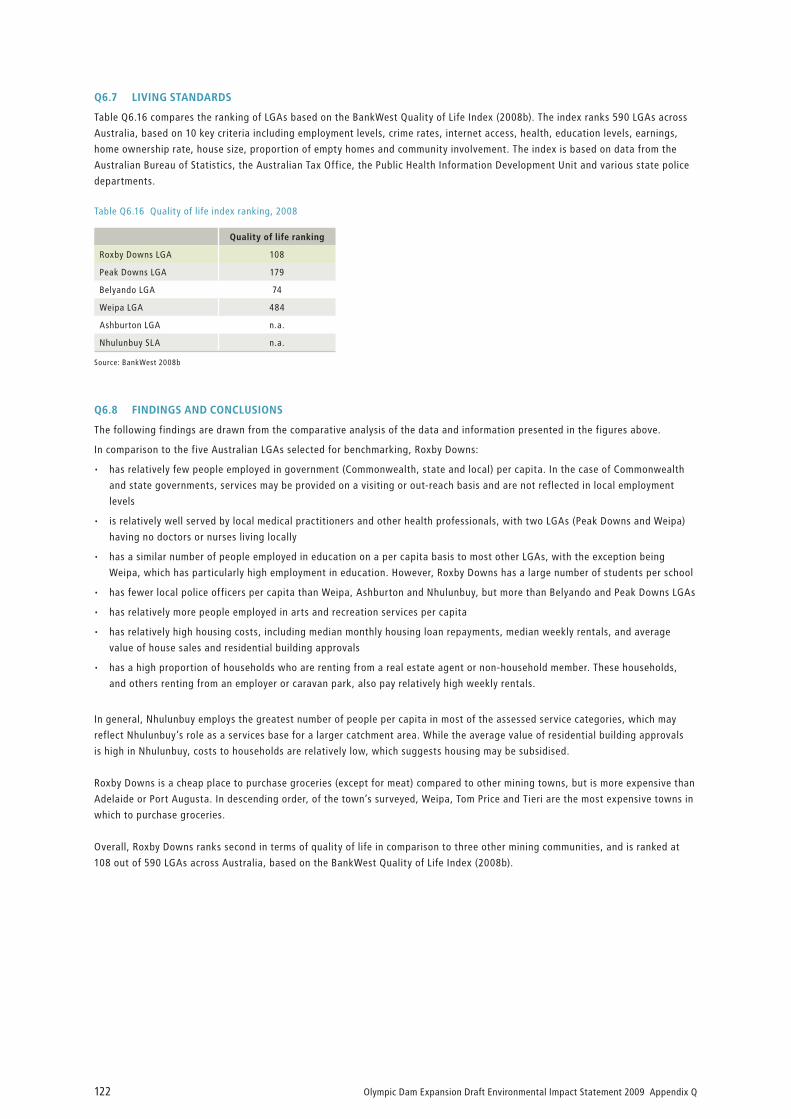
Q6.7 LIVING STANDARDS
Table Q6.16 compares the ranking of LGAs based on the BankWest Quality of Life Index (2008b). The index ranks 590 LGAs across
Australia, based on 10 key criteria including employment levels, crime rates, internet access, health, education levels, earnings,
home ownership rate, house size, proportion of empty homes and community involvement. The index is based on data from the
Australian Bureau of Statistics, the Australian Tax Office, the Public Health Information Development Unit and various state police
departments.
Table Q6.16 Quality of life index ranking, 2008
Quality of life ranking
Roxby Downs LGA 108
Peak Downs LGA 179
Belyando LGA 74
Weipa LGA 484
Ashburton LGA n.a.
Nhulunbuy SLA n.a.
Source: BankWest 2008b
Q6.8 FINDINGS AND CONCLUSIONS
The following findings are drawn from the comparative analysis of the data and information presented in the figures above.
In comparison to the five Australian LGAs selected for benchmarking, Roxby Downs:
has relatively few people employed in government (Commonwealth, state and local) per capita. In the case of Commonwealth
and state governments, services may be provided on a visiting or out-reach basis and are not reflected in local employment
levels
is relatively well served by local medical practitioners and other health professionals, with two LGAs (Peak Downs and Weipa)
having no doctors or nurses living locally
has a similar number of people employed in education on a per capita basis to most other LGAs, with the exception being
Weipa, which has particularly high employment in education. However, Roxby Downs has a large number of students per school
has fewer local police officers per capita than Weipa, Ashburton and Nhulunbuy, but more than Belyando and Peak Downs LGAs
has relatively more people employed in arts and recreation services per capita
has relatively high housing costs, including median monthly housing loan repayments, median weekly rentals, and average
value of house sales and residential building approvals
has a high proportion of households who are renting from a real estate agent or non-household member. These households,
and others renting from an employer or caravan park, also pay relatively high weekly rentals.
In general, Nhulunbuy employs the greatest number of people per capita in most of the assessed service categories, which may
reflect Nhulunbuy’s role as a services base for a larger catchment area. While the average value of residential building approvals
is high in Nhulunbuy, costs to households are relatively low, which suggests housing may be subsidised.
Roxby Downs is a cheap place to purchase groceries (except for meat) compared to other mining towns, but is more expensive than
Adelaide or Port Augusta. In descending order, of the town’s surveyed, Weipa, Tom Price and Tieri are the most expensive towns in
which to purchase groceries.
Overall, Roxby Downs ranks second in terms of quality of life in comparison to three other mining communities, and is ranked at
108 out of 590 LGAs across Australia, based on the BankWest Quality of Life Index (2008b).
•
•
•
•
•
•
•
Olympic Dam Expansion Draft Environmental Impact Statement 2009 Appendix Q 123
Q6.9 REFERENCES
Australian Bureau of Statistics 2006a, National Regional Profiles, Cat. 1379.0.55.001, ABS, Canberra.
Australian Bureau of Statistics 2006b, Australian and New Zealand Standard Classification of Occupations, First Edition ANZSCO,
Cat. no. 1220.0, ABS, Canberra.
Australian Bureau of Statistics 2007a, Regional Population Growth, Australia, 1996–2006, Table 4 Estimated Resident Population,
Statistical local areas, South Australia, Cat. no. 3218.0, ABS, Canberra.
Australian Bureau of Statistics 2007b, 2006 Census of Population and Housing: Basic Community Profile, Place of Usual Residence,
Cat. no. 2000.1, ABS, Canberra.
Australian Bureau of Statistics 2007c, 2006 Census of Population and Housing: QuickStats, ABS, Canberra, viewed December 2007,
<http://www.censusdata.abs.gov.au/ABSNavigation/prenav/ProductSelect?&collection=Census&period=2006&breadcrumb=P&&na
vmapdisplayed=true&javascript=true&textversion=false>.
Australian Bureau of Statistics 2007d, 2006 Census Community Profile Series: Basic Community Profile, Place of enumeration,
Cat. no. 2004.0, ABS, Canberra.
Australian Bureau of Statistics 2007e, 2006 Census Tables: 2006 Census of Population and Housing, Cat. no. 2068.0, ABS, Canberra.
Australian Bureau of Statistics 2007f, Building Approvals Australia, July 2007, Cat. 87310D020, ABS, Canberra.
BankWest 2008a, Key Worker Housing Affordability, viewed August 2008, <http://www.bankwest.com.au/Media_Centre/
BankWest_Research/BankWest_Key_Worker_Housing_Affordability/index.aspx>.
BankWest 2008b, Quality of Life Index 2008, viewed August 2008, <http://www.bankwest.com.au/Media_Centre/BankWest_
Research/BankWest_Quality_of_Life_Index_2008/index.aspx>.
Bowen Basin Mining Communities Research Exchange 2003, Operating Coal Mines, viewed August 2007,
<http://www.bowenbasin.cqu.edu.au/basin_data/coal_mines.html>.
Department of Industry and Resources 2004, Iron Ore Industry 2003, Department of Industry and Resources, Perth.
Department of Industry and Resources 2007, Western Australian Mineral and Petroleum Statistics Digest 2006,
Department of Industry and Resources, Perth.

Olympic Dam Expansion Draft Environmental Impact Statement 2009 Appendix Q124