Embed Size (px)
Citation preview

Appendix O
Stormwater Management Report
Ap
pen
dix O

Sheridan Park Drive Extension Municipal Class Environmental Assessment Stormwater Management Report City of Mississauga
R.J. Burnside & Associates Limited 6990 Creditview Road, Unit 2 Mississauga ON L5N 8R9 CANADA
January 18, 2018 300039474.0000
City of Mississauga i Stormwater Management Report January 18, 2018
R.J. Burnside & Associates Limited 300039474.0000 039474_SWM Report_180118
Distribution List
No. of Hard
Copies PDF Email Organization Name
0 Yes Yes City of Mississauga
Record of Revisions
Revision Date Description 0 December 19, 2017 Draft Submission to City 1 January 12, 2018 Second Draft Submission to City and Credit Valley
Conservation 2 January 18, 2018 Final Submission to City of Mississauga
R.J. Burnside & Associates Limited
Report Prepared By:
Harold Faulkner, P.Eng. Project Engineer HF:mb/bs
Report Reviewed By:
Tony Elias, P.Eng. Sr. Water Resources Engineer TE:mb/bs
City of Mississauga ii Stormwater Management Report January 18, 2018
R.J. Burnside & Associates Limited 300039474.0000 039474_SWM Report_180118
Table of Contents
1.0 Introduction ......................................................................................................... 1 1.1 Description of Study Area ............................................................................ 1
2.0 Design Criteria ..................................................................................................... 3
3.0 Existing Drainage Conditions ............................................................................ 4
4.0 Hydrology ............................................................................................................. 5 4.1 General ........................................................................................................ 5 4.2 Soil Conditions ............................................................................................. 5 4.3 Land Use Patterns ....................................................................................... 5 4.4 Hydrologic Model ......................................................................................... 6 4.5 Time of Concentration .................................................................................. 6 4.6 Rainfall Data ................................................................................................ 6 4.7 Hydrologic Results ....................................................................................... 6
5.0 Hydraulics ............................................................................................................ 8 5.1 General ........................................................................................................ 8 5.2 Hydraulic Modeling ...................................................................................... 8 5.3 Proposed Culvert Hydraulics ....................................................................... 8
6.0 Water Quality ..................................................................................................... 10 6.1 Enhanced Quality Control .......................................................................... 10 6.2 Water Balance ........................................................................................... 10
7.0 Sediment and Erosion Controls ....................................................................... 12
8.0 Recommendations and Conclusions .............................................................. 13
Tables
Table 4-1: Existing Peak Flows at Outlet Locations ......................................................... 7 Table 4-2: Proposed Peak Flows at Outlet Locations ...................................................... 7 Table 5-1: Sheridan Park Drive Proposed Culvert Capacity Summary ............................ 9
Figures
Figure 1-1: Study Area ..................................................................................................... 2
Appendices
Appendix A Drainage Area Plan Appendix B Hydrologic Model Data Appendix C OTTHYMO Model Output Appendix D Hydraulic Calculations Appendix E CVC/TRCA Low Impact Development Planning and Design Guide –
Bioretention Fact Sheet Appendix F Flood Control Calculations

City of Mississauga iii Stormwater Management Report January 18, 2018
R.J. Burnside & Associates Limited 300039474.0000 039474_SWM Report_180118
Plans
Plan C: Drainage Management Plans

City of Mississauga iv Stormwater Management Report January 18, 2018
R.J. Burnside & Associates Limited 300039474.0000 039474_SWM Report_180118
Disclaimer
Other than by the addressee, copying or distribution of this document, in whole or in part, is not permitted without the express written consent of R.J. Burnside & Associates Limited.
R.J. Burnside & Associates Limited makes no warranties, either express or implied, of merchantability and fitness of the documents and other instruments of service for any purpose other than that specified by the contract.

City of Mississauga 1 Stormwater Management Report January 18, 2018
R.J. Burnside & Associates Limited 300039474.0000 039474_SWM Report_180118
1.0 Introduction
The City of Mississauga (City) has undertaken a Municipal Class Environmental Assessment (EA) to investigate the proposed extension of Sheridan Park Drive between Homelands Drive and Speakman Drive in the southwestern area of Mississauga. R.J. Burnside & Associates Limited (Burnside) has facilitated the EA on behalf of the City.
The Study has followed a comprehensive planning and design process in order to explore the opportunity to connect the east and west sections of Sheridan Park Drive, improve the road network connectivity in the residential neighbourhood and business area, create options for alternative routes and improve multi-modal network connectivity. The Study has been completed in accordance with the requirements of a Schedule B Undertaking as outlined in the Municipal Engineers Association Municipal Class Environmental Assessment Document (October 2000, as amended 2007, 2011 & 2015), which is an approved process under the Ontario Environmental Assessment Act.
As part of the EA Study, Burnside has completed a Stormwater Management Report to provide a stormwater management and conveyance assessment and initial design.
1.1 Description of Study Area
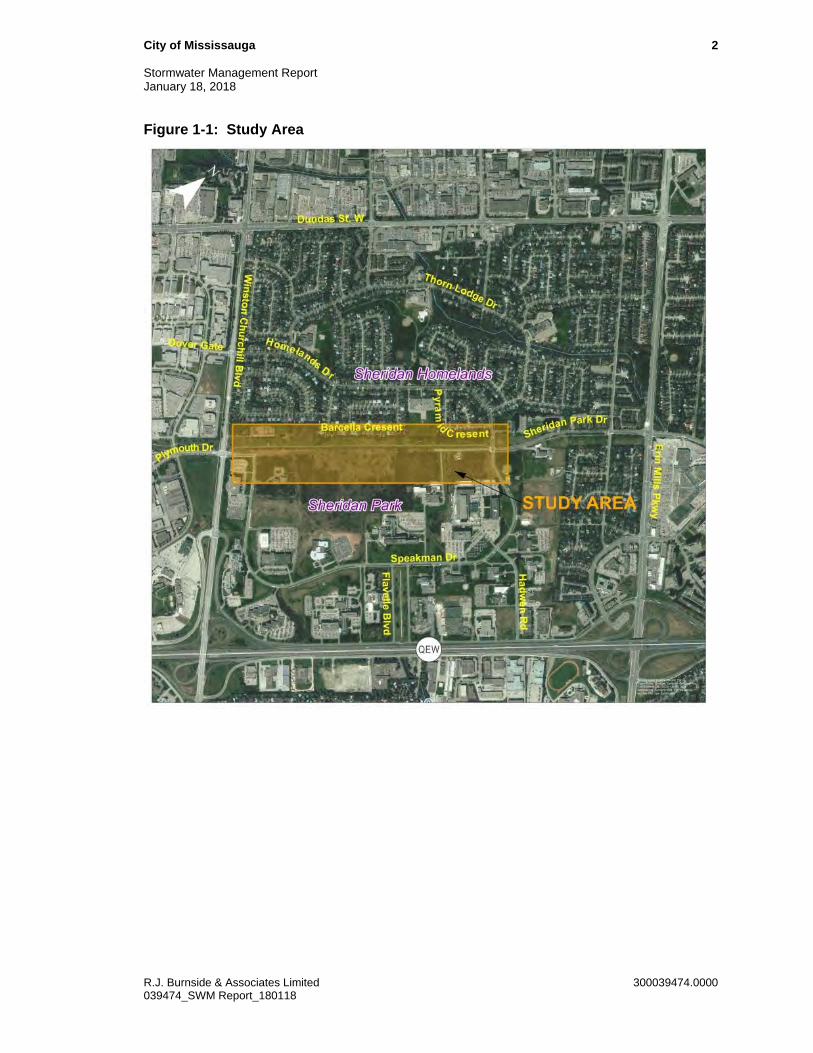
The Study Area is generally bordered by a utility corridor to the north, Winston Churchill Boulevard to the west, Speakman Drive/Homelands Drive to the east and naturalized private lands to the south. The Study Area is illustrated on Figure 1-1. The proposed extension of Sheridan Park Drive falls within the existing City of Mississauga owned right-of-way (ROW), which runs through the centre part of the Study Area.
The Study Area includes a unique combination of uses including the Sheridan Park Corporate Centre (Sheridan Park), a utility corridor that includes a multi-use trail (MUT) and the Sheridan Homelands residential neighbourhood.
Sheridan Park is a 340 acre corporate centre, which is primarily designated Business Employment in the City of Mississauga’s Official Plan (MOP). The majority of Sheridan Park is occupied by private industries and businesses, which include in their landholdings significant natural areas particularly on the north side of corporate centre, within the Study Area. These naturalized areas include two wooded areas that are identified as Significant Natural Areas in the City’s Natural Areas Survey (2016 Update).
City of Mississauga 2 Stormwater Management Report January 18, 2018
R.J. Burnside & Associates Limited 300039474.0000 039474_SWM Report_180118
Figure 1-1: Study Area

City of Mississauga 3 Stormwater Management Report January 18, 2018
R.J. Burnside & Associates Limited 300039474.0000 039474_SWM Report_180118
2.0 Design Criteria
The hydrologic and hydraulic design criteria were based on the City design guidelines for a major collector road, and Ministry of the Environment and Climate Change (MOECC) water quality guidelines. The Study Area is also located within the Credit Valley Conservation (CVC) watershed and the Sheridan Creek sub-watershed.
Typically, stormwater quantity control measures are required to ensure post-development peak flow rates do not exceed pre-development levels. For the purposes of this report, the criteria of ‘1:100-year Post to 1:100-year Pre-development Control’ was applied. In this case, the road extension will result in a very minor increase in impervious area, compared to the total drainage area of 185 ha. The hydrologic model results provided in this report show the post-development flows are essentially unchanged from the pre-development condition, without quantity controls (see Section 4.7).
According to Section 3.0, Table 3-1 of the Credit Valley Conservation Stormwater Management Criteria (August 2012), the Flood Control criteria for new development in the Sheridan Creek Watershed is ‘1:100-year Post to 1:2-year Pre-development Control’. Additional analysis was undertaken applying this criteria. When the stricter controls are applied, there is a storage volume requirement of 590 m3. The detailed calculations of this additional analysis are provided in Appendix F. Storage containment options within a road right-of-way are somewhat limited. Storage volume may be provided in the form of over-sized storm sewer (i.e., superpipe) or possibly underground storage chambers. These stormwater calculations are preliminary and will be finalized, together with the approach to storing/managing stormwater attributed to the road extension during the detailed design phase of the project. If development has occurred within the tributary catchment between the EA Phase and detailed design phase of the project, the relevant hydrologic parameters will need to be updated. If there are opportunities to combine the flood storage requirement for the Sheridan Park Drive Extension with an adjacent (hydrologically-connected) development where space is less restricted, and the timing is favourable, this is strongly encouraged.
The stormwater management design will also incorporate a Low Impact Development (LID) best practices approach to quality control. The LID feature will also provide some quantity control; however, this has not been quantified in the analysis.
The proposed watercourse crossing has been designed to convey the 1:50-year storm without overtopping the roadway as per City standards.

City of Mississauga 4 Stormwater Management Report January 18, 2018
R.J. Burnside & Associates Limited 300039474.0000 039474_SWM Report_180118
3.0 Existing Drainage Conditions
Sheridan Park Drive is located within the headwaters area of Sheridan Creek, which empties into Lake Ontario through the Rattray Marsh Conservation Area, approximately 6 km downstream. The channel meanders through a heavily urbanized area of Mississauga.
There are remnants of natural drainage systems within the Study Area, but the area is drained predominantly by engineered drainage systems. Lands to the north have been developed as a residential subdivision, known as Sheridan Homelands. The development of these lands resulted in the conversion of open channels to a combination of storm sewers, to convey minor storms, and overland flow routes in the form of roads, with curbs, and to convey major storm events to a suitable outlet. Based on information provided by the City, minor storm sewer system appears to be based on the 1:10-year storm.
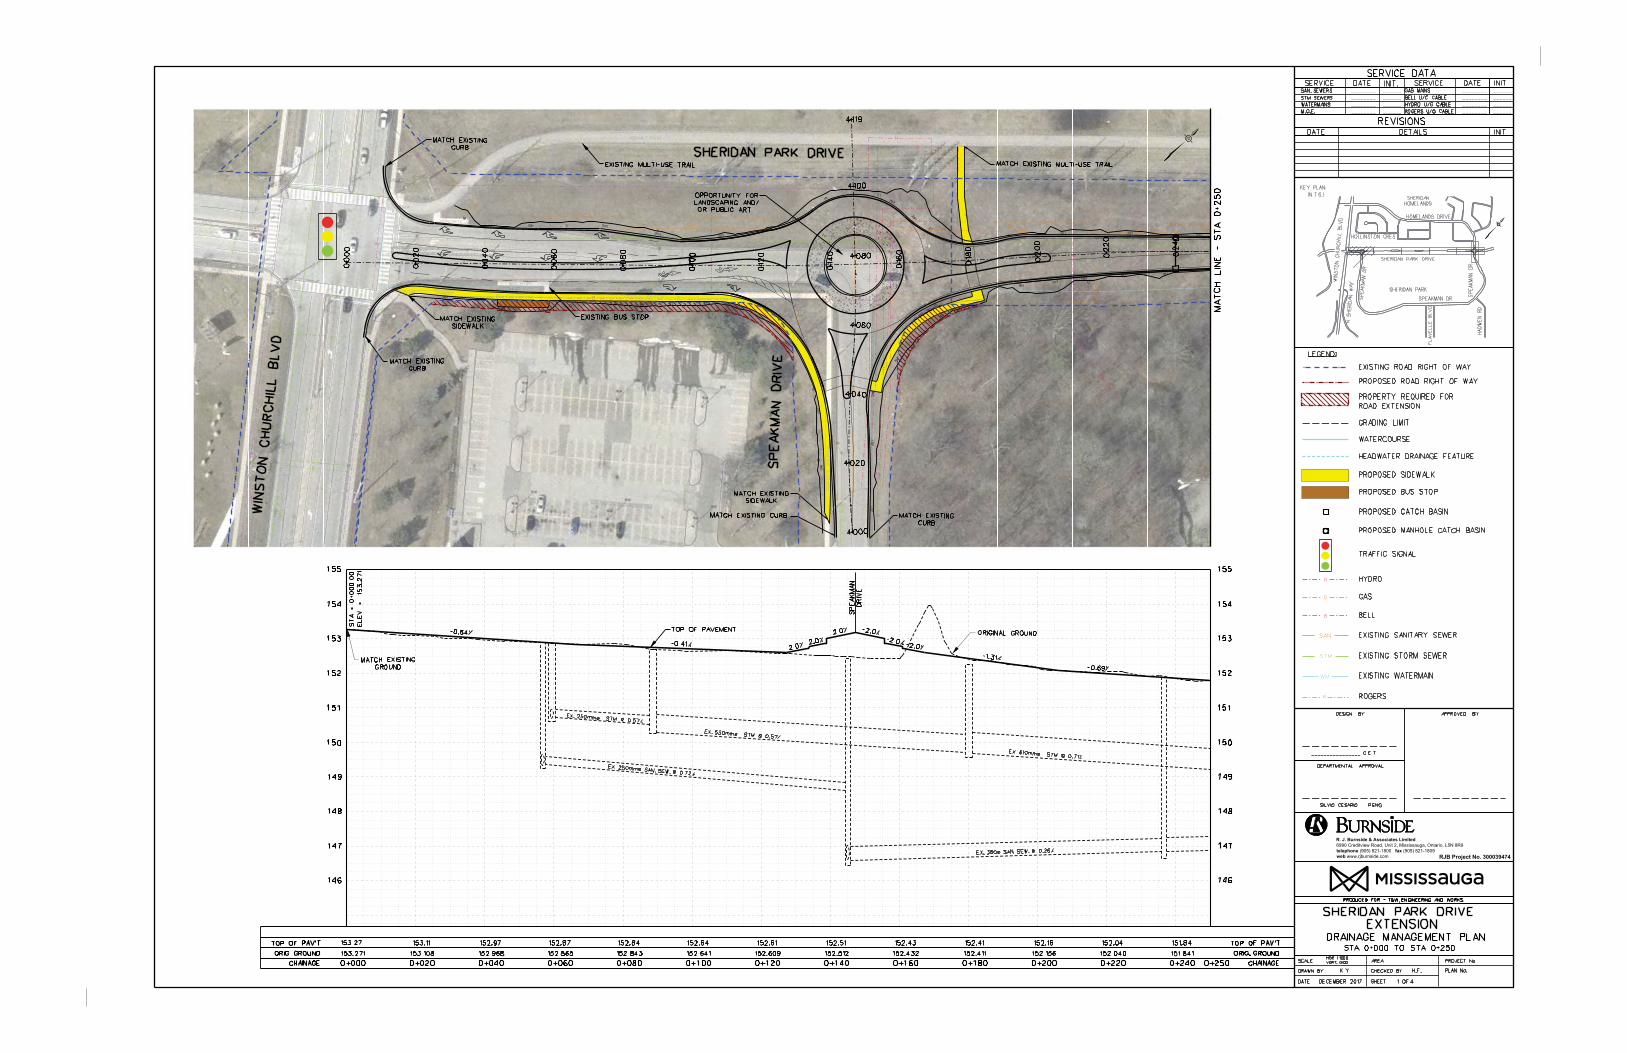
There are two main storm sewer systems which drain the Sheridan Homelands Subdivision through the Study Area. One system drains the westerly portion of the Sheridan Homelands development and the section of Sheridan Park Drive abutting Winston Churchill Boulevard, which currently terminates at Speakman Drive. The system outlets into an open channel via a 1,500 mm dia. storm sewer, roughly 330 m east of Winston Churchill Boulevard, on the south of the Sheridan Park Drive right-of-way.
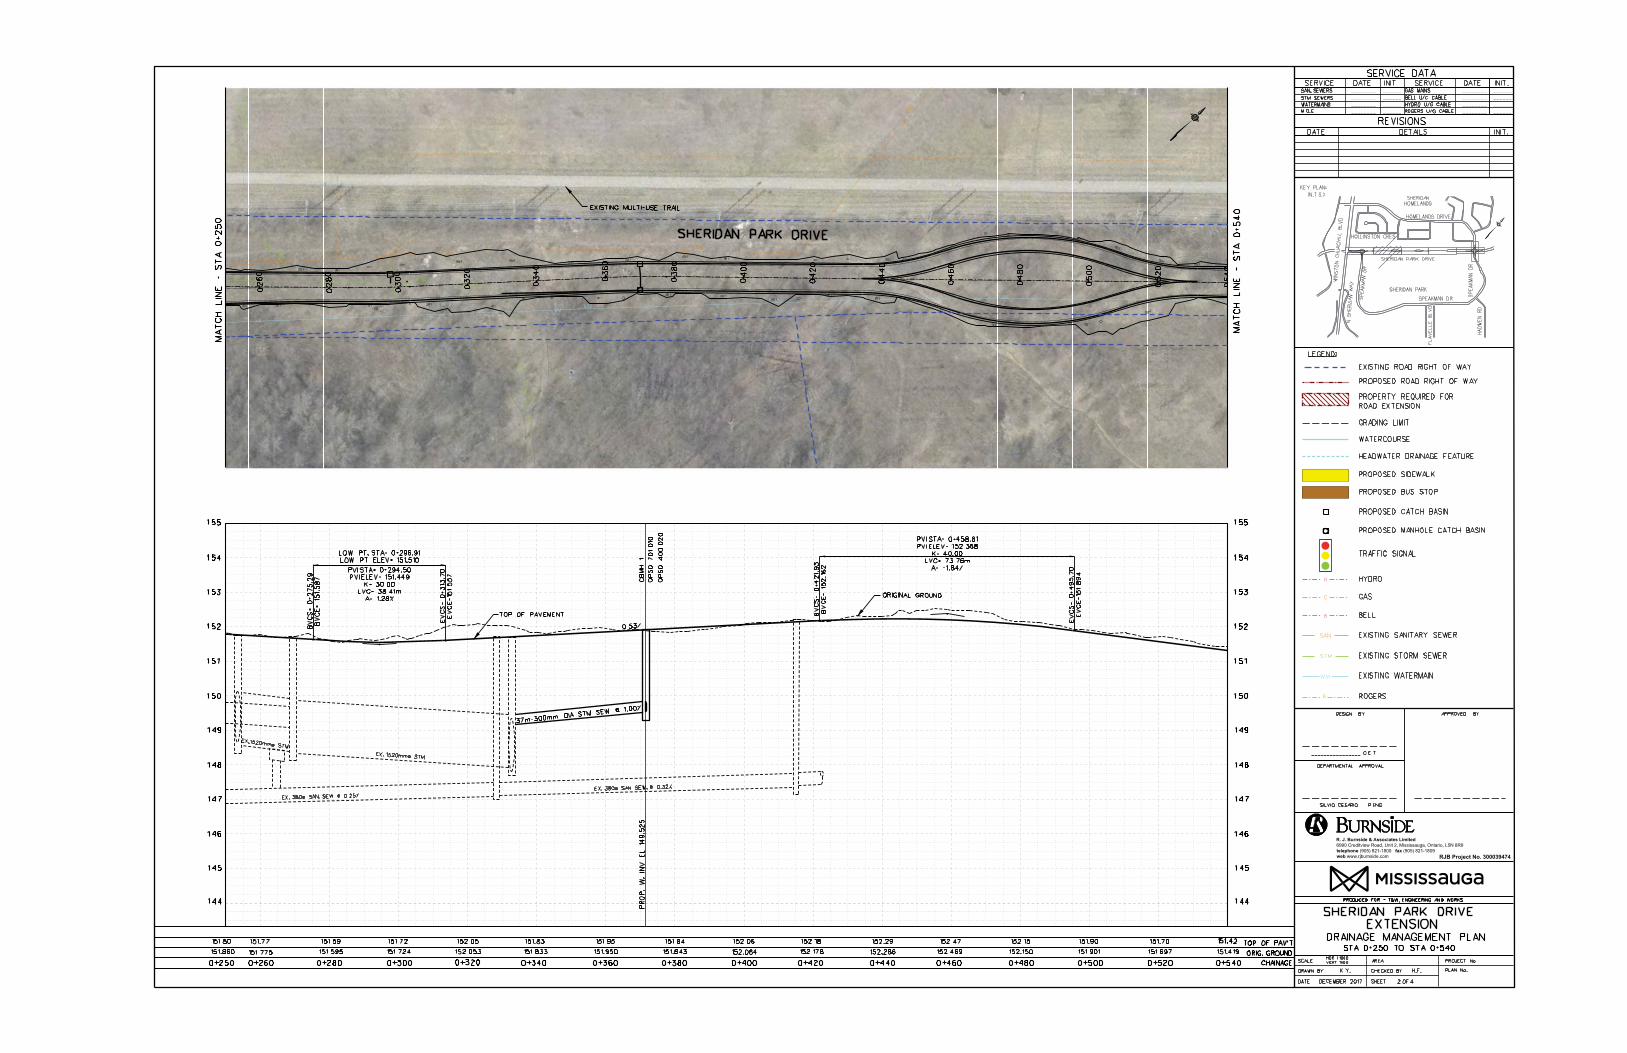
The second system drains the easterly portion of the Sheridan Homelands development through the Study Area. This system eventually drains into a concrete-lined channel on the south side of the right-of-way, via a 1,650 mm dia. storm sewer. The existing storm sewer systems are illustrated on the Drainage Management Plans.
At the time that these systems were installed, they did not appear to incorporate any type of quantity control or water quality treatment. Today, these systems would include measures such as stormwater management facilities, to prevent flow increases associated with development and also to enhance water quality, prior to discharging to the natural environment.

City of Mississauga 5 Stormwater Management Report January 18, 2018
R.J. Burnside & Associates Limited 300039474.0000 039474_SWM Report_180118
4.0 Hydrology
4.1 General
In order to ensure that upstream lands are adequately conveyed through the Sheridan Park Drive ROW with the extension in place, a hydrologic analysis was completed. This assessment considers the lands which are presently contributing flows to the undeveloped right-of-way. Once the extent of these areas is delineated, Return Period flows can be generated based on land use, topography and soil type.
The drainage limits of each catchment have been determined based on topographic survey contours. In general, existing topographic features indicate that overland sheet flow occurs from the northwest to southeast, perpendicular to the road ROW. Several minor drainage features begin within the Study Area, which ultimately convey flows to the Sheridan Creek.
It is assumed a portion of the existing rear yards within the Study Area will drain overland towards the Sheridan Park Drive ROW. In addition to the overland flow, two storm sewer outlets for the subdivision cross through the ROW. These sewers are assumed to convey the minor 1:10-year storm from the subdivision. This assumption is to be confirmed in conjunction with the completion of the EA. The remaining major runoff not captured by the subdivision storm sewer system will drain across the Sheridan Park Drive ROW.
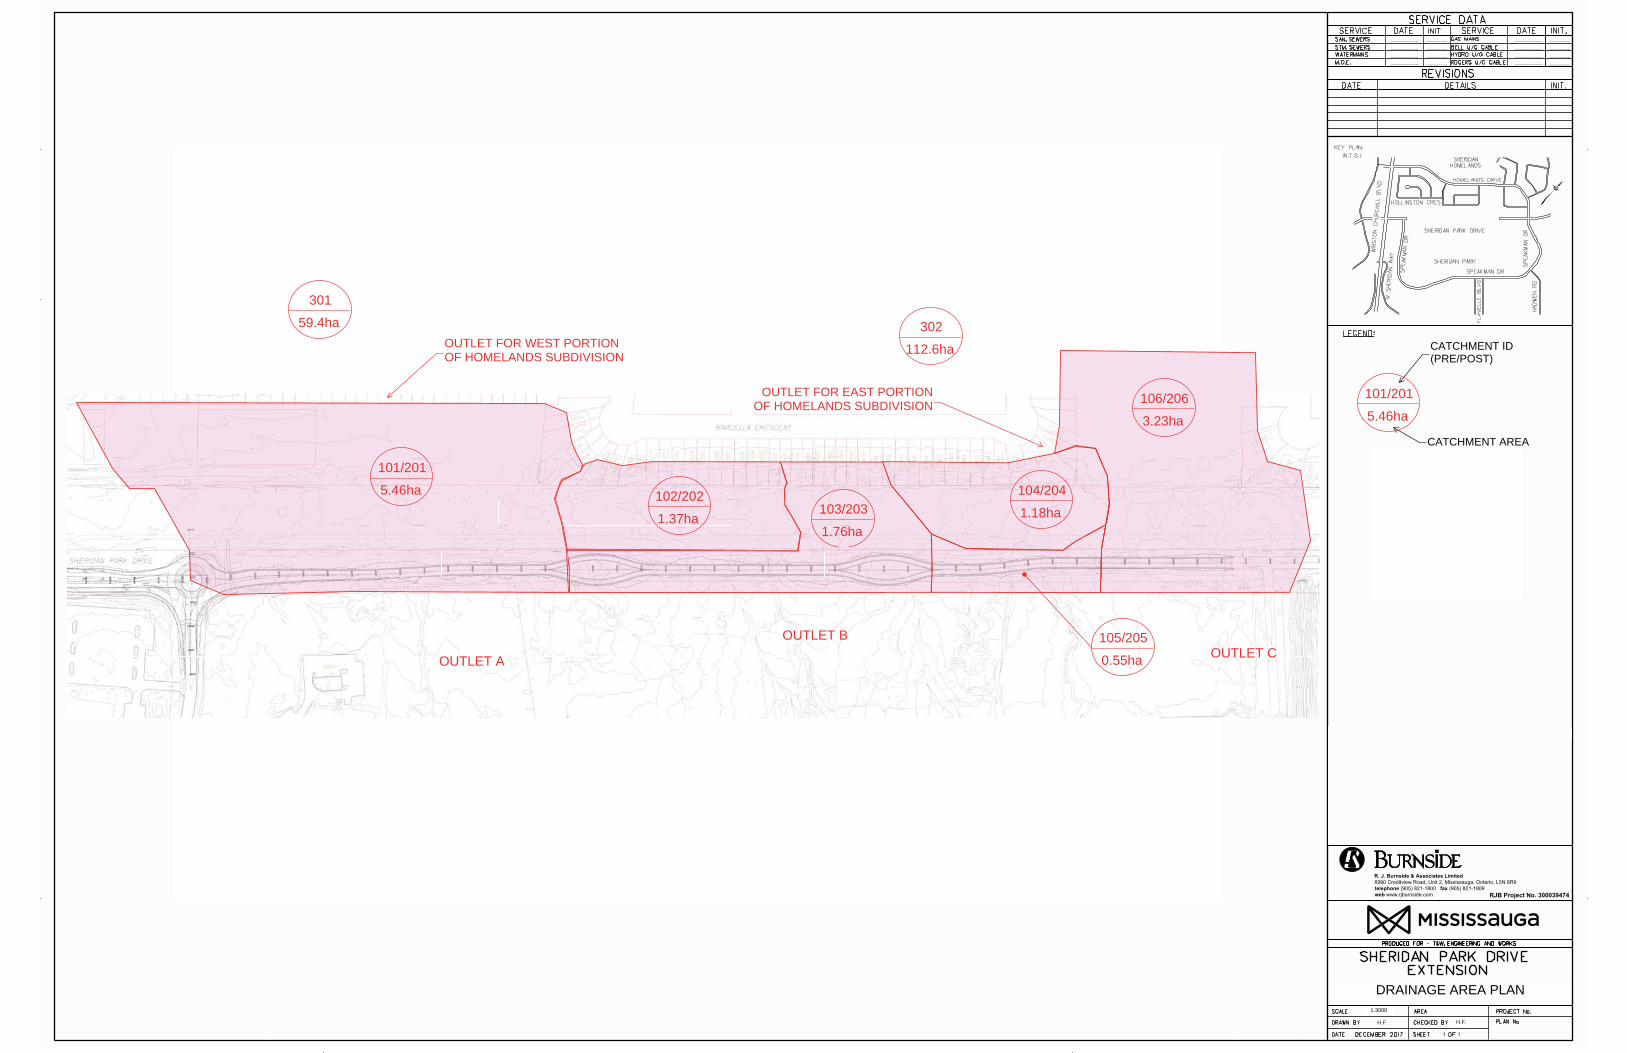
A Drainage Area Plan is included in Appendix A of this report.
4.2 Soil Conditions
According to the Peel County soil map, prepared for the Department of Agriculture in 1953, the predominant soil is Trafalgar Clay. A hydrologic soil group of D was chosen as the most representative for all catchment areas. The Runoff Curve Numbers for the individual drainage areas were computed by calculating weighted curve numbers based on the corresponding land use and soil type. A summary of these calculations for each drainage area is included in Appendix B. The hydrologic soil groups were determined in accordance with the Ontario Ministry of Transportation (MTO) soil classification system, and is in agreement with the Draft Geotechnical Investigation (November 17, 2017), prepared by Peto MacCallum Ltd. Consulting Engineers in support of the proposed extension.
4.3 Land Use Patterns
Each catchment area was subdivided into meadow/field and wooded land uses based on the aerial photography illustrated in the Drainage Management Plans included in the back pocket of this report.
City of Mississauga 6 Stormwater Management Report January 18, 2018
R.J. Burnside & Associates Limited 300039474.0000 039474_SWM Report_180118
4.4 Hydrologic Model
The hydrologic model Visual OTTHYMO 3.0 was used to assess peak flows for each drainage area. OTTHYMO is recognized throughout the industry and by various ministries as being an effective method by which runoff can be determined based on topography, soil conditions and land use. Due to the nature of this drainage area and the relatively low imperious level of each catchment, the NASHYD command was used to assess peak flows. NASHYD is used for rural catchments.
DUHYD commands are used in the model to represent the split in the minor (piped 1:10-year) and major flow within the Sheridan Homelands development.
4.5 Time of Concentration
The City’s standard minimum initial time of concentration is 15 minutes, however, calculated values are used in this analysis to account for the site-specific conditions. The areas containing the road extension are relatively pervious, and would not be expected to have a standard urban concentration time. The external areas are very large and therefore have much longer concentration times. The time of concentration is a function of “time to peak” which represents the time from the beginning of rainfall to the peak of the runoff hydrograph. It is indicative of the basin response to storm events. It depends on the physical characteristics of the watershed such as length, slope, area and surface cover. Estimates of time to peak were determined using the catchment area time of concentration by computing the travel time across the catchment. The required flow lengths and slopes were determined from the topographic mapping. The Airport Method was used where the runoff coefficient is less than 0.40, and the Bransby-Williams Formula for higher runoff coefficients. A detailed summary of all hydrologic calculations is included in Appendix B.
4.6 Rainfall Data
City of Mississauga intensity-duration frequency curves (Standard 2111.010) for the 4-hour Chicago and 24-hour SCS Type II rainfall distributions were used for the 2 to 100-year storm event calculations.
When comparing flows generated by the 4 and 24-hour storm distributions, the 24-hour storm was determined to generate the highest peak flows. As such the 24-hour SCS storm distribution was used for design purposes.
4.7 Hydrologic Results
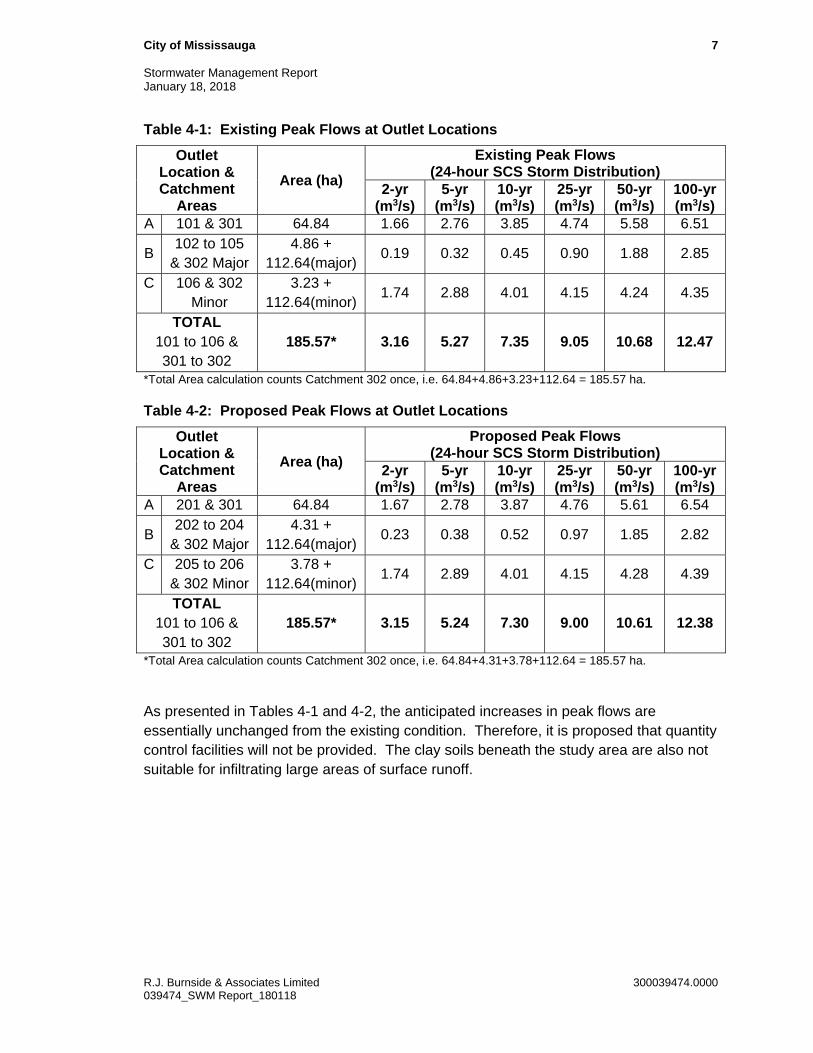
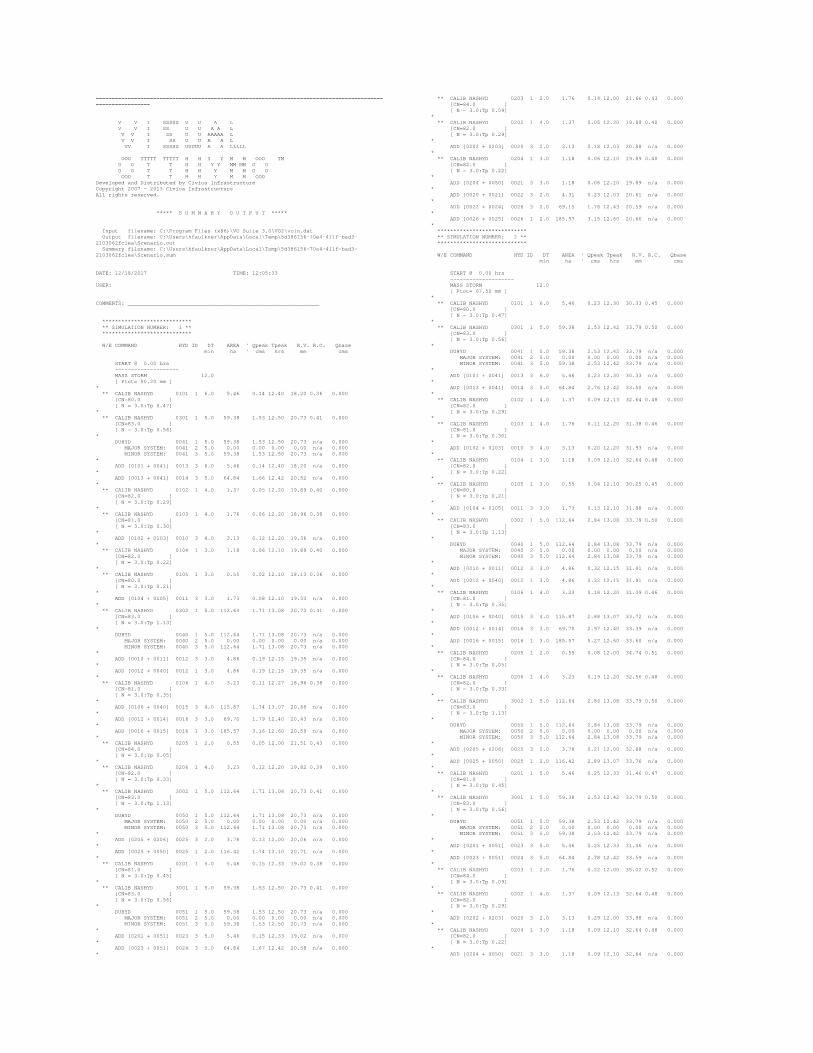
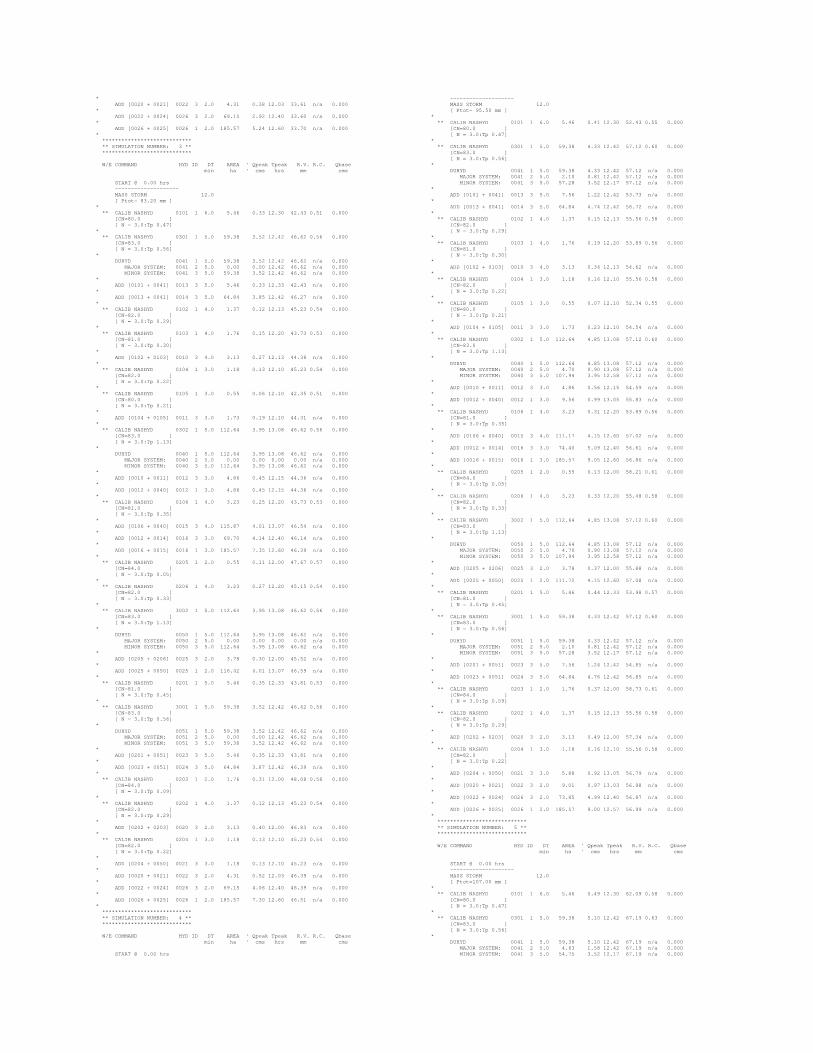
Using the site drainage areas as illustrated in the Drainage Plan Figure and the program OTTHYMO, the total flows were determined for the 2 to 100-year storms. These flows are summarized in Table 4-1 below. The OTTHYMO runs for the 24-hour SCS storm distribution can be found in Appendix C.
City of Mississauga 7 Stormwater Management Report January 18, 2018
R.J. Burnside & Associates Limited 300039474.0000 039474_SWM Report_180118
Table 4-1: Existing Peak Flows at Outlet Locations
Outlet Location & Catchment
Areas
Area (ha)
Existing Peak Flows (24-hour SCS Storm Distribution)
2-yr (m3/s)
5-yr (m3/s)
10-yr (m3/s)
25-yr (m3/s)
50-yr (m3/s)
100-yr (m3/s)
A 101 & 301 64.84 1.66 2.76 3.85 4.74 5.58 6.51
B 102 to 105
& 302 Major 4.86 +
112.64(major) 0.19 0.32 0.45 0.90 1.88 2.85
C
106 & 302 Minor
3.23 + 112.64(minor)
1.74 2.88 4.01 4.15 4.24 4.35
TOTAL 101 to 106 & 301 to 302
185.57* 3.16 5.27 7.35 9.05 10.68 12.47
*Total Area calculation counts Catchment 302 once, i.e. 64.84+4.86+3.23+112.64 = 185.57 ha.
Table 4-2: Proposed Peak Flows at Outlet Locations
Outlet Location & Catchment
Areas
Area (ha)
Proposed Peak Flows (24-hour SCS Storm Distribution)
2-yr (m3/s)
5-yr (m3/s)
10-yr (m3/s)
25-yr (m3/s)
50-yr (m3/s)
100-yr (m3/s)
A 201 & 301 64.84 1.67 2.78 3.87 4.76 5.61 6.54
B 202 to 204
& 302 Major 4.31 +
112.64(major) 0.23 0.38 0.52 0.97 1.85 2.82
C
205 to 206 & 302 Minor
3.78 + 112.64(minor)
1.74 2.89 4.01 4.15 4.28 4.39
TOTAL 101 to 106 & 301 to 302
185.57* 3.15 5.24 7.30 9.00 10.61 12.38
*Total Area calculation counts Catchment 302 once, i.e. 64.84+4.31+3.78+112.64 = 185.57 ha.
As presented in Tables 4-1 and 4-2, the anticipated increases in peak flows are essentially unchanged from the existing condition. Therefore, it is proposed that quantity control facilities will not be provided. The clay soils beneath the study area are also not suitable for infiltrating large areas of surface runoff.
City of Mississauga 8 Stormwater Management Report January 18, 2018
R.J. Burnside & Associates Limited 300039474.0000 039474_SWM Report_180118
5.0 Hydraulics
5.1 General
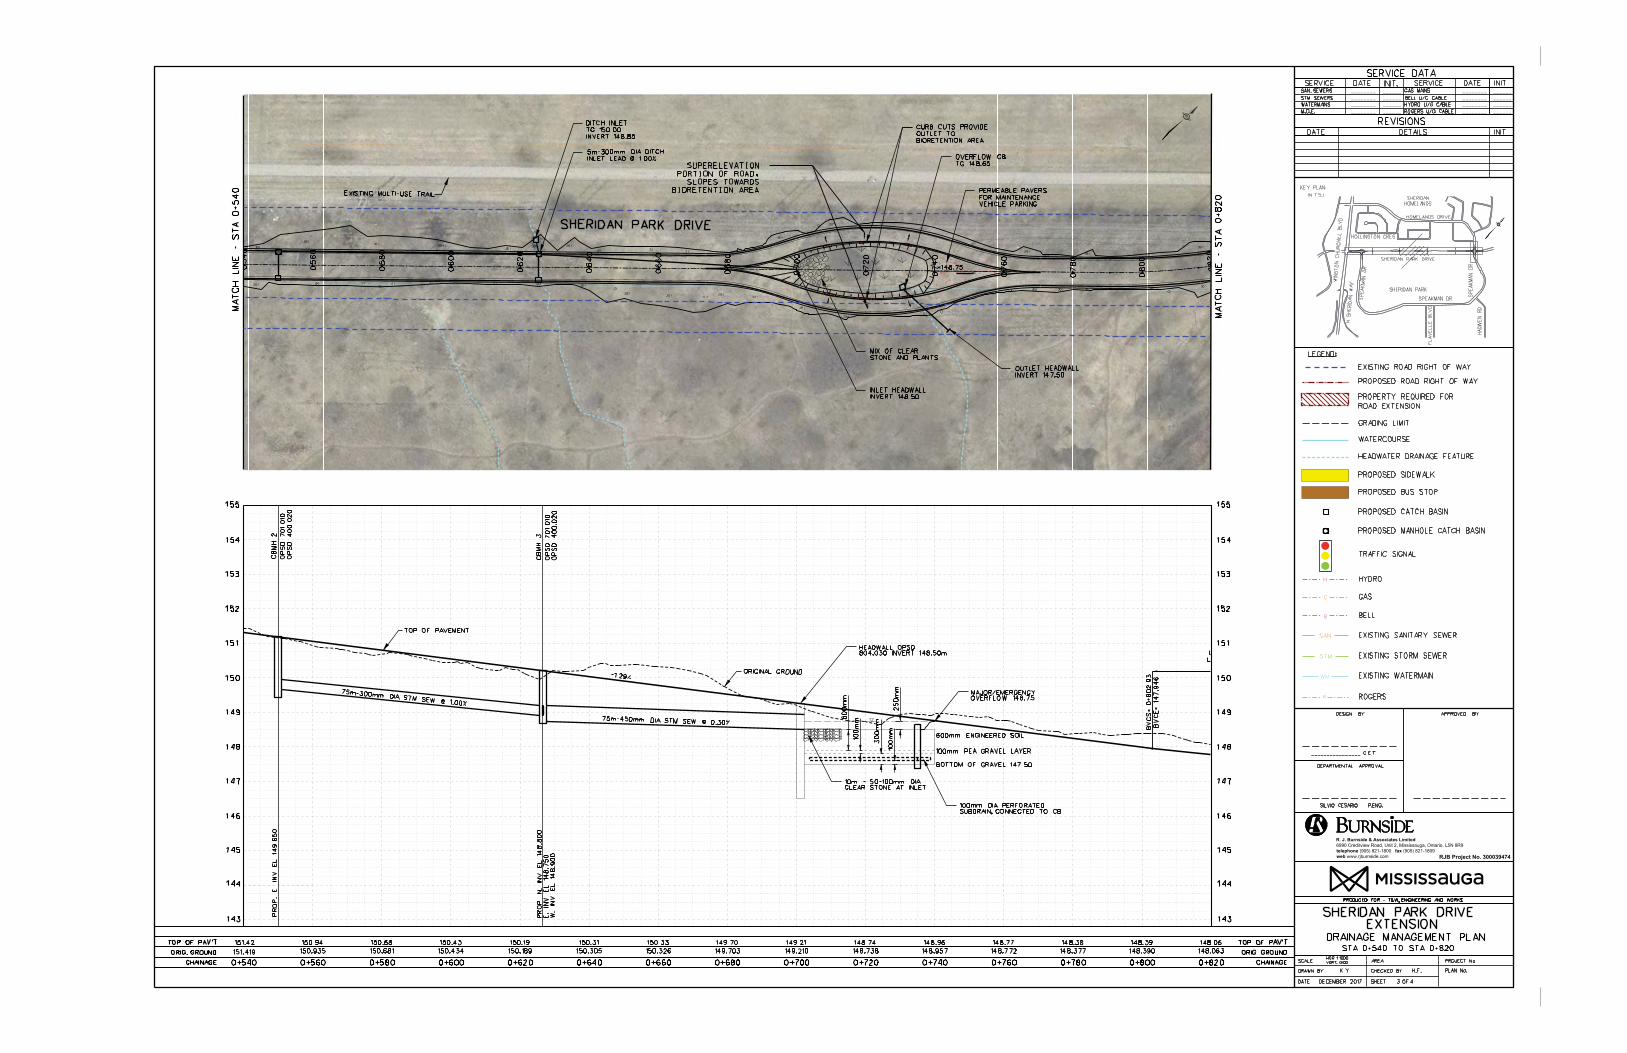
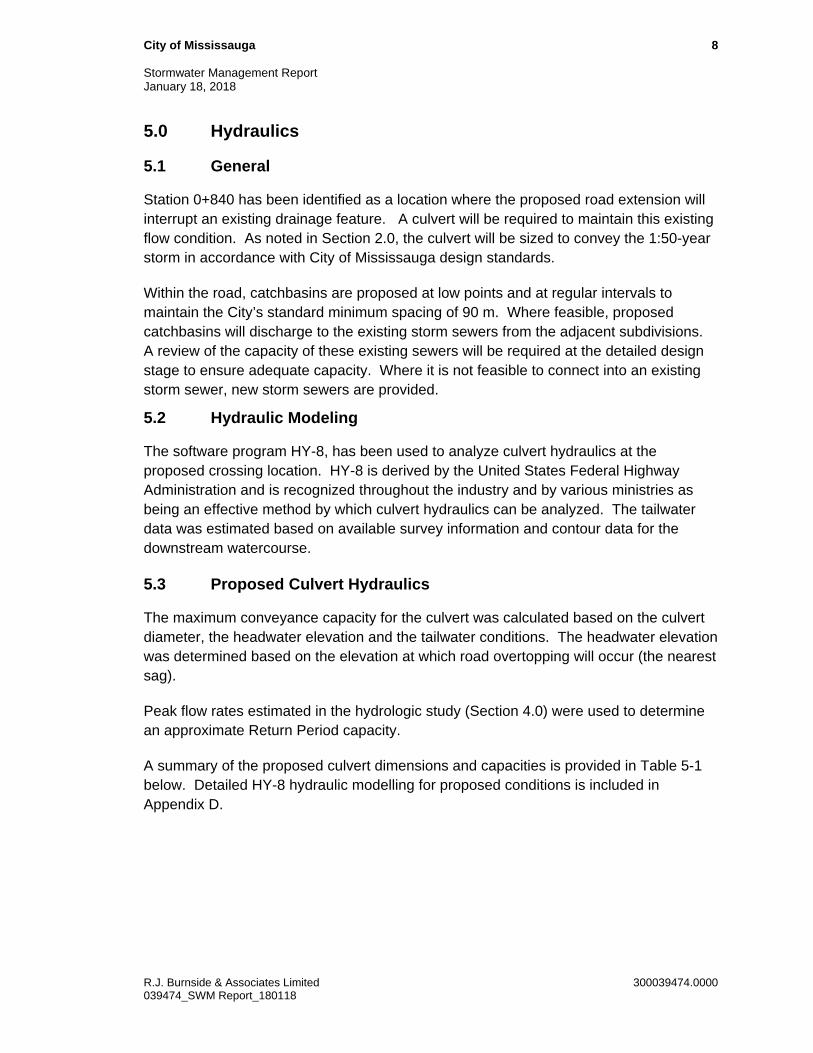
Station 0+840 has been identified as a location where the proposed road extension will interrupt an existing drainage feature. A culvert will be required to maintain this existing flow condition. As noted in Section 2.0, the culvert will be sized to convey the 1:50-year storm in accordance with City of Mississauga design standards.
Within the road, catchbasins are proposed at low points and at regular intervals to maintain the City’s standard minimum spacing of 90 m. Where feasible, proposed catchbasins will discharge to the existing storm sewers from the adjacent subdivisions. A review of the capacity of these existing sewers will be required at the detailed design stage to ensure adequate capacity. Where it is not feasible to connect into an existing storm sewer, new storm sewers are provided.
5.2 Hydraulic Modeling
The software program HY-8, has been used to analyze culvert hydraulics at the proposed crossing location. HY-8 is derived by the United States Federal Highway Administration and is recognized throughout the industry and by various ministries as being an effective method by which culvert hydraulics can be analyzed. The tailwater data was estimated based on available survey information and contour data for the downstream watercourse.
5.3 Proposed Culvert Hydraulics
The maximum conveyance capacity for the culvert was calculated based on the culvert diameter, the headwater elevation and the tailwater conditions. The headwater elevation was determined based on the elevation at which road overtopping will occur (the nearest sag).
Peak flow rates estimated in the hydrologic study (Section 4.0) were used to determine an approximate Return Period capacity.
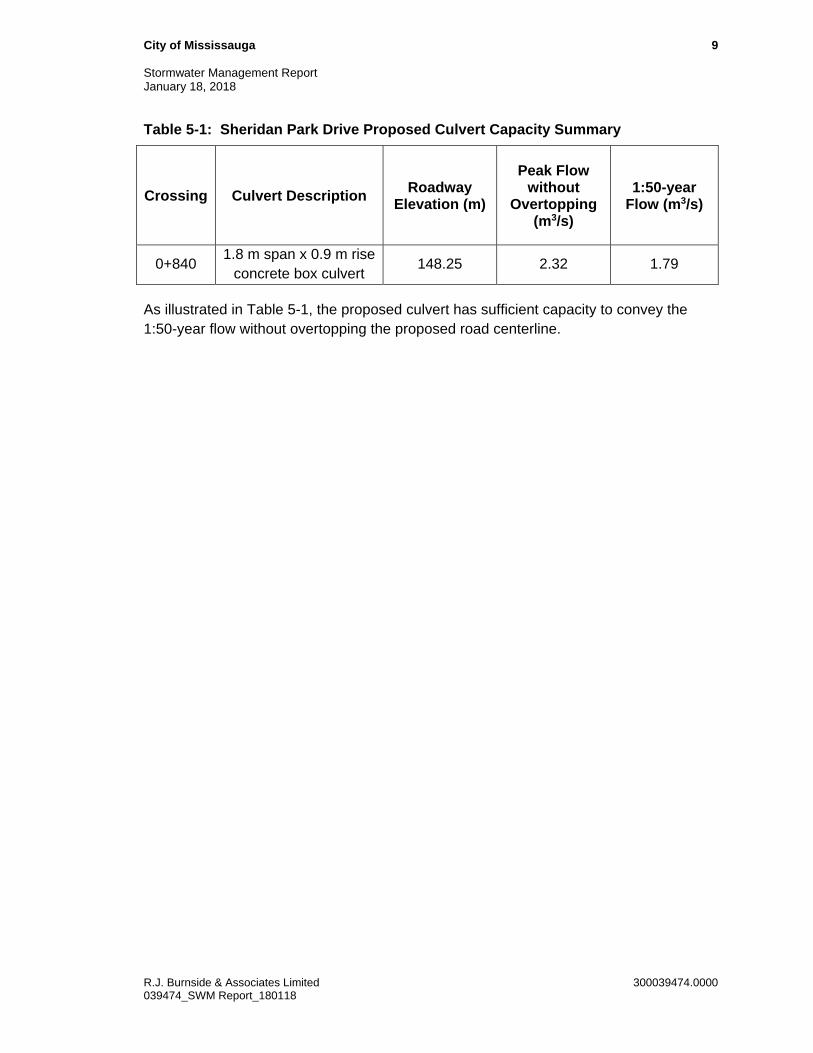
A summary of the proposed culvert dimensions and capacities is provided in Table 5-1 below. Detailed HY-8 hydraulic modelling for proposed conditions is included in Appendix D.
City of Mississauga 9 Stormwater Management Report January 18, 2018
R.J. Burnside & Associates Limited 300039474.0000 039474_SWM Report_180118
Table 5-1: Sheridan Park Drive Proposed Culvert Capacity Summary
Crossing Culvert Description Roadway
Elevation (m)
Peak Flow without
Overtopping (m3/s)
1:50-year Flow (m3/s)
0+840 1.8 m span x 0.9 m rise
concrete box culvert 148.25 2.32 1.79
As illustrated in Table 5-1, the proposed culvert has sufficient capacity to convey the 1:50-year flow without overtopping the proposed road centerline.
City of Mississauga 10 Stormwater Management Report January 18, 2018
R.J. Burnside & Associates Limited 300039474.0000 039474_SWM Report_180118
6.0 Water Quality
6.1 Enhanced Quality Control
The proposed roadway extension will have a very minor impact on the water quality; however, MOE criteria for “enhanced” water quality is required, where possible, prior to discharge into any watercourse or the natural environment. Given the site restrictions noted in Section 4.7, there are minimal opportunities to provide water quality control. As a best efforts approach, the eastern horizontal deflection (median) will be constructed as a bioretention filter and infiltration facility. This bioretention area is illustrated on the Drainage Management Plans provided in the back pocket of this report. This facility is proposed to treat a catchment area of approximately 3.13 ha, with 17% imperviousness (catchment areas 202 and 203). Minor runoff from the road ROW and tributary external area will enter the bioretention area through the proposed storm sewer system. Excess runoff which cannot be infiltrated will drain through a piped outlet to the existing channel crossing near Station 0+740. Major runoff will overflow to the east, following the slope of the road to a low point near Station 0+840.
Using the CVC/TRCA Low Impact Development Planning and Design Guide – Bioretention Fact Sheet (see Appendix E) as a basis for design, the following criteria have been considered:
Surface area of roughly 550 m2 provides a surface area to impervious drainage area ratio of 10.6, which is within the recommended 5:1 to 15:1 ratio.
Based on Table 3.2 of the 2003 MOE SWMP&D Manual, the required infiltration volume to satisfy an ‘enhanced’ level of treatment is 20 m3/ha, or 62 m3 (for catchment area of 3.13 ha). The current design calls for 300 mm thick layer of clear stone, with a void ratio of 40% which will provide an infiltration storage volume of 65 m3. Due to the underlying clay soils, a subdrain will be provided.
A small parking area is included in the design to accommodate a light-duty maintenance vehicle.
6.2 Water Balance
A water balance analysis ensures efforts are made to maintain existing ground infiltration amounts which may be reduced as a result of the proposed hardened surface. Site conditions are not ideal for infiltration, however, the bioretention area described in Section 6.1 will provide the best available opportunity to achieve water balance volumes.
The minimum City and CVC criteria for erosion protection is to detain the first 5mm of runoff on-site. The minimum CVC water balance criteria is to infiltrate the first 3mm of runoff. These targets are not cumulative, therefore, the 5mm runoff governs in this case. A more comprehensive water balance design may be necessary at detailed design.

City of Mississauga 11 Stormwater Management Report January 18, 2018
R.J. Burnside & Associates Limited 300039474.0000 039474_SWM Report_180118
The total proposed impervious area is approximately 8,000 m2. Therefore, the 5mm runoff volume is equal to 40 m3. As detailed in Section 6.1, the proposed bioretention area is designed to have an infiltration storage volume of 65 m3. This provided volume relates to a runoff depth of 8mm. Additional volume will also be provided in the 250mm vegetated ponding area above the infiltration gallery, which provides an opportunity for evapotranspiration.
City of Mississauga 12 Stormwater Management Report January 18, 2018
R.J. Burnside & Associates Limited 300039474.0000 039474_SWM Report_180118
7.0 Sediment and Erosion Controls
As part of the 50% Detailed Design Completion of the project, detailed, phased Erosion and Sediment Control Plans will be provided. The Erosion and Sediment Control Plans will include all necessary siltation control fence and designed in accordance with the current city of Mississauga guideline and the TRCA’s / CVC Erosion and Sediment Control Guidelines for Urban Construction (2006).
Below is a list of recommended erosion and sediment control measure that may be installed and maintained during construction of the subject site:
Temporary sediment control fence, and a tree protection fence if required will be installed prior to grading or any earth work;
Flow check dams, where necessary, to reduce velocity; Controlled access during construction to reduce mud trafficking; Use of Mud Mats and nightly clean-up of roads to prevent migration of sediment into
City streets; Employ on-site Sediment and Erosion Control inspectors to ensure that erosion
control practices are adhered to and any breaches are repaired immediately; Complete monthly Inspection reports.

City of Mississauga 13 Stormwater Management Report January 18, 2018
R.J. Burnside & Associates Limited 300039474.0000 039474_SWM Report_180118
8.0 Recommendations and Conclusions
This Stormwater Management Report has been prepared in support of Sheridan Park Drive Schedule B Class EA Study for the proposed extension of Sheridan Park Drive between Homelands Drive and Speakman Drive, in the City of Mississauga. A preliminary hydrologic and hydraulic analysis was completed to ensure that upstream lands are adequately conveyed through the right-of-way following the construction of the extension.
The proposed roadway extension does not alter the runoff potential for the catchment studied and, as a result, no mitigative quantity control measures are proposed for peak flows.
A ‘best efforts’ approach is proposed to address impacts to water quality which are, again, anticipated to be minimal. Nonetheless, a relatively large portion of the new road will be directed to a bioretention area, located within one of horizontal deflection medians. Runoff, which cannot be treated and infiltrated at this location, will be intercepted by an overflow system and directed to an existing drainage feature.
The bioretention area is designed to accommodate parking for a light-duty maintenance vehicle.
Detailed, phased Erosion and Sediment Control Plans will accompany the 50% Design Complete submission.

Ap
pen
dix A
Appendix A
Drainage Area Plan
DRAINAGE AREA PLAN
H.F. H.F.
101/201
5.46ha
103/203
1.76ha
102/202
1.37ha
104/204
1.18ha
106/206
3.23ha
105/205
0.55ha
101/201
5.46ha
1:3000
CATCHMENT ID(PRE/POST)
CATCHMENT AREA
OUTLET A
OUTLET BOUTLET C
302
112.6ha
301
59.4ha
OUTLET FOR EAST PORTIONOF HOMELANDS SUBDIVISION
OUTLET FOR WEST PORTIONOF HOMELANDS SUBDIVISION

Appendix B
Hydrologic Model Data
Ap
pen
dix B
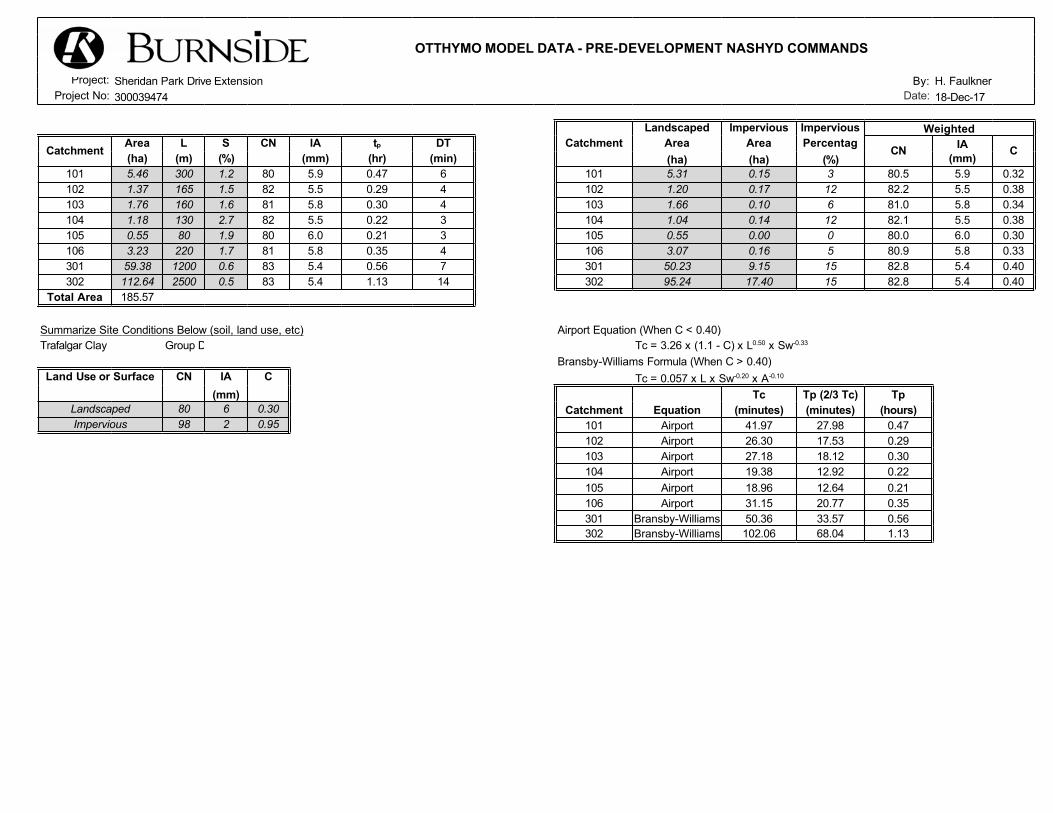
OTTHYMO MODEL DATA - PRE-DEVELOPMENT NASHYD COMMANDS
Project: Sheridan Park Drive Extension By: H. Faulkner Project No: 300039474 Date: 18-Dec-17
Landscaped Impervious Impervious Weighted
Catchment Area L S CN IA tp DT Catchment Area Area Percentag CN IA C(ha) (m) (%) (mm) (hr) (min) (ha) (ha) (%) (mm)101 5.46 300 1.2 80 5.9 0.47 6 101 5.31 0.15 3 80.5 5.9 0.32102 1.37 165 1.5 82 5.5 0.29 4 102 1.20 0.17 12 82.2 5.5 0.38103 1.76 160 1.6 81 5.8 0.30 4 103 1.66 0.10 6 81.0 5.8 0.34104 1.18 130 2.7 82 5.5 0.22 3 104 1.04 0.14 12 82.1 5.5 0.38105 0.55 80 1.9 80 6.0 0.21 3 105 0.55 0.00 0 80.0 6.0 0.30106 3.23 220 1.7 81 5.8 0.35 4 106 3.07 0.16 5 80.9 5.8 0.33301 59.38 1200 0.6 83 5.4 0.56 7 301 50.23 9.15 15 82.8 5.4 0.40302 112.64 2500 0.5 83 5.4 1.13 14 302 95.24 17.40 15 82.8 5.4 0.40
Total Area 185.57
Summarize Site Conditions Below (soil, land use, etc) Airport Equation (When C < 0.40)Trafalgar Clay Group D Tc = 3.26 x (1.1 - C) x L0.50 x Sw-0.33
Bransby-Williams Formula (When C > 0.40)Land Use or Surface CN IA C Tc = 0.057 x L x Sw-0.20 x A-0.10
(mm) Tc Tp (2/3 Tc) TpLandscaped 80 6 0.30 Catchment Equation (minutes) (minutes) (hours)Impervious 98 2 0.95 101 Airport 41.97 27.98 0.47
102 Airport 26.30 17.53 0.29103 Airport 27.18 18.12 0.30104 Airport 19.38 12.92 0.22105 Airport 18.96 12.64 0.21106 Airport 31.15 20.77 0.35301 Bransby-Williams 50.36 33.57 0.56302 Bransby-Williams 102.06 68.04 1.13
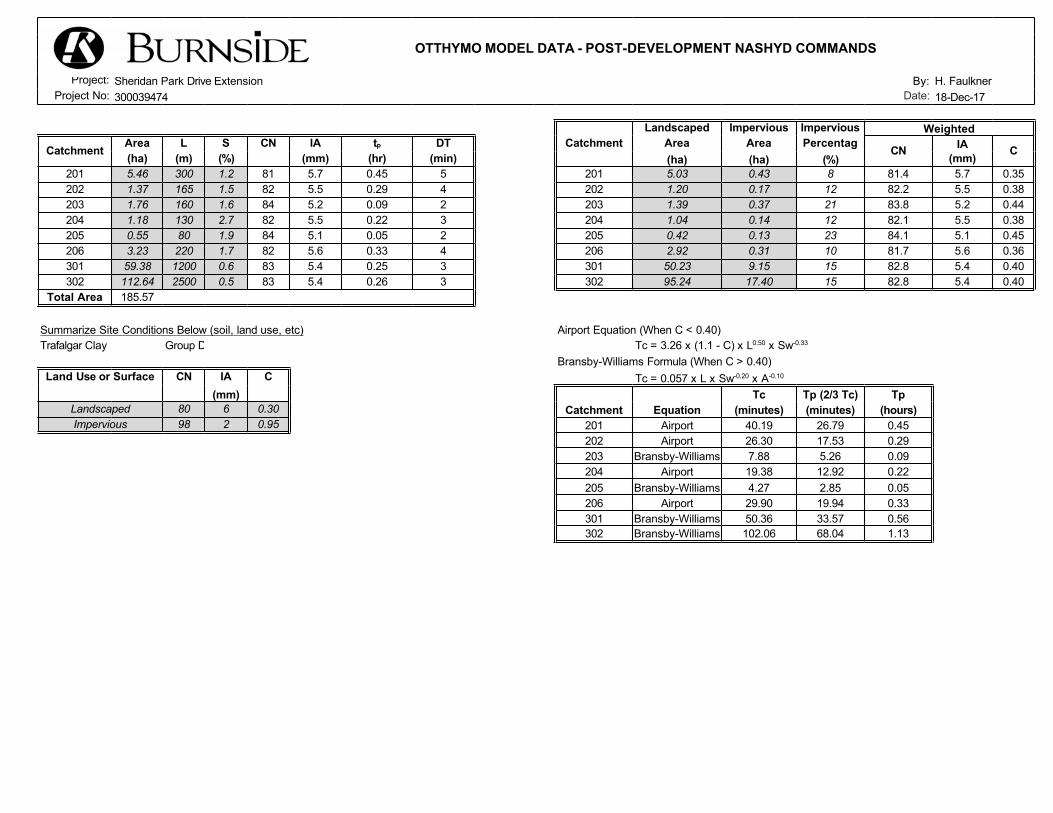
OTTHYMO MODEL DATA - POST-DEVELOPMENT NASHYD COMMANDS
Project: Sheridan Park Drive Extension By: H. Faulkner Project No: 300039474 Date: 18-Dec-17
Landscaped Impervious Impervious Weighted
Catchment Area L S CN IA tp DT Catchment Area Area Percentag CN IA C(ha) (m) (%) (mm) (hr) (min) (ha) (ha) (%) (mm)201 5.46 300 1.2 81 5.7 0.45 5 201 5.03 0.43 8 81.4 5.7 0.35202 1.37 165 1.5 82 5.5 0.29 4 202 1.20 0.17 12 82.2 5.5 0.38203 1.76 160 1.6 84 5.2 0.09 2 203 1.39 0.37 21 83.8 5.2 0.44204 1.18 130 2.7 82 5.5 0.22 3 204 1.04 0.14 12 82.1 5.5 0.38205 0.55 80 1.9 84 5.1 0.05 2 205 0.42 0.13 23 84.1 5.1 0.45206 3.23 220 1.7 82 5.6 0.33 4 206 2.92 0.31 10 81.7 5.6 0.36301 59.38 1200 0.6 83 5.4 0.25 3 301 50.23 9.15 15 82.8 5.4 0.40302 112.64 2500 0.5 83 5.4 0.26 3 302 95.24 17.40 15 82.8 5.4 0.40
Total Area 185.57
Summarize Site Conditions Below (soil, land use, etc) Airport Equation (When C < 0.40)Trafalgar Clay Group D Tc = 3.26 x (1.1 - C) x L0.50 x Sw-0.33
Bransby-Williams Formula (When C > 0.40)Land Use or Surface CN IA C Tc = 0.057 x L x Sw-0.20 x A-0.10
(mm) Tc Tp (2/3 Tc) TpLandscaped 80 6 0.30 Catchment Equation (minutes) (minutes) (hours)Impervious 98 2 0.95 201 Airport 40.19 26.79 0.45
202 Airport 26.30 17.53 0.29203 Bransby-Williams 7.88 5.26 0.09204 Airport 19.38 12.92 0.22205 Bransby-Williams 4.27 2.85 0.05206 Airport 29.90 19.94 0.33301 Bransby-Williams 50.36 33.57 0.56302 Bransby-Williams 102.06 68.04 1.13

Appendix C
OTTHYMO Model Output
Ap
pen
dix C

OTTHYMO SCHEMATIC
PRE-DEVELOPMENT POST-DEVELOPMENT
===========================================================================================================
V V I SSSSS U U A L V V I SS U U A A L V V I SS U U AAAAA L V V I SS U U A A L VV I SSSSS UUUUU A A LLLLL OOO TTTTT TTTTT H H Y Y M M OOO TM O O T T H H Y Y MM MM O O O O T T H H Y M M O O OOO T T H H Y M M OOODeveloped and Distributed by Civica InfrastructureCopyright 2007 - 2013 Civica InfrastructureAll rights reserved. ***** S U M M A R Y O U T P U T *****
Input filename: C:\Program Files (x86)\VO Suite 3.0\VO2\voin.dat Output filename: C:\Users\hfaulkner\AppData\Local\Temp\5d386156-70e4-411f-bad3-2103062fc1ea\Scenario.out Summary filename: C:\Users\hfaulkner\AppData\Local\Temp\5d386156-70e4-411f-bad3-2103062fc1ea\Scenario.sum
DATE: 12/18/2017 TIME: 12:05:33
USER:
COMMENTS: ____________________________________________________________
**************************** ** SIMULATION NUMBER: 1 ** **************************** W/E COMMAND HYD ID DT AREA ' Qpeak Tpeak R.V. R.C. Qbase min ha ' cms hrs mm cms
START @ 0.00 hrs -------------------- MASS STORM 12.0 [ Ptot= 50.20 mm ]* ** CALIB NASHYD 0101 1 6.0 5.46 0.14 12.40 18.20 0.36 0.000 [CN=80.0 ] [ N = 3.0:Tp 0.47]* ** CALIB NASHYD 0301 1 5.0 59.38 1.53 12.50 20.73 0.41 0.000 [CN=83.0 ] [ N = 3.0:Tp 0.56]* DUHYD 0041 1 5.0 59.38 1.53 12.50 20.73 n/a 0.000 MAJOR SYSTEM: 0041 2 5.0 0.00 0.00 0.00 0.00 n/a 0.000 MINOR SYSTEM: 0041 3 5.0 59.38 1.53 12.50 20.73 n/a 0.000* ADD [0101 + 0041] 0013 3 6.0 5.46 0.14 12.40 18.20 n/a 0.000* ADD [0013 + 0041] 0014 3 5.0 64.84 1.66 12.42 20.52 n/a 0.000* ** CALIB NASHYD 0102 1 4.0 1.37 0.05 12.20 19.89 0.40 0.000 [CN=82.0 ] [ N = 3.0:Tp 0.29]* ** CALIB NASHYD 0103 1 4.0 1.76 0.06 12.20 18.96 0.38 0.000 [CN=81.0 ] [ N = 3.0:Tp 0.30]* ADD [0102 + 0103] 0010 3 4.0 3.13 0.12 12.20 19.36 n/a 0.000* ** CALIB NASHYD 0104 1 3.0 1.18 0.06 12.10 19.89 0.40 0.000 [CN=82.0 ] [ N = 3.0:Tp 0.22]* ** CALIB NASHYD 0105 1 3.0 0.55 0.02 12.10 18.13 0.36 0.000 [CN=80.0 ] [ N = 3.0:Tp 0.21]* ADD [0104 + 0105] 0011 3 3.0 1.73 0.08 12.10 19.33 n/a 0.000* ** CALIB NASHYD 0302 1 5.0 112.64 1.71 13.08 20.73 0.41 0.000 [CN=83.0 ] [ N = 3.0:Tp 1.13]* DUHYD 0040 1 5.0 112.64 1.71 13.08 20.73 n/a 0.000 MAJOR SYSTEM: 0040 2 5.0 0.00 0.00 0.00 0.00 n/a 0.000 MINOR SYSTEM: 0040 3 5.0 112.64 1.71 13.08 20.73 n/a 0.000* ADD [0010 + 0011] 0012 3 3.0 4.86 0.19 12.15 19.35 n/a 0.000* ADD [0012 + 0040] 0012 1 3.0 4.86 0.19 12.15 19.35 n/a 0.000* ** CALIB NASHYD 0106 1 4.0 3.23 0.11 12.27 18.96 0.38 0.000 [CN=81.0 ] [ N = 3.0:Tp 0.35]* ADD [0106 + 0040] 0015 3 4.0 115.87 1.74 13.07 20.68 n/a 0.000* ADD [0012 + 0014] 0016 3 3.0 69.70 1.79 12.40 20.43 n/a 0.000* ADD [0016 + 0015] 0016 1 3.0 185.57 3.16 12.60 20.59 n/a 0.000* ** CALIB NASHYD 0205 1 2.0 0.55 0.05 12.00 21.51 0.43 0.000 [CN=84.0 ] [ N = 3.0:Tp 0.05]* ** CALIB NASHYD 0206 1 4.0 3.23 0.12 12.20 19.82 0.39 0.000 [CN=82.0 ] [ N = 3.0:Tp 0.33]* ** CALIB NASHYD 3002 1 5.0 112.64 1.71 13.08 20.73 0.41 0.000 [CN=83.0 ] [ N = 3.0:Tp 1.13]* DUHYD 0050 1 5.0 112.64 1.71 13.08 20.73 n/a 0.000 MAJOR SYSTEM: 0050 2 5.0 0.00 0.00 0.00 0.00 n/a 0.000 MINOR SYSTEM: 0050 3 5.0 112.64 1.71 13.08 20.73 n/a 0.000* ADD [0205 + 0206] 0025 3 2.0 3.78 0.13 12.00 20.06 n/a 0.000* ADD [0025 + 0050] 0025 1 2.0 116.42 1.74 13.10 20.71 n/a 0.000* ** CALIB NASHYD 0201 1 5.0 5.46 0.15 12.33 19.02 0.38 0.000 [CN=81.0 ] [ N = 3.0:Tp 0.45]* ** CALIB NASHYD 3001 1 5.0 59.38 1.53 12.50 20.73 0.41 0.000 [CN=83.0 ] [ N = 3.0:Tp 0.56]* DUHYD 0051 1 5.0 59.38 1.53 12.50 20.73 n/a 0.000 MAJOR SYSTEM: 0051 2 5.0 0.00 0.00 0.00 0.00 n/a 0.000 MINOR SYSTEM: 0051 3 5.0 59.38 1.53 12.50 20.73 n/a 0.000* ADD [0201 + 0051] 0023 3 5.0 5.46 0.15 12.33 19.02 n/a 0.000* ADD [0023 + 0051] 0024 3 5.0 64.84 1.67 12.42 20.58 n/a 0.000*
** CALIB NASHYD 0203 1 2.0 1.76 0.14 12.00 21.66 0.43 0.000 [CN=84.0 ] [ N = 3.0:Tp 0.09]* ** CALIB NASHYD 0202 1 4.0 1.37 0.05 12.20 19.89 0.40 0.000 [CN=82.0 ] [ N = 3.0:Tp 0.29]* ADD [0202 + 0203] 0020 3 2.0 3.13 0.18 12.03 20.88 n/a 0.000* ** CALIB NASHYD 0204 1 3.0 1.18 0.06 12.10 19.89 0.40 0.000 [CN=82.0 ] [ N = 3.0:Tp 0.22]* ADD [0204 + 0050] 0021 3 3.0 1.18 0.06 12.10 19.89 n/a 0.000* ADD [0020 + 0021] 0022 3 2.0 4.31 0.23 12.03 20.61 n/a 0.000* ADD [0022 + 0024] 0026 3 2.0 69.15 1.76 12.43 20.59 n/a 0.000* ADD [0026 + 0025] 0026 1 2.0 185.57 3.15 12.60 20.66 n/a 0.000* **************************** ** SIMULATION NUMBER: 2 ** **************************** W/E COMMAND HYD ID DT AREA ' Qpeak Tpeak R.V. R.C. Qbase min ha ' cms hrs mm cms
START @ 0.00 hrs -------------------- MASS STORM 12.0 [ Ptot= 67.50 mm ]* ** CALIB NASHYD 0101 1 6.0 5.46 0.23 12.30 30.33 0.45 0.000 [CN=80.0 ] [ N = 3.0:Tp 0.47]* ** CALIB NASHYD 0301 1 5.0 59.38 2.53 12.42 33.79 0.50 0.000 [CN=83.0 ] [ N = 3.0:Tp 0.56]* DUHYD 0041 1 5.0 59.38 2.53 12.42 33.79 n/a 0.000 MAJOR SYSTEM: 0041 2 5.0 0.00 0.00 0.00 0.00 n/a 0.000 MINOR SYSTEM: 0041 3 5.0 59.38 2.53 12.42 33.79 n/a 0.000* ADD [0101 + 0041] 0013 3 6.0 5.46 0.23 12.30 30.33 n/a 0.000* ADD [0013 + 0041] 0014 3 5.0 64.84 2.76 12.42 33.50 n/a 0.000* ** CALIB NASHYD 0102 1 4.0 1.37 0.09 12.13 32.64 0.48 0.000 [CN=82.0 ] [ N = 3.0:Tp 0.29]* ** CALIB NASHYD 0103 1 4.0 1.76 0.11 12.20 31.38 0.46 0.000 [CN=81.0 ] [ N = 3.0:Tp 0.30]* ADD [0102 + 0103] 0010 3 4.0 3.13 0.20 12.20 31.93 n/a 0.000* ** CALIB NASHYD 0104 1 3.0 1.18 0.09 12.10 32.64 0.48 0.000 [CN=82.0 ] [ N = 3.0:Tp 0.22]* ** CALIB NASHYD 0105 1 3.0 0.55 0.04 12.10 30.25 0.45 0.000 [CN=80.0 ] [ N = 3.0:Tp 0.21]* ADD [0104 + 0105] 0011 3 3.0 1.73 0.13 12.10 31.88 n/a 0.000* ** CALIB NASHYD 0302 1 5.0 112.64 2.84 13.08 33.79 0.50 0.000 [CN=83.0 ] [ N = 3.0:Tp 1.13]* DUHYD 0040 1 5.0 112.64 2.84 13.08 33.79 n/a 0.000 MAJOR SYSTEM: 0040 2 5.0 0.00 0.00 0.00 0.00 n/a 0.000 MINOR SYSTEM: 0040 3 5.0 112.64 2.84 13.08 33.79 n/a 0.000* ADD [0010 + 0011] 0012 3 3.0 4.86 0.32 12.15 31.91 n/a 0.000* ADD [0012 + 0040] 0012 1 3.0 4.86 0.32 12.15 31.91 n/a 0.000* ** CALIB NASHYD 0106 1 4.0 3.23 0.18 12.20 31.39 0.46 0.000 [CN=81.0 ] [ N = 3.0:Tp 0.35]* ADD [0106 + 0040] 0015 3 4.0 115.87 2.88 13.07 33.72 n/a 0.000* ADD [0012 + 0014] 0016 3 3.0 69.70 2.97 12.40 33.39 n/a 0.000* ADD [0016 + 0015] 0016 1 3.0 185.57 5.27 12.60 33.60 n/a 0.000* ** CALIB NASHYD 0205 1 2.0 0.55 0.08 12.00 34.74 0.51 0.000 [CN=84.0 ] [ N = 3.0:Tp 0.05]* ** CALIB NASHYD 0206 1 4.0 3.23 0.19 12.20 32.56 0.48 0.000 [CN=82.0 ] [ N = 3.0:Tp 0.33]* ** CALIB NASHYD 3002 1 5.0 112.64 2.84 13.08 33.79 0.50 0.000 [CN=83.0 ] [ N = 3.0:Tp 1.13]* DUHYD 0050 1 5.0 112.64 2.84 13.08 33.79 n/a 0.000 MAJOR SYSTEM: 0050 2 5.0 0.00 0.00 0.00 0.00 n/a 0.000 MINOR SYSTEM: 0050 3 5.0 112.64 2.84 13.08 33.79 n/a 0.000* ADD [0205 + 0206] 0025 3 2.0 3.78 0.21 12.00 32.88 n/a 0.000* ADD [0025 + 0050] 0025 1 2.0 116.42 2.89 13.07 33.76 n/a 0.000* ** CALIB NASHYD 0201 1 5.0 5.46 0.25 12.33 31.46 0.47 0.000 [CN=81.0 ] [ N = 3.0:Tp 0.45]* ** CALIB NASHYD 3001 1 5.0 59.38 2.53 12.42 33.79 0.50 0.000 [CN=83.0 ] [ N = 3.0:Tp 0.56]* DUHYD 0051 1 5.0 59.38 2.53 12.42 33.79 n/a 0.000 MAJOR SYSTEM: 0051 2 5.0 0.00 0.00 0.00 0.00 n/a 0.000 MINOR SYSTEM: 0051 3 5.0 59.38 2.53 12.42 33.79 n/a 0.000* ADD [0201 + 0051] 0023 3 5.0 5.46 0.25 12.33 31.46 n/a 0.000* ADD [0023 + 0051] 0024 3 5.0 64.84 2.78 12.42 33.59 n/a 0.000* ** CALIB NASHYD 0203 1 2.0 1.76 0.22 12.00 35.02 0.52 0.000 [CN=84.0 ] [ N = 3.0:Tp 0.09]* ** CALIB NASHYD 0202 1 4.0 1.37 0.09 12.13 32.64 0.48 0.000 [CN=82.0 ] [ N = 3.0:Tp 0.29]* ADD [0202 + 0203] 0020 3 2.0 3.13 0.29 12.00 33.98 n/a 0.000* ** CALIB NASHYD 0204 1 3.0 1.18 0.09 12.10 32.64 0.48 0.000 [CN=82.0 ] [ N = 3.0:Tp 0.22]* ADD [0204 + 0050] 0021 3 3.0 1.18 0.09 12.10 32.64 n/a 0.000
* ADD [0020 + 0021] 0022 3 2.0 4.31 0.38 12.03 33.61 n/a 0.000* ADD [0022 + 0024] 0026 3 2.0 69.15 2.92 12.40 33.60 n/a 0.000* ADD [0026 + 0025] 0026 1 2.0 185.57 5.24 12.60 33.70 n/a 0.000* **************************** ** SIMULATION NUMBER: 3 ** **************************** W/E COMMAND HYD ID DT AREA ' Qpeak Tpeak R.V. R.C. Qbase min ha ' cms hrs mm cms
START @ 0.00 hrs -------------------- MASS STORM 12.0 [ Ptot= 83.20 mm ]* ** CALIB NASHYD 0101 1 6.0 5.46 0.33 12.30 42.43 0.51 0.000 [CN=80.0 ] [ N = 3.0:Tp 0.47]* ** CALIB NASHYD 0301 1 5.0 59.38 3.52 12.42 46.62 0.56 0.000 [CN=83.0 ] [ N = 3.0:Tp 0.56]* DUHYD 0041 1 5.0 59.38 3.52 12.42 46.62 n/a 0.000 MAJOR SYSTEM: 0041 2 5.0 0.00 0.00 12.42 46.62 n/a 0.000 MINOR SYSTEM: 0041 3 5.0 59.38 3.52 12.42 46.62 n/a 0.000* ADD [0101 + 0041] 0013 3 5.0 5.46 0.33 12.33 42.43 n/a 0.000* ADD [0013 + 0041] 0014 3 5.0 64.84 3.85 12.42 46.27 n/a 0.000* ** CALIB NASHYD 0102 1 4.0 1.37 0.12 12.13 45.23 0.54 0.000 [CN=82.0 ] [ N = 3.0:Tp 0.29]* ** CALIB NASHYD 0103 1 4.0 1.76 0.15 12.20 43.73 0.53 0.000 [CN=81.0 ] [ N = 3.0:Tp 0.30]* ADD [0102 + 0103] 0010 3 4.0 3.13 0.27 12.13 44.38 n/a 0.000* ** CALIB NASHYD 0104 1 3.0 1.18 0.13 12.10 45.23 0.54 0.000 [CN=82.0 ] [ N = 3.0:Tp 0.22]* ** CALIB NASHYD 0105 1 3.0 0.55 0.06 12.10 42.35 0.51 0.000 [CN=80.0 ] [ N = 3.0:Tp 0.21]* ADD [0104 + 0105] 0011 3 3.0 1.73 0.19 12.10 44.31 n/a 0.000* ** CALIB NASHYD 0302 1 5.0 112.64 3.95 13.08 46.62 0.56 0.000 [CN=83.0 ] [ N = 3.0:Tp 1.13]* DUHYD 0040 1 5.0 112.64 3.95 13.08 46.62 n/a 0.000 MAJOR SYSTEM: 0040 2 5.0 0.00 0.00 0.00 0.00 n/a 0.000 MINOR SYSTEM: 0040 3 5.0 112.64 3.95 13.08 46.62 n/a 0.000* ADD [0010 + 0011] 0012 3 3.0 4.86 0.45 12.15 44.36 n/a 0.000* ADD [0012 + 0040] 0012 1 3.0 4.86 0.45 12.15 44.36 n/a 0.000* ** CALIB NASHYD 0106 1 4.0 3.23 0.25 12.20 43.73 0.53 0.000 [CN=81.0 ] [ N = 3.0:Tp 0.35]* ADD [0106 + 0040] 0015 3 4.0 115.87 4.01 13.07 46.54 n/a 0.000* ADD [0012 + 0014] 0016 3 3.0 69.70 4.14 12.40 46.14 n/a 0.000* ADD [0016 + 0015] 0016 1 3.0 185.57 7.35 12.60 46.39 n/a 0.000* ** CALIB NASHYD 0205 1 2.0 0.55 0.11 12.00 47.67 0.57 0.000 [CN=84.0 ] [ N = 3.0:Tp 0.05]* ** CALIB NASHYD 0206 1 4.0 3.23 0.27 12.20 45.15 0.54 0.000 [CN=82.0 ] [ N = 3.0:Tp 0.33]* ** CALIB NASHYD 3002 1 5.0 112.64 3.95 13.08 46.62 0.56 0.000 [CN=83.0 ] [ N = 3.0:Tp 1.13]* DUHYD 0050 1 5.0 112.64 3.95 13.08 46.62 n/a 0.000 MAJOR SYSTEM: 0050 2 5.0 0.00 0.00 0.00 0.00 n/a 0.000 MINOR SYSTEM: 0050 3 5.0 112.64 3.95 13.08 46.62 n/a 0.000* ADD [0205 + 0206] 0025 3 2.0 3.78 0.30 12.00 45.52 n/a 0.000* ADD [0025 + 0050] 0025 1 2.0 116.42 4.01 13.07 46.59 n/a 0.000* ** CALIB NASHYD 0201 1 5.0 5.46 0.35 12.33 43.81 0.53 0.000 [CN=81.0 ] [ N = 3.0:Tp 0.45]* ** CALIB NASHYD 3001 1 5.0 59.38 3.52 12.42 46.62 0.56 0.000 [CN=83.0 ] [ N = 3.0:Tp 0.56]* DUHYD 0051 1 5.0 59.38 3.52 12.42 46.62 n/a 0.000 MAJOR SYSTEM: 0051 2 5.0 0.00 0.00 12.42 46.62 n/a 0.000 MINOR SYSTEM: 0051 3 5.0 59.38 3.52 12.42 46.62 n/a 0.000* ADD [0201 + 0051] 0023 3 5.0 5.46 0.35 12.33 43.81 n/a 0.000* ADD [0023 + 0051] 0024 3 5.0 64.84 3.87 12.42 46.39 n/a 0.000* ** CALIB NASHYD 0203 1 2.0 1.76 0.31 12.00 48.08 0.58 0.000 [CN=84.0 ] [ N = 3.0:Tp 0.09]* ** CALIB NASHYD 0202 1 4.0 1.37 0.12 12.13 45.23 0.54 0.000 [CN=82.0 ] [ N = 3.0:Tp 0.29]* ADD [0202 + 0203] 0020 3 2.0 3.13 0.40 12.00 46.83 n/a 0.000* ** CALIB NASHYD 0204 1 3.0 1.18 0.13 12.10 45.23 0.54 0.000 [CN=82.0 ] [ N = 3.0:Tp 0.22]* ADD [0204 + 0050] 0021 3 3.0 1.18 0.13 12.10 45.23 n/a 0.000* ADD [0020 + 0021] 0022 3 2.0 4.31 0.52 12.03 46.39 n/a 0.000* ADD [0022 + 0024] 0026 3 2.0 69.15 4.06 12.40 46.39 n/a 0.000* ADD [0026 + 0025] 0026 1 2.0 185.57 7.30 12.60 46.51 n/a 0.000* **************************** ** SIMULATION NUMBER: 4 ** **************************** W/E COMMAND HYD ID DT AREA ' Qpeak Tpeak R.V. R.C. Qbase min ha ' cms hrs mm cms
START @ 0.00 hrs
-------------------- MASS STORM 12.0 [ Ptot= 95.50 mm ]* ** CALIB NASHYD 0101 1 6.0 5.46 0.41 12.30 52.43 0.55 0.000 [CN=80.0 ] [ N = 3.0:Tp 0.47]* ** CALIB NASHYD 0301 1 5.0 59.38 4.33 12.42 57.12 0.60 0.000 [CN=83.0 ] [ N = 3.0:Tp 0.56]* DUHYD 0041 1 5.0 59.38 4.33 12.42 57.12 n/a 0.000 MAJOR SYSTEM: 0041 2 5.0 2.10 0.81 12.42 57.12 n/a 0.000 MINOR SYSTEM: 0041 3 5.0 57.28 3.52 12.17 57.12 n/a 0.000* ADD [0101 + 0041] 0013 3 5.0 7.56 1.22 12.42 53.73 n/a 0.000* ADD [0013 + 0041] 0014 3 5.0 64.84 4.74 12.42 56.72 n/a 0.000* ** CALIB NASHYD 0102 1 4.0 1.37 0.15 12.13 55.56 0.58 0.000 [CN=82.0 ] [ N = 3.0:Tp 0.29]* ** CALIB NASHYD 0103 1 4.0 1.76 0.19 12.20 53.89 0.56 0.000 [CN=81.0 ] [ N = 3.0:Tp 0.30]* ADD [0102 + 0103] 0010 3 4.0 3.13 0.34 12.13 54.62 n/a 0.000* ** CALIB NASHYD 0104 1 3.0 1.18 0.16 12.10 55.56 0.58 0.000 [CN=82.0 ] [ N = 3.0:Tp 0.22]* ** CALIB NASHYD 0105 1 3.0 0.55 0.07 12.10 52.34 0.55 0.000 [CN=80.0 ] [ N = 3.0:Tp 0.21]* ADD [0104 + 0105] 0011 3 3.0 1.73 0.23 12.10 54.54 n/a 0.000* ** CALIB NASHYD 0302 1 5.0 112.64 4.85 13.08 57.12 0.60 0.000 [CN=83.0 ] [ N = 3.0:Tp 1.13]* DUHYD 0040 1 5.0 112.64 4.85 13.08 57.12 n/a 0.000 MAJOR SYSTEM: 0040 2 5.0 4.70 0.90 13.08 57.12 n/a 0.000 MINOR SYSTEM: 0040 3 5.0 107.94 3.95 12.58 57.12 n/a 0.000* ADD [0010 + 0011] 0012 3 3.0 4.86 0.56 12.15 54.59 n/a 0.000* ADD [0012 + 0040] 0012 1 3.0 9.56 0.99 13.05 55.83 n/a 0.000* ** CALIB NASHYD 0106 1 4.0 3.23 0.31 12.20 53.89 0.56 0.000 [CN=81.0 ] [ N = 3.0:Tp 0.35]* ADD [0106 + 0040] 0015 3 4.0 111.17 4.15 12.60 57.02 n/a 0.000* ADD [0012 + 0014] 0016 3 3.0 74.40 5.09 12.40 56.61 n/a 0.000* ADD [0016 + 0015] 0016 1 3.0 185.57 9.05 12.60 56.86 n/a 0.000* ** CALIB NASHYD 0205 1 2.0 0.55 0.13 12.00 58.21 0.61 0.000 [CN=84.0 ] [ N = 3.0:Tp 0.05]* ** CALIB NASHYD 0206 1 4.0 3.23 0.33 12.20 55.48 0.58 0.000 [CN=82.0 ] [ N = 3.0:Tp 0.33]* ** CALIB NASHYD 3002 1 5.0 112.64 4.85 13.08 57.12 0.60 0.000 [CN=83.0 ] [ N = 3.0:Tp 1.13]* DUHYD 0050 1 5.0 112.64 4.85 13.08 57.12 n/a 0.000 MAJOR SYSTEM: 0050 2 5.0 4.70 0.90 13.08 57.12 n/a 0.000 MINOR SYSTEM: 0050 3 5.0 107.94 3.95 12.58 57.12 n/a 0.000* ADD [0205 + 0206] 0025 3 2.0 3.78 0.37 12.00 55.88 n/a 0.000* ADD [0025 + 0050] 0025 1 2.0 111.72 4.15 12.60 57.08 n/a 0.000* ** CALIB NASHYD 0201 1 5.0 5.46 0.44 12.33 53.98 0.57 0.000 [CN=81.0 ] [ N = 3.0:Tp 0.45]* ** CALIB NASHYD 3001 1 5.0 59.38 4.33 12.42 57.12 0.60 0.000 [CN=83.0 ] [ N = 3.0:Tp 0.56]* DUHYD 0051 1 5.0 59.38 4.33 12.42 57.12 n/a 0.000 MAJOR SYSTEM: 0051 2 5.0 2.10 0.81 12.42 57.12 n/a 0.000 MINOR SYSTEM: 0051 3 5.0 57.28 3.52 12.17 57.12 n/a 0.000* ADD [0201 + 0051] 0023 3 5.0 7.56 1.24 12.42 54.85 n/a 0.000* ADD [0023 + 0051] 0024 3 5.0 64.84 4.76 12.42 56.85 n/a 0.000* ** CALIB NASHYD 0203 1 2.0 1.76 0.37 12.00 58.73 0.61 0.000 [CN=84.0 ] [ N = 3.0:Tp 0.09]* ** CALIB NASHYD 0202 1 4.0 1.37 0.15 12.13 55.56 0.58 0.000 [CN=82.0 ] [ N = 3.0:Tp 0.29]* ADD [0202 + 0203] 0020 3 2.0 3.13 0.49 12.00 57.34 n/a 0.000* ** CALIB NASHYD 0204 1 3.0 1.18 0.16 12.10 55.56 0.58 0.000 [CN=82.0 ] [ N = 3.0:Tp 0.22]* ADD [0204 + 0050] 0021 3 3.0 5.88 0.92 13.05 56.79 n/a 0.000* ADD [0020 + 0021] 0022 3 2.0 9.01 0.97 13.03 56.98 n/a 0.000* ADD [0022 + 0024] 0026 3 2.0 73.85 4.99 12.40 56.87 n/a 0.000* ADD [0026 + 0025] 0026 1 2.0 185.57 9.00 12.57 56.99 n/a 0.000* **************************** ** SIMULATION NUMBER: 5 ** **************************** W/E COMMAND HYD ID DT AREA ' Qpeak Tpeak R.V. R.C. Qbase min ha ' cms hrs mm cms
START @ 0.00 hrs -------------------- MASS STORM 12.0 [ Ptot=107.00 mm ]* ** CALIB NASHYD 0101 1 6.0 5.46 0.49 12.30 62.09 0.58 0.000 [CN=80.0 ] [ N = 3.0:Tp 0.47]* ** CALIB NASHYD 0301 1 5.0 59.38 5.10 12.42 67.19 0.63 0.000 [CN=83.0 ] [ N = 3.0:Tp 0.56]* DUHYD 0041 1 5.0 59.38 5.10 12.42 67.19 n/a 0.000 MAJOR SYSTEM: 0041 2 5.0 4.63 1.58 12.42 67.19 n/a 0.000 MINOR SYSTEM: 0041 3 5.0 54.75 3.52 12.17 67.19 n/a 0.000
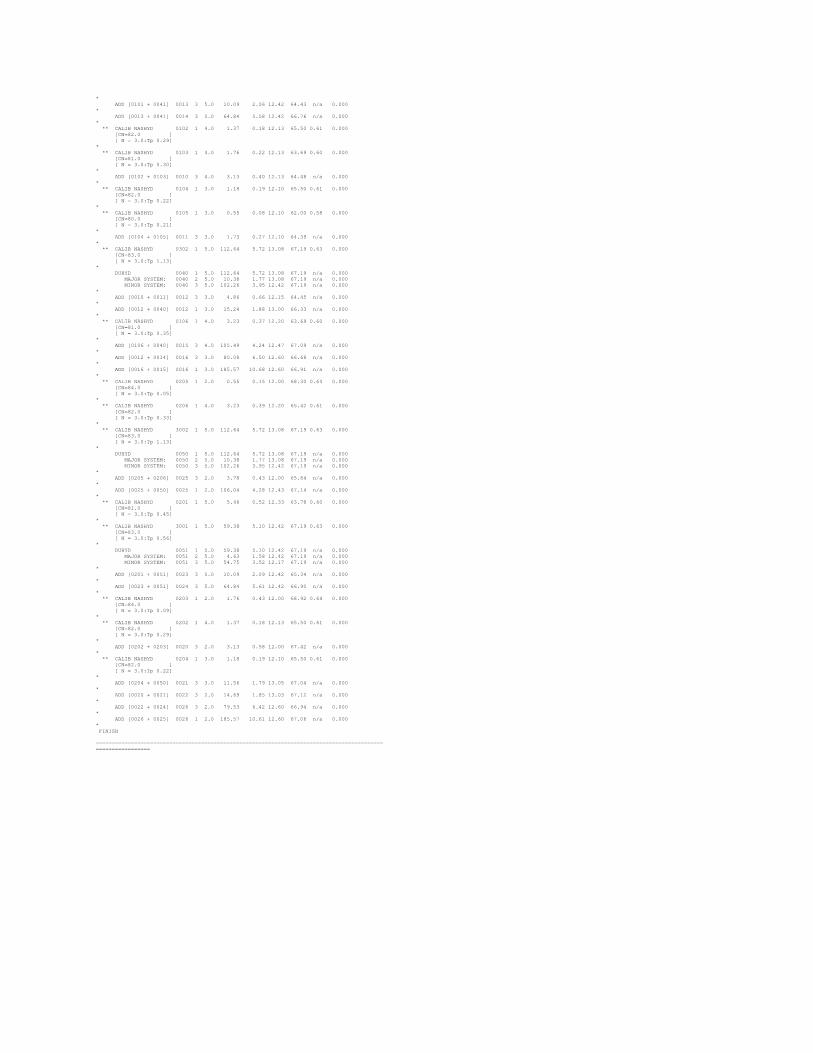
* ADD [0101 + 0041] 0013 3 5.0 10.09 2.06 12.42 64.43 n/a 0.000* ADD [0013 + 0041] 0014 3 5.0 64.84 5.58 12.42 66.76 n/a 0.000* ** CALIB NASHYD 0102 1 4.0 1.37 0.18 12.13 65.50 0.61 0.000 [CN=82.0 ] [ N = 3.0:Tp 0.29]* ** CALIB NASHYD 0103 1 4.0 1.76 0.22 12.13 63.69 0.60 0.000 [CN=81.0 ] [ N = 3.0:Tp 0.30]* ADD [0102 + 0103] 0010 3 4.0 3.13 0.40 12.13 64.48 n/a 0.000* ** CALIB NASHYD 0104 1 3.0 1.18 0.19 12.10 65.50 0.61 0.000 [CN=82.0 ] [ N = 3.0:Tp 0.22]* ** CALIB NASHYD 0105 1 3.0 0.55 0.08 12.10 62.00 0.58 0.000 [CN=80.0 ] [ N = 3.0:Tp 0.21]* ADD [0104 + 0105] 0011 3 3.0 1.73 0.27 12.10 64.39 n/a 0.000* ** CALIB NASHYD 0302 1 5.0 112.64 5.72 13.08 67.19 0.63 0.000 [CN=83.0 ] [ N = 3.0:Tp 1.13]* DUHYD 0040 1 5.0 112.64 5.72 13.08 67.19 n/a 0.000 MAJOR SYSTEM: 0040 2 5.0 10.38 1.77 13.08 67.19 n/a 0.000 MINOR SYSTEM: 0040 3 5.0 102.26 3.95 12.42 67.19 n/a 0.000* ADD [0010 + 0011] 0012 3 3.0 4.86 0.66 12.15 64.45 n/a 0.000* ADD [0012 + 0040] 0012 1 3.0 15.24 1.88 13.00 66.33 n/a 0.000* ** CALIB NASHYD 0106 1 4.0 3.23 0.37 12.20 63.69 0.60 0.000 [CN=81.0 ] [ N = 3.0:Tp 0.35]* ADD [0106 + 0040] 0015 3 4.0 105.49 4.24 12.47 67.09 n/a 0.000* ADD [0012 + 0014] 0016 3 3.0 80.08 6.50 12.60 66.68 n/a 0.000* ADD [0016 + 0015] 0016 1 3.0 185.57 10.68 12.60 66.91 n/a 0.000* ** CALIB NASHYD 0205 1 2.0 0.55 0.15 12.00 68.30 0.64 0.000 [CN=84.0 ] [ N = 3.0:Tp 0.05]* ** CALIB NASHYD 0206 1 4.0 3.23 0.39 12.20 65.42 0.61 0.000 [CN=82.0 ] [ N = 3.0:Tp 0.33]* ** CALIB NASHYD 3002 1 5.0 112.64 5.72 13.08 67.19 0.63 0.000 [CN=83.0 ] [ N = 3.0:Tp 1.13]* DUHYD 0050 1 5.0 112.64 5.72 13.08 67.19 n/a 0.000 MAJOR SYSTEM: 0050 2 5.0 10.38 1.77 13.08 67.19 n/a 0.000 MINOR SYSTEM: 0050 3 5.0 102.26 3.95 12.42 67.19 n/a 0.000* ADD [0205 + 0206] 0025 3 2.0 3.78 0.43 12.00 65.84 n/a 0.000* ADD [0025 + 0050] 0025 1 2.0 106.04 4.28 12.43 67.14 n/a 0.000* ** CALIB NASHYD 0201 1 5.0 5.46 0.52 12.33 63.78 0.60 0.000 [CN=81.0 ] [ N = 3.0:Tp 0.45]* ** CALIB NASHYD 3001 1 5.0 59.38 5.10 12.42 67.19 0.63 0.000 [CN=83.0 ] [ N = 3.0:Tp 0.56]* DUHYD 0051 1 5.0 59.38 5.10 12.42 67.19 n/a 0.000 MAJOR SYSTEM: 0051 2 5.0 4.63 1.58 12.42 67.19 n/a 0.000 MINOR SYSTEM: 0051 3 5.0 54.75 3.52 12.17 67.19 n/a 0.000* ADD [0201 + 0051] 0023 3 5.0 10.09 2.09 12.42 65.34 n/a 0.000* ADD [0023 + 0051] 0024 3 5.0 64.84 5.61 12.42 66.90 n/a 0.000* ** CALIB NASHYD 0203 1 2.0 1.76 0.43 12.00 68.92 0.64 0.000 [CN=84.0 ] [ N = 3.0:Tp 0.09]* ** CALIB NASHYD 0202 1 4.0 1.37 0.18 12.13 65.50 0.61 0.000 [CN=82.0 ] [ N = 3.0:Tp 0.29]* ADD [0202 + 0203] 0020 3 2.0 3.13 0.58 12.00 67.42 n/a 0.000* ** CALIB NASHYD 0204 1 3.0 1.18 0.19 12.10 65.50 0.61 0.000 [CN=82.0 ] [ N = 3.0:Tp 0.22]* ADD [0204 + 0050] 0021 3 3.0 11.56 1.79 13.05 67.04 n/a 0.000* ADD [0020 + 0021] 0022 3 2.0 14.69 1.85 13.03 67.12 n/a 0.000* ADD [0022 + 0024] 0026 3 2.0 79.53 6.42 12.60 66.94 n/a 0.000* ADD [0026 + 0025] 0026 1 2.0 185.57 10.61 12.60 67.06 n/a 0.000* FINISH ===========================================================================================================

=========================================================================================================== V V I SSSSS U U A L V V I SS U U A A L V V I SS U U AAAAA L V V I SS U U A A L VV I SSSSS UUUUU A A LLLLL OOO TTTTT TTTTT H H Y Y M M OOO TM O O T T H H Y Y MM MM O O O O T T H H Y M M O O OOO T T H H Y M M OOODeveloped and Distributed by Civica InfrastructureCopyright 2007 - 2013 Civica InfrastructureAll rights reserved. ***** D E T A I L E D O U T P U T *****
Input filename: C:\Program Files (x86)\VO Suite 3.0\VO2\voin.dat Output filename: C:\Users\hfaulkner\AppData\Local\Temp\c8936e73-3aee-421a-9fb0-4bfc97ff0070\Scenario.out Summary filename: C:\Users\hfaulkner\AppData\Local\Temp\c8936e73-3aee-421a-9fb0-4bfc97ff0070\Scenario.sum
DATE: 12/18/2017 TIME: 12:02:31
USER:
COMMENTS: ____________________________________________________________
----------------------------------------------------------------------------------------------------------- **************************** ** SIMULATION NUMBER: 6 ** **************************** --------------------| MASS STORM | Filename: C:\Users\hfaulkner\AppD | | ata\Local\Temp\ | | c8936e73-3aee-421a-9fb0-4bfc97ff0070\6d3a9bd3| Ptotal=119.40 mm | Comments: 24-HR SCS Type II -------------------- Duration of storm = 24.00 hrs Mass curve time step = 12.00 min TIME RAIN | TIME RAIN |' TIME RAIN | TIME RAIN hrs mm/hr | hrs mm/hr |' hrs mm/hr | hrs mm/hr 0.20 1.19 | 6.20 2.15 | 12.20 21.25 | 18.20 2.09 0.40 1.25 | 6.40 2.27 | 12.40 15.88 | 18.40 2.09 0.60 1.25 | 6.60 2.27 | 12.60 10.87 | 18.60 1.97 0.80 1.25 | 6.80 2.27 | 12.80 9.19 | 18.80 1.97 1.00 1.31 | 7.00 2.39 | 13.00 7.88 | 19.00 1.85 1.20 1.31 | 7.20 2.39 | 13.20 6.93 | 19.20 1.85 1.40 1.37 | 7.40 2.51 | 13.40 6.33 | 19.40 1.79 1.60 1.37 | 7.60 2.51 | 13.60 5.61 | 19.60 1.67 1.80 1.37 | 7.80 2.51 | 13.80 5.13 | 19.80 1.61 2.00 1.43 | 8.00 2.63 | 14.00 4.66 | 20.00 1.61 2.20 1.43 | 8.20 2.75 | 14.20 4.36 | 20.20 1.55 2.40 1.49 | 8.40 2.99 | 14.40 4.12 | 20.40 1.55 2.60 1.49 | 8.60 3.22 | 14.60 4.00 | 20.60 1.49 2.80 1.49 | 8.80 3.46 | 14.80 3.88 | 20.80 1.49 3.00 1.55 | 9.00 3.70 | 15.00 3.64 | 21.00 1.49 3.20 1.55 | 9.20 3.82 | 15.20 3.52 | 21.20 1.49 3.40 1.61 | 9.40 3.82 | 15.40 3.28 | 21.40 1.49 3.60 1.61 | 9.60 3.88 | 15.60 3.16 | 21.60 1.49 3.80 1.61 | 9.80 4.18 | 15.80 3.04 | 21.80 1.43 4.00 1.67 | 10.00 4.60 | 16.00 2.81 | 22.00 1.43 4.20 1.67 | 10.20 5.07 | 16.20 2.69 | 22.20 1.43 4.40 1.79 | 10.40 5.61 | 16.40 2.69 | 22.40 1.43 4.60 1.79 | 10.60 6.27 | 16.60 2.63 | 22.60 1.37 4.80 1.79 | 10.80 7.16 | 16.80 2.51 | 22.80 1.37 5.00 1.91 | 11.00 8.12 | 17.00 2.51 | 23.00 1.37 5.20 1.91 | 11.20 9.73 | 17.20 2.39 | 23.20 1.37 5.40 2.03 | 11.40 12.06 | 17.40 2.33 | 23.40 1.37 5.60 2.03 | 11.60 21.07 | 17.60 2.33 | 23.60 1.37 5.80 2.03 | 11.80 74.03 | 17.80 2.21 | 23.80 1.31 6.00 2.15 | 12.00 138.62 | 18.00 2.21 | 24.00 1.31 ---------------------------------------------------------------------------------------------------| CALIB || NASHYD (0101) | Area (ha)= 5.46 Curve Number (CN)= 80.0|ID= 1 DT= 6.0 min | Ia (mm)= 5.90 # of Linear Res.(N)= 3.00-------------------- U.H. Tp(hrs)= 0.47 NOTE: RAINFALL WAS TRANSFORMED TO 6.0 MIN. TIME STEP.
---- TRANSFORMED HYETOGRAPH ---- TIME RAIN | TIME RAIN |' TIME RAIN | TIME RAIN hrs mm/hr | hrs mm/hr |' hrs mm/hr | hrs mm/hr 0.100 1.19 | 6.100 2.15 |12.100 21.25 | 18.10 2.09 0.200 1.19 | 6.200 2.15 |12.200 21.25 | 18.20 2.09 0.300 1.25 | 6.300 2.27 |12.300 15.88 | 18.30 2.09 0.400 1.25 | 6.400 2.27 |12.400 15.88 | 18.40 2.09 0.500 1.25 | 6.500 2.27 |12.500 10.87 | 18.50 1.97 0.600 1.25 | 6.600 2.27 |12.600 10.87 | 18.60 1.97 0.700 1.25 | 6.700 2.27 |12.700 9.19 | 18.70 1.97 0.800 1.25 | 6.800 2.27 |12.800 9.19 | 18.80 1.97 0.900 1.31 | 6.900 2.39 |12.900 7.88 | 18.90 1.85 1.000 1.31 | 7.000 2.39 |13.000 7.88 | 19.00 1.85 1.100 1.31 | 7.100 2.39 |13.100 6.93 | 19.10 1.85 1.200 1.31 | 7.200 2.39 |13.200 6.93 | 19.20 1.85 1.300 1.37 | 7.300 2.51 |13.300 6.33 | 19.30 1.79 1.400 1.37 | 7.400 2.51 |13.400 6.33 | 19.40 1.79 1.500 1.37 | 7.500 2.51 |13.500 5.61 | 19.50 1.67 1.600 1.37 | 7.600 2.51 |13.600 5.61 | 19.60 1.67 1.700 1.37 | 7.700 2.51 |13.700 5.13 | 19.70 1.61 1.800 1.37 | 7.800 2.51 |13.800 5.13 | 19.80 1.61 1.900 1.43 | 7.900 2.63 |13.900 4.66 | 19.90 1.61 2.000 1.43 | 8.000 2.63 |14.000 4.66 | 20.00 1.61 2.100 1.43 | 8.100 2.75 |14.100 4.36 | 20.10 1.55 2.200 1.43 | 8.200 2.75 |14.200 4.36 | 20.20 1.55 2.300 1.49 | 8.300 2.98 |14.300 4.12 | 20.30 1.55 2.400 1.49 | 8.400 2.99 |14.400 4.12 | 20.40 1.55 2.500 1.49 | 8.500 3.22 |14.500 4.00 | 20.50 1.49 2.600 1.49 | 8.600 3.22 |14.600 4.00 | 20.60 1.49 2.700 1.49 | 8.700 3.46 |14.700 3.88 | 20.70 1.49 2.800 1.49 | 8.800 3.46 |14.800 3.88 | 20.80 1.49 2.900 1.55 | 8.900 3.70 |14.900 3.64 | 20.90 1.49 3.000 1.55 | 9.000 3.70 |15.000 3.64 | 21.00 1.49 3.100 1.55 | 9.100 3.82 |15.100 3.52 | 21.10 1.49 3.200 1.55 | 9.200 3.82 |15.200 3.52 | 21.20 1.49 3.300 1.61 | 9.300 3.82 |15.300 3.28 | 21.30 1.49 3.400 1.61 | 9.400 3.82 |15.400 3.28 | 21.40 1.49 3.500 1.61 | 9.500 3.88 |15.500 3.16 | 21.50 1.49 3.600 1.61 | 9.600 3.88 |15.600 3.16 | 21.60 1.49 3.700 1.61 | 9.700 4.18 |15.700 3.04 | 21.70 1.43 3.800 1.61 | 9.800 4.18 |15.800 3.04 | 21.80 1.43 3.900 1.67 | 9.900 4.60 |15.900 2.81 | 21.90 1.43 4.000 1.67 |10.000 4.60 |16.000 2.81 | 22.00 1.43 4.100 1.67 |10.100 5.07 |16.100 2.69 | 22.10 1.43 4.200 1.67 |10.200 5.07 |16.200 2.69 | 22.20 1.43 4.300 1.79 |10.300 5.61 |16.300 2.69 | 22.30 1.43 4.400 1.79 |10.400 5.61 |16.400 2.69 | 22.40 1.43 4.500 1.79 |10.500 6.27 |16.500 2.63 | 22.50 1.37
4.600 1.79 |10.600 6.27 |16.600 2.63 | 22.60 1.37 4.700 1.79 |10.700 7.16 |16.700 2.51 | 22.70 1.37 4.800 1.79 |10.800 7.16 |16.800 2.51 | 22.80 1.37 4.900 1.91 |10.900 8.12 |16.900 2.51 | 22.90 1.37 5.000 1.91 |11.000 8.12 |17.000 2.51 | 23.00 1.37 5.100 1.91 |11.100 9.73 |17.100 2.39 | 23.10 1.37 5.200 1.91 |11.200 9.73 |17.200 2.39 | 23.20 1.37 5.300 2.03 |11.300 12.06 |17.300 2.33 | 23.30 1.37 5.400 2.03 |11.400 12.06 |17.400 2.33 | 23.40 1.37 5.500 2.03 |11.500 21.07 |17.500 2.33 | 23.50 1.37 5.600 2.03 |11.600 21.08 |17.600 2.33 | 23.60 1.37 5.700 2.03 |11.700 74.03 |17.700 2.21 | 23.70 1.31 5.800 2.03 |11.800 74.03 |17.800 2.21 | 23.80 1.31 5.900 2.15 |11.900 138.62 |17.900 2.21 | 23.90 1.31 6.000 2.15 |12.000 138.61 |18.000 2.21 | 24.00 1.31 Unit Hyd Qpeak (cms)= 0.444 PEAK FLOW (cms)= 0.575 (i) TIME TO PEAK (hrs)= 12.300 RUNOFF VOLUME (mm)= 72.771 TOTAL RAINFALL (mm)= 119.400 RUNOFF COEFFICIENT = 0.609 (i) PEAK FLOW DOES NOT INCLUDE BASEFLOW IF ANY. ---------------------------------------------------------------------------------------------------| CALIB || NASHYD (0301) | Area (ha)= 59.38 Curve Number (CN)= 83.0|ID= 1 DT= 5.0 min | Ia (mm)= 5.40 # of Linear Res.(N)= 3.00-------------------- U.H. Tp(hrs)= 0.56 NOTE: RAINFALL WAS TRANSFORMED TO 5.0 MIN. TIME STEP.
---- TRANSFORMED HYETOGRAPH ---- TIME RAIN | TIME RAIN |' TIME RAIN | TIME RAIN hrs mm/hr | hrs mm/hr |' hrs mm/hr | hrs mm/hr 0.083 1.19 | 6.083 2.15 |12.083 21.27 | 18.08 2.09 0.167 1.19 | 6.167 2.15 |12.167 21.25 | 18.17 2.09 0.250 1.23 | 6.250 2.22 |12.250 18.03 | 18.25 2.09 0.333 1.25 | 6.333 2.27 |12.333 15.88 | 18.33 2.09 0.417 1.25 | 6.417 2.27 |12.417 14.88 | 18.42 2.07 0.500 1.25 | 6.500 2.27 |12.500 10.87 | 18.50 1.97 0.583 1.25 | 6.583 2.27 |12.583 10.87 | 18.58 1.97 0.667 1.25 | 6.667 2.27 |12.667 9.53 | 18.67 1.97 0.750 1.25 | 6.750 2.27 |12.750 9.19 | 18.75 1.97 0.833 1.28 | 6.833 2.32 |12.833 8.67 | 18.83 1.92 0.917 1.31 | 6.917 2.39 |12.917 7.88 | 18.92 1.85 1.000 1.31 | 7.000 2.39 |13.000 7.88 | 19.00 1.85 1.083 1.31 | 7.083 2.39 |13.083 6.93 | 19.08 1.85 1.167 1.31 | 7.167 2.39 |13.167 6.93 | 19.17 1.85 1.250 1.35 | 7.250 2.46 |13.250 6.57 | 19.25 1.81 1.333 1.37 | 7.333 2.51 |13.333 6.33 | 19.33 1.79 1.417 1.37 | 7.417 2.51 |13.417 6.19 | 19.42 1.77 1.500 1.37 | 7.500 2.51 |13.500 5.61 | 19.50 1.67 1.583 1.37 | 7.583 2.51 |13.583 5.61 | 19.58 1.67 1.667 1.37 | 7.667 2.51 |13.667 5.23 | 19.67 1.62 1.750 1.37 | 7.750 2.51 |13.750 5.13 | 19.75 1.61 1.833 1.40 | 7.833 2.56 |13.833 4.94 | 19.83 1.61 1.917 1.43 | 7.917 2.63 |13.917 4.66 | 19.92 1.61 2.000 1.43 | 8.000 2.63 |14.000 4.66 | 20.00 1.61 2.083 1.43 | 8.083 2.75 |14.083 4.36 | 20.08 1.55 2.167 1.43 | 8.167 2.75 |14.167 4.36 | 20.17 1.55 2.250 1.47 | 8.250 2.89 |14.250 4.21 | 20.25 1.55 2.333 1.49 | 8.333 2.99 |14.333 4.12 | 20.33 1.55 2.417 1.49 | 8.417 3.03 |14.417 4.10 | 20.42 1.54 2.500 1.49 | 8.500 3.22 |14.500 4.00 | 20.50 1.49 2.583 1.49 | 8.583 3.22 |14.583 4.00 | 20.58 1.49 2.667 1.49 | 8.667 3.41 |14.667 3.90 | 20.67 1.49 2.750 1.49 | 8.750 3.46 |14.750 3.88 | 20.75 1.49 2.833 1.52 | 8.833 3.56 |14.833 3.79 | 20.83 1.49 2.917 1.55 | 8.917 3.70 |14.917 3.64 | 20.92 1.49 3.000 1.55 | 9.000 3.70 |15.000 3.64 | 21.00 1.49 3.083 1.55 | 9.083 3.82 |15.083 3.52 | 21.08 1.49 3.167 1.55 | 9.167 3.82 |15.167 3.52 | 21.17 1.49 3.250 1.59 | 9.250 3.82 |15.250 3.38 | 21.25 1.49 3.333 1.61 | 9.333 3.82 |15.333 3.28 | 21.33 1.49 3.417 1.61 | 9.417 3.83 |15.417 3.26 | 21.42 1.49 3.500 1.61 | 9.500 3.88 |15.500 3.16 | 21.50 1.49 3.583 1.61 | 9.583 3.88 |15.583 3.16 | 21.58 1.49 3.667 1.61 | 9.667 4.12 |15.667 3.07 | 21.67 1.44 3.750 1.61 | 9.750 4.18 |15.750 3.04 | 21.75 1.43 3.833 1.64 | 9.833 4.35 |15.833 2.95 | 21.83 1.43 3.917 1.67 | 9.917 4.60 |15.917 2.81 | 21.92 1.43 4.000 1.67 |10.000 4.60 |16.000 2.81 | 22.00 1.43 4.083 1.67 |10.083 5.07 |16.083 2.69 | 22.08 1.43 4.167 1.67 |10.167 5.07 |16.167 2.69 | 22.17 1.43 4.250 1.74 |10.250 5.40 |16.250 2.69 | 22.25 1.43 4.333 1.79 |10.333 5.61 |16.333 2.69 | 22.33 1.43 4.417 1.79 |10.417 5.74 |16.417 2.67 | 22.42 1.42 4.500 1.79 |10.500 6.27 |16.500 2.63 | 22.50 1.37 4.583 1.79 |10.583 6.27 |16.583 2.63 | 22.58 1.37 4.667 1.79 |10.667 6.98 |16.667 2.53 | 22.67 1.37 4.750 1.79 |10.750 7.16 |16.750 2.51 | 22.75 1.37 4.833 1.84 |10.833 7.55 |16.833 2.51 | 22.83 1.37 4.917 1.91 |10.917 8.12 |16.917 2.51 | 22.92 1.37 5.000 1.91 |11.000 8.12 |17.000 2.51 | 23.00 1.37 5.083 1.91 |11.083 9.73 |17.083 2.39 | 23.08 1.37 5.167 1.91 |11.167 9.73 |17.167 2.39 | 23.17 1.37 5.250 1.98 |11.250 11.13 |17.250 2.35 | 23.25 1.37 5.333 2.03 |11.333 12.06 |17.333 2.33 | 23.33 1.37 5.417 2.03 |11.417 13.86 |17.417 2.33 | 23.42 1.37 5.500 2.03 |11.500 21.07 |17.500 2.33 | 23.50 1.37 5.583 2.03 |11.583 21.07 |17.583 2.33 | 23.58 1.37 5.667 2.03 |11.667 63.43 |17.667 2.23 | 23.67 1.33 5.750 2.03 |11.750 74.03 |17.750 2.21 | 23.75 1.31 5.833 2.08 |11.833 99.86 |17.833 2.21 | 23.83 1.31 5.917 2.15 |11.917 138.62 |17.917 2.21 | 23.92 1.31 6.000 2.15 |12.000 138.62 |18.000 2.21 | 24.00 1.31 Unit Hyd Qpeak (cms)= 4.050 PEAK FLOW (cms)= 5.950 (i) TIME TO PEAK (hrs)= 12.417 RUNOFF VOLUME (mm)= 78.276 TOTAL RAINFALL (mm)= 119.400 RUNOFF COEFFICIENT = 0.656 (i) PEAK FLOW DOES NOT INCLUDE BASEFLOW IF ANY. ---------------------------------------------------------------------------------------------------| DUHYD (0041) || Inlet Cap.=3.520 || #of Inlets= 1 || Total(cms)= 3.5 | AREA QPEAK TPEAK R.V.-------------------- (ha) (cms) (hrs) (mm) TOTAL HYD.(ID= 1): 59.38 5.95 12.42 78.28 ===================================================== MAJOR SYS.(ID= 2): 7.20 2.43 12.42 78.28 MINOR SYS.(ID= 3): 52.18 3.52 12.08 78.28 NOTE: PEAK FLOWS DO NOT INCLUDE BASEFLOWS IF ANY. ------------------------------------------------------------------------------- --------------------| ADD HYD (0013) || 1 + 2 = 3 | AREA QPEAK TPEAK R.V.-------------------- (ha) (cms) (hrs) (mm) ID1= 1 (0101): 5.46 0.575 12.30 72.77

+ ID2= 2 (0041): 7.20 2.430 12.42 78.28 ================================================== ID = 3 (0013): 12.66 2.992 12.42 75.90 NOTE: PEAK FLOWS DO NOT INCLUDE BASEFLOWS IF ANY. ------------------------------------------------------------------------------- --------------------| ADD HYD (0014) || 1 + 2 = 3 | AREA QPEAK TPEAK R.V.-------------------- (ha) (cms) (hrs) (mm) ID1= 1 (0013): 12.66 2.992 12.42 75.90 + ID2= 2 (0041): 52.18 3.520 12.08 78.28 ================================================== ID = 3 (0014): 64.84 6.512 12.42 77.81 NOTE: PEAK FLOWS DO NOT INCLUDE BASEFLOWS IF ANY. ---------------------------------------------------------------------------------------------------| CALIB || NASHYD (0102) | Area (ha)= 1.37 Curve Number (CN)= 82.0|ID= 1 DT= 4.0 min | Ia (mm)= 5.50 # of Linear Res.(N)= 3.00-------------------- U.H. Tp(hrs)= 0.29 NOTE: RAINFALL WAS TRANSFORMED TO 4.0 MIN. TIME STEP.
---- TRANSFORMED HYETOGRAPH ---- TIME RAIN | TIME RAIN |' TIME RAIN | TIME RAIN hrs mm/hr | hrs mm/hr |' hrs mm/hr | hrs mm/hr 0.067 1.19 | 6.067 2.15 |12.067 21.27 | 18.07 2.09 0.133 1.19 | 6.133 2.15 |12.133 21.25 | 18.13 2.09 0.200 1.19 | 6.200 2.15 |12.200 21.25 | 18.20 2.09 0.267 1.25 | 6.267 2.27 |12.267 15.88 | 18.27 2.09 0.333 1.25 | 6.333 2.27 |12.333 15.88 | 18.33 2.09 0.400 1.25 | 6.400 2.27 |12.400 15.88 | 18.40 2.09 0.467 1.25 | 6.467 2.27 |12.467 10.87 | 18.47 1.97 0.533 1.25 | 6.533 2.27 |12.533 10.87 | 18.53 1.97 0.600 1.25 | 6.600 2.27 |12.600 10.87 | 18.60 1.97 0.667 1.25 | 6.667 2.27 |12.667 9.19 | 18.67 1.97 0.733 1.25 | 6.733 2.27 |12.733 9.19 | 18.73 1.97 0.800 1.25 | 6.800 2.27 |12.800 9.19 | 18.80 1.97 0.867 1.31 | 6.867 2.39 |12.867 7.88 | 18.87 1.85 0.933 1.31 | 6.933 2.39 |12.933 7.88 | 18.93 1.85 1.000 1.31 | 7.000 2.39 |13.000 7.88 | 19.00 1.85 1.067 1.31 | 7.067 2.39 |13.067 6.93 | 19.07 1.85 1.133 1.31 | 7.133 2.39 |13.133 6.93 | 19.13 1.85 1.200 1.31 | 7.200 2.39 |13.200 6.93 | 19.20 1.85 1.267 1.37 | 7.267 2.51 |13.267 6.33 | 19.27 1.79 1.333 1.37 | 7.333 2.51 |13.333 6.33 | 19.33 1.79 1.400 1.37 | 7.400 2.51 |13.400 6.33 | 19.40 1.79 1.467 1.37 | 7.467 2.51 |13.467 5.61 | 19.47 1.67 1.533 1.37 | 7.533 2.51 |13.533 5.61 | 19.53 1.67 1.600 1.37 | 7.600 2.51 |13.600 5.61 | 19.60 1.67 1.667 1.37 | 7.667 2.51 |13.667 5.13 | 19.67 1.61 1.733 1.37 | 7.733 2.51 |13.733 5.13 | 19.73 1.61 1.800 1.37 | 7.800 2.51 |13.800 5.13 | 19.80 1.61 1.867 1.43 | 7.867 2.63 |13.867 4.66 | 19.87 1.61 1.933 1.43 | 7.933 2.63 |13.933 4.66 | 19.93 1.61 2.000 1.43 | 8.000 2.63 |14.000 4.66 | 20.00 1.61 2.067 1.43 | 8.067 2.75 |14.067 4.36 | 20.07 1.55 2.133 1.43 | 8.133 2.75 |14.133 4.36 | 20.13 1.55 2.200 1.43 | 8.200 2.75 |14.200 4.36 | 20.20 1.55 2.267 1.49 | 8.267 2.98 |14.267 4.12 | 20.27 1.55 2.333 1.49 | 8.333 2.99 |14.333 4.12 | 20.33 1.55 2.400 1.49 | 8.400 2.99 |14.400 4.12 | 20.40 1.55 2.467 1.49 | 8.467 3.22 |14.467 4.00 | 20.47 1.49 2.533 1.49 | 8.533 3.22 |14.533 4.00 | 20.53 1.49 2.600 1.49 | 8.600 3.22 |14.600 4.00 | 20.60 1.49 2.667 1.49 | 8.667 3.46 |14.667 3.88 | 20.67 1.49 2.733 1.49 | 8.733 3.46 |14.733 3.88 | 20.73 1.49 2.800 1.49 | 8.800 3.46 |14.800 3.88 | 20.80 1.49 2.867 1.55 | 8.867 3.70 |14.867 3.64 | 20.87 1.49 2.933 1.55 | 8.933 3.70 |14.933 3.64 | 20.93 1.49 3.000 1.55 | 9.000 3.70 |15.000 3.64 | 21.00 1.49 3.067 1.55 | 9.067 3.82 |15.067 3.52 | 21.07 1.49 3.133 1.55 | 9.133 3.82 |15.133 3.52 | 21.13 1.49 3.200 1.55 | 9.200 3.82 |15.200 3.52 | 21.20 1.49 3.267 1.61 | 9.267 3.82 |15.267 3.28 | 21.27 1.49 3.333 1.61 | 9.333 3.82 |15.333 3.28 | 21.33 1.49 3.400 1.61 | 9.400 3.82 |15.400 3.28 | 21.40 1.49 3.467 1.61 | 9.467 3.88 |15.467 3.16 | 21.47 1.49 3.533 1.61 | 9.533 3.88 |15.533 3.16 | 21.53 1.49 3.600 1.61 | 9.600 3.88 |15.600 3.16 | 21.60 1.49 3.667 1.61 | 9.667 4.18 |15.667 3.04 | 21.67 1.43 3.733 1.61 | 9.733 4.18 |15.733 3.04 | 21.73 1.43 3.800 1.61 | 9.800 4.18 |15.800 3.04 | 21.80 1.43 3.867 1.67 | 9.867 4.60 |15.867 2.81 | 21.87 1.43 3.933 1.67 | 9.933 4.60 |15.933 2.81 | 21.93 1.43 4.000 1.67 |10.000 4.60 |16.000 2.81 | 22.00 1.43 4.067 1.67 |10.067 5.07 |16.067 2.69 | 22.07 1.43 4.133 1.67 |10.133 5.07 |16.133 2.69 | 22.13 1.43 4.200 1.67 |10.200 5.07 |16.200 2.69 | 22.20 1.43 4.267 1.79 |10.267 5.61 |16.267 2.69 | 22.27 1.43 4.333 1.79 |10.333 5.61 |16.333 2.69 | 22.33 1.43 4.400 1.79 |10.400 5.61 |16.400 2.69 | 22.40 1.43 4.467 1.79 |10.467 6.27 |16.467 2.63 | 22.47 1.37 4.533 1.79 |10.533 6.27 |16.533 2.63 | 22.53 1.37 4.600 1.79 |10.600 6.27 |16.600 2.63 | 22.60 1.37 4.667 1.79 |10.667 7.16 |16.667 2.51 | 22.67 1.37 4.733 1.79 |10.733 7.16 |16.733 2.51 | 22.73 1.37 4.800 1.79 |10.800 7.16 |16.800 2.51 | 22.80 1.37 4.867 1.91 |10.867 8.12 |16.867 2.51 | 22.87 1.37 4.933 1.91 |10.933 8.12 |16.933 2.51 | 22.93 1.37 5.000 1.91 |11.000 8.12 |17.000 2.51 | 23.00 1.37 5.067 1.91 |11.067 9.73 |17.067 2.39 | 23.07 1.37 5.133 1.91 |11.133 9.73 |17.133 2.39 | 23.13 1.37 5.200 1.91 |11.200 9.73 |17.200 2.39 | 23.20 1.37 5.267 2.03 |11.267 12.06 |17.267 2.33 | 23.27 1.37 5.333 2.03 |11.333 12.06 |17.333 2.33 | 23.33 1.37 5.400 2.03 |11.400 12.06 |17.400 2.33 | 23.40 1.37 5.467 2.03 |11.467 21.07 |17.467 2.33 | 23.47 1.37 5.533 2.03 |11.533 21.07 |17.533 2.33 | 23.53 1.37 5.600 2.03 |11.600 21.07 |17.600 2.33 | 23.60 1.37 5.667 2.03 |11.667 74.02 |17.667 2.21 | 23.67 1.31 5.733 2.03 |11.733 74.03 |17.733 2.21 | 23.73 1.31 5.800 2.03 |11.800 74.03 |17.800 2.21 | 23.80 1.31 5.867 2.15 |11.867 138.62 |17.867 2.21 | 23.87 1.31 5.933 2.15 |11.933 138.62 |17.933 2.21 | 23.93 1.31 6.000 2.15 |12.000 138.62 |18.000 2.21 | 24.00 1.31 Unit Hyd Qpeak (cms)= 0.180 PEAK FLOW (cms)= 0.212 (i) TIME TO PEAK (hrs)= 12.133 RUNOFF VOLUME (mm)= 76.453 TOTAL RAINFALL (mm)= 119.400 RUNOFF COEFFICIENT = 0.640 (i) PEAK FLOW DOES NOT INCLUDE BASEFLOW IF ANY. ---------------------------------------------------------------------------------------------------| CALIB || NASHYD (0103) | Area (ha)= 1.76 Curve Number (CN)= 81.0|ID= 1 DT= 4.0 min | Ia (mm)= 5.80 # of Linear Res.(N)= 3.00-------------------- U.H. Tp(hrs)= 0.30 Unit Hyd Qpeak (cms)= 0.224 PEAK FLOW (cms)= 0.258 (i)
TIME TO PEAK (hrs)= 12.133 RUNOFF VOLUME (mm)= 74.505 TOTAL RAINFALL (mm)= 119.400 RUNOFF COEFFICIENT = 0.624 (i) PEAK FLOW DOES NOT INCLUDE BASEFLOW IF ANY. ------------------------------------------------------------------------------- --------------------| ADD HYD (0010) || 1 + 2 = 3 | AREA QPEAK TPEAK R.V.-------------------- (ha) (cms) (hrs) (mm) ID1= 1 (0102): 1.37 0.212 12.13 76.45 + ID2= 2 (0103): 1.76 0.258 12.13 74.51 ================================================== ID = 3 (0010): 3.13 0.470 12.13 75.36 NOTE: PEAK FLOWS DO NOT INCLUDE BASEFLOWS IF ANY. ---------------------------------------------------------------------------------------------------| CALIB || NASHYD (0104) | Area (ha)= 1.18 Curve Number (CN)= 82.0|ID= 1 DT= 3.0 min | Ia (mm)= 5.50 # of Linear Res.(N)= 3.00-------------------- U.H. Tp(hrs)= 0.22 NOTE: RAINFALL WAS TRANSFORMED TO 3.0 MIN. TIME STEP.
---- TRANSFORMED HYETOGRAPH ---- TIME RAIN | TIME RAIN |' TIME RAIN | TIME RAIN hrs mm/hr | hrs mm/hr |' hrs mm/hr | hrs mm/hr 0.050 1.19 | 6.050 2.15 |12.050 21.25 | 18.05 2.09 0.100 1.19 | 6.100 2.15 |12.100 21.25 | 18.10 2.09 0.150 1.19 | 6.150 2.15 |12.150 21.25 | 18.15 2.09 0.200 1.19 | 6.200 2.15 |12.200 21.25 | 18.20 2.09 0.250 1.25 | 6.250 2.27 |12.250 15.88 | 18.25 2.09 0.300 1.25 | 6.300 2.27 |12.300 15.88 | 18.30 2.09 0.350 1.25 | 6.350 2.27 |12.350 15.88 | 18.35 2.09 0.400 1.25 | 6.400 2.27 |12.400 15.88 | 18.40 2.09 0.450 1.25 | 6.450 2.27 |12.450 10.87 | 18.45 1.97 0.500 1.25 | 6.500 2.27 |12.500 10.87 | 18.50 1.97 0.550 1.25 | 6.550 2.27 |12.550 10.87 | 18.55 1.97 0.600 1.25 | 6.600 2.27 |12.600 10.86 | 18.60 1.97 0.650 1.25 | 6.650 2.27 |12.650 9.19 | 18.65 1.97 0.700 1.25 | 6.700 2.27 |12.700 9.19 | 18.70 1.97 0.750 1.25 | 6.750 2.27 |12.750 9.19 | 18.75 1.97 0.800 1.25 | 6.800 2.27 |12.800 9.19 | 18.80 1.97 0.850 1.31 | 6.850 2.39 |12.850 7.88 | 18.85 1.85 0.900 1.31 | 6.900 2.39 |12.900 7.88 | 18.90 1.85 0.950 1.31 | 6.950 2.39 |12.950 7.88 | 18.95 1.85 1.000 1.31 | 7.000 2.39 |13.000 7.88 | 19.00 1.85 1.050 1.31 | 7.050 2.39 |13.050 6.93 | 19.05 1.85 1.100 1.31 | 7.100 2.39 |13.100 6.93 | 19.10 1.85 1.150 1.31 | 7.150 2.39 |13.150 6.93 | 19.15 1.85 1.200 1.31 | 7.200 2.39 |13.200 6.92 | 19.20 1.85 1.250 1.37 | 7.250 2.51 |13.250 6.33 | 19.25 1.79 1.300 1.37 | 7.300 2.51 |13.300 6.33 | 19.30 1.79 1.350 1.37 | 7.350 2.51 |13.350 6.33 | 19.35 1.79 1.400 1.37 | 7.400 2.51 |13.400 6.33 | 19.40 1.79 1.450 1.37 | 7.450 2.51 |13.450 5.61 | 19.45 1.67 1.500 1.37 | 7.500 2.51 |13.500 5.61 | 19.50 1.67 1.550 1.37 | 7.550 2.51 |13.550 5.61 | 19.55 1.67 1.600 1.37 | 7.600 2.51 |13.600 5.61 | 19.60 1.67 1.650 1.37 | 7.650 2.51 |13.650 5.13 | 19.65 1.61 1.700 1.37 | 7.700 2.51 |13.700 5.13 | 19.70 1.61 1.750 1.37 | 7.750 2.51 |13.750 5.13 | 19.75 1.61 1.800 1.37 | 7.800 2.51 |13.800 5.13 | 19.80 1.61 1.850 1.43 | 7.850 2.63 |13.850 4.66 | 19.85 1.61 1.900 1.43 | 7.900 2.63 |13.900 4.66 | 19.90 1.61 1.950 1.43 | 7.950 2.63 |13.950 4.66 | 19.95 1.61 2.000 1.43 | 8.000 2.63 |14.000 4.66 | 20.00 1.61 2.050 1.43 | 8.050 2.75 |14.050 4.36 | 20.05 1.55 2.100 1.43 | 8.100 2.75 |14.100 4.36 | 20.10 1.55 2.150 1.43 | 8.150 2.75 |14.150 4.36 | 20.15 1.55 2.200 1.43 | 8.200 2.75 |14.200 4.36 | 20.20 1.55 2.250 1.49 | 8.250 2.99 |14.250 4.12 | 20.25 1.55 2.300 1.49 | 8.300 2.99 |14.300 4.12 | 20.30 1.55 2.350 1.49 | 8.350 2.99 |14.350 4.12 | 20.35 1.55 2.400 1.49 | 8.400 2.99 |14.400 4.12 | 20.40 1.55 2.450 1.49 | 8.450 3.22 |14.450 4.00 | 20.45 1.49 2.500 1.49 | 8.500 3.22 |14.500 4.00 | 20.50 1.49 2.550 1.49 | 8.550 3.22 |14.550 4.00 | 20.55 1.49 2.600 1.49 | 8.600 3.22 |14.600 4.00 | 20.60 1.49 2.650 1.49 | 8.650 3.46 |14.650 3.88 | 20.65 1.49 2.700 1.49 | 8.700 3.46 |14.700 3.88 | 20.70 1.49 2.750 1.49 | 8.750 3.46 |14.750 3.88 | 20.75 1.49 2.800 1.49 | 8.800 3.46 |14.800 3.88 | 20.80 1.49 2.850 1.55 | 8.850 3.70 |14.850 3.64 | 20.85 1.49 2.900 1.55 | 8.900 3.70 |14.900 3.64 | 20.90 1.49 2.950 1.55 | 8.950 3.70 |14.950 3.64 | 20.95 1.49 3.000 1.55 | 9.000 3.70 |15.000 3.64 | 21.00 1.49 3.050 1.55 | 9.050 3.82 |15.050 3.52 | 21.05 1.49 3.100 1.55 | 9.100 3.82 |15.100 3.52 | 21.10 1.49 3.150 1.55 | 9.150 3.82 |15.150 3.52 | 21.15 1.49 3.200 1.55 | 9.200 3.82 |15.200 3.52 | 21.20 1.49 3.250 1.61 | 9.250 3.82 |15.250 3.28 | 21.25 1.49 3.300 1.61 | 9.300 3.82 |15.300 3.28 | 21.30 1.49 3.350 1.61 | 9.350 3.82 |15.350 3.28 | 21.35 1.49 3.400 1.61 | 9.400 3.82 |15.400 3.28 | 21.40 1.49 3.450 1.61 | 9.450 3.88 |15.450 3.16 | 21.45 1.49 3.500 1.61 | 9.500 3.88 |15.500 3.16 | 21.50 1.49 3.550 1.61 | 9.550 3.88 |15.550 3.16 | 21.55 1.49 3.600 1.61 | 9.600 3.88 |15.600 3.16 | 21.60 1.49 3.650 1.61 | 9.650 4.18 |15.650 3.04 | 21.65 1.43 3.700 1.61 | 9.700 4.18 |15.700 3.04 | 21.70 1.43 3.750 1.61 | 9.750 4.18 |15.750 3.04 | 21.75 1.43 3.800 1.61 | 9.800 4.18 |15.800 3.04 | 21.80 1.43 3.850 1.67 | 9.850 4.60 |15.850 2.81 | 21.85 1.43 3.900 1.67 | 9.900 4.60 |15.900 2.81 | 21.90 1.43 3.950 1.67 | 9.950 4.60 |15.950 2.81 | 21.95 1.43 4.000 1.67 |10.000 4.60 |16.000 2.81 | 22.00 1.43 4.050 1.67 |10.050 5.07 |16.050 2.69 | 22.05 1.43 4.100 1.67 |10.100 5.07 |16.100 2.69 | 22.10 1.43 4.150 1.67 |10.150 5.07 |16.150 2.69 | 22.15 1.43 4.200 1.67 |10.200 5.07 |16.200 2.69 | 22.20 1.43 4.250 1.79 |10.250 5.61 |16.250 2.69 | 22.25 1.43 4.300 1.79 |10.300 5.61 |16.300 2.69 | 22.30 1.43 4.350 1.79 |10.350 5.61 |16.350 2.69 | 22.35 1.43 4.400 1.79 |10.400 5.61 |16.400 2.69 | 22.40 1.43 4.450 1.79 |10.450 6.27 |16.450 2.63 | 22.45 1.37 4.500 1.79 |10.500 6.27 |16.500 2.63 | 22.50 1.37 4.550 1.79 |10.550 6.27 |16.550 2.63 | 22.55 1.37 4.600 1.79 |10.600 6.27 |16.600 2.63 | 22.60 1.37 4.650 1.79 |10.650 7.16 |16.650 2.51 | 22.65 1.37 4.700 1.79 |10.700 7.16 |16.700 2.51 | 22.70 1.37 4.750 1.79 |10.750 7.16 |16.750 2.51 | 22.75 1.37 4.800 1.79 |10.800 7.16 |16.800 2.51 | 22.80 1.37 4.850 1.91 |10.850 8.12 |16.850 2.51 | 22.85 1.37 4.900 1.91 |10.900 8.12 |16.900 2.51 | 22.90 1.37 4.950 1.91 |10.950 8.12 |16.950 2.51 | 22.95 1.37 5.000 1.91 |11.000 8.12 |17.000 2.51 | 23.00 1.37 5.050 1.91 |11.050 9.73 |17.050 2.39 | 23.05 1.37 5.100 1.91 |11.100 9.73 |17.100 2.39 | 23.10 1.37 5.150 1.91 |11.150 9.73 |17.150 2.39 | 23.15 1.37 5.200 1.91 |11.200 9.73 |17.200 2.39 | 23.20 1.37 5.250 2.03 |11.250 12.06 |17.250 2.33 | 23.25 1.37 5.300 2.03 |11.300 12.06 |17.300 2.33 | 23.30 1.37 5.350 2.03 |11.350 12.06 |17.350 2.33 | 23.35 1.37 5.400 2.03 |11.400 12.06 |17.400 2.33 | 23.40 1.37 5.450 2.03 |11.450 21.07 |17.450 2.33 | 23.45 1.37 5.500 2.03 |11.500 21.07 |17.500 2.33 | 23.50 1.37

5.550 2.03 |11.550 21.07 |17.550 2.33 | 23.55 1.37 5.600 2.03 |11.600 21.10 |17.600 2.33 | 23.60 1.37 5.650 2.03 |11.650 74.03 |17.650 2.21 | 23.65 1.31 5.700 2.03 |11.700 74.03 |17.700 2.21 | 23.70 1.31 5.750 2.03 |11.750 74.03 |17.750 2.21 | 23.75 1.31 5.800 2.03 |11.800 74.06 |17.800 2.21 | 23.80 1.31 5.850 2.15 |11.850 138.62 |17.850 2.21 | 23.85 1.31 5.900 2.15 |11.900 138.62 |17.900 2.21 | 23.90 1.31 5.950 2.15 |11.950 138.62 |17.950 2.21 | 23.95 1.31 6.000 2.15 |12.000 138.56 |18.000 2.21 | 24.00 1.31 Unit Hyd Qpeak (cms)= 0.205 PEAK FLOW (cms)= 0.217 (i) TIME TO PEAK (hrs)= 12.100 RUNOFF VOLUME (mm)= 76.453 TOTAL RAINFALL (mm)= 119.400 RUNOFF COEFFICIENT = 0.640 (i) PEAK FLOW DOES NOT INCLUDE BASEFLOW IF ANY. ---------------------------------------------------------------------------------------------------| CALIB || NASHYD (0105) | Area (ha)= 0.55 Curve Number (CN)= 80.0|ID= 1 DT= 3.0 min | Ia (mm)= 6.00 # of Linear Res.(N)= 3.00-------------------- U.H. Tp(hrs)= 0.21 Unit Hyd Qpeak (cms)= 0.100 PEAK FLOW (cms)= 0.099 (i) TIME TO PEAK (hrs)= 12.100 RUNOFF VOLUME (mm)= 72.677 TOTAL RAINFALL (mm)= 119.400 RUNOFF COEFFICIENT = 0.609 (i) PEAK FLOW DOES NOT INCLUDE BASEFLOW IF ANY. ------------------------------------------------------------------------------- --------------------| ADD HYD (0011) || 1 + 2 = 3 | AREA QPEAK TPEAK R.V.-------------------- (ha) (cms) (hrs) (mm) ID1= 1 (0104): 1.18 0.217 12.10 76.45 + ID2= 2 (0105): 0.55 0.099 12.10 72.68 ================================================== ID = 3 (0011): 1.73 0.315 12.10 75.25 NOTE: PEAK FLOWS DO NOT INCLUDE BASEFLOWS IF ANY. ---------------------------------------------------------------------------------------------------| CALIB || NASHYD (0302) | Area (ha)= 112.64 Curve Number (CN)= 83.0|ID= 1 DT= 5.0 min | Ia (mm)= 5.40 # of Linear Res.(N)= 3.00-------------------- U.H. Tp(hrs)= 1.13 NOTE: RAINFALL WAS TRANSFORMED TO 5.0 MIN. TIME STEP.
---- TRANSFORMED HYETOGRAPH ---- TIME RAIN | TIME RAIN |' TIME RAIN | TIME RAIN hrs mm/hr | hrs mm/hr |' hrs mm/hr | hrs mm/hr 0.083 1.19 | 6.083 2.15 |12.083 21.27 | 18.08 2.09 0.167 1.19 | 6.167 2.15 |12.167 21.25 | 18.17 2.09 0.250 1.23 | 6.250 2.22 |12.250 18.03 | 18.25 2.09 0.333 1.25 | 6.333 2.27 |12.333 15.88 | 18.33 2.09 0.417 1.25 | 6.417 2.27 |12.417 14.88 | 18.42 2.07 0.500 1.25 | 6.500 2.27 |12.500 10.87 | 18.50 1.97 0.583 1.25 | 6.583 2.27 |12.583 10.87 | 18.58 1.97 0.667 1.25 | 6.667 2.27 |12.667 9.53 | 18.67 1.97 0.750 1.25 | 6.750 2.27 |12.750 9.19 | 18.75 1.97 0.833 1.28 | 6.833 2.32 |12.833 8.67 | 18.83 1.92 0.917 1.31 | 6.917 2.39 |12.917 7.88 | 18.92 1.85 1.000 1.31 | 7.000 2.39 |13.000 7.88 | 19.00 1.85 1.083 1.31 | 7.083 2.39 |13.083 6.93 | 19.08 1.85 1.167 1.31 | 7.167 2.39 |13.167 6.93 | 19.17 1.85 1.250 1.35 | 7.250 2.46 |13.250 6.57 | 19.25 1.81 1.333 1.37 | 7.333 2.51 |13.333 6.33 | 19.33 1.79 1.417 1.37 | 7.417 2.51 |13.417 6.19 | 19.42 1.77 1.500 1.37 | 7.500 2.51 |13.500 5.61 | 19.50 1.67 1.583 1.37 | 7.583 2.51 |13.583 5.61 | 19.58 1.67 1.667 1.37 | 7.667 2.51 |13.667 5.23 | 19.67 1.62 1.750 1.37 | 7.750 2.51 |13.750 5.13 | 19.75 1.61 1.833 1.40 | 7.833 2.56 |13.833 4.94 | 19.83 1.61 1.917 1.43 | 7.917 2.63 |13.917 4.66 | 19.92 1.61 2.000 1.43 | 8.000 2.63 |14.000 4.66 | 20.00 1.61 2.083 1.43 | 8.083 2.75 |14.083 4.36 | 20.08 1.55 2.167 1.43 | 8.167 2.75 |14.167 4.36 | 20.17 1.55 2.250 1.47 | 8.250 2.89 |14.250 4.21 | 20.25 1.55 2.333 1.49 | 8.333 2.99 |14.333 4.12 | 20.33 1.55 2.417 1.49 | 8.417 3.03 |14.417 4.10 | 20.42 1.54 2.500 1.49 | 8.500 3.22 |14.500 4.00 | 20.50 1.49 2.583 1.49 | 8.583 3.22 |14.583 4.00 | 20.58 1.49 2.667 1.49 | 8.667 3.41 |14.667 3.90 | 20.67 1.49 2.750 1.49 | 8.750 3.46 |14.750 3.88 | 20.75 1.49 2.833 1.52 | 8.833 3.56 |14.833 3.79 | 20.83 1.49 2.917 1.55 | 8.917 3.70 |14.917 3.64 | 20.92 1.49 3.000 1.55 | 9.000 3.70 |15.000 3.64 | 21.00 1.49 3.083 1.55 | 9.083 3.82 |15.083 3.52 | 21.08 1.49 3.167 1.55 | 9.167 3.82 |15.167 3.52 | 21.17 1.49 3.250 1.59 | 9.250 3.82 |15.250 3.38 | 21.25 1.49 3.333 1.61 | 9.333 3.82 |15.333 3.28 | 21.33 1.49 3.417 1.61 | 9.417 3.83 |15.417 3.26 | 21.42 1.49 3.500 1.61 | 9.500 3.88 |15.500 3.16 | 21.50 1.49 3.583 1.61 | 9.583 3.88 |15.583 3.16 | 21.58 1.49 3.667 1.61 | 9.667 4.12 |15.667 3.07 | 21.67 1.44 3.750 1.61 | 9.750 4.18 |15.750 3.04 | 21.75 1.43 3.833 1.64 | 9.833 4.35 |15.833 2.95 | 21.83 1.43 3.917 1.67 | 9.917 4.60 |15.917 2.81 | 21.92 1.43 4.000 1.67 |10.000 4.60 |16.000 2.81 | 22.00 1.43 4.083 1.67 |10.083 5.07 |16.083 2.69 | 22.08 1.43 4.167 1.67 |10.167 5.07 |16.167 2.69 | 22.17 1.43 4.250 1.74 |10.250 5.40 |16.250 2.69 | 22.25 1.43 4.333 1.79 |10.333 5.61 |16.333 2.69 | 22.33 1.43 4.417 1.79 |10.417 5.74 |16.417 2.67 | 22.42 1.42 4.500 1.79 |10.500 6.27 |16.500 2.63 | 22.50 1.37 4.583 1.79 |10.583 6.27 |16.583 2.63 | 22.58 1.37 4.667 1.79 |10.667 6.98 |16.667 2.53 | 22.67 1.37 4.750 1.79 |10.750 7.16 |16.750 2.51 | 22.75 1.37 4.833 1.84 |10.833 7.55 |16.833 2.51 | 22.83 1.37 4.917 1.91 |10.917 8.12 |16.917 2.51 | 22.92 1.37 5.000 1.91 |11.000 8.12 |17.000 2.51 | 23.00 1.37 5.083 1.91 |11.083 9.73 |17.083 2.39 | 23.08 1.37 5.167 1.91 |11.167 9.73 |17.167 2.39 | 23.17 1.37 5.250 1.98 |11.250 11.13 |17.250 2.35 | 23.25 1.37 5.333 2.03 |11.333 12.06 |17.333 2.33 | 23.33 1.37 5.417 2.03 |11.417 13.86 |17.417 2.33 | 23.42 1.37 5.500 2.03 |11.500 21.07 |17.500 2.33 | 23.50 1.37 5.583 2.03 |11.583 21.07 |17.583 2.33 | 23.58 1.37 5.667 2.03 |11.667 63.43 |17.667 2.23 | 23.67 1.33 5.750 2.03 |11.750 74.03 |17.750 2.21 | 23.75 1.31 5.833 2.08 |11.833 99.86 |17.833 2.21 | 23.83 1.31 5.917 2.15 |11.917 138.62 |17.917 2.21 | 23.92 1.31 6.000 2.15 |12.000 138.62 |18.000 2.21 | 24.00 1.31 Unit Hyd Qpeak (cms)= 3.807 PEAK FLOW (cms)= 6.672 (i) TIME TO PEAK (hrs)= 13.083 RUNOFF VOLUME (mm)= 78.278 TOTAL RAINFALL (mm)= 119.400
RUNOFF COEFFICIENT = 0.656 (i) PEAK FLOW DOES NOT INCLUDE BASEFLOW IF ANY. ---------------------------------------------------------------------------------------------------| DUHYD (0040) || Inlet Cap.=3.950 || #of Inlets= 1 || Total(cms)= 4.0 | AREA QPEAK TPEAK R.V.-------------------- (ha) (cms) (hrs) (mm) TOTAL HYD.(ID= 1): 112.64 6.67 13.08 78.28 ===================================================== MAJOR SYS.(ID= 2): 16.13 2.72 13.08 78.28 MINOR SYS.(ID= 3): 96.51 3.95 12.33 78.28 NOTE: PEAK FLOWS DO NOT INCLUDE BASEFLOWS IF ANY. ------------------------------------------------------------------------------- --------------------| ADD HYD (0012) || 1 + 2 = 3 | AREA QPEAK TPEAK R.V.-------------------- (ha) (cms) (hrs) (mm) ID1= 1 (0010): 3.13 0.470 12.13 75.36 + ID2= 2 (0011): 1.73 0.315 12.10 75.25 ================================================== ID = 3 (0012): 4.86 0.771 12.15 75.32 NOTE: PEAK FLOWS DO NOT INCLUDE BASEFLOWS IF ANY. ------------------------------------------------------------------------------- --------------------| ADD HYD (0012) || 3 + 2 = 1 | AREA QPEAK TPEAK R.V.-------------------- (ha) (cms) (hrs) (mm) ID1= 3 (0012): 4.86 0.771 12.15 75.32 + ID2= 2 (0040): 16.13 2.722 13.08 78.28 ================================================== ID = 1 (0012): 20.99 2.850 13.00 77.59 NOTE: PEAK FLOWS DO NOT INCLUDE BASEFLOWS IF ANY. ---------------------------------------------------------------------------------------------------| CALIB || NASHYD (0106) | Area (ha)= 3.23 Curve Number (CN)= 81.0|ID= 1 DT= 4.0 min | Ia (mm)= 5.80 # of Linear Res.(N)= 3.00-------------------- U.H. Tp(hrs)= 0.35 NOTE: RAINFALL WAS TRANSFORMED TO 4.0 MIN. TIME STEP.
---- TRANSFORMED HYETOGRAPH ---- TIME RAIN | TIME RAIN |' TIME RAIN | TIME RAIN hrs mm/hr | hrs mm/hr |' hrs mm/hr | hrs mm/hr 0.067 1.19 | 6.067 2.15 |12.067 21.27 | 18.07 2.09 0.133 1.19 | 6.133 2.15 |12.133 21.25 | 18.13 2.09 0.200 1.19 | 6.200 2.15 |12.200 21.25 | 18.20 2.09 0.267 1.25 | 6.267 2.27 |12.267 15.88 | 18.27 2.09 0.333 1.25 | 6.333 2.27 |12.333 15.88 | 18.33 2.09 0.400 1.25 | 6.400 2.27 |12.400 15.88 | 18.40 2.09 0.467 1.25 | 6.467 2.27 |12.467 10.87 | 18.47 1.97 0.533 1.25 | 6.533 2.27 |12.533 10.87 | 18.53 1.97 0.600 1.25 | 6.600 2.27 |12.600 10.87 | 18.60 1.97 0.667 1.25 | 6.667 2.27 |12.667 9.19 | 18.67 1.97 0.733 1.25 | 6.733 2.27 |12.733 9.19 | 18.73 1.97 0.800 1.25 | 6.800 2.27 |12.800 9.19 | 18.80 1.97 0.867 1.31 | 6.867 2.39 |12.867 7.88 | 18.87 1.85 0.933 1.31 | 6.933 2.39 |12.933 7.88 | 18.93 1.85 1.000 1.31 | 7.000 2.39 |13.000 7.88 | 19.00 1.85 1.067 1.31 | 7.067 2.39 |13.067 6.93 | 19.07 1.85 1.133 1.31 | 7.133 2.39 |13.133 6.93 | 19.13 1.85 1.200 1.31 | 7.200 2.39 |13.200 6.93 | 19.20 1.85 1.267 1.37 | 7.267 2.51 |13.267 6.33 | 19.27 1.79 1.333 1.37 | 7.333 2.51 |13.333 6.33 | 19.33 1.79 1.400 1.37 | 7.400 2.51 |13.400 6.33 | 19.40 1.79 1.467 1.37 | 7.467 2.51 |13.467 5.61 | 19.47 1.67 1.533 1.37 | 7.533 2.51 |13.533 5.61 | 19.53 1.67 1.600 1.37 | 7.600 2.51 |13.600 5.61 | 19.60 1.67 1.667 1.37 | 7.667 2.51 |13.667 5.13 | 19.67 1.61 1.733 1.37 | 7.733 2.51 |13.733 5.13 | 19.73 1.61 1.800 1.37 | 7.800 2.51 |13.800 5.13 | 19.80 1.61 1.867 1.43 | 7.867 2.63 |13.867 4.66 | 19.87 1.61 1.933 1.43 | 7.933 2.63 |13.933 4.66 | 19.93 1.61 2.000 1.43 | 8.000 2.63 |14.000 4.66 | 20.00 1.61 2.067 1.43 | 8.067 2.75 |14.067 4.36 | 20.07 1.55 2.133 1.43 | 8.133 2.75 |14.133 4.36 | 20.13 1.55 2.200 1.43 | 8.200 2.75 |14.200 4.36 | 20.20 1.55 2.267 1.49 | 8.267 2.98 |14.267 4.12 | 20.27 1.55 2.333 1.49 | 8.333 2.99 |14.333 4.12 | 20.33 1.55 2.400 1.49 | 8.400 2.99 |14.400 4.12 | 20.40 1.55 2.467 1.49 | 8.467 3.22 |14.467 4.00 | 20.47 1.49 2.533 1.49 | 8.533 3.22 |14.533 4.00 | 20.53 1.49 2.600 1.49 | 8.600 3.22 |14.600 4.00 | 20.60 1.49 2.667 1.49 | 8.667 3.46 |14.667 3.88 | 20.67 1.49 2.733 1.49 | 8.733 3.46 |14.733 3.88 | 20.73 1.49 2.800 1.49 | 8.800 3.46 |14.800 3.88 | 20.80 1.49 2.867 1.55 | 8.867 3.70 |14.867 3.64 | 20.87 1.49 2.933 1.55 | 8.933 3.70 |14.933 3.64 | 20.93 1.49 3.000 1.55 | 9.000 3.70 |15.000 3.64 | 21.00 1.49 3.067 1.55 | 9.067 3.82 |15.067 3.52 | 21.07 1.49 3.133 1.55 | 9.133 3.82 |15.133 3.52 | 21.13 1.49 3.200 1.55 | 9.200 3.82 |15.200 3.52 | 21.20 1.49 3.267 1.61 | 9.267 3.82 |15.267 3.28 | 21.27 1.49 3.333 1.61 | 9.333 3.82 |15.333 3.28 | 21.33 1.49 3.400 1.61 | 9.400 3.82 |15.400 3.28 | 21.40 1.49 3.467 1.61 | 9.467 3.88 |15.467 3.16 | 21.47 1.49 3.533 1.61 | 9.533 3.88 |15.533 3.16 | 21.53 1.49 3.600 1.61 | 9.600 3.88 |15.600 3.16 | 21.60 1.49 3.667 1.61 | 9.667 4.18 |15.667 3.04 | 21.67 1.43 3.733 1.61 | 9.733 4.18 |15.733 3.04 | 21.73 1.43 3.800 1.61 | 9.800 4.18 |15.800 3.04 | 21.80 1.43 3.867 1.67 | 9.867 4.60 |15.867 2.81 | 21.87 1.43 3.933 1.67 | 9.933 4.60 |15.933 2.81 | 21.93 1.43 4.000 1.67 |10.000 4.60 |16.000 2.81 | 22.00 1.43 4.067 1.67 |10.067 5.07 |16.067 2.69 | 22.07 1.43 4.133 1.67 |10.133 5.07 |16.133 2.69 | 22.13 1.43 4.200 1.67 |10.200 5.07 |16.200 2.69 | 22.20 1.43 4.267 1.79 |10.267 5.61 |16.267 2.69 | 22.27 1.43 4.333 1.79 |10.333 5.61 |16.333 2.69 | 22.33 1.43 4.400 1.79 |10.400 5.61 |16.400 2.69 | 22.40 1.43 4.467 1.79 |10.467 6.27 |16.467 2.63 | 22.47 1.37 4.533 1.79 |10.533 6.27 |16.533 2.63 | 22.53 1.37 4.600 1.79 |10.600 6.27 |16.600 2.63 | 22.60 1.37 4.667 1.79 |10.667 7.16 |16.667 2.51 | 22.67 1.37 4.733 1.79 |10.733 7.16 |16.733 2.51 | 22.73 1.37 4.800 1.79 |10.800 7.16 |16.800 2.51 | 22.80 1.37 4.867 1.91 |10.867 8.12 |16.867 2.51 | 22.87 1.37 4.933 1.91 |10.933 8.12 |16.933 2.51 | 22.93 1.37 5.000 1.91 |11.000 8.12 |17.000 2.51 | 23.00 1.37 5.067 1.91 |11.067 9.73 |17.067 2.39 | 23.07 1.37 5.133 1.91 |11.133 9.73 |17.133 2.39 | 23.13 1.37 5.200 1.91 |11.200 9.73 |17.200 2.39 | 23.20 1.37 5.267 2.03 |11.267 12.06 |17.267 2.33 | 23.27 1.37 5.333 2.03 |11.333 12.06 |17.333 2.33 | 23.33 1.37 5.400 2.03 |11.400 12.06 |17.400 2.33 | 23.40 1.37 5.467 2.03 |11.467 21.07 |17.467 2.33 | 23.47 1.37 5.533 2.03 |11.533 21.07 |17.533 2.33 | 23.53 1.37 5.600 2.03 |11.600 21.07 |17.600 2.33 | 23.60 1.37 5.667 2.03 |11.667 74.02 |17.667 2.21 | 23.67 1.31 5.733 2.03 |11.733 74.03 |17.733 2.21 | 23.73 1.31

5.800 2.03 |11.800 74.03 |17.800 2.21 | 23.80 1.31 5.867 2.15 |11.867 138.62 |17.867 2.21 | 23.87 1.31 5.933 2.15 |11.933 138.62 |17.933 2.21 | 23.93 1.31 6.000 2.15 |12.000 138.62 |18.000 2.21 | 24.00 1.31 Unit Hyd Qpeak (cms)= 0.352 PEAK FLOW (cms)= 0.429 (i) TIME TO PEAK (hrs)= 12.200 RUNOFF VOLUME (mm)= 74.511 TOTAL RAINFALL (mm)= 119.400 RUNOFF COEFFICIENT = 0.624 (i) PEAK FLOW DOES NOT INCLUDE BASEFLOW IF ANY. ------------------------------------------------------------------------------- --------------------| ADD HYD (0015) || 1 + 2 = 3 | AREA QPEAK TPEAK R.V.-------------------- (ha) (cms) (hrs) (mm) ID1= 1 (0106): 3.23 0.429 12.20 74.51 + ID2= 2 (0040): 96.51 3.950 12.33 78.28 ================================================== ID = 3 (0015): 99.74 4.353 12.33 78.16 NOTE: PEAK FLOWS DO NOT INCLUDE BASEFLOWS IF ANY. ------------------------------------------------------------------------------- --------------------| ADD HYD (0016) || 1 + 2 = 3 | AREA QPEAK TPEAK R.V.-------------------- (ha) (cms) (hrs) (mm) ID1= 1 (0012): 20.99 2.850 13.00 77.59 + ID2= 2 (0014): 64.84 6.512 12.42 77.81 ================================================== ID = 3 (0016): 85.83 8.245 12.60 77.76 NOTE: PEAK FLOWS DO NOT INCLUDE BASEFLOWS IF ANY. ------------------------------------------------------------------------------- --------------------| ADD HYD (0016) || 3 + 2 = 1 | AREA QPEAK TPEAK R.V.-------------------- (ha) (cms) (hrs) (mm) ID1= 3 (0016): 85.83 8.245 12.60 77.76 + ID2= 2 (0015): 99.74 4.353 12.33 78.16 ================================================== ID = 1 (0016): 185.57 12.467 12.55 77.97 NOTE: PEAK FLOWS DO NOT INCLUDE BASEFLOWS IF ANY. ---------------------------------------------------------------------------------------------------| CALIB || NASHYD (0205) | Area (ha)= 0.55 Curve Number (CN)= 84.0|ID= 1 DT= 2.0 min | Ia (mm)= 5.10 # of Linear Res.(N)= 3.00-------------------- U.H. Tp(hrs)= 0.05 NOTE: RAINFALL WAS TRANSFORMED TO 2.0 MIN. TIME STEP.
---- TRANSFORMED HYETOGRAPH ---- TIME RAIN | TIME RAIN |' TIME RAIN | TIME RAIN hrs mm/hr | hrs mm/hr |' hrs mm/hr | hrs mm/hr 0.033 1.19 | 6.033 2.15 |12.033 21.25 | 18.03 2.09 0.067 1.19 | 6.067 2.15 |12.067 21.25 | 18.07 2.09 0.100 1.19 | 6.100 2.15 |12.100 21.25 | 18.10 2.09 0.133 1.19 | 6.133 2.15 |12.133 21.25 | 18.13 2.09 0.167 1.19 | 6.167 2.15 |12.167 21.25 | 18.17 2.09 0.200 1.19 | 6.200 2.15 |12.200 21.25 | 18.20 2.09 0.233 1.25 | 6.233 2.27 |12.233 15.88 | 18.23 2.09 0.267 1.25 | 6.267 2.27 |12.267 15.88 | 18.27 2.09 0.300 1.25 | 6.300 2.27 |12.300 15.88 | 18.30 2.09 0.333 1.25 | 6.333 2.27 |12.333 15.88 | 18.33 2.09 0.367 1.25 | 6.367 2.27 |12.367 15.88 | 18.37 2.09 0.400 1.25 | 6.400 2.27 |12.400 15.87 | 18.40 2.09 0.433 1.25 | 6.433 2.27 |12.433 10.87 | 18.43 1.97 0.467 1.25 | 6.467 2.27 |12.467 10.87 | 18.47 1.97 0.500 1.25 | 6.500 2.27 |12.500 10.87 | 18.50 1.97 0.533 1.25 | 6.533 2.27 |12.533 10.87 | 18.53 1.97 0.567 1.25 | 6.567 2.27 |12.567 10.87 | 18.57 1.97 0.600 1.25 | 6.600 2.27 |12.600 10.86 | 18.60 1.97 0.633 1.25 | 6.633 2.27 |12.633 9.19 | 18.63 1.97 0.667 1.25 | 6.667 2.27 |12.667 9.19 | 18.67 1.97 0.700 1.25 | 6.700 2.27 |12.700 9.19 | 18.70 1.97 0.733 1.25 | 6.733 2.27 |12.733 9.19 | 18.73 1.97 0.767 1.25 | 6.767 2.27 |12.767 9.19 | 18.77 1.97 0.800 1.25 | 6.800 2.27 |12.800 9.19 | 18.80 1.97 0.833 1.31 | 6.833 2.39 |12.833 7.88 | 18.83 1.85 0.867 1.31 | 6.867 2.39 |12.867 7.88 | 18.87 1.85 0.900 1.31 | 6.900 2.39 |12.900 7.88 | 18.90 1.85 0.933 1.31 | 6.933 2.39 |12.933 7.88 | 18.93 1.85 0.967 1.31 | 6.967 2.39 |12.967 7.88 | 18.97 1.85 1.000 1.31 | 7.000 2.39 |13.000 7.88 | 19.00 1.85 1.033 1.31 | 7.033 2.39 |13.033 6.93 | 19.03 1.85 1.067 1.31 | 7.067 2.39 |13.067 6.93 | 19.07 1.85 1.100 1.31 | 7.100 2.39 |13.100 6.93 | 19.10 1.85 1.133 1.31 | 7.133 2.39 |13.133 6.93 | 19.13 1.85 1.167 1.31 | 7.167 2.39 |13.167 6.93 | 19.17 1.85 1.200 1.31 | 7.200 2.39 |13.200 6.92 | 19.20 1.85 1.233 1.37 | 7.233 2.51 |13.233 6.33 | 19.23 1.79 1.267 1.37 | 7.267 2.51 |13.267 6.33 | 19.27 1.79 1.300 1.37 | 7.300 2.51 |13.300 6.33 | 19.30 1.79 1.333 1.37 | 7.333 2.51 |13.333 6.33 | 19.33 1.79 1.367 1.37 | 7.367 2.51 |13.367 6.33 | 19.37 1.79 1.400 1.37 | 7.400 2.51 |13.400 6.33 | 19.40 1.79 1.433 1.37 | 7.433 2.51 |13.433 5.61 | 19.43 1.67 1.467 1.37 | 7.467 2.51 |13.467 5.61 | 19.47 1.67 1.500 1.37 | 7.500 2.51 |13.500 5.61 | 19.50 1.67 1.533 1.37 | 7.533 2.51 |13.533 5.61 | 19.53 1.67 1.567 1.37 | 7.567 2.51 |13.567 5.61 | 19.57 1.67 1.600 1.37 | 7.600 2.51 |13.600 5.61 | 19.60 1.67 1.633 1.37 | 7.633 2.51 |13.633 5.13 | 19.63 1.61 1.667 1.37 | 7.667 2.51 |13.667 5.13 | 19.67 1.61 1.700 1.37 | 7.700 2.51 |13.700 5.13 | 19.70 1.61 1.733 1.37 | 7.733 2.51 |13.733 5.13 | 19.73 1.61 1.767 1.37 | 7.767 2.51 |13.767 5.13 | 19.77 1.61 1.800 1.37 | 7.800 2.51 |13.800 5.13 | 19.80 1.61 1.833 1.43 | 7.833 2.63 |13.833 4.66 | 19.83 1.61 1.867 1.43 | 7.867 2.63 |13.867 4.66 | 19.87 1.61 1.900 1.43 | 7.900 2.63 |13.900 4.66 | 19.90 1.61 1.933 1.43 | 7.933 2.63 |13.933 4.66 | 19.93 1.61 1.967 1.43 | 7.967 2.63 |13.967 4.66 | 19.97 1.61 2.000 1.43 | 8.000 2.63 |14.000 4.66 | 20.00 1.61 2.033 1.43 | 8.033 2.75 |14.033 4.36 | 20.03 1.55 2.067 1.43 | 8.067 2.75 |14.067 4.36 | 20.07 1.55 2.100 1.43 | 8.100 2.75 |14.100 4.36 | 20.10 1.55 2.133 1.43 | 8.133 2.75 |14.133 4.36 | 20.13 1.55 2.167 1.43 | 8.167 2.75 |14.167 4.36 | 20.17 1.55 2.200 1.43 | 8.200 2.75 |14.200 4.36 | 20.20 1.55 2.233 1.49 | 8.233 2.98 |14.233 4.12 | 20.23 1.55 2.267 1.49 | 8.267 2.99 |14.267 4.12 | 20.27 1.55 2.300 1.49 | 8.300 2.99 |14.300 4.12 | 20.30 1.55 2.333 1.49 | 8.333 2.99 |14.333 4.12 | 20.33 1.55 2.367 1.49 | 8.367 2.99 |14.367 4.12 | 20.37 1.55 2.400 1.49 | 8.400 2.99 |14.400 4.12 | 20.40 1.55 2.433 1.49 | 8.433 3.22 |14.433 4.00 | 20.43 1.49 2.467 1.49 | 8.467 3.22 |14.467 4.00 | 20.47 1.49 2.500 1.49 | 8.500 3.22 |14.500 4.00 | 20.50 1.49 2.533 1.49 | 8.533 3.22 |14.533 4.00 | 20.53 1.49
2.567 1.49 | 8.567 3.22 |14.567 4.00 | 20.57 1.49 2.600 1.49 | 8.600 3.22 |14.600 4.00 | 20.60 1.49 2.633 1.49 | 8.633 3.46 |14.633 3.88 | 20.63 1.49 2.667 1.49 | 8.667 3.46 |14.667 3.88 | 20.67 1.49 2.700 1.49 | 8.700 3.46 |14.700 3.88 | 20.70 1.49 2.733 1.49 | 8.733 3.46 |14.733 3.88 | 20.73 1.49 2.767 1.49 | 8.767 3.46 |14.767 3.88 | 20.77 1.49 2.800 1.49 | 8.800 3.46 |14.800 3.88 | 20.80 1.49 2.833 1.55 | 8.833 3.70 |14.833 3.64 | 20.83 1.49 2.867 1.55 | 8.867 3.70 |14.867 3.64 | 20.87 1.49 2.900 1.55 | 8.900 3.70 |14.900 3.64 | 20.90 1.49 2.933 1.55 | 8.933 3.70 |14.933 3.64 | 20.93 1.49 2.967 1.55 | 8.967 3.70 |14.967 3.64 | 20.97 1.49 3.000 1.55 | 9.000 3.70 |15.000 3.64 | 21.00 1.49 3.033 1.55 | 9.033 3.82 |15.033 3.52 | 21.03 1.49 3.067 1.55 | 9.067 3.82 |15.067 3.52 | 21.07 1.49 3.100 1.55 | 9.100 3.82 |15.100 3.52 | 21.10 1.49 3.133 1.55 | 9.133 3.82 |15.133 3.52 | 21.13 1.49 3.167 1.55 | 9.167 3.82 |15.167 3.52 | 21.17 1.49 3.200 1.55 | 9.200 3.82 |15.200 3.52 | 21.20 1.49 3.233 1.61 | 9.233 3.82 |15.233 3.28 | 21.23 1.49 3.267 1.61 | 9.267 3.82 |15.267 3.28 | 21.27 1.49 3.300 1.61 | 9.300 3.82 |15.300 3.28 | 21.30 1.49 3.333 1.61 | 9.333 3.82 |15.333 3.28 | 21.33 1.49 3.367 1.61 | 9.367 3.82 |15.367 3.28 | 21.37 1.49 3.400 1.61 | 9.400 3.82 |15.400 3.28 | 21.40 1.49 3.433 1.61 | 9.433 3.88 |15.433 3.16 | 21.43 1.49 3.467 1.61 | 9.467 3.88 |15.467 3.16 | 21.47 1.49 3.500 1.61 | 9.500 3.88 |15.500 3.16 | 21.50 1.49 3.533 1.61 | 9.533 3.88 |15.533 3.16 | 21.53 1.49 3.567 1.61 | 9.567 3.88 |15.567 3.16 | 21.57 1.49 3.600 1.61 | 9.600 3.88 |15.600 3.16 | 21.60 1.49 3.633 1.61 | 9.633 4.18 |15.633 3.04 | 21.63 1.43 3.667 1.61 | 9.667 4.18 |15.667 3.04 | 21.67 1.43 3.700 1.61 | 9.700 4.18 |15.700 3.04 | 21.70 1.43 3.733 1.61 | 9.733 4.18 |15.733 3.04 | 21.73 1.43 3.767 1.61 | 9.767 4.18 |15.767 3.04 | 21.77 1.43 3.800 1.61 | 9.800 4.18 |15.800 3.04 | 21.80 1.43 3.833 1.67 | 9.833 4.60 |15.833 2.81 | 21.83 1.43 3.867 1.67 | 9.867 4.60 |15.867 2.81 | 21.87 1.43 3.900 1.67 | 9.900 4.60 |15.900 2.81 | 21.90 1.43 3.933 1.67 | 9.933 4.60 |15.933 2.81 | 21.93 1.43 3.967 1.67 | 9.967 4.60 |15.967 2.81 | 21.97 1.43 4.000 1.67 |10.000 4.60 |16.000 2.81 | 22.00 1.43 4.033 1.67 |10.033 5.07 |16.033 2.69 | 22.03 1.43 4.067 1.67 |10.067 5.07 |16.067 2.69 | 22.07 1.43 4.100 1.67 |10.100 5.07 |16.100 2.69 | 22.10 1.43 4.133 1.67 |10.133 5.07 |16.133 2.69 | 22.13 1.43 4.167 1.67 |10.167 5.07 |16.167 2.69 | 22.17 1.43 4.200 1.67 |10.200 5.07 |16.200 2.69 | 22.20 1.43 4.233 1.79 |10.233 5.61 |16.233 2.69 | 22.23 1.43 4.267 1.79 |10.267 5.61 |16.267 2.69 | 22.27 1.43 4.300 1.79 |10.300 5.61 |16.300 2.69 | 22.30 1.43 4.333 1.79 |10.333 5.61 |16.333 2.69 | 22.33 1.43 4.367 1.79 |10.367 5.61 |16.367 2.69 | 22.37 1.43 4.400 1.79 |10.400 5.61 |16.400 2.69 | 22.40 1.43 4.433 1.79 |10.433 6.27 |16.433 2.63 | 22.43 1.37 4.467 1.79 |10.467 6.27 |16.467 2.63 | 22.47 1.37 4.500 1.79 |10.500 6.27 |16.500 2.63 | 22.50 1.37 4.533 1.79 |10.533 6.27 |16.533 2.63 | 22.53 1.37 4.567 1.79 |10.567 6.27 |16.567 2.63 | 22.57 1.37 4.600 1.79 |10.600 6.27 |16.600 2.63 | 22.60 1.37 4.633 1.79 |10.633 7.16 |16.633 2.51 | 22.63 1.37 4.667 1.79 |10.667 7.16 |16.667 2.51 | 22.67 1.37 4.700 1.79 |10.700 7.16 |16.700 2.51 | 22.70 1.37 4.733 1.79 |10.733 7.16 |16.733 2.51 | 22.73 1.37 4.767 1.79 |10.767 7.16 |16.767 2.51 | 22.77 1.37 4.800 1.79 |10.800 7.16 |16.800 2.51 | 22.80 1.37 4.833 1.91 |10.833 8.12 |16.833 2.51 | 22.83 1.37 4.867 1.91 |10.867 8.12 |16.867 2.51 | 22.87 1.37 4.900 1.91 |10.900 8.12 |16.900 2.51 | 22.90 1.37 4.933 1.91 |10.933 8.12 |16.933 2.51 | 22.93 1.37 4.967 1.91 |10.967 8.12 |16.967 2.51 | 22.97 1.37 5.000 1.91 |11.000 8.12 |17.000 2.51 | 23.00 1.37 5.033 1.91 |11.033 9.73 |17.033 2.39 | 23.03 1.37 5.067 1.91 |11.067 9.73 |17.067 2.39 | 23.07 1.37 5.100 1.91 |11.100 9.73 |17.100 2.39 | 23.10 1.37 5.133 1.91 |11.133 9.73 |17.133 2.39 | 23.13 1.37 5.167 1.91 |11.167 9.73 |17.167 2.39 | 23.17 1.37 5.200 1.91 |11.200 9.73 |17.200 2.39 | 23.20 1.37 5.233 2.03 |11.233 12.06 |17.233 2.33 | 23.23 1.37 5.267 2.03 |11.267 12.06 |17.267 2.33 | 23.27 1.37 5.300 2.03 |11.300 12.06 |17.300 2.33 | 23.30 1.37 5.333 2.03 |11.333 12.06 |17.333 2.33 | 23.33 1.37 5.367 2.03 |11.367 12.06 |17.367 2.33 | 23.37 1.37 5.400 2.03 |11.400 12.07 |17.400 2.33 | 23.40 1.37 5.433 2.03 |11.433 21.07 |17.433 2.33 | 23.43 1.37 5.467 2.03 |11.467 21.07 |17.467 2.33 | 23.47 1.37 5.500 2.03 |11.500 21.07 |17.500 2.33 | 23.50 1.37 5.533 2.03 |11.533 21.07 |17.533 2.33 | 23.53 1.37 5.567 2.03 |11.567 21.07 |17.567 2.33 | 23.57 1.37 5.600 2.03 |11.600 21.14 |17.600 2.33 | 23.60 1.37 5.633 2.03 |11.633 74.03 |17.633 2.21 | 23.63 1.31 5.667 2.03 |11.667 74.03 |17.667 2.21 | 23.67 1.31 5.700 2.03 |11.700 74.03 |17.700 2.21 | 23.70 1.31 5.733 2.03 |11.733 74.03 |17.733 2.21 | 23.73 1.31 5.767 2.03 |11.767 74.03 |17.767 2.21 | 23.77 1.31 5.800 2.03 |11.800 74.11 |17.800 2.21 | 23.80 1.31 5.833 2.15 |11.833 138.62 |17.833 2.21 | 23.83 1.31 5.867 2.15 |11.867 138.62 |17.867 2.21 | 23.87 1.31 5.900 2.15 |11.900 138.62 |17.900 2.21 | 23.90 1.31 5.933 2.15 |11.933 138.62 |17.933 2.21 | 23.93 1.31 5.967 2.15 |11.967 138.62 |17.967 2.21 | 23.97 1.31 6.000 2.15 |12.000 138.46 |18.000 2.21 | 24.00 1.31 Unit Hyd Qpeak (cms)= 0.420 PEAK FLOW (cms)= 0.171 (i) TIME TO PEAK (hrs)= 12.000 RUNOFF VOLUME (mm)= 79.385 TOTAL RAINFALL (mm)= 119.399 RUNOFF COEFFICIENT = 0.665 (i) PEAK FLOW DOES NOT INCLUDE BASEFLOW IF ANY. ---------------------------------------------------------------------------------------------------| CALIB || NASHYD (0206) | Area (ha)= 3.23 Curve Number (CN)= 82.0|ID= 1 DT= 4.0 min | Ia (mm)= 5.60 # of Linear Res.(N)= 3.00-------------------- U.H. Tp(hrs)= 0.33 NOTE: RAINFALL WAS TRANSFORMED TO 4.0 MIN. TIME STEP.
---- TRANSFORMED HYETOGRAPH ---- TIME RAIN | TIME RAIN |' TIME RAIN | TIME RAIN hrs mm/hr | hrs mm/hr |' hrs mm/hr | hrs mm/hr 0.067 1.19 | 6.067 2.15 |12.067 21.27 | 18.07 2.09 0.133 1.19 | 6.133 2.15 |12.133 21.25 | 18.13 2.09 0.200 1.19 | 6.200 2.15 |12.200 21.25 | 18.20 2.09 0.267 1.25 | 6.267 2.27 |12.267 15.88 | 18.27 2.09 0.333 1.25 | 6.333 2.27 |12.333 15.88 | 18.33 2.09 0.400 1.25 | 6.400 2.27 |12.400 15.88 | 18.40 2.09 0.467 1.25 | 6.467 2.27 |12.467 10.87 | 18.47 1.97 0.533 1.25 | 6.533 2.27 |12.533 10.87 | 18.53 1.97 0.600 1.25 | 6.600 2.27 |12.600 10.87 | 18.60 1.97 0.667 1.25 | 6.667 2.27 |12.667 9.19 | 18.67 1.97 0.733 1.25 | 6.733 2.27 |12.733 9.19 | 18.73 1.97 0.800 1.25 | 6.800 2.27 |12.800 9.19 | 18.80 1.97 0.867 1.31 | 6.867 2.39 |12.867 7.88 | 18.87 1.85 0.933 1.31 | 6.933 2.39 |12.933 7.88 | 18.93 1.85 1.000 1.31 | 7.000 2.39 |13.000 7.88 | 19.00 1.85
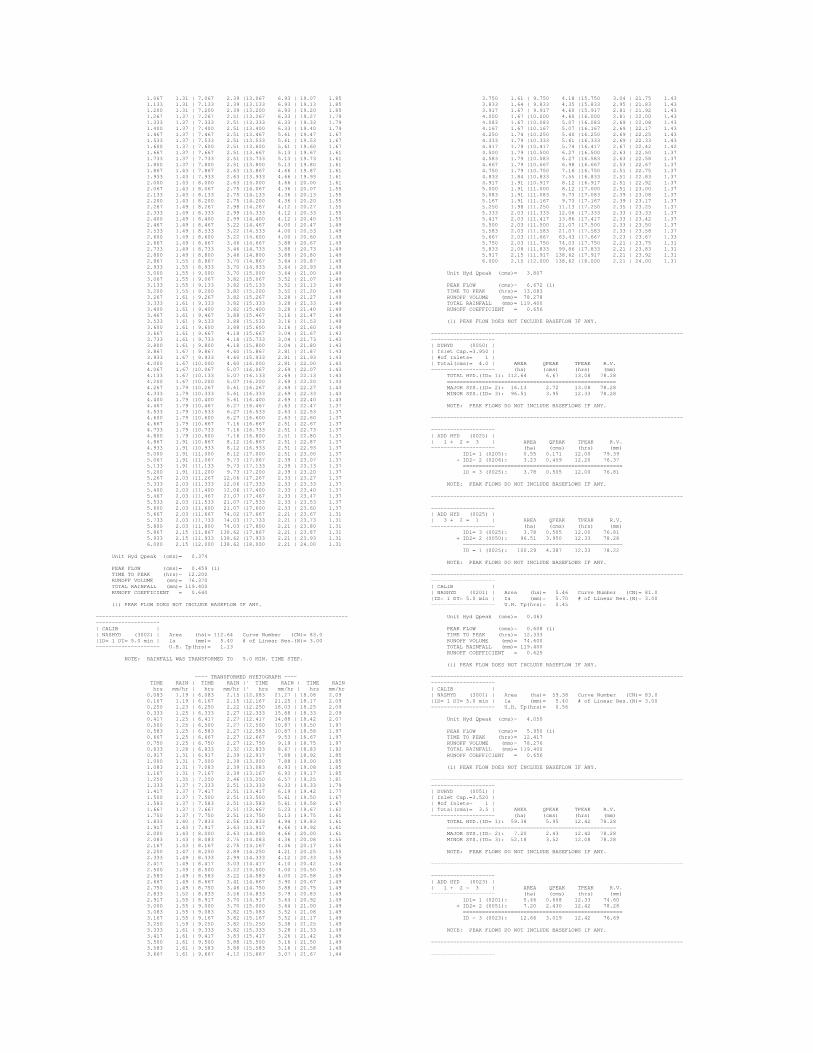
1.067 1.31 | 7.067 2.39 |13.067 6.93 | 19.07 1.85 1.133 1.31 | 7.133 2.39 |13.133 6.93 | 19.13 1.85 1.200 1.31 | 7.200 2.39 |13.200 6.93 | 19.20 1.85 1.267 1.37 | 7.267 2.51 |13.267 6.33 | 19.27 1.79 1.333 1.37 | 7.333 2.51 |13.333 6.33 | 19.33 1.79 1.400 1.37 | 7.400 2.51 |13.400 6.33 | 19.40 1.79 1.467 1.37 | 7.467 2.51 |13.467 5.61 | 19.47 1.67 1.533 1.37 | 7.533 2.51 |13.533 5.61 | 19.53 1.67 1.600 1.37 | 7.600 2.51 |13.600 5.61 | 19.60 1.67 1.667 1.37 | 7.667 2.51 |13.667 5.13 | 19.67 1.61 1.733 1.37 | 7.733 2.51 |13.733 5.13 | 19.73 1.61 1.800 1.37 | 7.800 2.51 |13.800 5.13 | 19.80 1.61 1.867 1.43 | 7.867 2.63 |13.867 4.66 | 19.87 1.61 1.933 1.43 | 7.933 2.63 |13.933 4.66 | 19.93 1.61 2.000 1.43 | 8.000 2.63 |14.000 4.66 | 20.00 1.61 2.067 1.43 | 8.067 2.75 |14.067 4.36 | 20.07 1.55 2.133 1.43 | 8.133 2.75 |14.133 4.36 | 20.13 1.55 2.200 1.43 | 8.200 2.75 |14.200 4.36 | 20.20 1.55 2.267 1.49 | 8.267 2.98 |14.267 4.12 | 20.27 1.55 2.333 1.49 | 8.333 2.99 |14.333 4.12 | 20.33 1.55 2.400 1.49 | 8.400 2.99 |14.400 4.12 | 20.40 1.55 2.467 1.49 | 8.467 3.22 |14.467 4.00 | 20.47 1.49 2.533 1.49 | 8.533 3.22 |14.533 4.00 | 20.53 1.49 2.600 1.49 | 8.600 3.22 |14.600 4.00 | 20.60 1.49 2.667 1.49 | 8.667 3.46 |14.667 3.88 | 20.67 1.49 2.733 1.49 | 8.733 3.46 |14.733 3.88 | 20.73 1.49 2.800 1.49 | 8.800 3.46 |14.800 3.88 | 20.80 1.49 2.867 1.55 | 8.867 3.70 |14.867 3.64 | 20.87 1.49 2.933 1.55 | 8.933 3.70 |14.933 3.64 | 20.93 1.49 3.000 1.55 | 9.000 3.70 |15.000 3.64 | 21.00 1.49 3.067 1.55 | 9.067 3.82 |15.067 3.52 | 21.07 1.49 3.133 1.55 | 9.133 3.82 |15.133 3.52 | 21.13 1.49 3.200 1.55 | 9.200 3.82 |15.200 3.52 | 21.20 1.49 3.267 1.61 | 9.267 3.82 |15.267 3.28 | 21.27 1.49 3.333 1.61 | 9.333 3.82 |15.333 3.28 | 21.33 1.49 3.400 1.61 | 9.400 3.82 |15.400 3.28 | 21.40 1.49 3.467 1.61 | 9.467 3.88 |15.467 3.16 | 21.47 1.49 3.533 1.61 | 9.533 3.88 |15.533 3.16 | 21.53 1.49 3.600 1.61 | 9.600 3.88 |15.600 3.16 | 21.60 1.49 3.667 1.61 | 9.667 4.18 |15.667 3.04 | 21.67 1.43 3.733 1.61 | 9.733 4.18 |15.733 3.04 | 21.73 1.43 3.800 1.61 | 9.800 4.18 |15.800 3.04 | 21.80 1.43 3.867 1.67 | 9.867 4.60 |15.867 2.81 | 21.87 1.43 3.933 1.67 | 9.933 4.60 |15.933 2.81 | 21.93 1.43 4.000 1.67 |10.000 4.60 |16.000 2.81 | 22.00 1.43 4.067 1.67 |10.067 5.07 |16.067 2.69 | 22.07 1.43 4.133 1.67 |10.133 5.07 |16.133 2.69 | 22.13 1.43 4.200 1.67 |10.200 5.07 |16.200 2.69 | 22.20 1.43 4.267 1.79 |10.267 5.61 |16.267 2.69 | 22.27 1.43 4.333 1.79 |10.333 5.61 |16.333 2.69 | 22.33 1.43 4.400 1.79 |10.400 5.61 |16.400 2.69 | 22.40 1.43 4.467 1.79 |10.467 6.27 |16.467 2.63 | 22.47 1.37 4.533 1.79 |10.533 6.27 |16.533 2.63 | 22.53 1.37 4.600 1.79 |10.600 6.27 |16.600 2.63 | 22.60 1.37 4.667 1.79 |10.667 7.16 |16.667 2.51 | 22.67 1.37 4.733 1.79 |10.733 7.16 |16.733 2.51 | 22.73 1.37 4.800 1.79 |10.800 7.16 |16.800 2.51 | 22.80 1.37 4.867 1.91 |10.867 8.12 |16.867 2.51 | 22.87 1.37 4.933 1.91 |10.933 8.12 |16.933 2.51 | 22.93 1.37 5.000 1.91 |11.000 8.12 |17.000 2.51 | 23.00 1.37 5.067 1.91 |11.067 9.73 |17.067 2.39 | 23.07 1.37 5.133 1.91 |11.133 9.73 |17.133 2.39 | 23.13 1.37 5.200 1.91 |11.200 9.73 |17.200 2.39 | 23.20 1.37 5.267 2.03 |11.267 12.06 |17.267 2.33 | 23.27 1.37 5.333 2.03 |11.333 12.06 |17.333 2.33 | 23.33 1.37 5.400 2.03 |11.400 12.06 |17.400 2.33 | 23.40 1.37 5.467 2.03 |11.467 21.07 |17.467 2.33 | 23.47 1.37 5.533 2.03 |11.533 21.07 |17.533 2.33 | 23.53 1.37 5.600 2.03 |11.600 21.07 |17.600 2.33 | 23.60 1.37 5.667 2.03 |11.667 74.02 |17.667 2.21 | 23.67 1.31 5.733 2.03 |11.733 74.03 |17.733 2.21 | 23.73 1.31 5.800 2.03 |11.800 74.03 |17.800 2.21 | 23.80 1.31 5.867 2.15 |11.867 138.62 |17.867 2.21 | 23.87 1.31 5.933 2.15 |11.933 138.62 |17.933 2.21 | 23.93 1.31 6.000 2.15 |12.000 138.62 |18.000 2.21 | 24.00 1.31 Unit Hyd Qpeak (cms)= 0.374 PEAK FLOW (cms)= 0.459 (i) TIME TO PEAK (hrs)= 12.200 RUNOFF VOLUME (mm)= 76.370 TOTAL RAINFALL (mm)= 119.400 RUNOFF COEFFICIENT = 0.640 (i) PEAK FLOW DOES NOT INCLUDE BASEFLOW IF ANY. ---------------------------------------------------------------------------------------------------| CALIB || NASHYD (3002) | Area (ha)= 112.64 Curve Number (CN)= 83.0|ID= 1 DT= 5.0 min | Ia (mm)= 5.40 # of Linear Res.(N)= 3.00-------------------- U.H. Tp(hrs)= 1.13 NOTE: RAINFALL WAS TRANSFORMED TO 5.0 MIN. TIME STEP.
---- TRANSFORMED HYETOGRAPH ---- TIME RAIN | TIME RAIN |' TIME RAIN | TIME RAIN hrs mm/hr | hrs mm/hr |' hrs mm/hr | hrs mm/hr 0.083 1.19 | 6.083 2.15 |12.083 21.27 | 18.08 2.09 0.167 1.19 | 6.167 2.15 |12.167 21.25 | 18.17 2.09 0.250 1.23 | 6.250 2.22 |12.250 18.03 | 18.25 2.09 0.333 1.25 | 6.333 2.27 |12.333 15.88 | 18.33 2.09 0.417 1.25 | 6.417 2.27 |12.417 14.88 | 18.42 2.07 0.500 1.25 | 6.500 2.27 |12.500 10.87 | 18.50 1.97 0.583 1.25 | 6.583 2.27 |12.583 10.87 | 18.58 1.97 0.667 1.25 | 6.667 2.27 |12.667 9.53 | 18.67 1.97 0.750 1.25 | 6.750 2.27 |12.750 9.19 | 18.75 1.97 0.833 1.28 | 6.833 2.32 |12.833 8.67 | 18.83 1.92 0.917 1.31 | 6.917 2.39 |12.917 7.88 | 18.92 1.85 1.000 1.31 | 7.000 2.39 |13.000 7.88 | 19.00 1.85 1.083 1.31 | 7.083 2.39 |13.083 6.93 | 19.08 1.85 1.167 1.31 | 7.167 2.39 |13.167 6.93 | 19.17 1.85 1.250 1.35 | 7.250 2.46 |13.250 6.57 | 19.25 1.81 1.333 1.37 | 7.333 2.51 |13.333 6.33 | 19.33 1.79 1.417 1.37 | 7.417 2.51 |13.417 6.19 | 19.42 1.77 1.500 1.37 | 7.500 2.51 |13.500 5.61 | 19.50 1.67 1.583 1.37 | 7.583 2.51 |13.583 5.61 | 19.58 1.67 1.667 1.37 | 7.667 2.51 |13.667 5.23 | 19.67 1.62 1.750 1.37 | 7.750 2.51 |13.750 5.13 | 19.75 1.61 1.833 1.40 | 7.833 2.56 |13.833 4.94 | 19.83 1.61 1.917 1.43 | 7.917 2.63 |13.917 4.66 | 19.92 1.61 2.000 1.43 | 8.000 2.63 |14.000 4.66 | 20.00 1.61 2.083 1.43 | 8.083 2.75 |14.083 4.36 | 20.08 1.55 2.167 1.43 | 8.167 2.75 |14.167 4.36 | 20.17 1.55 2.250 1.47 | 8.250 2.89 |14.250 4.21 | 20.25 1.55 2.333 1.49 | 8.333 2.99 |14.333 4.12 | 20.33 1.55 2.417 1.49 | 8.417 3.03 |14.417 4.10 | 20.42 1.54 2.500 1.49 | 8.500 3.22 |14.500 4.00 | 20.50 1.49 2.583 1.49 | 8.583 3.22 |14.583 4.00 | 20.58 1.49 2.667 1.49 | 8.667 3.41 |14.667 3.90 | 20.67 1.49 2.750 1.49 | 8.750 3.46 |14.750 3.88 | 20.75 1.49 2.833 1.52 | 8.833 3.56 |14.833 3.79 | 20.83 1.49 2.917 1.55 | 8.917 3.70 |14.917 3.64 | 20.92 1.49 3.000 1.55 | 9.000 3.70 |15.000 3.64 | 21.00 1.49 3.083 1.55 | 9.083 3.82 |15.083 3.52 | 21.08 1.49 3.167 1.55 | 9.167 3.82 |15.167 3.52 | 21.17 1.49 3.250 1.59 | 9.250 3.82 |15.250 3.38 | 21.25 1.49 3.333 1.61 | 9.333 3.82 |15.333 3.28 | 21.33 1.49 3.417 1.61 | 9.417 3.83 |15.417 3.26 | 21.42 1.49 3.500 1.61 | 9.500 3.88 |15.500 3.16 | 21.50 1.49 3.583 1.61 | 9.583 3.88 |15.583 3.16 | 21.58 1.49 3.667 1.61 | 9.667 4.12 |15.667 3.07 | 21.67 1.44
3.750 1.61 | 9.750 4.18 |15.750 3.04 | 21.75 1.43 3.833 1.64 | 9.833 4.35 |15.833 2.95 | 21.83 1.43 3.917 1.67 | 9.917 4.60 |15.917 2.81 | 21.92 1.43 4.000 1.67 |10.000 4.60 |16.000 2.81 | 22.00 1.43 4.083 1.67 |10.083 5.07 |16.083 2.69 | 22.08 1.43 4.167 1.67 |10.167 5.07 |16.167 2.69 | 22.17 1.43 4.250 1.74 |10.250 5.40 |16.250 2.69 | 22.25 1.43 4.333 1.79 |10.333 5.61 |16.333 2.69 | 22.33 1.43 4.417 1.79 |10.417 5.74 |16.417 2.67 | 22.42 1.42 4.500 1.79 |10.500 6.27 |16.500 2.63 | 22.50 1.37 4.583 1.79 |10.583 6.27 |16.583 2.63 | 22.58 1.37 4.667 1.79 |10.667 6.98 |16.667 2.53 | 22.67 1.37 4.750 1.79 |10.750 7.16 |16.750 2.51 | 22.75 1.37 4.833 1.84 |10.833 7.55 |16.833 2.51 | 22.83 1.37 4.917 1.91 |10.917 8.12 |16.917 2.51 | 22.92 1.37 5.000 1.91 |11.000 8.12 |17.000 2.51 | 23.00 1.37 5.083 1.91 |11.083 9.73 |17.083 2.39 | 23.08 1.37 5.167 1.91 |11.167 9.73 |17.167 2.39 | 23.17 1.37 5.250 1.98 |11.250 11.13 |17.250 2.35 | 23.25 1.37 5.333 2.03 |11.333 12.06 |17.333 2.33 | 23.33 1.37 5.417 2.03 |11.417 13.86 |17.417 2.33 | 23.42 1.37 5.500 2.03 |11.500 21.07 |17.500 2.33 | 23.50 1.37 5.583 2.03 |11.583 21.07 |17.583 2.33 | 23.58 1.37 5.667 2.03 |11.667 63.43 |17.667 2.23 | 23.67 1.33 5.750 2.03 |11.750 74.03 |17.750 2.21 | 23.75 1.31 5.833 2.08 |11.833 99.86 |17.833 2.21 | 23.83 1.31 5.917 2.15 |11.917 138.62 |17.917 2.21 | 23.92 1.31 6.000 2.15 |12.000 138.62 |18.000 2.21 | 24.00 1.31 Unit Hyd Qpeak (cms)= 3.807 PEAK FLOW (cms)= 6.672 (i) TIME TO PEAK (hrs)= 13.083 RUNOFF VOLUME (mm)= 78.278 TOTAL RAINFALL (mm)= 119.400 RUNOFF COEFFICIENT = 0.656 (i) PEAK FLOW DOES NOT INCLUDE BASEFLOW IF ANY. ---------------------------------------------------------------------------------------------------| DUHYD (0050) || Inlet Cap.=3.950 || #of Inlets= 1 || Total(cms)= 4.0 | AREA QPEAK TPEAK R.V.-------------------- (ha) (cms) (hrs) (mm) TOTAL HYD.(ID= 1): 112.64 6.67 13.08 78.28 ===================================================== MAJOR SYS.(ID= 2): 16.13 2.72 13.08 78.28 MINOR SYS.(ID= 3): 96.51 3.95 12.33 78.28 NOTE: PEAK FLOWS DO NOT INCLUDE BASEFLOWS IF ANY. ------------------------------------------------------------------------------- --------------------| ADD HYD (0025) || 1 + 2 = 3 | AREA QPEAK TPEAK R.V.-------------------- (ha) (cms) (hrs) (mm) ID1= 1 (0205): 0.55 0.171 12.00 79.39 + ID2= 2 (0206): 3.23 0.459 12.20 76.37 ================================================== ID = 3 (0025): 3.78 0.505 12.00 76.81 NOTE: PEAK FLOWS DO NOT INCLUDE BASEFLOWS IF ANY. ------------------------------------------------------------------------------- --------------------| ADD HYD (0025) || 3 + 2 = 1 | AREA QPEAK TPEAK R.V.-------------------- (ha) (cms) (hrs) (mm) ID1= 3 (0025): 3.78 0.505 12.00 76.81 + ID2= 2 (0050): 96.51 3.950 12.33 78.28 ================================================== ID = 1 (0025): 100.29 4.387 12.33 78.22 NOTE: PEAK FLOWS DO NOT INCLUDE BASEFLOWS IF ANY. ---------------------------------------------------------------------------------------------------| CALIB || NASHYD (0201) | Area (ha)= 5.46 Curve Number (CN)= 81.0|ID= 1 DT= 5.0 min | Ia (mm)= 5.70 # of Linear Res.(N)= 3.00-------------------- U.H. Tp(hrs)= 0.45 Unit Hyd Qpeak (cms)= 0.463 PEAK FLOW (cms)= 0.608 (i) TIME TO PEAK (hrs)= 12.333 RUNOFF VOLUME (mm)= 74.600 TOTAL RAINFALL (mm)= 119.400 RUNOFF COEFFICIENT = 0.625 (i) PEAK FLOW DOES NOT INCLUDE BASEFLOW IF ANY. ---------------------------------------------------------------------------------------------------| CALIB || NASHYD (3001) | Area (ha)= 59.38 Curve Number (CN)= 83.0|ID= 1 DT= 5.0 min | Ia (mm)= 5.40 # of Linear Res.(N)= 3.00-------------------- U.H. Tp(hrs)= 0.56 Unit Hyd Qpeak (cms)= 4.050 PEAK FLOW (cms)= 5.950 (i) TIME TO PEAK (hrs)= 12.417 RUNOFF VOLUME (mm)= 78.276 TOTAL RAINFALL (mm)= 119.400 RUNOFF COEFFICIENT = 0.656 (i) PEAK FLOW DOES NOT INCLUDE BASEFLOW IF ANY. ---------------------------------------------------------------------------------------------------| DUHYD (0051) || Inlet Cap.=3.520 || #of Inlets= 1 || Total(cms)= 3.5 | AREA QPEAK TPEAK R.V.-------------------- (ha) (cms) (hrs) (mm) TOTAL HYD.(ID= 1): 59.38 5.95 12.42 78.28 ===================================================== MAJOR SYS.(ID= 2): 7.20 2.43 12.42 78.28 MINOR SYS.(ID= 3): 52.18 3.52 12.08 78.28 NOTE: PEAK FLOWS DO NOT INCLUDE BASEFLOWS IF ANY. ------------------------------------------------------------------------------- --------------------| ADD HYD (0023) || 1 + 2 = 3 | AREA QPEAK TPEAK R.V.-------------------- (ha) (cms) (hrs) (mm) ID1= 1 (0201): 5.46 0.608 12.33 74.60 + ID2= 2 (0051): 7.20 2.430 12.42 78.28 ================================================== ID = 3 (0023): 12.66 3.019 12.42 76.69 NOTE: PEAK FLOWS DO NOT INCLUDE BASEFLOWS IF ANY. ------------------------------------------------------------------------------- --------------------

| ADD HYD (0024) || 1 + 2 = 3 | AREA QPEAK TPEAK R.V.-------------------- (ha) (cms) (hrs) (mm) ID1= 1 (0023): 12.66 3.019 12.42 76.69 + ID2= 2 (0051): 52.18 3.520 12.08 78.28 ================================================== ID = 3 (0024): 64.84 6.539 12.42 77.97 NOTE: PEAK FLOWS DO NOT INCLUDE BASEFLOWS IF ANY. ---------------------------------------------------------------------------------------------------| CALIB || NASHYD (0203) | Area (ha)= 1.76 Curve Number (CN)= 84.0|ID= 1 DT= 2.0 min | Ia (mm)= 5.20 # of Linear Res.(N)= 3.00-------------------- U.H. Tp(hrs)= 0.09 NOTE: RAINFALL WAS TRANSFORMED TO 2.0 MIN. TIME STEP.
---- TRANSFORMED HYETOGRAPH ---- TIME RAIN | TIME RAIN |' TIME RAIN | TIME RAIN hrs mm/hr | hrs mm/hr |' hrs mm/hr | hrs mm/hr 0.033 1.19 | 6.033 2.15 |12.033 21.25 | 18.03 2.09 0.067 1.19 | 6.067 2.15 |12.067 21.25 | 18.07 2.09 0.100 1.19 | 6.100 2.15 |12.100 21.25 | 18.10 2.09 0.133 1.19 | 6.133 2.15 |12.133 21.25 | 18.13 2.09 0.167 1.19 | 6.167 2.15 |12.167 21.25 | 18.17 2.09 0.200 1.19 | 6.200 2.15 |12.200 21.25 | 18.20 2.09 0.233 1.25 | 6.233 2.27 |12.233 15.88 | 18.23 2.09 0.267 1.25 | 6.267 2.27 |12.267 15.88 | 18.27 2.09 0.300 1.25 | 6.300 2.27 |12.300 15.88 | 18.30 2.09 0.333 1.25 | 6.333 2.27 |12.333 15.88 | 18.33 2.09 0.367 1.25 | 6.367 2.27 |12.367 15.88 | 18.37 2.09 0.400 1.25 | 6.400 2.27 |12.400 15.87 | 18.40 2.09 0.433 1.25 | 6.433 2.27 |12.433 10.87 | 18.43 1.97 0.467 1.25 | 6.467 2.27 |12.467 10.87 | 18.47 1.97 0.500 1.25 | 6.500 2.27 |12.500 10.87 | 18.50 1.97 0.533 1.25 | 6.533 2.27 |12.533 10.87 | 18.53 1.97 0.567 1.25 | 6.567 2.27 |12.567 10.87 | 18.57 1.97 0.600 1.25 | 6.600 2.27 |12.600 10.86 | 18.60 1.97 0.633 1.25 | 6.633 2.27 |12.633 9.19 | 18.63 1.97 0.667 1.25 | 6.667 2.27 |12.667 9.19 | 18.67 1.97 0.700 1.25 | 6.700 2.27 |12.700 9.19 | 18.70 1.97 0.733 1.25 | 6.733 2.27 |12.733 9.19 | 18.73 1.97 0.767 1.25 | 6.767 2.27 |12.767 9.19 | 18.77 1.97 0.800 1.25 | 6.800 2.27 |12.800 9.19 | 18.80 1.97 0.833 1.31 | 6.833 2.39 |12.833 7.88 | 18.83 1.85 0.867 1.31 | 6.867 2.39 |12.867 7.88 | 18.87 1.85 0.900 1.31 | 6.900 2.39 |12.900 7.88 | 18.90 1.85 0.933 1.31 | 6.933 2.39 |12.933 7.88 | 18.93 1.85 0.967 1.31 | 6.967 2.39 |12.967 7.88 | 18.97 1.85 1.000 1.31 | 7.000 2.39 |13.000 7.88 | 19.00 1.85 1.033 1.31 | 7.033 2.39 |13.033 6.93 | 19.03 1.85 1.067 1.31 | 7.067 2.39 |13.067 6.93 | 19.07 1.85 1.100 1.31 | 7.100 2.39 |13.100 6.93 | 19.10 1.85 1.133 1.31 | 7.133 2.39 |13.133 6.93 | 19.13 1.85 1.167 1.31 | 7.167 2.39 |13.167 6.93 | 19.17 1.85 1.200 1.31 | 7.200 2.39 |13.200 6.92 | 19.20 1.85 1.233 1.37 | 7.233 2.51 |13.233 6.33 | 19.23 1.79 1.267 1.37 | 7.267 2.51 |13.267 6.33 | 19.27 1.79 1.300 1.37 | 7.300 2.51 |13.300 6.33 | 19.30 1.79 1.333 1.37 | 7.333 2.51 |13.333 6.33 | 19.33 1.79 1.367 1.37 | 7.367 2.51 |13.367 6.33 | 19.37 1.79 1.400 1.37 | 7.400 2.51 |13.400 6.33 | 19.40 1.79 1.433 1.37 | 7.433 2.51 |13.433 5.61 | 19.43 1.67 1.467 1.37 | 7.467 2.51 |13.467 5.61 | 19.47 1.67 1.500 1.37 | 7.500 2.51 |13.500 5.61 | 19.50 1.67 1.533 1.37 | 7.533 2.51 |13.533 5.61 | 19.53 1.67 1.567 1.37 | 7.567 2.51 |13.567 5.61 | 19.57 1.67 1.600 1.37 | 7.600 2.51 |13.600 5.61 | 19.60 1.67 1.633 1.37 | 7.633 2.51 |13.633 5.13 | 19.63 1.61 1.667 1.37 | 7.667 2.51 |13.667 5.13 | 19.67 1.61 1.700 1.37 | 7.700 2.51 |13.700 5.13 | 19.70 1.61 1.733 1.37 | 7.733 2.51 |13.733 5.13 | 19.73 1.61 1.767 1.37 | 7.767 2.51 |13.767 5.13 | 19.77 1.61 1.800 1.37 | 7.800 2.51 |13.800 5.13 | 19.80 1.61 1.833 1.43 | 7.833 2.63 |13.833 4.66 | 19.83 1.61 1.867 1.43 | 7.867 2.63 |13.867 4.66 | 19.87 1.61 1.900 1.43 | 7.900 2.63 |13.900 4.66 | 19.90 1.61 1.933 1.43 | 7.933 2.63 |13.933 4.66 | 19.93 1.61 1.967 1.43 | 7.967 2.63 |13.967 4.66 | 19.97 1.61 2.000 1.43 | 8.000 2.63 |14.000 4.66 | 20.00 1.61 2.033 1.43 | 8.033 2.75 |14.033 4.36 | 20.03 1.55 2.067 1.43 | 8.067 2.75 |14.067 4.36 | 20.07 1.55 2.100 1.43 | 8.100 2.75 |14.100 4.36 | 20.10 1.55 2.133 1.43 | 8.133 2.75 |14.133 4.36 | 20.13 1.55 2.167 1.43 | 8.167 2.75 |14.167 4.36 | 20.17 1.55 2.200 1.43 | 8.200 2.75 |14.200 4.36 | 20.20 1.55 2.233 1.49 | 8.233 2.98 |14.233 4.12 | 20.23 1.55 2.267 1.49 | 8.267 2.99 |14.267 4.12 | 20.27 1.55 2.300 1.49 | 8.300 2.99 |14.300 4.12 | 20.30 1.55 2.333 1.49 | 8.333 2.99 |14.333 4.12 | 20.33 1.55 2.367 1.49 | 8.367 2.99 |14.367 4.12 | 20.37 1.55 2.400 1.49 | 8.400 2.99 |14.400 4.12 | 20.40 1.55 2.433 1.49 | 8.433 3.22 |14.433 4.00 | 20.43 1.49 2.467 1.49 | 8.467 3.22 |14.467 4.00 | 20.47 1.49 2.500 1.49 | 8.500 3.22 |14.500 4.00 | 20.50 1.49 2.533 1.49 | 8.533 3.22 |14.533 4.00 | 20.53 1.49 2.567 1.49 | 8.567 3.22 |14.567 4.00 | 20.57 1.49 2.600 1.49 | 8.600 3.22 |14.600 4.00 | 20.60 1.49 2.633 1.49 | 8.633 3.46 |14.633 3.88 | 20.63 1.49 2.667 1.49 | 8.667 3.46 |14.667 3.88 | 20.67 1.49 2.700 1.49 | 8.700 3.46 |14.700 3.88 | 20.70 1.49 2.733 1.49 | 8.733 3.46 |14.733 3.88 | 20.73 1.49 2.767 1.49 | 8.767 3.46 |14.767 3.88 | 20.77 1.49 2.800 1.49 | 8.800 3.46 |14.800 3.88 | 20.80 1.49 2.833 1.55 | 8.833 3.70 |14.833 3.64 | 20.83 1.49 2.867 1.55 | 8.867 3.70 |14.867 3.64 | 20.87 1.49 2.900 1.55 | 8.900 3.70 |14.900 3.64 | 20.90 1.49 2.933 1.55 | 8.933 3.70 |14.933 3.64 | 20.93 1.49 2.967 1.55 | 8.967 3.70 |14.967 3.64 | 20.97 1.49 3.000 1.55 | 9.000 3.70 |15.000 3.64 | 21.00 1.49 3.033 1.55 | 9.033 3.82 |15.033 3.52 | 21.03 1.49 3.067 1.55 | 9.067 3.82 |15.067 3.52 | 21.07 1.49 3.100 1.55 | 9.100 3.82 |15.100 3.52 | 21.10 1.49 3.133 1.55 | 9.133 3.82 |15.133 3.52 | 21.13 1.49 3.167 1.55 | 9.167 3.82 |15.167 3.52 | 21.17 1.49 3.200 1.55 | 9.200 3.82 |15.200 3.52 | 21.20 1.49 3.233 1.61 | 9.233 3.82 |15.233 3.28 | 21.23 1.49 3.267 1.61 | 9.267 3.82 |15.267 3.28 | 21.27 1.49 3.300 1.61 | 9.300 3.82 |15.300 3.28 | 21.30 1.49 3.333 1.61 | 9.333 3.82 |15.333 3.28 | 21.33 1.49 3.367 1.61 | 9.367 3.82 |15.367 3.28 | 21.37 1.49 3.400 1.61 | 9.400 3.82 |15.400 3.28 | 21.40 1.49 3.433 1.61 | 9.433 3.88 |15.433 3.16 | 21.43 1.49 3.467 1.61 | 9.467 3.88 |15.467 3.16 | 21.47 1.49 3.500 1.61 | 9.500 3.88 |15.500 3.16 | 21.50 1.49 3.533 1.61 | 9.533 3.88 |15.533 3.16 | 21.53 1.49 3.567 1.61 | 9.567 3.88 |15.567 3.16 | 21.57 1.49 3.600 1.61 | 9.600 3.88 |15.600 3.16 | 21.60 1.49 3.633 1.61 | 9.633 4.18 |15.633 3.04 | 21.63 1.43 3.667 1.61 | 9.667 4.18 |15.667 3.04 | 21.67 1.43 3.700 1.61 | 9.700 4.18 |15.700 3.04 | 21.70 1.43 3.733 1.61 | 9.733 4.18 |15.733 3.04 | 21.73 1.43 3.767 1.61 | 9.767 4.18 |15.767 3.04 | 21.77 1.43 3.800 1.61 | 9.800 4.18 |15.800 3.04 | 21.80 1.43 3.833 1.67 | 9.833 4.60 |15.833 2.81 | 21.83 1.43 3.867 1.67 | 9.867 4.60 |15.867 2.81 | 21.87 1.43 3.900 1.67 | 9.900 4.60 |15.900 2.81 | 21.90 1.43 3.933 1.67 | 9.933 4.60 |15.933 2.81 | 21.93 1.43 3.967 1.67 | 9.967 4.60 |15.967 2.81 | 21.97 1.43 4.000 1.67 |10.000 4.60 |16.000 2.81 | 22.00 1.43
4.033 1.67 |10.033 5.07 |16.033 2.69 | 22.03 1.43 4.067 1.67 |10.067 5.07 |16.067 2.69 | 22.07 1.43 4.100 1.67 |10.100 5.07 |16.100 2.69 | 22.10 1.43 4.133 1.67 |10.133 5.07 |16.133 2.69 | 22.13 1.43 4.167 1.67 |10.167 5.07 |16.167 2.69 | 22.17 1.43 4.200 1.67 |10.200 5.07 |16.200 2.69 | 22.20 1.43 4.233 1.79 |10.233 5.61 |16.233 2.69 | 22.23 1.43 4.267 1.79 |10.267 5.61 |16.267 2.69 | 22.27 1.43 4.300 1.79 |10.300 5.61 |16.300 2.69 | 22.30 1.43 4.333 1.79 |10.333 5.61 |16.333 2.69 | 22.33 1.43 4.367 1.79 |10.367 5.61 |16.367 2.69 | 22.37 1.43 4.400 1.79 |10.400 5.61 |16.400 2.69 | 22.40 1.43 4.433 1.79 |10.433 6.27 |16.433 2.63 | 22.43 1.37 4.467 1.79 |10.467 6.27 |16.467 2.63 | 22.47 1.37 4.500 1.79 |10.500 6.27 |16.500 2.63 | 22.50 1.37 4.533 1.79 |10.533 6.27 |16.533 2.63 | 22.53 1.37 4.567 1.79 |10.567 6.27 |16.567 2.63 | 22.57 1.37 4.600 1.79 |10.600 6.27 |16.600 2.63 | 22.60 1.37 4.633 1.79 |10.633 7.16 |16.633 2.51 | 22.63 1.37 4.667 1.79 |10.667 7.16 |16.667 2.51 | 22.67 1.37 4.700 1.79 |10.700 7.16 |16.700 2.51 | 22.70 1.37 4.733 1.79 |10.733 7.16 |16.733 2.51 | 22.73 1.37 4.767 1.79 |10.767 7.16 |16.767 2.51 | 22.77 1.37 4.800 1.79 |10.800 7.16 |16.800 2.51 | 22.80 1.37 4.833 1.91 |10.833 8.12 |16.833 2.51 | 22.83 1.37 4.867 1.91 |10.867 8.12 |16.867 2.51 | 22.87 1.37 4.900 1.91 |10.900 8.12 |16.900 2.51 | 22.90 1.37 4.933 1.91 |10.933 8.12 |16.933 2.51 | 22.93 1.37 4.967 1.91 |10.967 8.12 |16.967 2.51 | 22.97 1.37 5.000 1.91 |11.000 8.12 |17.000 2.51 | 23.00 1.37 5.033 1.91 |11.033 9.73 |17.033 2.39 | 23.03 1.37 5.067 1.91 |11.067 9.73 |17.067 2.39 | 23.07 1.37 5.100 1.91 |11.100 9.73 |17.100 2.39 | 23.10 1.37 5.133 1.91 |11.133 9.73 |17.133 2.39 | 23.13 1.37 5.167 1.91 |11.167 9.73 |17.167 2.39 | 23.17 1.37 5.200 1.91 |11.200 9.73 |17.200 2.39 | 23.20 1.37 5.233 2.03 |11.233 12.06 |17.233 2.33 | 23.23 1.37 5.267 2.03 |11.267 12.06 |17.267 2.33 | 23.27 1.37 5.300 2.03 |11.300 12.06 |17.300 2.33 | 23.30 1.37 5.333 2.03 |11.333 12.06 |17.333 2.33 | 23.33 1.37 5.367 2.03 |11.367 12.06 |17.367 2.33 | 23.37 1.37 5.400 2.03 |11.400 12.07 |17.400 2.33 | 23.40 1.37 5.433 2.03 |11.433 21.07 |17.433 2.33 | 23.43 1.37 5.467 2.03 |11.467 21.07 |17.467 2.33 | 23.47 1.37 5.500 2.03 |11.500 21.07 |17.500 2.33 | 23.50 1.37 5.533 2.03 |11.533 21.07 |17.533 2.33 | 23.53 1.37 5.567 2.03 |11.567 21.07 |17.567 2.33 | 23.57 1.37 5.600 2.03 |11.600 21.14 |17.600 2.33 | 23.60 1.37 5.633 2.03 |11.633 74.03 |17.633 2.21 | 23.63 1.31 5.667 2.03 |11.667 74.03 |17.667 2.21 | 23.67 1.31 5.700 2.03 |11.700 74.03 |17.700 2.21 | 23.70 1.31 5.733 2.03 |11.733 74.03 |17.733 2.21 | 23.73 1.31 5.767 2.03 |11.767 74.03 |17.767 2.21 | 23.77 1.31 5.800 2.03 |11.800 74.11 |17.800 2.21 | 23.80 1.31 5.833 2.15 |11.833 138.62 |17.833 2.21 | 23.83 1.31 5.867 2.15 |11.867 138.62 |17.867 2.21 | 23.87 1.31 5.900 2.15 |11.900 138.62 |17.900 2.21 | 23.90 1.31 5.933 2.15 |11.933 138.62 |17.933 2.21 | 23.93 1.31 5.967 2.15 |11.967 138.62 |17.967 2.21 | 23.97 1.31 6.000 2.15 |12.000 138.46 |18.000 2.21 | 24.00 1.31 Unit Hyd Qpeak (cms)= 0.747 PEAK FLOW (cms)= 0.501 (i) TIME TO PEAK (hrs)= 12.000 RUNOFF VOLUME (mm)= 80.119 TOTAL RAINFALL (mm)= 119.399 RUNOFF COEFFICIENT = 0.671 (i) PEAK FLOW DOES NOT INCLUDE BASEFLOW IF ANY. ---------------------------------------------------------------------------------------------------| CALIB || NASHYD (0202) | Area (ha)= 1.37 Curve Number (CN)= 82.0|ID= 1 DT= 4.0 min | Ia (mm)= 5.50 # of Linear Res.(N)= 3.00-------------------- U.H. Tp(hrs)= 0.29 NOTE: RAINFALL WAS TRANSFORMED TO 4.0 MIN. TIME STEP.
---- TRANSFORMED HYETOGRAPH ---- TIME RAIN | TIME RAIN |' TIME RAIN | TIME RAIN hrs mm/hr | hrs mm/hr |' hrs mm/hr | hrs mm/hr 0.067 1.19 | 6.067 2.15 |12.067 21.27 | 18.07 2.09 0.133 1.19 | 6.133 2.15 |12.133 21.25 | 18.13 2.09 0.200 1.19 | 6.200 2.15 |12.200 21.25 | 18.20 2.09 0.267 1.25 | 6.267 2.27 |12.267 15.88 | 18.27 2.09 0.333 1.25 | 6.333 2.27 |12.333 15.88 | 18.33 2.09 0.400 1.25 | 6.400 2.27 |12.400 15.88 | 18.40 2.09 0.467 1.25 | 6.467 2.27 |12.467 10.87 | 18.47 1.97 0.533 1.25 | 6.533 2.27 |12.533 10.87 | 18.53 1.97 0.600 1.25 | 6.600 2.27 |12.600 10.87 | 18.60 1.97 0.667 1.25 | 6.667 2.27 |12.667 9.19 | 18.67 1.97 0.733 1.25 | 6.733 2.27 |12.733 9.19 | 18.73 1.97 0.800 1.25 | 6.800 2.27 |12.800 9.19 | 18.80 1.97 0.867 1.31 | 6.867 2.39 |12.867 7.88 | 18.87 1.85 0.933 1.31 | 6.933 2.39 |12.933 7.88 | 18.93 1.85 1.000 1.31 | 7.000 2.39 |13.000 7.88 | 19.00 1.85 1.067 1.31 | 7.067 2.39 |13.067 6.93 | 19.07 1.85 1.133 1.31 | 7.133 2.39 |13.133 6.93 | 19.13 1.85 1.200 1.31 | 7.200 2.39 |13.200 6.93 | 19.20 1.85 1.267 1.37 | 7.267 2.51 |13.267 6.33 | 19.27 1.79 1.333 1.37 | 7.333 2.51 |13.333 6.33 | 19.33 1.79 1.400 1.37 | 7.400 2.51 |13.400 6.33 | 19.40 1.79 1.467 1.37 | 7.467 2.51 |13.467 5.61 | 19.47 1.67 1.533 1.37 | 7.533 2.51 |13.533 5.61 | 19.53 1.67 1.600 1.37 | 7.600 2.51 |13.600 5.61 | 19.60 1.67 1.667 1.37 | 7.667 2.51 |13.667 5.13 | 19.67 1.61 1.733 1.37 | 7.733 2.51 |13.733 5.13 | 19.73 1.61 1.800 1.37 | 7.800 2.51 |13.800 5.13 | 19.80 1.61 1.867 1.43 | 7.867 2.63 |13.867 4.66 | 19.87 1.61 1.933 1.43 | 7.933 2.63 |13.933 4.66 | 19.93 1.61 2.000 1.43 | 8.000 2.63 |14.000 4.66 | 20.00 1.61 2.067 1.43 | 8.067 2.75 |14.067 4.36 | 20.07 1.55 2.133 1.43 | 8.133 2.75 |14.133 4.36 | 20.13 1.55 2.200 1.43 | 8.200 2.75 |14.200 4.36 | 20.20 1.55 2.267 1.49 | 8.267 2.98 |14.267 4.12 | 20.27 1.55 2.333 1.49 | 8.333 2.99 |14.333 4.12 | 20.33 1.55 2.400 1.49 | 8.400 2.99 |14.400 4.12 | 20.40 1.55 2.467 1.49 | 8.467 3.22 |14.467 4.00 | 20.47 1.49 2.533 1.49 | 8.533 3.22 |14.533 4.00 | 20.53 1.49 2.600 1.49 | 8.600 3.22 |14.600 4.00 | 20.60 1.49 2.667 1.49 | 8.667 3.46 |14.667 3.88 | 20.67 1.49 2.733 1.49 | 8.733 3.46 |14.733 3.88 | 20.73 1.49 2.800 1.49 | 8.800 3.46 |14.800 3.88 | 20.80 1.49 2.867 1.55 | 8.867 3.70 |14.867 3.64 | 20.87 1.49 2.933 1.55 | 8.933 3.70 |14.933 3.64 | 20.93 1.49 3.000 1.55 | 9.000 3.70 |15.000 3.64 | 21.00 1.49 3.067 1.55 | 9.067 3.82 |15.067 3.52 | 21.07 1.49 3.133 1.55 | 9.133 3.82 |15.133 3.52 | 21.13 1.49 3.200 1.55 | 9.200 3.82 |15.200 3.52 | 21.20 1.49 3.267 1.61 | 9.267 3.82 |15.267 3.28 | 21.27 1.49 3.333 1.61 | 9.333 3.82 |15.333 3.28 | 21.33 1.49 3.400 1.61 | 9.400 3.82 |15.400 3.28 | 21.40 1.49 3.467 1.61 | 9.467 3.88 |15.467 3.16 | 21.47 1.49 3.533 1.61 | 9.533 3.88 |15.533 3.16 | 21.53 1.49 3.600 1.61 | 9.600 3.88 |15.600 3.16 | 21.60 1.49 3.667 1.61 | 9.667 4.18 |15.667 3.04 | 21.67 1.43 3.733 1.61 | 9.733 4.18 |15.733 3.04 | 21.73 1.43 3.800 1.61 | 9.800 4.18 |15.800 3.04 | 21.80 1.43 3.867 1.67 | 9.867 4.60 |15.867 2.81 | 21.87 1.43 3.933 1.67 | 9.933 4.60 |15.933 2.81 | 21.93 1.43
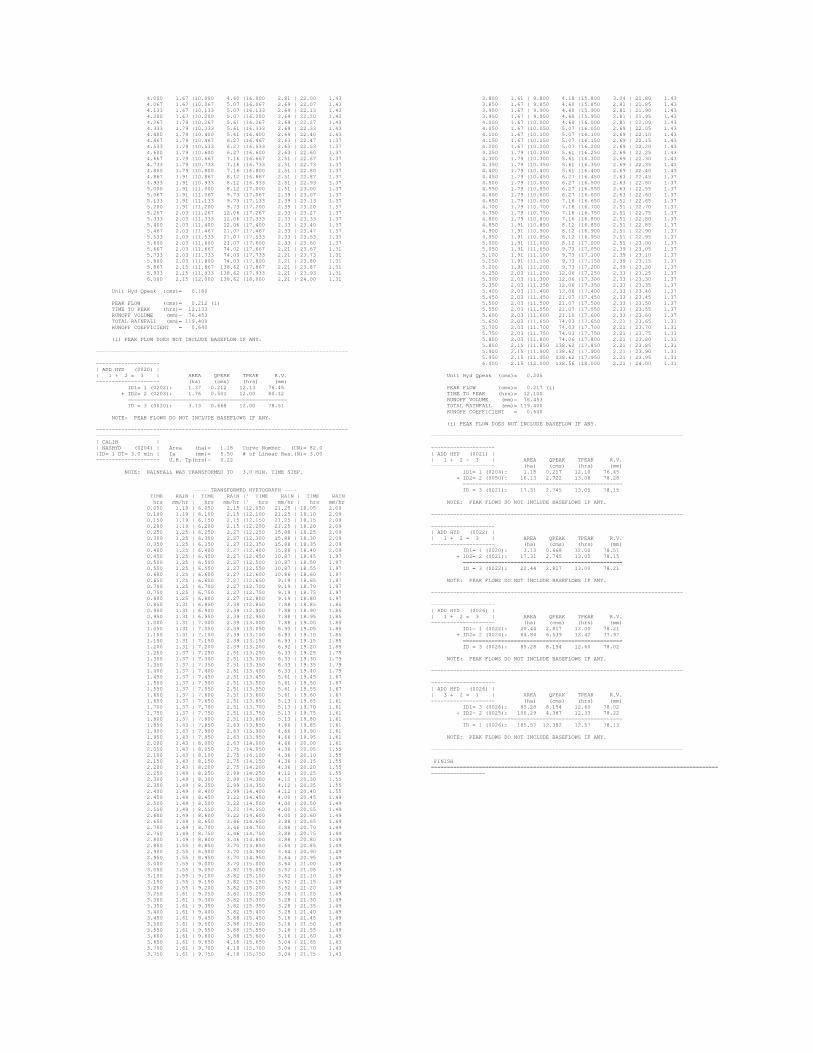
4.000 1.67 |10.000 4.60 |16.000 2.81 | 22.00 1.43 4.067 1.67 |10.067 5.07 |16.067 2.69 | 22.07 1.43 4.133 1.67 |10.133 5.07 |16.133 2.69 | 22.13 1.43 4.200 1.67 |10.200 5.07 |16.200 2.69 | 22.20 1.43 4.267 1.79 |10.267 5.61 |16.267 2.69 | 22.27 1.43 4.333 1.79 |10.333 5.61 |16.333 2.69 | 22.33 1.43 4.400 1.79 |10.400 5.61 |16.400 2.69 | 22.40 1.43 4.467 1.79 |10.467 6.27 |16.467 2.63 | 22.47 1.37 4.533 1.79 |10.533 6.27 |16.533 2.63 | 22.53 1.37 4.600 1.79 |10.600 6.27 |16.600 2.63 | 22.60 1.37 4.667 1.79 |10.667 7.16 |16.667 2.51 | 22.67 1.37 4.733 1.79 |10.733 7.16 |16.733 2.51 | 22.73 1.37 4.800 1.79 |10.800 7.16 |16.800 2.51 | 22.80 1.37 4.867 1.91 |10.867 8.12 |16.867 2.51 | 22.87 1.37 4.933 1.91 |10.933 8.12 |16.933 2.51 | 22.93 1.37 5.000 1.91 |11.000 8.12 |17.000 2.51 | 23.00 1.37 5.067 1.91 |11.067 9.73 |17.067 2.39 | 23.07 1.37 5.133 1.91 |11.133 9.73 |17.133 2.39 | 23.13 1.37 5.200 1.91 |11.200 9.73 |17.200 2.39 | 23.20 1.37 5.267 2.03 |11.267 12.06 |17.267 2.33 | 23.27 1.37 5.333 2.03 |11.333 12.06 |17.333 2.33 | 23.33 1.37 5.400 2.03 |11.400 12.06 |17.400 2.33 | 23.40 1.37 5.467 2.03 |11.467 21.07 |17.467 2.33 | 23.47 1.37 5.533 2.03 |11.533 21.07 |17.533 2.33 | 23.53 1.37 5.600 2.03 |11.600 21.07 |17.600 2.33 | 23.60 1.37 5.667 2.03 |11.667 74.02 |17.667 2.21 | 23.67 1.31 5.733 2.03 |11.733 74.03 |17.733 2.21 | 23.73 1.31 5.800 2.03 |11.800 74.03 |17.800 2.21 | 23.80 1.31 5.867 2.15 |11.867 138.62 |17.867 2.21 | 23.87 1.31 5.933 2.15 |11.933 138.62 |17.933 2.21 | 23.93 1.31 6.000 2.15 |12.000 138.62 |18.000 2.21 | 24.00 1.31 Unit Hyd Qpeak (cms)= 0.180 PEAK FLOW (cms)= 0.212 (i) TIME TO PEAK (hrs)= 12.133 RUNOFF VOLUME (mm)= 76.453 TOTAL RAINFALL (mm)= 119.400 RUNOFF COEFFICIENT = 0.640 (i) PEAK FLOW DOES NOT INCLUDE BASEFLOW IF ANY. ------------------------------------------------------------------------------- --------------------| ADD HYD (0020) || 1 + 2 = 3 | AREA QPEAK TPEAK R.V.-------------------- (ha) (cms) (hrs) (mm) ID1= 1 (0202): 1.37 0.212 12.13 76.45 + ID2= 2 (0203): 1.76 0.501 12.00 80.12 ================================================== ID = 3 (0020): 3.13 0.668 12.00 78.51 NOTE: PEAK FLOWS DO NOT INCLUDE BASEFLOWS IF ANY. ---------------------------------------------------------------------------------------------------| CALIB || NASHYD (0204) | Area (ha)= 1.18 Curve Number (CN)= 82.0|ID= 1 DT= 3.0 min | Ia (mm)= 5.50 # of Linear Res.(N)= 3.00-------------------- U.H. Tp(hrs)= 0.22 NOTE: RAINFALL WAS TRANSFORMED TO 3.0 MIN. TIME STEP.
---- TRANSFORMED HYETOGRAPH ---- TIME RAIN | TIME RAIN |' TIME RAIN | TIME RAIN hrs mm/hr | hrs mm/hr |' hrs mm/hr | hrs mm/hr 0.050 1.19 | 6.050 2.15 |12.050 21.25 | 18.05 2.09 0.100 1.19 | 6.100 2.15 |12.100 21.25 | 18.10 2.09 0.150 1.19 | 6.150 2.15 |12.150 21.25 | 18.15 2.09 0.200 1.19 | 6.200 2.15 |12.200 21.25 | 18.20 2.09 0.250 1.25 | 6.250 2.27 |12.250 15.88 | 18.25 2.09 0.300 1.25 | 6.300 2.27 |12.300 15.88 | 18.30 2.09 0.350 1.25 | 6.350 2.27 |12.350 15.88 | 18.35 2.09 0.400 1.25 | 6.400 2.27 |12.400 15.88 | 18.40 2.09 0.450 1.25 | 6.450 2.27 |12.450 10.87 | 18.45 1.97 0.500 1.25 | 6.500 2.27 |12.500 10.87 | 18.50 1.97 0.550 1.25 | 6.550 2.27 |12.550 10.87 | 18.55 1.97 0.600 1.25 | 6.600 2.27 |12.600 10.86 | 18.60 1.97 0.650 1.25 | 6.650 2.27 |12.650 9.19 | 18.65 1.97 0.700 1.25 | 6.700 2.27 |12.700 9.19 | 18.70 1.97 0.750 1.25 | 6.750 2.27 |12.750 9.19 | 18.75 1.97 0.800 1.25 | 6.800 2.27 |12.800 9.19 | 18.80 1.97 0.850 1.31 | 6.850 2.39 |12.850 7.88 | 18.85 1.85 0.900 1.31 | 6.900 2.39 |12.900 7.88 | 18.90 1.85 0.950 1.31 | 6.950 2.39 |12.950 7.88 | 18.95 1.85 1.000 1.31 | 7.000 2.39 |13.000 7.88 | 19.00 1.85 1.050 1.31 | 7.050 2.39 |13.050 6.93 | 19.05 1.85 1.100 1.31 | 7.100 2.39 |13.100 6.93 | 19.10 1.85 1.150 1.31 | 7.150 2.39 |13.150 6.93 | 19.15 1.85 1.200 1.31 | 7.200 2.39 |13.200 6.92 | 19.20 1.85 1.250 1.37 | 7.250 2.51 |13.250 6.33 | 19.25 1.79 1.300 1.37 | 7.300 2.51 |13.300 6.33 | 19.30 1.79 1.350 1.37 | 7.350 2.51 |13.350 6.33 | 19.35 1.79 1.400 1.37 | 7.400 2.51 |13.400 6.33 | 19.40 1.79 1.450 1.37 | 7.450 2.51 |13.450 5.61 | 19.45 1.67 1.500 1.37 | 7.500 2.51 |13.500 5.61 | 19.50 1.67 1.550 1.37 | 7.550 2.51 |13.550 5.61 | 19.55 1.67 1.600 1.37 | 7.600 2.51 |13.600 5.61 | 19.60 1.67 1.650 1.37 | 7.650 2.51 |13.650 5.13 | 19.65 1.61 1.700 1.37 | 7.700 2.51 |13.700 5.13 | 19.70 1.61 1.750 1.37 | 7.750 2.51 |13.750 5.13 | 19.75 1.61 1.800 1.37 | 7.800 2.51 |13.800 5.13 | 19.80 1.61 1.850 1.43 | 7.850 2.63 |13.850 4.66 | 19.85 1.61 1.900 1.43 | 7.900 2.63 |13.900 4.66 | 19.90 1.61 1.950 1.43 | 7.950 2.63 |13.950 4.66 | 19.95 1.61 2.000 1.43 | 8.000 2.63 |14.000 4.66 | 20.00 1.61 2.050 1.43 | 8.050 2.75 |14.050 4.36 | 20.05 1.55 2.100 1.43 | 8.100 2.75 |14.100 4.36 | 20.10 1.55 2.150 1.43 | 8.150 2.75 |14.150 4.36 | 20.15 1.55 2.200 1.43 | 8.200 2.75 |14.200 4.36 | 20.20 1.55 2.250 1.49 | 8.250 2.99 |14.250 4.12 | 20.25 1.55 2.300 1.49 | 8.300 2.99 |14.300 4.12 | 20.30 1.55 2.350 1.49 | 8.350 2.99 |14.350 4.12 | 20.35 1.55 2.400 1.49 | 8.400 2.99 |14.400 4.12 | 20.40 1.55 2.450 1.49 | 8.450 3.22 |14.450 4.00 | 20.45 1.49 2.500 1.49 | 8.500 3.22 |14.500 4.00 | 20.50 1.49 2.550 1.49 | 8.550 3.22 |14.550 4.00 | 20.55 1.49 2.600 1.49 | 8.600 3.22 |14.600 4.00 | 20.60 1.49 2.650 1.49 | 8.650 3.46 |14.650 3.88 | 20.65 1.49 2.700 1.49 | 8.700 3.46 |14.700 3.88 | 20.70 1.49 2.750 1.49 | 8.750 3.46 |14.750 3.88 | 20.75 1.49 2.800 1.49 | 8.800 3.46 |14.800 3.88 | 20.80 1.49 2.850 1.55 | 8.850 3.70 |14.850 3.64 | 20.85 1.49 2.900 1.55 | 8.900 3.70 |14.900 3.64 | 20.90 1.49 2.950 1.55 | 8.950 3.70 |14.950 3.64 | 20.95 1.49 3.000 1.55 | 9.000 3.70 |15.000 3.64 | 21.00 1.49 3.050 1.55 | 9.050 3.82 |15.050 3.52 | 21.05 1.49 3.100 1.55 | 9.100 3.82 |15.100 3.52 | 21.10 1.49 3.150 1.55 | 9.150 3.82 |15.150 3.52 | 21.15 1.49 3.200 1.55 | 9.200 3.82 |15.200 3.52 | 21.20 1.49 3.250 1.61 | 9.250 3.82 |15.250 3.28 | 21.25 1.49 3.300 1.61 | 9.300 3.82 |15.300 3.28 | 21.30 1.49 3.350 1.61 | 9.350 3.82 |15.350 3.28 | 21.35 1.49 3.400 1.61 | 9.400 3.82 |15.400 3.28 | 21.40 1.49 3.450 1.61 | 9.450 3.88 |15.450 3.16 | 21.45 1.49 3.500 1.61 | 9.500 3.88 |15.500 3.16 | 21.50 1.49 3.550 1.61 | 9.550 3.88 |15.550 3.16 | 21.55 1.49 3.600 1.61 | 9.600 3.88 |15.600 3.16 | 21.60 1.49 3.650 1.61 | 9.650 4.18 |15.650 3.04 | 21.65 1.43 3.700 1.61 | 9.700 4.18 |15.700 3.04 | 21.70 1.43 3.750 1.61 | 9.750 4.18 |15.750 3.04 | 21.75 1.43
3.800 1.61 | 9.800 4.18 |15.800 3.04 | 21.80 1.43 3.850 1.67 | 9.850 4.60 |15.850 2.81 | 21.85 1.43 3.900 1.67 | 9.900 4.60 |15.900 2.81 | 21.90 1.43 3.950 1.67 | 9.950 4.60 |15.950 2.81 | 21.95 1.43 4.000 1.67 |10.000 4.60 |16.000 2.81 | 22.00 1.43 4.050 1.67 |10.050 5.07 |16.050 2.69 | 22.05 1.43 4.100 1.67 |10.100 5.07 |16.100 2.69 | 22.10 1.43 4.150 1.67 |10.150 5.07 |16.150 2.69 | 22.15 1.43 4.200 1.67 |10.200 5.07 |16.200 2.69 | 22.20 1.43 4.250 1.79 |10.250 5.61 |16.250 2.69 | 22.25 1.43 4.300 1.79 |10.300 5.61 |16.300 2.69 | 22.30 1.43 4.350 1.79 |10.350 5.61 |16.350 2.69 | 22.35 1.43 4.400 1.79 |10.400 5.61 |16.400 2.69 | 22.40 1.43 4.450 1.79 |10.450 6.27 |16.450 2.63 | 22.45 1.37 4.500 1.79 |10.500 6.27 |16.500 2.63 | 22.50 1.37 4.550 1.79 |10.550 6.27 |16.550 2.63 | 22.55 1.37 4.600 1.79 |10.600 6.27 |16.600 2.63 | 22.60 1.37 4.650 1.79 |10.650 7.16 |16.650 2.51 | 22.65 1.37 4.700 1.79 |10.700 7.16 |16.700 2.51 | 22.70 1.37 4.750 1.79 |10.750 7.16 |16.750 2.51 | 22.75 1.37 4.800 1.79 |10.800 7.16 |16.800 2.51 | 22.80 1.37 4.850 1.91 |10.850 8.12 |16.850 2.51 | 22.85 1.37 4.900 1.91 |10.900 8.12 |16.900 2.51 | 22.90 1.37 4.950 1.91 |10.950 8.12 |16.950 2.51 | 22.95 1.37 5.000 1.91 |11.000 8.12 |17.000 2.51 | 23.00 1.37 5.050 1.91 |11.050 9.73 |17.050 2.39 | 23.05 1.37 5.100 1.91 |11.100 9.73 |17.100 2.39 | 23.10 1.37 5.150 1.91 |11.150 9.73 |17.150 2.39 | 23.15 1.37 5.200 1.91 |11.200 9.73 |17.200 2.39 | 23.20 1.37 5.250 2.03 |11.250 12.06 |17.250 2.33 | 23.25 1.37 5.300 2.03 |11.300 12.06 |17.300 2.33 | 23.30 1.37 5.350 2.03 |11.350 12.06 |17.350 2.33 | 23.35 1.37 5.400 2.03 |11.400 12.06 |17.400 2.33 | 23.40 1.37 5.450 2.03 |11.450 21.07 |17.450 2.33 | 23.45 1.37 5.500 2.03 |11.500 21.07 |17.500 2.33 | 23.50 1.37 5.550 2.03 |11.550 21.07 |17.550 2.33 | 23.55 1.37 5.600 2.03 |11.600 21.10 |17.600 2.33 | 23.60 1.37 5.650 2.03 |11.650 74.03 |17.650 2.21 | 23.65 1.31 5.700 2.03 |11.700 74.03 |17.700 2.21 | 23.70 1.31 5.750 2.03 |11.750 74.03 |17.750 2.21 | 23.75 1.31 5.800 2.03 |11.800 74.06 |17.800 2.21 | 23.80 1.31 5.850 2.15 |11.850 138.62 |17.850 2.21 | 23.85 1.31 5.900 2.15 |11.900 138.62 |17.900 2.21 | 23.90 1.31 5.950 2.15 |11.950 138.62 |17.950 2.21 | 23.95 1.31 6.000 2.15 |12.000 138.56 |18.000 2.21 | 24.00 1.31 Unit Hyd Qpeak (cms)= 0.205 PEAK FLOW (cms)= 0.217 (i) TIME TO PEAK (hrs)= 12.100 RUNOFF VOLUME (mm)= 76.453 TOTAL RAINFALL (mm)= 119.400 RUNOFF COEFFICIENT = 0.640 (i) PEAK FLOW DOES NOT INCLUDE BASEFLOW IF ANY. ------------------------------------------------------------------------------- --------------------| ADD HYD (0021) || 1 + 2 = 3 | AREA QPEAK TPEAK R.V.-------------------- (ha) (cms) (hrs) (mm) ID1= 1 (0204): 1.18 0.217 12.10 76.45 + ID2= 2 (0050): 16.13 2.722 13.08 78.28 ================================================== ID = 3 (0021): 17.31 2.745 13.05 78.15 NOTE: PEAK FLOWS DO NOT INCLUDE BASEFLOWS IF ANY. ------------------------------------------------------------------------------- --------------------| ADD HYD (0022) || 1 + 2 = 3 | AREA QPEAK TPEAK R.V.-------------------- (ha) (cms) (hrs) (mm) ID1= 1 (0020): 3.13 0.668 12.00 78.51 + ID2= 2 (0021): 17.31 2.745 13.05 78.15 ================================================== ID = 3 (0022): 20.44 2.817 13.00 78.21 NOTE: PEAK FLOWS DO NOT INCLUDE BASEFLOWS IF ANY. ------------------------------------------------------------------------------- --------------------| ADD HYD (0026) || 1 + 2 = 3 | AREA QPEAK TPEAK R.V.-------------------- (ha) (cms) (hrs) (mm) ID1= 1 (0022): 20.44 2.817 13.00 78.21 + ID2= 2 (0024): 64.84 6.539 12.42 77.97 ================================================== ID = 3 (0026): 85.28 8.154 12.60 78.02 NOTE: PEAK FLOWS DO NOT INCLUDE BASEFLOWS IF ANY. ------------------------------------------------------------------------------- --------------------| ADD HYD (0026) || 3 + 2 = 1 | AREA QPEAK TPEAK R.V.-------------------- (ha) (cms) (hrs) (mm) ID1= 3 (0026): 85.28 8.154 12.60 78.02 + ID2= 2 (0025): 100.29 4.387 12.33 78.22 ================================================== ID = 1 (0026): 185.57 12.382 12.57 78.13 NOTE: PEAK FLOWS DO NOT INCLUDE BASEFLOWS IF ANY. ------------------------------------------------------------------------------- FINISH===========================================================================================================

Appendix D
Hydraulic Calculations
Ap
pen
dix D
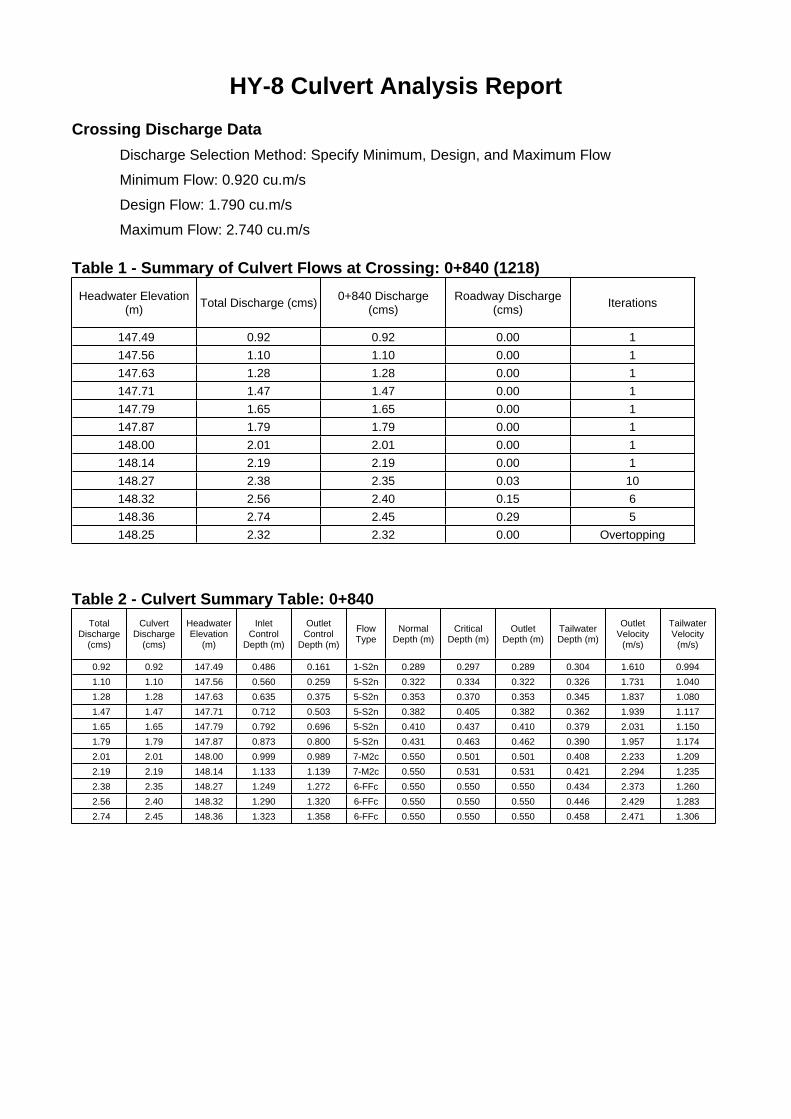
HY-8 Culvert Analysis ReportCrossing Discharge Data
Discharge Selection Method: Specify Minimum, Design, and Maximum Flow
Minimum Flow: 0.920 cu.m/s
Design Flow: 1.790 cu.m/s
Maximum Flow: 2.740 cu.m/s
Table 1 - Summary of Culvert Flows at Crossing: 0+840 (1218)
Table 2 - Culvert Summary Table: 0+840
Headwater Elevation (m)
Total Discharge (cms)0+840 Discharge
(cms)Roadway Discharge
(cms)Iterations
147.49 0.92 0.92 0.00 1
147.56 1.10 1.10 0.00 1
147.63 1.28 1.28 0.00 1
147.71 1.47 1.47 0.00 1
147.79 1.65 1.65 0.00 1
147.87 1.79 1.79 0.00 1
148.00 2.01 2.01 0.00 1
148.14 2.19 2.19 0.00 1
148.27 2.38 2.35 0.03 10
148.32 2.56 2.40 0.15 6
148.36 2.74 2.45 0.29 5
148.25 2.32 2.32 0.00 Overtopping
Total Discharge
(cms)
Culvert Discharge
(cms)
Headwater Elevation
(m)
Inlet Control
Depth (m)
Outlet Control
Depth (m)
Flow Type
Normal Depth (m)
Critical Depth (m)
Outlet Depth (m)
Tailwater Depth (m)
Outlet Velocity
(m/s)
Tailwater Velocity
(m/s)
0.92 0.92 147.49 0.486 0.161 1-S2n 0.289 0.297 0.289 0.304 1.610 0.994
1.10 1.10 147.56 0.560 0.259 5-S2n 0.322 0.334 0.322 0.326 1.731 1.040
1.28 1.28 147.63 0.635 0.375 5-S2n 0.353 0.370 0.353 0.345 1.837 1.080
1.47 1.47 147.71 0.712 0.503 5-S2n 0.382 0.405 0.382 0.362 1.939 1.117
1.65 1.65 147.79 0.792 0.696 5-S2n 0.410 0.437 0.410 0.379 2.031 1.150
1.79 1.79 147.87 0.873 0.800 5-S2n 0.431 0.463 0.462 0.390 1.957 1.174
2.01 2.01 148.00 0.999 0.989 7-M2c 0.550 0.501 0.501 0.408 2.233 1.209
2.19 2.19 148.14 1.133 1.139 7-M2c 0.550 0.531 0.531 0.421 2.294 1.235
2.38 2.35 148.27 1.249 1.272 6-FFc 0.550 0.550 0.550 0.434 2.373 1.260
2.56 2.40 148.32 1.290 1.320 6-FFc 0.550 0.550 0.550 0.446 2.429 1.283
2.74 2.45 148.36 1.323 1.358 6-FFc 0.550 0.550 0.550 0.458 2.471 1.306
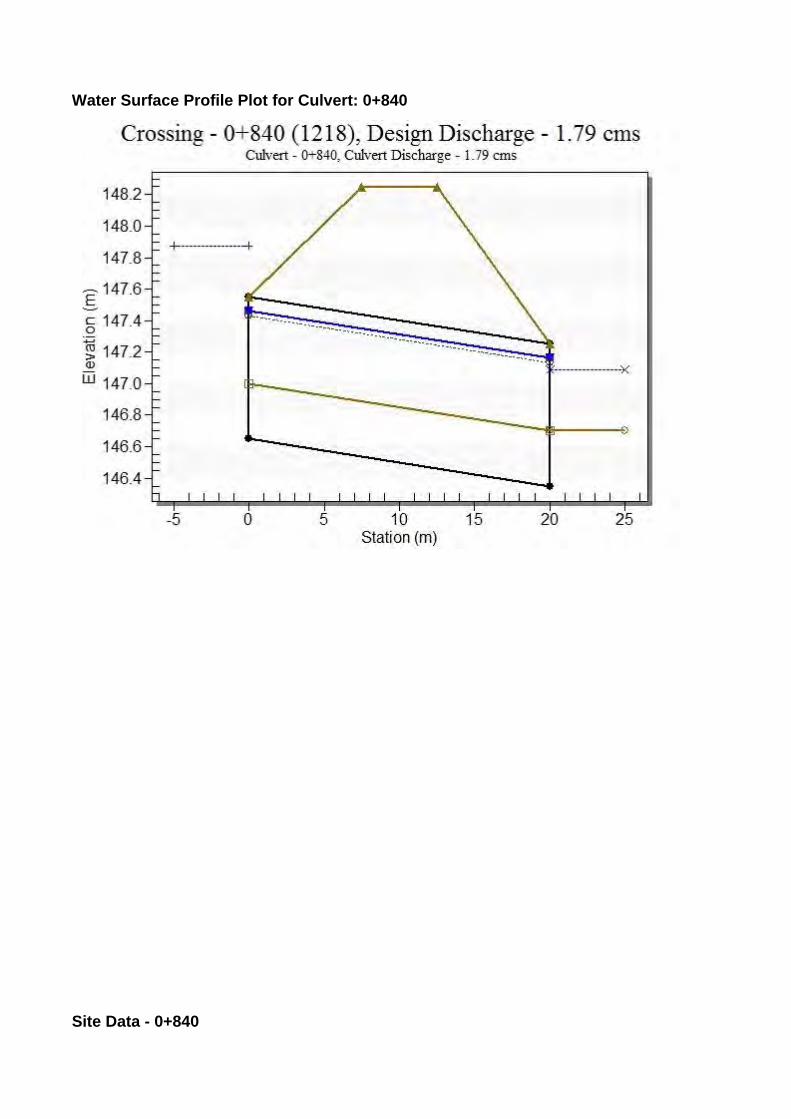
Water Surface Profile Plot for Culvert: 0+840
Site Data - 0+840

Site Data Option: Culvert Invert DataInlet Station: 0.00 mInlet Elevation: 146.65 mOutlet Station: 20.00 mOutlet Elevation: 146.35 mNumber of Barrels: 1
Culvert Data Summary - 0+840Barrel Shape: Concrete BoxBarrel Span: 1800.00 mmBarrel Rise: 900.00 mmBarrel Material: ConcreteEmbedment: 350.00 mmBarrel Manning's n: 0.0130 (top and sides)Manning's n: 0.0350 (bottom)Culvert Type: StraightInlet Configuration: Thin Edge ProjectingInlet Depression: NONE

Tailwater Channel Data - 0+840 (1218)Tailwater Channel Option: Triangular ChannelSide Slope (H:V): 10.00 (_:1)Channel Slope: 0.0150Channel Manning's n: 0.0350Channel Invert Elevation: 146.70 m
Roadway Data for Crossing: 0+840 (1218)Roadway Profile Shape: Constant Roadway ElevationCrest Length: 5.00 mCrest Elevation: 148.25 mRoadway Surface: PavedRoadway Top Width: 5.00 m

Appendix E
CVC/TRCA Low Impact Development Planning and Design Guide – Bioretention Fact Sheet
Ap
pen
dix E

GENERAL DESCRIPTION
DESIGN GUIDANCE
SITE CONSIDERATIONS
ABILITY TO MEET SWM OBJECTIVES
CONSTRUCTION CONSIDERATIONS
BIO
RE
TE
NT
IO
N
As a stormwater filter and infiltration practice, bioretention temporarily stores, treats and
infiltrates runoff. Depending on native soil infiltration rate and physical constraints, the
system may be designed without an underdrain for full infiltration, with an underdrain
for partial infiltration, or with an impermeable liner and underdrain for filtration only (i.e.,
a biofilter). The primary component of the practice is the filter bed which is a mixture of sand, fines and organic material. Other elements include a mulch ground cover and
plants adapted to the conditions of a stormwater practice. Bioretention is designed to
capture small storm events or the water quality storage requirement. An overflow or
bypass is necessary to pass large storm event flows. Bioretention can be adapted to fit into many different development contexts and provide a convenient area for snow stor-
age and treatment.
SOIL CHARACTERISTICSBioretention can be constructed over any soil type, but hydrologic soil group A and
B are best for achieving water balance goals. If possible, bioretention should be
sited in the areas of the development with the highest native soil infiltration rates. Bioretention in soils with infiltration rates less than 15 mm/hr will require an underd-rain. Designers should verify the native soil infiltration rate at the proposed location
and depth through measurement of hydraulic conductivity under field saturated conditions.
Ideally, bioretention sites should remain outside the limit of disturbance until construction of
the bioretention begins to prevent soil compaction by heavy equipment. Locations should not
be used as sediment basins during construction, as the concentration of fines will prevent
post-construction infiltration. To prevent sediment from clogging the surface of a bioretention
cell, stormwater should be diverted away from the bioretention until the drainage area is fully
stabilized.
For further guidance regarding key steps during construction, see the CVC/TRCA LID SWM
Planning and Design Guide, Section 4.5.2 – Construction Considerations)
CONVEYANCE AND OVERFLOWBioretention can be designed to be inline or offline from the drainage system. In-
line bioretention accepts all flow from a drainage area and conveys larger event
flows through an overflow outlet. Overflow structures must be sized to safely convey
larger storm events out of the facility. The invert of the overflow should be placed
at the maximum water surface elevation of the bioretention area, which is typically
150-250 mm above the filter bed surface.
Offline bioretention practices use flow splitters or bypass channels that only allow the
required water quality storage volume to enter the facility. This may be achieved with
a pipe, weir, or curb opening sized for the target flow, but in conjunction, create a by-
pass channel so that higher flows do not pass over the surface of the filter bed. Using
a weir or curb opening minimizes clogging and reduces maintenance frequency.
Material Specification Quantity
Filter Media
Composition
Filter Media Soil Mixture to contain:
85 to 88% sand
8 to 12% soil fines
3 to 5% organic matter (leaf compost)Other Criteria:
Phosphorus soil test index (P-Index) value
between 10 to 30 ppmCationic exchange capacity (CEC) greater
than 10 meq/100 g
Free of stones, stumps, roots and other
large debris
pH between 5.5 to 7.5Infiltration rate greater than 25 mm/hr
•
•
•
•
•
•
••
Recommended depth is
between 1.0 and 1.25
metres.
Mulch Layer Shredded hardwood bark mulch A 75 mm layer on the
surface of the filter bed
Geotextile Material specifications should conform to On-
tario Provincial Standard Specification (OPSS)
1860 for Class II geotextile fabrics.
Should be woven monofilament or non-woven
needle punched fabrics. Woven slit film and
non-woven heat bonded fabrics should not be
used as they are prone to clogging.
For further guidance see CVC/TRCA LID
SWM Planning and Design Guide, Table
4.5.5.
Strip over the perforated
pipe underdrain (if pres-
ent) between the filter me-
dia bed and gravel storage
layer (stone reservoir)
Gravel Washed 50 mm diameter clear stone should
be used to surround the underdrain and for the
gravel storage layer
Washed 3 to 10 mm diameter clear stone
should be used for pea gravel choking layer.
Volume based on dimen-
sions, assuming a void
space ratio of 0.4.
Underdrain Perforated HDPE or equivalent, minimum 100
mm diameter, 200 mm recommended.
Perforated pipe for
length of cell.
Non-perforated pipe as
needed to connect with
storm drain system.One or more caps.
T’s for underdrain con-
figuration
•
•
•
•GRAVEL STORAGE LAYER DEPTH: Should be a minimum of 300 mm deep and sized to provide the required
storage volume. Granular material should be 50 mm diameter clear stone.
PEA GRAVEL CHOKING LAYER: A 100 mm deep layer of pea gravel (3 to 10
mm diameter clear stone) should be placed on top of the coarse gravel storage
layer as a choking layer separating it from the overlying filter media bed.
•
•
GEOMETRY & SITE LAYOUT Key geometry and site layout factors include:
The minimum footprint of the filter bed area is based on the drainage area. Typical drainage areas to bioretention are between 100 m2 to 0.5 hectares.
The maximum recommended drainage area is 0.8 hectares. Typical ratios of impervious drainage area to treatment facility area range from 5:1 to 15:1.
Bioretention can be configured to fit into many locations and shapes. However,
cells that are narrow may concentrate flow as it spreads throughout the cell and
result in erosion.
The filter bed surface should be level to encourage stormwater to spread out
evenly over the surface.
•
•
•
BMP Water Balance Benefit
Water Quality Improvement
Stream Channel Ero-
sion Control Benefits
Bioretention with no underdrain
Yes Yes – size for water quality storage requirement
Partial – based on available storage volume and infiltration rates
Bioretention with underdrain
Partial – based on available storage volume beneath the underdrain and soil infiltration rate
Yes – size for water quality storage requirement
Partial – based on available storage volume beneath the underdrain and soil infiltration rate
Bioretention with underdrain and impermeable liner
Partial – some volume reduction through evapo-transpiration
Yes – size for water quality storage requirement
Partial – some volume reduction through evapotranspiration
Water Table A minimum of one (1) metre separating the seasonally high water table or top of bedrock elevation and the bottom of the practice is necessary.
Site TopographyContributing slopes should be between 1 to 5%. The surface of the filter bed should be flat to allow flow to spread out. A stepped multi-cell design can also be used.
Drainage Area & Runoff Volume
Typical contributing drainage areas are be-tween 100 m2 to 0.5 hectares. The maxi-mum recommended contributing drainage area is 0.8 hectares. Typical ratios of imper-vious drainage area to treatment facility area range from 5:1 to 15:1.
Soils Bioretention can be located over any soil type, but hydrologic soil group A and B soils are best for achieving water balance benefits. Facilities should be located in portions of the site with the highest native soil infiltration rates. Where infiltration rates are less than 15 mm/hr (hydraulic conductivity less than 1x10⁻⁶ cm/s) an underdrain is required. Na-tive soil infiltration rate at the proposed facil-ity location and depth should be confirmed through measurement of hydraulic conductiv-ity under field saturated conditions.
Wellhead ProtectionFacilities receiving road or parking lot runoff should not be located within two (2) year time-of-travel wellhead protection areas.
UProximity to Underground Utilities Designers should consult local utility de-sign guidance for the horizontal and vertical clearances required between storm drains, ditches, and surface water bodies.
Overhead Wires Check whether the future tree canopy height in the bioretention area will interfere with ex-isting overhead phone and power lines.
Available SpaceReserve open areas of about 10 to 20% of the size of the contributing drainage area.
Pollution Hot Spot RunoffTo protect groundwater from possible con-tamination, runoff from pollution hot spots should not be treated by bioretention facili-ties designed for full or partial infiltration. Fa-cilities designed with an impermeable liner (filtration only facilities) can be used to treat runoff from pollution hot spots.
FOR FURTHER DETAILS SEE SECTION 4.5 OF THE CVC/TRCA LID SWM GUIDE
CV
C/T
RC
A L
OW
IM
PA
CT
DE
VE
LO
PM
EN
T
PL
AN
NIN
G A
ND
DE
SIG
N G
UID
E -
FA
CT
SH
EE
T
PRE-TREATMENT Pretreatment prevents premature clogging by capturing coarse sediment particles
before they reach the filter bed. Where the runoff source area produces little sedi-
ment, such as roofs, bioretention can function effectively without pretreatment. To
treat parking area or road runoff, a two-cell design that incorporates a forebay
is recommended. Pretreatment practices that may be feasible, depending on the
method of conveyance and the availability of space include: Two-cell design (channel flow): Forebay ponding volume should account for
25% of the water quality storage requirement and be designed with a 2:1 length
to width ratio.Vegetated filter strip (sheet flow): Should be a minimum of three (3) metres in
width. If smaller strips are used, more frequent maintenance of the filter bed can
be anticipated.Gravel diaphragm (sheet flow): A small trench filled with pea gravel, which is
perpendicular to the flow path between the edge of the pavement and the bio-
retention practice will promote settling out of sediment and maintain sheet flow
into the facility. A drop of 50-150 mm into the gravel diaphragm can be used to
dissipate energy and promote settling.
Rip rap and/or dense vegetation (channel flow): Suitable for small bioreten-tion cells with drainage areas less than 100 square metres.
•
•
•
•
Available HeadIf an underdrain is used, then 1 to 1.5 metres elevation difference is needed between the inflow point and the downstream storm drain invert.
Setback from BuildingsIf an impermeable liner is used, no setback is needed. If not, a four (4) metre setback from building foundations should be applied.
Source: Wisconsin Department of Natural Resources
MONITORING WELLSA capped vertical stand pipe consisting of an anchored 100 to 150 mm diameter
perforated pipe with a lockable cap installed to the bottom of the facility is recom-
mended for monitoring drainage time between storms.
GENERAL SPECIFICATIONS
OPERATION AND MAINTENANCE
Bioretention requires routine inspection and maintenance of the landscaping as well as periodic
inspection for less frequent maintenance needs or remedial maintenance. Generally, routine main-
tenance will be the same as for any other landscaped area; weeding, pruning, and litter removal.
Regular watering may be required during the first two years until vegetation is established.
For the first two years following construction the facility should be inspected at least quarterly and
after every major storm event (> 25 mm). Subsequently, inspections should be conducted in the
spring and fall of each year and after major storm events. Inspect for vegetation density (at least
80% coverage), damage by foot or vehicular traffic, channelization, accumulation of debris, trash
and sediment, and structural damage to pretreatment devices.
Trash and debris should be removed from pretreatment devices, the bioretention area surface and
inlet and outlets at least twice annually. Other maintenance activities include reapplying mulch,
pruning, weeding replacing dead vegetation and repairing eroded areas as needed. Remove ac-
cumulated sediment on the bioretention area surface when dry and exceeding 25 mm depth.
FILTER MEDIACOMPOSITION: To ensure a consistent and homogeneous bed, filter media
should come pre-mixed from an approved vendor.
DEPTH: Recommended depth is between 1.0 and 1.25 m. However in con-
strained applications, pollutant removal benefits may be achieved in beds as
shallow as 500 mm. If trees are to be included in the design, bed depth must be
at least 1.0 m.
MULCH: A 75 mm layer of mulch on the surface of the filter bed enhances
plant survival, suppresses weed growth and pretreats runoff before it reaches
the filter bed.
•
•
•
UNDERDRAINOnly needed where native soil infiltration rate is less than 15 mm/hr (hydraulic
conductivity of less than 1x10⁻⁶ cm/s).
Should consist of a perforated pipe embedded in the coarse gravel storage layer
at least 100 mm above the bottom.
A strip of geotextile filter fabric placed between the filter media and pea gravel
choking layer over the perforated pipe is optional to help prevent fine soil particles
from entering the underdrain.
A vertical standpipe connected to the underdrain can be used as a cleanout and
monitoring well.
•
•
•
•
Source: Minnesota Businesses for Clean Water
Source: City of Portland
Source: City of Portland
Ap
pen
dix F
Appendix F
Flood Control Calculations

R.J. Burnside & Associates Limited 6990 Creditview Road, Unit 2 Mississauga ON L5N 8R9 CANADA telephone (905) 821-1800 fax (905) 821-1809 web www.rjburnside.com
Technical Memorandum
Date: January 17, 2018 Project No.: 300039474.0000
Project Name: Sheridan Park Drive Extension Municipal Class Environmental Assessment Flood Control Calculations
Client Name: City of Mississauga
Submitted By: Harold Faulkner, P.Eng.
Introduction
As noted in Section 3.0, Table 3-1, of the Credit Valley Conservation Stormwater Management Criteria (August 2012), the Flood Control criteria for new development in the Sheridan Creek watershed, is to control the 1:100-year post-development peak flow rate to the 1:2-year pre-development peak flow. To address this criteria for the proposed extension of Sheridan Park Drive, the Modified Rational Method was used to determine the maximum required storage volume. The proposed land-use changes are limited to an 850 m length of the road right-of-way (ROW). Over this length, the ROW width is approximately 35 m; therefore, the 29,750 m2 (850 m x 35 m) drainage area will form the basis for comparing pre and post-development flows. 1:2-year Pre-Development Peak Flow The pre-development condition represents the existing, vegetated state. The Rational Method was used to determine the 1:2-year pre-development target peak flow rate as follows:
Area = 29,750 m2 Runoff coefficient = 0.25 (existing vegetated condition) Rainfall intensity = 59.89 mm/hr (15-minute time of concentration)
Q = CIA/360 Q2 = 0.25 x 59.89 x 29,750/360 Q2 = 123.7 L/s
1:100-year Post-Development Peak Flow and Required Storage The post-development condition includes the extended roadway. The table below provides the calculations for the proposed ROW runoff coefficient. These areas are based on the average
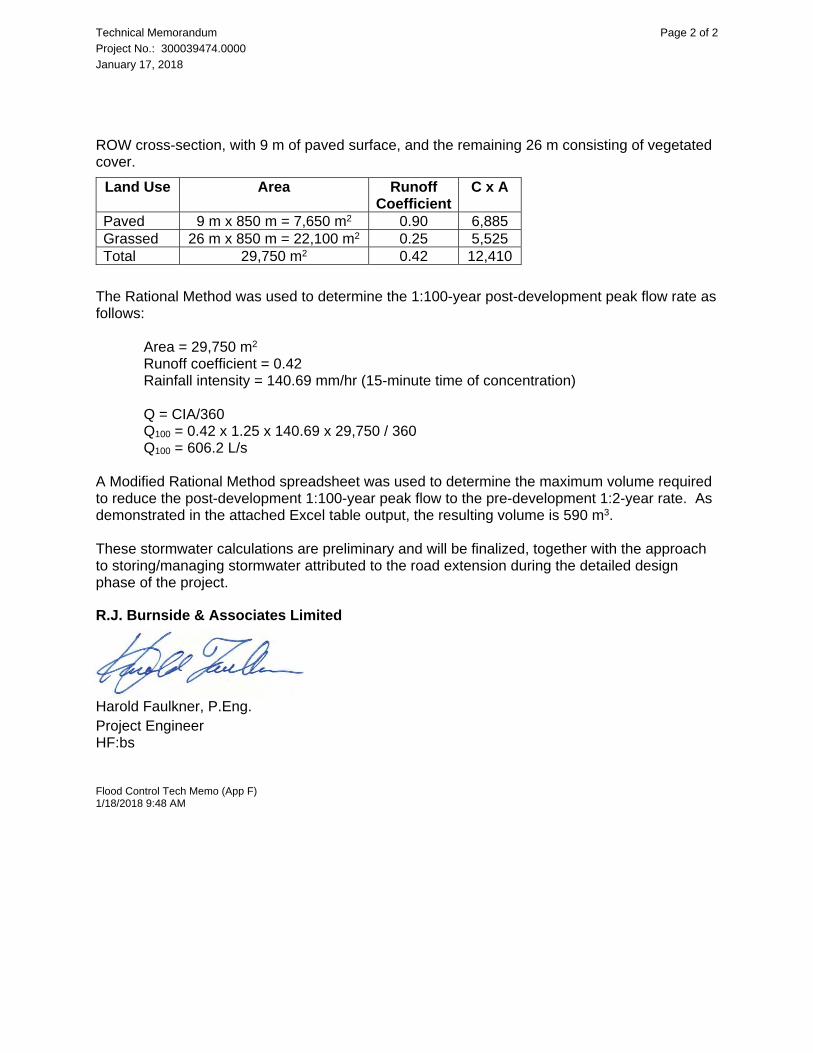
Technical Memorandum Page 2 of 2
Project No.: 300039474.0000
January 17, 2018
ROW cross-section, with 9 m of paved surface, and the remaining 26 m consisting of vegetated cover.
The Rational Method was used to determine the 1:100-year post-development peak flow rate as follows:
Area = 29,750 m2 Runoff coefficient = 0.42 Rainfall intensity = 140.69 mm/hr (15-minute time of concentration)
Q = CIA/360 Q100 = 0.42 x 1.25 x 140.69 x 29,750 / 360 Q100 = 606.2 L/s
A Modified Rational Method spreadsheet was used to determine the maximum volume required to reduce the post-development 1:100-year peak flow to the pre-development 1:2-year rate. As demonstrated in the attached Excel table output, the resulting volume is 590 m3. These stormwater calculations are preliminary and will be finalized, together with the approach to storing/managing stormwater attributed to the road extension during the detailed design phase of the project.
R.J. Burnside & Associates Limited
Harold Faulkner, P.Eng. Project Engineer HF:bs Flood Control Tech Memo (App F) 1/18/2018 9:48 AM
Land Use Area Runoff Coefficient
C x A
Paved 9 m x 850 m = 7,650 m2 0.90 6,885 Grassed 26 m x 850 m = 22,100 m2 0.25 5,525 Total 29,750 m2 0.42 12,410

MODIFIED RATIONAL METHOD - REQUIRED STORAGE VOLUME
Project: Sheridan Park Drive Extension EA 1:100-year Post Development to 1:2-year Pre-Development By: H.Faulkner Project No: 300039474 Date: 17-Jan-18
100-Year Catchment Area 29,750 m2
Time Intensity Inflow Outflow Storage Time of Concentration 15 minutes(min) (mm/hr) (L/s) (L/s) (m3) Time Step 2 minutes
15 141 606.2 123.73 434.25 Post-Development Runoff Coefficient 0.4217 131 562.6 123.73 455.0719 122 525.5 123.73 472.90 Q = CIA/36021 115 493.6 123.73 488.30 I = A/(T+B)c
23 108 465.8 123.73 501.72 Storage = Qin x T - Qout x [(Tc + T) / 2]25 102 441.3 123.73 513.4627 97 419.6 123.73 523.78 Proposed Target Initial29 93 400.1 123.73 532.89 Storm Return Runoff Discharge Time31 89 382.6 123.73 540.93 Period (years) A B C Coefficient (L/s) (min)33 85 366.8 123.73 548.06 100 1450.0 4.900 0.780 0.52 123.73 1535 82 352.4 123.73 554.3637 79 339.2 123.73 559.9439 76 327.1 123.73 564.8741 73 315.9 123.73 569.2243 71 305.6 123.73 573.0345 69 296.0 123.73 576.3747 67 287.0 123.73 579.2749 65 278.7 123.73 581.7651 63 270.9 123.73 583.8853 61 263.5 123.73 585.6755 60 256.7 123.73 587.1457 58 250.2 123.73 588.3159 57 244.0 123.73 589.2161 55 238.2 123.73 589.8663 54 232.7 123.73 590.2665 53 227.5 123.73 590.4567 52 222.6 123.73 590.4269 51 217.9 123.73 590.1971 50 213.4 123.73 589.7873 49 209.1 123.73 589.20 Required storage to attain target discharge rate is equal to the area above the "storage" line.75 48 205.0 123.73 588.44 Trapezoid Area 887,401 L/s * s77 47 201.1 123.73 587.53 Triangle Area 296,955 L/s * s79 46 197.3 123.73 586.4781 45 193.7 123.73 585.26 Trapezoid - Triangle 590.45 m3
83 44 190.3 123.73 583.9285 43 187.0 123.73 582.4587 43 183.8 123.73 580.85 Source: ASCE Manuals and Reports on Engineering Practice No. 28, Hydrology Handbook, Second Edition, Copyright 1996, ISBN 0-7844-0138-2
0
123.73
Required Storage
90807060504030201000.0
50.0
100.0
150.0
200.0
250.0
Time (minutes)
Disc
harg
e (L
/s)
Hydrograph
Storage

Plan C
Drainage Management Plans
Plan
C