Embed Size (px)
Citation preview
May 2013 NGSS Release Page 1 of 37
APPENDIX L – Connections to the Common Core State Standards for Mathematics1
Consistency with the Common Core State Standards for Mathematics (CCSSM)
Science is a quantitative discipline, so it is important for educators to ensure that students’
science learning coheres well with their learning in mathematics.2,3
To achieve this alignment,
the NGSS development team worked with the CCSSM writing team to ensure the NGSS do not
outpace or otherwise misalign to the grade-by-grade standards in the CCSSM. Every effort has
been made to ensure consistency. It is essential that the NGSS always be interpreted, and
implemented, in such a way that the math does not outpace or misalign to the grade-by-grade
standards in the CCSSM (this includes the development of NGSS-aligned instructional materials
and assessments).
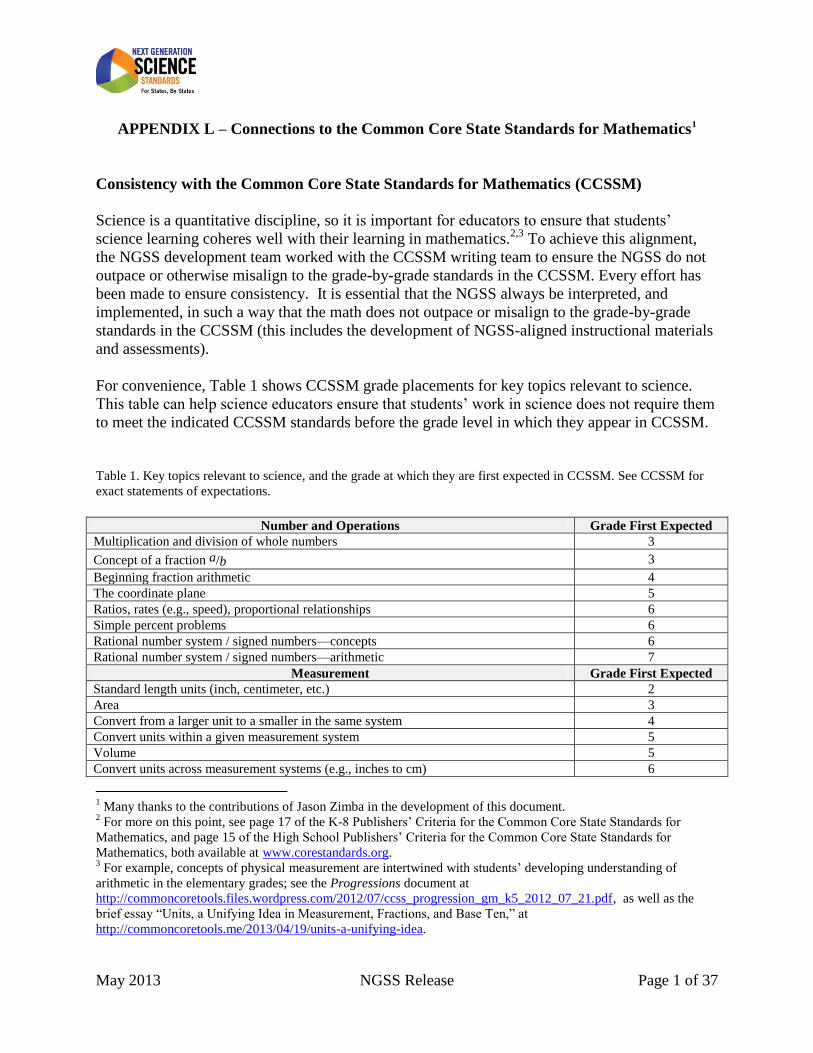
For convenience, Table 1 shows CCSSM grade placements for key topics relevant to science.
This table can help science educators ensure that students’ work in science does not require them
to meet the indicated CCSSM standards before the grade level in which they appear in CCSSM.
Table 1. Key topics relevant to science, and the grade at which they are first expected in CCSSM. See CCSSM for
exact statements of expectations.
Number and Operations Grade First Expected
Multiplication and division of whole numbers 3
Concept of a fraction a/b 3
Beginning fraction arithmetic 4
The coordinate plane 5
Ratios, rates (e.g., speed), proportional relationships 6
Simple percent problems 6
Rational number system / signed numbers—concepts 6
Rational number system / signed numbers—arithmetic 7
Measurement Grade First Expected
Standard length units (inch, centimeter, etc.) 2
Area 3
Convert from a larger unit to a smaller in the same system 4
Convert units within a given measurement system 5
Volume 5
Convert units across measurement systems (e.g., inches to cm) 6
1 Many thanks to the contributions of Jason Zimba in the development of this document.
2 For more on this point, see page 17 of the K-8 Publishers’ Criteria for the Common Core State Standards for
Mathematics, and page 15 of the High School Publishers’ Criteria for the Common Core State Standards for
Mathematics, both available at www.corestandards.org. 3 For example, concepts of physical measurement are intertwined with students’ developing understanding of
arithmetic in the elementary grades; see the Progressions document at
http://commoncoretools.files.wordpress.com/2012/07/ccss_progression_gm_k5_2012_07_21.pdf, as well as the
brief essay “Units, a Unifying Idea in Measurement, Fractions, and Base Ten,” at
http://commoncoretools.me/2013/04/19/units-a-unifying-idea.
May 2013 NGSS Release Page 2 of 37
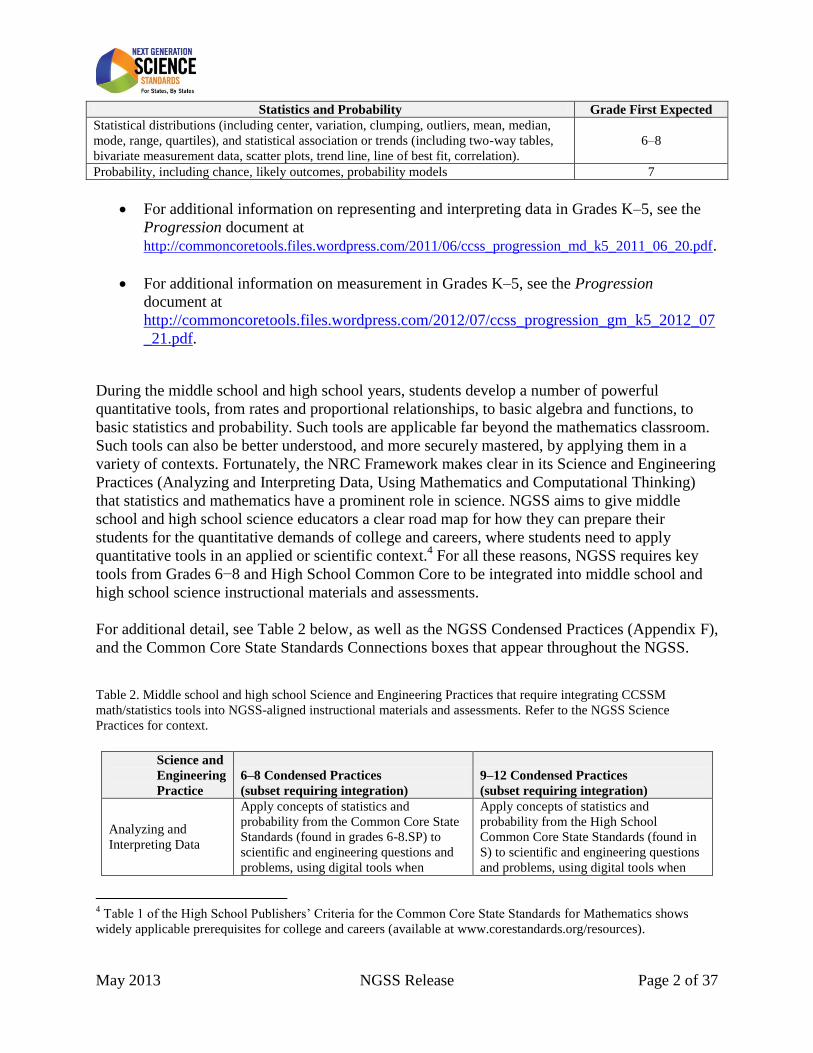
Statistics and Probability Grade First Expected
Statistical distributions (including center, variation, clumping, outliers, mean, median,
mode, range, quartiles), and statistical association or trends (including two-way tables,
bivariate measurement data, scatter plots, trend line, line of best fit, correlation).
6–8
Probability, including chance, likely outcomes, probability models 7
For additional information on representing and interpreting data in Grades K–5, see the
Progression document at
http://commoncoretools.files.wordpress.com/2011/06/ccss_progression_md_k5_2011_06_20.pdf.
For additional information on measurement in Grades K–5, see the Progression
document at
http://commoncoretools.files.wordpress.com/2012/07/ccss_progression_gm_k5_2012_07
_21.pdf.
During the middle school and high school years, students develop a number of powerful
quantitative tools, from rates and proportional relationships, to basic algebra and functions, to
basic statistics and probability. Such tools are applicable far beyond the mathematics classroom.
Such tools can also be better understood, and more securely mastered, by applying them in a
variety of contexts. Fortunately, the NRC Framework makes clear in its Science and Engineering
Practices (Analyzing and Interpreting Data, Using Mathematics and Computational Thinking)
that statistics and mathematics have a prominent role in science. NGSS aims to give middle
school and high school science educators a clear road map for how they can prepare their
students for the quantitative demands of college and careers, where students need to apply
quantitative tools in an applied or scientific context.4 For all these reasons, NGSS requires key
tools from Grades 6−8 and High School Common Core to be integrated into middle school and
high school science instructional materials and assessments.
For additional detail, see Table 2 below, as well as the NGSS Condensed Practices (Appendix F),
and the Common Core State Standards Connections boxes that appear throughout the NGSS.
Table 2. Middle school and high school Science and Engineering Practices that require integrating CCSSM
math/statistics tools into NGSS-aligned instructional materials and assessments. Refer to the NGSS Science
Practices for context.
Science and
Engineering
Practice
6–8 Condensed Practices
(subset requiring integration)
9–12 Condensed Practices
(subset requiring integration)
Analyzing and
Interpreting Data
Apply concepts of statistics and
probability from the Common Core State
Standards (found in grades 6-8.SP) to
scientific and engineering questions and
problems, using digital tools when
Apply concepts of statistics and
probability from the High School
Common Core State Standards (found in
S) to scientific and engineering questions
and problems, using digital tools when
4 Table 1 of the High School Publishers’ Criteria for the Common Core State Standards for Mathematics shows
widely applicable prerequisites for college and careers (available at www.corestandards.org/resources).
May 2013 NGSS Release Page 3 of 37
feasible. feasible.
Using Mathematics
and Computational
Thinking
Apply concepts of ratio, rate, percent,
basic operations, and simple algebra to
scientific and engineering questions and
problems. (See 6-7.RP, 6-8.NS, and 6-
8.EE in the Common Core State
Standards.)
Apply techniques of algebra and
functions to represent and solve scientific
and engineering problems. (See A and F
in the Common Core State Standards.)
Apply key takeaways from grades 6–8
mathematics, such as applying ratios,
rates, percentages and unit conversions,
e.g., in the context of complicated
measurement problems involving
quantities with derived or compound units
(such as mg/mL, kg/m3, acre-feet, etc.).
5
Connections to CCSSM Standards for Mathematical Practice
Some general connections to the Common Core State Standards for Mathematics can be found
among CCSSM’s Standards for Mathematical Practice. The three CCSSM practice standards
most directly relevant to science are:
MP.2. Reason abstractly and quantitatively.
MP.4. Model with mathematics.
MP.5. Use appropriate tools strategically.
Mathematical practice standards MP.2 and MP.4 are both about using mathematics in context.
The first of these, MP.2, is about the back-and-forth between (1) manipulating symbols
abstractly and (2) attending to the meaning of those symbols while doing so. For example, a
kindergarten student might connect a symbolic statement like “6 > 4” to the fact that there are
more objects in one given set than in another. A middle school student might rewrite the
equation d = 65t for the motion of a car in the equivalent form d/t = 65, recognizing that the new
equation abstractly expresses the steps in a computation of the car’s speed. A high school student
might connect the 2 in the equation N = 2n to the fact that each dividing cell gives rise to 2
daughter cells.
The second standard, MP.4, is also about applying mathematics, but with more of a focus on
results, and less of a focus on the mental processes involved:
In grades K–2, modeling with mathematics typically means diagramming a situation
mathematically, and/or solving a one-step addition/subtraction word problem.
In grades 3–5, modeling with mathematics typically means representing and/or solving a
one-step or multi-step word problem.
5 See Table 1 of the High School Publishers’ Criteria for the Common Core State Standards for Mathematics
(rightmost column), available on www.corestandards.org/resources.
May 2013 NGSS Release Page 4 of 37
In grades 6–8, modeling with mathematics typically means representing and/or solving a
one-step or multi-step word problem, possibly one in which certain assumptions
necessary to formulate the problem mathematically are not specified for the student.
In high school, modeling with mathematics typically includes the kinds of problems seen
in grades 6–8 as well as ‘full models’—that is, problems that include more of the steps of
the modeling cycle (see pp. 72, 73 of CCSSM).
Finally, the third standard, MP.5, refers not only to technological tools, but also to such strategies
as drawing diagrams from kindergarten onwards and, in later grades, using well known formulas
and powerful representation schemes like the coordinate plane. These tools, and the skill and
judgment to use them well, are important for quantitative work in science.
About CCSSM practice standard MP.3: None of the connections boxes include a link to CCSSM
practice standard MP.3, which reads, “Make viable arguments and critique the reasoning of
others.” The lack of a connection to MP.3 might appear surprising, given that science too
involves making arguments and critiquing them. However, there is a difference between
mathematical arguments and scientific arguments—a difference so fundamental that it would be
misleading to connect to MP.3 here. The difference is that scientific arguments are always based
on evidence, whereas mathematical arguments never are. It is this difference that renders the
findings of science provisional and the findings of mathematics eternal. As Isaac Asimov wrote,6
“Ptolemy may have developed an erroneous picture of the planetary system, but the system of
trigonometry he worked out to help him with his calculations remains correct forever.” Blurring
the distinction between mathematical and scientific arguments leads to a misunderstanding of
what science is about. For more information about argumentation in science, see the NGSS
Science and Engineering Practice of “Engaging in argument from evidence.”
For more information on the Standards for Mathematical Practice in general, see CCSSM, pp. 6–
8. Also see pp. 72–73 for additional information on modeling in particular.
The remainder of this Appendix collects together the remaining connections from the
Connections Boxes. Illustrative science examples are provided for a number of the connections,
along with Alignment Notes in selected cases.
K-PS2 Motion and Stability: Forces and Interactions
As part of this work, teachers should give students opportunities to use direct measurement:
K.MD.A.1. Describe measurable attributes of objects, such as length or weight. Describe
several measurable attributes of a single object.
6 Boyer and Merzbach, A History of Mathematics, Second Edition (New York: Wiley and Sons), 1991, pp. vii, viii.
May 2013 NGSS Release Page 5 of 37
K.MD.A.2. Directly compare two objects with a measurable attribute in common, to see
which object has “more of” / “less of” the attribute, and describe the difference. For example,
directly compare the heights of two children and describe one child as taller/shorter.
Science examples: Students make a simple pulley that uses one object to lift a second object. They
describe one of the objects as heavier than the other. They try to predict which will rise and which will
fall. In consecutive trials that vary the weight of the first object (keeping the second object the same),
students conclude that a heavier object will lift a given target object faster.
Alignment notes: (1) Data displays such as picture graphs and bar graphs are not expected until
Grade 2. (2) Standard length units such as centimeters or inches are not expected until Grade 2.
Informal units (for example, a paperclip used as a length unit) are not expected until Grade 1.
K-PS3 Energy
As part of this work, teachers should give students opportunities to use direct measurement:
K.MD.A.2. Directly compare two objects with a measurable attribute in common, to see
which object has “more of”/”less of” the attribute, and describe the difference. For example,
directly compare the heights of two children and describe one child as taller/shorter. Science
example: Directly compare a stone left in the sun with a stone left in the shade and describe one of the
stones as warmer/cooler than the other.
May 2013 NGSS Release Page 6 of 37
K-LS1 From Molecules to Organisms: Structures and Processes
As part of this work, teachers should give students opportunities to use direct measurement:
K.MD.A.2. Directly compare two objects with a measurable attribute in common, to see
which object has “more of”/”less of” the attribute, and describe the difference. For example,
directly compare the heights of two children and describe one child as taller/shorter. Science
example: Directly compare a sunflower grown in the shade with a sunflower grown in sun. Which flower
is taller? Observe that these plants need light to thrive.
Alignment notes: (1) Data displays such as picture graphs and bar graphs are not expected until
Grade 2. (2) Standard length units such as centimeters or inches are not expected until Grade 2.
K-ESS2 Earth’s Systems
As part of this work, teachers should give students opportunities to use numbers, counting,
direct measurement, and classification:
K.CC.A.7 Know number names and the count sequence. Science example: Students write the
number of sunny or rainy days in the previous month.
K.MD.A.1. Describe measurable attributes of objects, such as length or weight. Describe
several measurable attributes of a single object. Science example: Describe a beaker of water as
being heavy and cold.
K.MD.B.3. Classify objects into given categories; count the number of objects in each
category and sort the categories by count. Science example: Build up a tally chart showing the
number of rainy or sunny days as the month progresses. Count the number of sunny or rainy days in the
previous month (see K.CC.B). Were there more rainy days or sunny days (see K.CC.C)?
Alignment notes: (1) Data displays such as picture graphs and bar graphs are not expected until
Grade 2. (2) Standard length units such as centimeters or inches are not expected until Grade 2.
K-ESS3 Earth and Human Activity
As part of this work, teachers should give students opportunities to count and compare
numbers (see K.CC). Science examples: (1) Count the number of trees in each of two photographs; in
which photograph are there more trees? In which place might you find more squirrels? (2) Keep a tally of the
number of severe weather days (forecast and actual). Count the number of severe weather days at the end of
the year.
7 The capital letter “A” in “K.CC.A” refers to the first cluster heading in domain K.CC (see p. 11 of CCSSM).
May 2013 NGSS Release Page 7 of 37
1-PS4 Waves and their Applications in Technologies for Information Transfer
As part of this work, teachers should give students opportunities to measure with non-standard
units:
1.MD.A.1. Order three objects by length; compare the lengths of two objects indirectly by
using a third object. Science example: The class makes string phones. Maria’s string is longer than
Sue’s…Sue’s string is longer than Tia’s…so without measuring directly we know that Maria’s string is
longer than Tia’s.
1.MD.A.2. Express the length of an object as a whole number of length units, by layering
multiple copies of a shorter object (the length unit) end to end; understand that the length
measurement of an object is the number of same-size length units that span it with no gaps or
overlaps. Limit to contexts where the object being measured is spanned by a whole number of
length units with no gaps or overlaps. Science example: Using a shoe as the length unit, the string
for Sue’s string phone is 11 units long.
Alignment notes: Standard length units such as centimeters or inches are not expected until
Grade 2.
1-LS1 From Molecules to Organisms: Structures and Processes
As part of this work, teachers should give students opportunities to work with two-digit
numbers:
1.NBT.B.3. Compare two two-digit numbers based on the meanings of the tens and one
digits, recording the results of comparisons with the symbols , , and .
1.NBT.C.4. Add within 100, including adding a two-digit number and a one-digit number,
and adding a two-digit number and a multiple of 10, using concrete models or drawings and
strategies based on place value, properties of operations, and/or the relationship between
addition and subtraction; relate the strategy to a written method and explain the reasoning
uses. Understand that in adding two-digit numbers, one adds tens and tens, ones and ones;
and sometimes it is necessary to compose a ten.
1.NBT.C.5. Given a two-digit number, mentally find 10 more or 10 less than the number,
without having to count; explain the reasoning used.
1.NBT.C.6. Subtract multiples of 10 in the range 10-90 from multiples of 10 in the range 10-
90 (positive or zero differences), using concrete models or drawings and strategies based on
place value, properties of operations, and/or the relationship between addition and
subtraction; relate the strategy to a written method and explain the reasoning used.
May 2013 NGSS Release Page 8 of 37
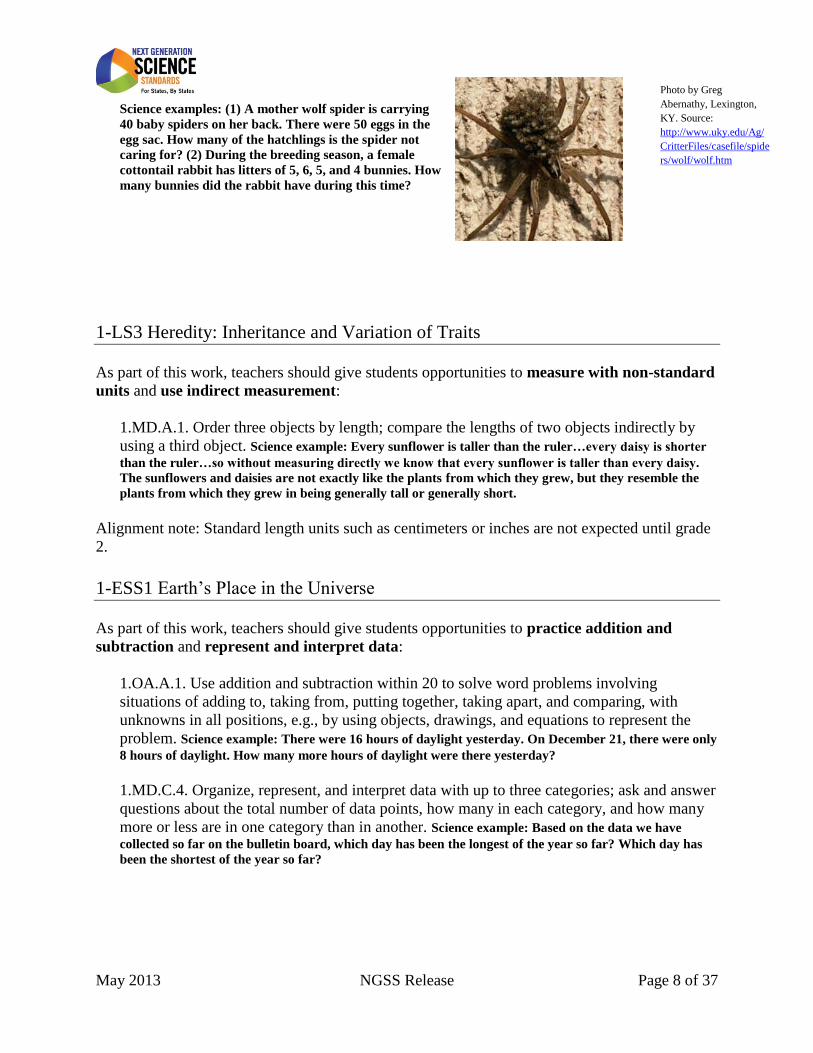
Science examples: (1) A mother wolf spider is carrying
40 baby spiders on her back. There were 50 eggs in the
egg sac. How many of the hatchlings is the spider not
caring for? (2) During the breeding season, a female
cottontail rabbit has litters of 5, 6, 5, and 4 bunnies. How
many bunnies did the rabbit have during this time?
1-LS3 Heredity: Inheritance and Variation of Traits
As part of this work, teachers should give students opportunities to measure with non-standard
units and use indirect measurement:
1.MD.A.1. Order three objects by length; compare the lengths of two objects indirectly by
using a third object. Science example: Every sunflower is taller than the ruler…every daisy is shorter
than the ruler…so without measuring directly we know that every sunflower is taller than every daisy.
The sunflowers and daisies are not exactly like the plants from which they grew, but they resemble the
plants from which they grew in being generally tall or generally short.
Alignment note: Standard length units such as centimeters or inches are not expected until grade
2.
1-ESS1 Earth’s Place in the Universe
As part of this work, teachers should give students opportunities to practice addition and
subtraction and represent and interpret data:
1.OA.A.1. Use addition and subtraction within 20 to solve word problems involving
situations of adding to, taking from, putting together, taking apart, and comparing, with
unknowns in all positions, e.g., by using objects, drawings, and equations to represent the
problem. Science example: There were 16 hours of daylight yesterday. On December 21, there were only
8 hours of daylight. How many more hours of daylight were there yesterday?
1.MD.C.4. Organize, represent, and interpret data with up to three categories; ask and answer
questions about the total number of data points, how many in each category, and how many
more or less are in one category than in another. Science example: Based on the data we have
collected so far on the bulletin board, which day has been the longest of the year so far? Which day has
been the shortest of the year so far?
Photo by Greg
Abernathy, Lexington,
KY. Source:
http://www.uky.edu/Ag/
CritterFiles/casefile/spide
rs/wolf/wolf.htm

May 2013 NGSS Release Page 9 of 37
Alignment notes: (1) Students in this grade are expected to be fluent in adding and subtracting
within 10. (2) Picture graphs and bar graphs are not expected until grade 2. (3) Line plots are not
expected until grade 2. (4) The coordinate plane is not expected until grade 5.
May 2013 NGSS Release Page 10 of 37
2-PS1 Matter and its Interactions
As part of this work, teachers should give students opportunities to represent and interpret
categorical data:
2.MD.D.10. Draw a picture graph and a bar graph (with single-unit scale) to represent a data
set with up to four categories. Solve simple put-together, take-apart, and compare problems8
using information presented in a bar graph. Science examples: (1) Make a bar graph with a single-
unit scale showing how many samples in a mineral collection are red, green, purple, or various other
colors. Based on the graph, how many samples are represented in all? (2) As part of an investigation of
which materials are best for different intended uses, make a picture graph with a single-unit scale
showing how many tools in a toolbox are made of metal, wood, rubber/plastic, or a combination. Based
on the graph, how many tools are represented in all?
Alignment notes: (1) Scaled bar graphs are not expected until Grade 3. (2) Multiplication and
division of whole numbers are not expected until Grade 3.
2-LS2 Ecosystems: Interactions, Energy, and Dynamics
As part of this work, teachers should give students opportunities to represent and interpret
categorical data:
2.MD.D.10. Draw a picture graph and a bar graph (with single-unit scale) to represent a data
set with up to four categories. Solve simple put-together, take-apart, and compare problems9
using information presented in a bar graph. Science example: Make a bar graph with single-unit
scale showing the number of seedlings that sprout with and without watering.
Alignment notes: (1) Scaled bar graphs are not expected until Grade 3. (2) Multiplication and
division of whole numbers are not expected until Grade 3.
2-LS4 Biological Evolution: Unity and Diversity
As part of this work, teachers should give students opportunities to represent and interpret
categorical data:
2.MD.D.10. Draw a picture graph and a bar graph (with single-unit scale) to represent a data
set with up to four categories. Solve simple put-together, take-apart, and compare problems10
using information presented in a bar graph. Science example: Make a picture graph with single-unit
scale showing the number of plant, vertebrate-animal, and invertebrate-animal species observed during a
field trip or in a nature photograph; how many more plant species were observed than animal species?
8 See CCSSM, Glossary, Table 1.
9 See CCSSM, Glossary, Table 1.
10 See CCSSM, Glossary, Table 1.
May 2013 NGSS Release Page 11 of 37
Alignment notes: (1) Scaled bar graphs are not expected until Grade 3. (2) Multiplication and
division of whole numbers are not expected until Grade 3.
2-ESS1 Earth’s Place in the Universe
As part of this work, teachers should give students opportunities to work with numbers to 1000:
2.NBT.A.11
Understand place value. Science example: As part of comprehending media to identify
the varying timescales on which Earth events can occur, students understand that a period of thousands
of years is much longer than a period of hundreds of years, which is in turn much longer than a period of
tens of years.
Alignment note: Rounding is not expected until grade 3.
2-ESS2 Earth’s Systems
As part of this work, teachers should give students opportunities to work with numbers to 1000,
use standard units for length, and relate addition and subtraction to length:
2.NBT.A.3. Read and write numbers to 1000 using base-ten numerals, number names, and
expanded form. Science example: Students write about a lake that is 550 feet deep, a river that is 687
miles long, a forest that began growing about 200 years ago, and so on.
2.MD.B.5. Use addition and subtraction within 100 to solve word problems involving lengths
that are given in the same units, e.g., by using drawings (such as drawings of rulers) and
equations with a symbol for the unknown number to represent the problem. Science example: A
gulley is 17 inches deep before a rainstorm and 42 inches deep after a rainstorm. How much deeper did it
get during the rainstorm?
Alignment note: Students in this grade are expected to be fluent in mentally adding and
subtracting within 20, knowing single-digit sums from memory by end of Grade 2; also to be
fluent in adding and subtracting within 100 using strategies based on place value, properties of
operations, and/or the relationship between addition and subtraction.
K–2-ETS1 Engineering Design
As part of this work, teachers should give students opportunities to represent and interpret
categorical data:
11
The capital letter “A” in “2.NBT.A” refers to the first cluster heading in domain 2.NBT (see p. 19 of CCSSM).
May 2013 NGSS Release Page 12 of 37
2.MD.D.10. Draw a picture graph and a bar graph (with single-unit scale) to represent a data
set with up to four categories. Solve simple put-together, take-apart, and compare problems12
using information presented in a bar graph. Science example: Make a bar graph with single-unit
scale showing the number of seeds dispersed by two or three different design solutions for seed dispersal.
Alignment notes: (1) Scaled bar graphs are not expected until Grade 3. (2) Multiplication and
division of whole numbers are not expected until Grade 3.
3-PS2 Motion and Stability: Forces and Interactions
As part of this work, teachers should give students opportunities to work with continuous
quantities:
3.MD.A.2. Measure and estimate liquid volumes and masses of objects using standard units
of grams (g), kilograms (kg), and liters (l).13
Add, subtract, multiply, or divide to solve one-
step word problems involving masses or volumes that are given in the same units, e.g., by
using drawings (such as a beaker with a measurement scale) to represent the problem.14
Science example: Estimate, then measure, the masses of two objects being used in an investigation of the
effect of forces; observe that the change of motion due to an unbalanced force is larger for the smaller
mass (students need not explain or quantify this observation in terms of Newton’s laws of motion).
3-LS1 From Molecules to Organisms: Structures and Processes
As part of this work, teachers should give students opportunities to be quantitative in giving
descriptions:
3.NF. Number and Operations—Fractions
3.NBT. Number and Operations in Base Ten
Science example: Be quantitative when describing the life cycles of organisms, such as their varying
lifespans (e.g., ranging from a fraction of a year up to thousands of years) and their varying reproduction
(e.g., ranging from a handful of offspring to thousands).
3-LS2 Ecosystems: Interactions, Energy, and Dynamics
As part of this work, teachers should give students opportunities to be quantitative in giving
descriptions:
12
See CCSSM, Glossary, Table 1. 13
Excludes compound units such as cm3 and finding the geometric volume of a container. (Footnote in CCSSM)
14 Excludes multiplicative comparison problems (problems involving notions of “times as much”; see Glossary,
Table 2). (Footnote in CCSSM)
May 2013 NGSS Release Page 13 of 37
3.NBT. Number and Operations in Base Ten. Science example: Be quantitative when describing the
group behaviors of animals (e.g., describe groups ranging in size from a handful up to thousands of
animals).
3-LS3 Heredity: Inheritance and Variation of Traits
As part of this work, teachers should give students opportunities to represent and interpret
data:
3.MD.B.4. Generate measurement data by measuring lengths using rulers marked with halves
and fourths of an inch. Show the data by making a line plot, where the horizontal scale is
marked off in appropriate units—whole numbers, halves, or quarters. Science examples: (1)
Make a line plot to show the height of each of a number of plants grown from a single parent. Observe
that not all of the offspring are the same size. Compare the sizes of the offspring to the size of the parent.
(2) Make a similar plot for plants grown with insufficient water.
3-LS4 Biological Evolution: Unity and Diversity
As part of this work, teachers should give students opportunities to represent and interpret
data:
3.MD.B.3. Draw a scaled picture graph and a scaled bar graph to represent a data set with
several categories. Solve one- and two-step “how many more” and “how many less”
problems using information presented in scaled bar graphs. For example, draw a bar graph
in which each square in the bar graph might represent 5 pets. Science examples: (1) Given a bar
graph showing the number of flower species that were found in several different habitats, determine how
many more flower species were found in grassy meadow than were found in dense forest. Would flower
species be affected if a forest were to spread into its habitat? (2) Make a scaled bar graph to show the
number of surviving individuals with and without an advantageous trait. How many more of the
individuals with the advantageous trait survived?
3.MD.B.4. Generate measurement data by measuring lengths using rulers marked with halves
and fourths of an inch. Show the data by making a line plot, where the horizontal scale is
marked off in appropriate units—whole numbers, halves, or quarters. Science example: Make a
line plot to show the length of each fossil that is visible in a piece of shale. Do any of the fossils resemble
modern organisms except for their size?
3-ESS2 Earth’s Systems
As part of this work, teachers should give students opportunities to work with continuous
quantities and represent and interpret categorical data:
May 2013 NGSS Release Page 14 of 37
3.MD.A.2. Measure and estimate liquid volumes and masses of objects using standard units
of grams (g), kilograms (kg), and liters (l).15
Add, subtract, multiply, or divide to solve one-
step word problems involving masses or volumes that are given in the same units, e.g., by
using drawings (such as a beaker with a measurement scale) to represent the problem.16
Science examples: (1) Estimate the mass of a large hailstone that damaged a car on a used-car lot. (2)
Measure the volume of water in liters collected during a rainstorm.
3.MD.B.3. Draw a scaled picture graph and a scaled bar graph to represent a data set with
several categories. Solve one- and two-step “how many more” and “how many less”
problems using information presented in bar graphs. Science example: Make a picture graph or
bar graph to show the number of days with high temperature below freezing in December, January,
February, and March. How many days were below freezing this winter?
Alignment notes: (1) Students are not expected to understand statistical ideas such as average,
mean, median, etc., until Grade 6. (2) Graphing in the coordinate plane is not expected until
Grade 5.
3-ESS3 Earth and Human Activity
As part of this work, teachers should give students opportunities to work with continuous
quantities including area:
3.MD.A.2. Measure and estimate liquid volumes and masses of objects using standard units
of grams (g), kilograms (kg), and liters (l).17
Add, subtract, multiply, or divide to solve one-
step word problems involving masses or volumes that are given in the same units, e.g., by
using drawings (such as a beaker with a measurement scale) to represent the problem.18
3.MD.C.5. Recognize area as an attribute of plane figures and understand concepts of area
measurement.
a. A square with side length 1 unit, called “a unit square,” is said to have “one square
unit” of area, and can be used to measure area.
b. A plane figure which can be covered without gaps or overlaps by n unit squares is said
to have an area of n square units.
3.MD.C.6. Measure areas by counting unit squares (square cm, square m, square in, square ft,
and improvised units).
Science example: In Hawaii, some houses are raised on stilts to reduce the impact of a tsunami. The force
of the tsunami on an object is greater if the object presents greater area to the incoming wave. Based on a
15
Excludes compound units such as cm3 and finding the geometric volume of a container. (Footnote in CCSSM)
16 Excludes multiplicative comparison problems (problems involving notions of “times as much”; see Glossary,
Table 2). (Footnote in CCSSM) 17
Excludes compound units such as cm3 and finding the geometric volume of a container. (footnote in CCSSM)
18 Excludes multiplicative comparison problems (problems involving notions of “times as much”; see Glossary,
Table 2). (Footnote in CCSSM)

May 2013 NGSS Release Page 15 of 37
diagram of a stilt house, determine how much area the stilts present to an incoming wave. How much
area would the house present to an incoming wave if it were not on stilts?

May 2013 NGSS Release Page 16 of 37
4-PS3 Energy
As part of this work, teachers should give students opportunities to use the four operations with
whole numbers to solve problems:
4.OA.A.3. Solve multistep word problems posed with whole numbers and having whole-
number answers using the four operations, including problems in which remainders must be
interpreted. Represent these problems using equations with a letter standing for the unknown
quantity. Assess the reasonableness of answers using mental computation and estimation
strategies including rounding. Science example: The class has 144 rubber bands with which to make
rubber-band cars. If each car uses six rubber bands, how many cars can be made? If there are 28
students, at most how many rubber bands can each car have (if every car has the same number of rubber
bands)?
Alignment notes: Grade 4 students are expected to fluently add and subtract multi-digit whole
numbers; multiply a number of up to four digits by a one-digit whole number; multiply two two-
digit numbers; and find whole-number quotients and remainders with up to four-digit dividends
and one-digit divisors.
4-PS4 Waves and their Application in Technologies for Information Transfer
As part of this work, teachers should give students opportunities to draw and identify lines and
angles:
4.G.A.1. Draw points, lines, line segments, rays, angles (right, acute, obtuse), and
perpendicular and parallel lines. Identify these in two-dimensional figures. Science example:
Identify rays and angles in drawings of wave propagation.
4-LS1 From Molecules to Organisms: Structures and Processes
As part of this work, teachers should give students opportunities to recognize symmetry:
4.G.A.3. Recognize a line of symmetry for a two-dimensional figure as a line across the
figure such that the figure can be folded across the line into matching parts. Identify line-
symmetric figures and draw lines of symmetry. Science example: Recognize symmetry, or lack of
symmetry, in the internal and external structures of plants and animals. Does the symmetry or lack
thereof contribute to the function? (For example, bilateral symmetry is a signal of reproductive fitness in
many animals; the asymmetry in an owl’s face helps it pinpoint the location of prey.)
4-ESS1 Earth’s Place in the Universe
May 2013 NGSS Release Page 17 of 37
As part of this work, teachers should give students opportunities to solve problems involving
measurement:
4.MD.A.1. Know relative sizes of measurement units within one system of units including
km, m, cm; kg, g; lb, oz.; l, ml; hr, min, sec. Within a single system of measurement, express
measurements in a larger unit in terms of a smaller unit. Record measurement equivalents in
a two-column table. For example, know that 1 ft is 12 times as long as 1 in. Express the
length of a 4 ft snake as 48 in. Generate a conversion table for feet and inches listing the
number pairs (1, 12), (2, 24), (3, 36). Science example: A limestone layer with many marine fossils is
visible in the Grand Canyon. One reference book lists this layer as being 300 feet thick. Another
reference book lists this layer as being 100 yards thick. Are the two references consistent?
Alignment note: Expressing measurements in a smaller unit in terms of a larger unit within the
same system of measurement is not expected until Grade 5.
4-ESS2 Earth’s Systems
As part of this work, teachers should give students opportunities to solve problems involving
measurement:
4.MD.A.1. Know relative sizes of measurement units within one system of units including
km, m, cm; kg, g; lb, oz.; l, ml; hr, min, sec. Within a single system of measurement, express
measurements in a larger unit in terms of a smaller unit. Record measurement equivalents in
a two-column table. For example, know that 1 ft is 12 times as long as 1 in. Express the
length of a 4 ft snake as 48 in. Generate a conversion table for feet and inches listing the
number pairs (1, 12), (2, 24), (3, 36)…. Science example: One map shows that a particular point in
the ocean is 1600 meters deep while another map shows the same point as being 1.5 kilometers deep. Are
the two maps consistent?
4.MD.A.2. Use the four operations to solve word problems involving distances, intervals of
time, liquid volumes, masses of objects, and money, including problems involving simple
fractions or decimals, and problems that require expressing measurements given in a larger
unit in terms of a smaller unit. Represent measurement quantities using diagrams such as
number line diagrams that feature a measurement scale. Science example: A coastline reduces by
an average of 4 feet per year. In an 18-month period, approximately how much of the coastline has been
lost?
Alignment note: Expressing measurements in a smaller unit in terms of a larger unit within the
same system of measurement is not expected until Grade 5.
4-ESS3 Earth and Human Activity

May 2013 NGSS Release Page 18 of 37
As part of this work, teachers should give students opportunities to be quantitative in
descriptions:
4.OA.A.1. Interpret a multiplication equation as a comparison, e.g., interpret 35 = 5 × 7 as a
statement that 35 is 5 times as many as 7 and 7 times as many as 5. Represent verbal
statements of multiplicative comparisons as multiplication equations. Science example: Be
quantitative when discussing environmental effects. For example, say not only that a particular oil spill
was ‘large,’ but that 5 million gallons were spilled, or that the oil spill was 40 times larger than the next-
worst oil spill.
5-PS1 Matter and Its Interactions
As part of this work, teachers should give students opportunities to relate very large and very
small quantities to place value and division, convert measurement units, and work with
volume:
5.NBT.A.1. Explain patterns in the number of zeros of the product when multiplying a
number by powers of 10, and explain patterns in the placement of the decimal point when a
decimal is multiplied or divided by a power of 10. Use whole-number exponents to denote
powers of 10.
5.NF.B.7. Apply and extend previous understandings of division to divide unit fractions by
whole numbers and whole numbers by unit fractions.19
a. Interpret division of a unit fraction by a non-zero whole number, and compute such
quotients. For example, create a story context for (1/3) ÷ 4, and use a visual fraction model
to show the quotient. Use the relationship between multiplication and division to explain that
(1/3) ÷ 4 = 1/12 because (1/12) × 4 = 13.
b. Interpret division of a whole number by a unit fraction, and compute such quotients.
For example, create a story context for 4 ÷ (1/5), and use a visual fraction model to show the
quotient. Use the relationship between multiplication and division to explain that 4 ÷ (1/5) =
20 because 20 × (1/5) = 4.
c. Solve real world problems involving division of unit fractions by non-zero whole
numbers and division of whole numbers by unit fractions, e.g., by using visual fraction
models and equations to represent the problem. For example, how much chocolate will each
person get if 3 people share ½ lb of chocolate equally? How many 1/3-cup servings are in 2
cups of raisins?
Science examples: (1) If you split a salt grain with weight 1 mg into 10 equal parts, find the weight of each
part. (Answer in mg.) If you next divide each of the parts into 10 equal parts, find the weight of one of the
new parts. (Answer in mg.) How many parts are there in the end? (2) Suppose a salt grain with weight 1
mg is split into 10 equal parts, and each of those parts is split into 10 equal parts, and so on, until there
19
Students able to multiply fractions in general can develop strategies to divide fractions in general, by reasoning
about the relationship between multiplication and division. But division of a fraction by a fraction is not a
requirement at this grade. (Footnote in CCSSM.)
May 2013 NGSS Release Page 19 of 37
are 108 parts. What is the weight of one of these tiny parts? Write the number of these tiny parts as a
whole number without using exponents.
5.MD.A.1. Convert among different-sized standard measurement units within a given
measurement system (e.g., convert 5 cm to 0.05 m), and use these conversions in solving
multi-step, real-world problems. Science example: When 100 g of sugar is dissolved in 0.5 kg of
water, what is the total weight of the system? Answer in grams, then answer again in kilograms. After the
water evaporates, see how much the sugar residue weighs.
5.MD.C.3. Recognize volume as an attribute of solid figures and understand concepts of
volume measurement.
a. A cube with side length 1 unit, called a “unit cube,” is said to have “one cubic unit” of
volume, and can be used to measure volume.
b. A solid figure, which can be packed without gaps or overlaps using n unit cubes, is
said to have a volume of n cubic units.
5.MD.C.4. Measure volumes by counting unit cubes, using cubic cm, cubic in, cubic ft, and
improvised units.
Science example: Compress the air in a cylinder to half its volume. (Draw a picture of the volume before
and after, and explain how you know that the new volume is half of the old volume.) Can you compress
the volume by half again? Why is it difficult to do?
Alignment limits: (1) Ratios are not expected until grade 6. (2) Scientific notation is not expected
until grade 8.
5-PS2 Motion and Stability: Forces and Interaction,
5-PS3 Energy
N/A
5-LS1 From Molecules to Organisms: Structures and Processes
As part of this work, teachers should give students opportunities to convert measurement units:
5.MD.A.1. Convert among different-sized standard measurement units within a given
measurement system (e.g., convert 5 cm to 0.05 m), and use these conversions in solving
multi-step, real world problems. Science example: In an experiment to rule out soil as a source of
plant food, Sue weighed the soil using units of grams but Katya weighed the plant using units of
kilograms. The soil lost 4 grams, while the plant gained 0.1 kilograms. Did the plant gain much more
than the soil lost? Much less? About the same? (A good way to begin is to express both figures in grams.)
Alignment notes: (1) Converting between measurement systems (e.g., centimeters to inches) is
not expected until Grade 6. (2) Rate quantities, such as annual rates of ecosystem production,
May 2013 NGSS Release Page 20 of 37
etc., are not expected until Grade 6. (3) Grade 5 students are expected to read, write, and
compare decimals to thousandths, and perform decimal arithmetic to hundredths.
5-LS2 Ecosystems: Interactions, Energy, and Dynamics
As part of this work, teachers should give students opportunities to be quantitative in giving
descriptions. Science example: In a diagram showing matter flows in a system, assign values to the arrows
in a diagram to show flows quantitatively.
5-ESS1 Earth’s Place in the Universe
As part of this work, teachers should give students opportunities to relate very large and very
small quantities to place value and use the coordinate plane:
5.NBT.A.2. Explain patterns in the number of zeros of the product when multiplying a
number by powers of 10, and explain patterns in the placement of the decimal point when a
decimal is multiplied or divided by a power of 10. Use whole-number exponents to denote
powers of 10. Science example: The sun is about 1011
meters from Earth. Sirius, another star, is about
1017
meters from Earth. Write these two numbers without exponents; position the numbers one directly
below the other, aligning on the 1. How many times farther away from Earth is Sirius compared to the
sun?
5.G.A.2. Represent real world and mathematical problems by graphing points in the first
quadrant of the coordinate plane, and interpret coordinate values of points in the context of
the situation. Science examples: (1) Over the course of a year, students compile data for the length of
the day over the course of the year. What pattern is observed when the data are graphed on a coordinate
plane, and how can a model of the sun and Earth explain the pattern? (2) Students are given (x, y)
coordinates for the Earth at six equally spaced times during its orbit around the sun (with the sun at the
origin). Students graph the points to show snapshots of Earth’s motion through space.
Alignment note: Scientific notation is not expected until grade 8.
5-ESS2 Earth’s Systems
As part of this work, teachers should give students opportunities to use the coordinate plane:
5.G.A.2. Represent real world and mathematical problems by graphing points in the first
quadrant of the coordinate plane, and interpret coordinate values of points in the context of
the situation. Science example: Plot monthly data for high and low temperatures in two locations, one
coastal and one inland (e.g., San Francisco County vs. Sacramento). What patterns do you see? How can
the influence of the ocean be seen in the observed patterns?
May 2013 NGSS Release Page 21 of 37
Alignment notes: (1) Percentages are not expected until Grade 6. (2) Trends in scatterplots and
patterns of association in two-way tables are not expected until Grade 8.
5-ESS3 Earth and Human Activity
As part of this work, teachers should give students opportunities to be quantitative in giving
descriptions. Science example: In describing ways individual communities use science ideas to protect
Earth’s resources and environment, provide quantitative information such as amount of energy saved and
the cost of the approach.
3–5-ETS1 Engineering Design
As part of this work, teachers should give students opportunities to use the four operations to
solve problems:
OA: Operations and Algebraic Thinking (representing and solve problems using the four
operations; see each grade in CCSSM for detailed expectations). Science example: Analyze
constraints on materials, time, or cost to draw implications for design solutions. For example, if a design
calls for 20 screws and screws are sold in boxes of 150, then how many copies of the design could be
made?
MS-PS1 Matter and Its Interactions
As part of this work, teachers should give students opportunities to work with ratios and
proportional relationships, use signed numbers, write and solve equations, and use order of
magnitude thinking and basic statistics:
Ratios and Proportional Relationships (6–7.RP). Science examples: (1) A pile of salt has
mass 100 mg. How much chlorine is in it? Answer in milligrams. What would the answer be
for a 500 mg pile of salt? (2) Twice as much water is twice as heavy. Explain why twice as
much water isn’t twice as dense. (3) Based on a model of a water molecule, recognize that
any sample of water has a 2:1 ratio of hydrogen atoms to oxygen atoms. (4) Measure the
mass and volume of a sample of reactant and compute its density. (5) Compare a
measured/computed density to a nominal/textbook value, converting units as necessary.
Determine the percent difference between the two.
The Number System (6–8.NS). Science examples: (1) Use positive and negative quantities to
represent temperature changes in a chemical reaction (signs of energy released or absorbed).
(2) For Grade 7 or 8: Solve a simple equation for an unknown signed number (e.g., A
solution was initially at room temperature. After the first reaction, the temperature change
was −8oC. After the second reaction, the temperature was 3
oC below room temperature. Find
the temperature change during the second reaction. Was energy released or absorbed in the
May 2013 NGSS Release Page 22 of 37
second reaction? Show all of the given information on a number line/thermometer scale. Also
represent the problem by an equation.)
Expressions and Equations (6–8.EE). Science examples: (1) For Grade 8: With substantial
scaffolding, use algebra and quantitative thinking to determine the interatomic spacing in a
salt crystal. (2) For Grade 8: Use scientific notation for atomic masses, large numbers of
atoms, and other quantities much less than or much greater than 1. Also use convenient units
such as unified atomic mass units.
Statistics and Probability (6–8.SP). Science example: Compile all the boiling point
measurements from the class into a line plot and discuss the distribution in terms of
clustering and outliers. Why weren’t all the measured values equal? How close is the average
value to the nominal/textbook value? Show the average value and the nominal value on the
line plot.
MS-PS2 Motion and Stability: Forces and Interactions
As part of this work, teachers should give students opportunities to work with signed numbers
and interpret expressions:
The Number System (6–8.NS). Science examples: (1) Represent a third-law pair of forces as
a 100 N force on one object and a −100N force on the other object. (2) Represent balanced
forces on a single object as equal and opposite numbers 5 N. (3) Represent the net result of
two or more forces as a sum of signed numbers. For example, given a large force and an
oppositely directed small force, represent the net force as (100 N) + (−5 N) = 95 N. Relate
the number sentence to the fact that the net effect on the motion is approximately what it
would have been with only the large force.
Expressions and Equations (6–8.EE). Science example: Interpret an expression in terms of a
physical context, e.g., interpret the expression F1 + F2 in a diagram as representing the net
force on an object.
May 2013 NGSS Release Page 23 of 37
MS-PS3 Energy
As part of this work, teachers should give students opportunities to work with ratios and
proportional relationships and basic statistics:
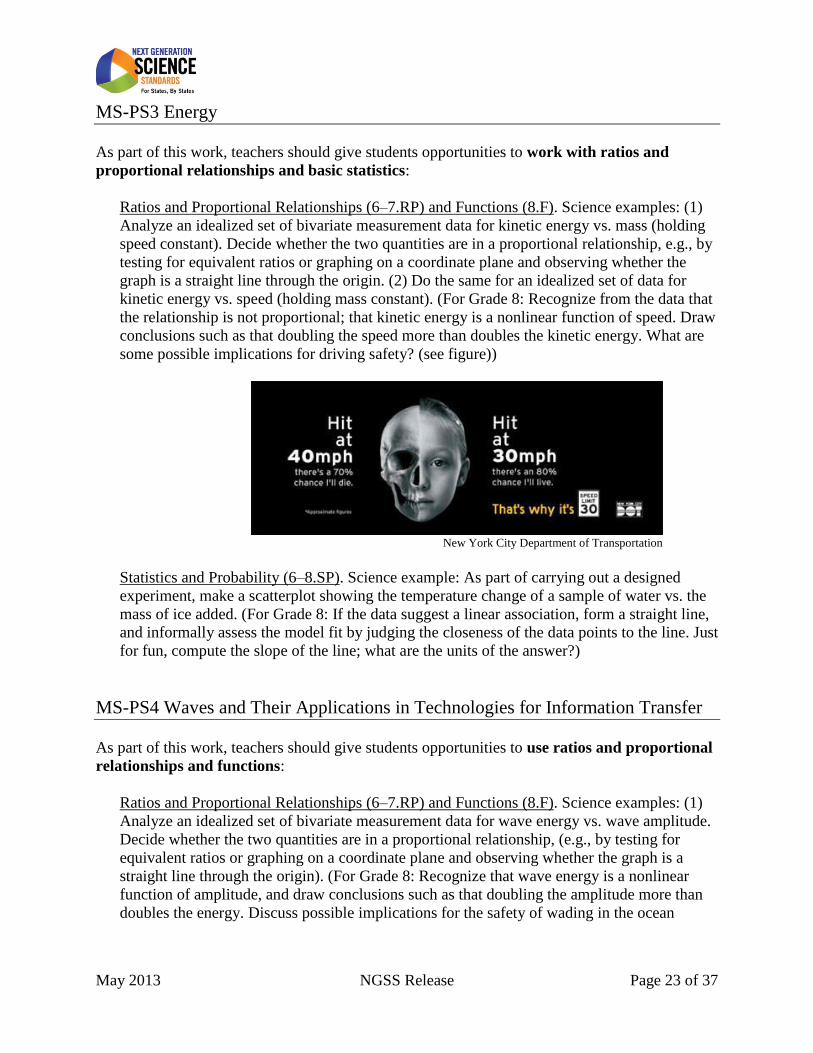
Ratios and Proportional Relationships (6–7.RP) and Functions (8.F). Science examples: (1)
Analyze an idealized set of bivariate measurement data for kinetic energy vs. mass (holding
speed constant). Decide whether the two quantities are in a proportional relationship, e.g., by
testing for equivalent ratios or graphing on a coordinate plane and observing whether the
graph is a straight line through the origin. (2) Do the same for an idealized set of data for
kinetic energy vs. speed (holding mass constant). (For Grade 8: Recognize from the data that
the relationship is not proportional; that kinetic energy is a nonlinear function of speed. Draw
conclusions such as that doubling the speed more than doubles the kinetic energy. What are
some possible implications for driving safety? (see figure))
New York City Department of Transportation
Statistics and Probability (6–8.SP). Science example: As part of carrying out a designed
experiment, make a scatterplot showing the temperature change of a sample of water vs. the
mass of ice added. (For Grade 8: If the data suggest a linear association, form a straight line,
and informally assess the model fit by judging the closeness of the data points to the line. Just
for fun, compute the slope of the line; what are the units of the answer?)
MS-PS4 Waves and Their Applications in Technologies for Information Transfer
As part of this work, teachers should give students opportunities to use ratios and proportional
relationships and functions:
Ratios and Proportional Relationships (6–7.RP) and Functions (8.F). Science examples: (1)
Analyze an idealized set of bivariate measurement data for wave energy vs. wave amplitude.
Decide whether the two quantities are in a proportional relationship, (e.g., by testing for
equivalent ratios or graphing on a coordinate plane and observing whether the graph is a
straight line through the origin). (For Grade 8: Recognize that wave energy is a nonlinear
function of amplitude, and draw conclusions such as that doubling the amplitude more than
doubles the energy. Discuss possible implications for the safety of wading in the ocean
May 2013 NGSS Release Page 24 of 37
during a storm.) (2) Interpret an idealized set of bivariate measurement data for wave energy
vs. wave speed.
MS-LS1 From Molecules to Organisms: Structures and Processes
As part of this work, teachers should give students opportunities to use order of magnitude
thinking, write and solve equations, analyze data, and use concepts of probability:
Expressions and Equations (6–8.EE). Science examples: (1) Quantify the sizes of cells and
parts of cells, using convenient units such as microns as well as (in Grade 8) scientific
notation. (2) Appreciate the orders of magnitude that span the difference in size between
cells, molecules, and atoms. (3) Write a number sentence that expresses the conservation of
mass as food moves through an organism. Assign values to the arrows in a diagram to show
flows quantitatively. (4) Infer an unknown mass by using the concept of conservation to
write and solve an equation with a variable.
Statistics and Probability (6–8.SP). Science examples: (1) For Grade 8: Use data in a two-
way table as evidence to support an explanation of how environmental and genetic factors
affect the growth of organisms. (2) For Grade 8: Use data in a two-way table as evidence to
support an explanation that different local environmental conditions impact growth in
organisms. (3) For Grade 7 or 8: Use probability concepts and language to describe and
quantify the effects that characteristic animal behaviors have on the likelihood of successful
reproduction.
MS-LS2 Ecosystems: Interactions, Energy, and Dynamics
As part of this work, teachers should give students opportunities to work with ratios and
proportional relationships, write and solve equations, and use basic statistics:
Ratios and Proportional Relationships (6–7.RP). Science example: Use ratios and unit rates
as inputs for evaluating plans for maintaining biodiversity and ecosystem services (e.g.,
consider the net cost or net value of developing a wetland, using inputs such as the value of
various wetland services in dollars per acre per year; in analyzing urban biodiversity, rank
world cities by the amount of green space as a fraction of total land area; in analyzing social
factors, determine the amount of green space per capita (m2 per person)).
Expressions and Equations (6–8.EE). Science examples: (1) Write a number sentence that
expresses the conservation of total matter or energy in a system as matter or energy flows
into, out of, and within it. Assign values to the arrows in a diagram to show flows
quantitatively. (2) Infer an unknown matter or energy flow in a system by using the concept
of conservation to write and solve an equation with a variable.
May 2013 NGSS Release Page 25 of 37
Statistics and Probability (6–8.SP). Science example: For Grade 8: Use data in a two-way
table as evidence to support an explanation of how social behaviors and group interactions
benefit organisms’ abilities to survive and reproduce.
MS-LS3 Heredity: Inheritance and Variation of Traits
As part of this work, teachers should give students opportunities to use concepts of probability:
Statistics and Probability (6–8.SP). Science examples: (1) Recognize a Punnett square as a
component of a probability model, and compute simple probabilities from the model. (2) Use
a computer to simulate the variation that comes from sexual reproduction, and determine
probabilities of traits from the simulation.
MS-LS4 Biological Evolution: Unity and Diversity
As part of this work, teachers should give students opportunities to work with ratios and
proportional relationships, use concepts of probability, and use order of magnitude
thinking:
Ratios and Proportional Relationships (6–7.RP) and Statistics and Probability (6–8.SP).
Science examples: (1) Apply several ratios in combination to determine a net survival rate.
For example, if 50 animals in a population have trait A while 50 have trait B, and each winter
the survival rates are 80% for trait A and 60% for trait B, then how many of the animals with
each trait will be alive after 1 winters? How about after 2 winters? 6 winters? (2) Use scaled
histograms to summarize the results of a simulation of natural selection over many
generations. (3) For Grade 7 or 8: Use probability language and concepts when explaining
how variation in traits among a population leads to an increase in some traits in the
population and a decrease in others.
Expressions and Equations (6–8.EE). Science examples: (1) Quantify durations of time in
interpreting the fossil record. (2) For Grade 8: Use scientific notation for long intervals of
time, or for dates in the distant past; also use convenient units (e.g., Myr, Gyr, Ma, Ga). (3)
Appreciate the spans of time involved in natural selection.
Alignment notes: (1) Exponential functions are not expected until high school. (2) Laws of
probability such as p(AB) = p(A)p(B|A) are not expected until high school.
MS-ESS1 Earth’s Place in the Universe
As part of this work, teachers should give students opportunities to use ratios and proportional
relationships and use order of magnitude thinking:
May 2013 NGSS Release Page 26 of 37
Ratios and Proportional Relationships (6–7.RP). Science examples: (1) For Grade 7: Create a
scale model or scale drawing of the solar system or Milky Way galaxy. (2) For Grade 7:
Create scale-preserving descriptions such as, “If the solar system were shrunk down to the
size of Earth, then Earth would shrink to the size of _____”; compute relevant scale factors
and use them to determine a suitable object.
Expressions and Equations (6–8.EE). Science examples: For Grade 8: (1) Use scientific
notation for long intervals of time, or for dates in the distant past; also use convenient units
(e.g., Myr, Gyr, Ma, Ga). Appreciate the spans of time involved in Earth’s history. (2) Are
there more molecules of gas in a toy balloon, or more stars in the Milky Way galaxy?
MS-ESS2 Earth’s Systems
As part of this work, teachers should give students opportunities to work with positive and
negative numbers, and use order of magnitude thinking:
The Number System (6–8.NS). Science examples: (1) Use positive and negative quantities to
quantify changes in physical quantities such as atmospheric pressure and temperature; for
example, if the temperature dropped from 24oC to 11
oC, then the temperature change was
−13oC. (2) Solve word problems relating to changes in signed physical quantities. For
example, a shift in the jet stream caused a 10oC temperature increase in a single day; if the
temperature before was −32oC, what was the temperature after?
Expressions and Equations (6–8.EE). Science examples: For Grade 8: (1) Use scientific
notation for long intervals of time, or for dates in the distant past; also use convenient units
(e.g., Myr, Gyr, Ma, Ga). (2) Use order of magnitude data on the rate of seafloor spreading to
estimate how long it has taken for two continents to separate. (3) Appreciate the spans of
time involved in Earth’s history. Recognize that a period of time is neither “long” nor “short”
in itself, but only relatively long or relatively short as compared to some other period of time;
for example, the Hawaiian islands have been forming for several million years, and this time
period is neither long nor short. It is a long time in comparison to the duration of the last
glacial period, but a short time in comparison to Earth’s entire history.
MS-ESS3 Earth and Human Activity
As part of this work, teachers should give students opportunities to use ratios and proportional
relationships and use order of magnitude thinking:
Ratios and Proportional Relationships (6–7.RP). Science example: Work with measurement
quantities that are formed through division, such as atmospheric concentration of CO2,
May 2013 NGSS Release Page 27 of 37
extraction cost per barrel of oil in different forms, per-capita consumption of given resources,
flow rates in freshwater rivers, etc.
Expressions and Equations (6–8.EE). Science example: For Grade 8, use orders of magnitude
and order-of-magnitude estimates as part of oral and written arguments, evaluations of data
from technical texts, design solutions, and explanations of the impact on Earth’s systems of
increasing population and per-capita consumption.
MS-ETS1 Engineering Design
As part of this work, teachers should give students opportunities to solve quantitative problems
and use basic statistics:
7.EE.3. Solve multi-step real-life and mathematical problems posed with positive and
negative rational numbers in any form (whole numbers, fractions, and decimals), using tools
strategically. Apply properties of operations to calculate with numbers in any form; convert
between forms as appropriate; and assess the reasonableness of answers using mental
computation and estimation strategies. For example: If a woman making $25 an hour gets a
10% raise, she will make an additional 1/10 of her salary an hour, or $2.50, for a new salary
of $27.50. If you want to place a towel bar 9 ¾ inches long in the center of a door that is 27
½ inches wide, you will need to place the bar about 9 inches from each edge; this estimate
can be used as a check on the exact computation. Science example: Work with tolerances, cost
constraints, and other quantitative factors in evaluating competing design solutions.
Statistics and Probability (6–8.SP). Science example: For Grade 7: Use simulations to
generate data that can be used to modify a proposed object, tool, or process.
HS.PS1 Matter and Its Interactions
As part of this work, teachers should give students opportunities to reason quantitatively and
use units to solve problems, and apply key takeaways from grades 6–8 mathematics:
Quantities (N-Q) / Reason quantitatively and use units to solve problems:
N-Q.1. Use units as a way to understand problems and to guide the solution of multi-step
problems; choose and interpret units consistently in formulas; choose and interpret the
scale and origin in graphs and data displays.
N-Q.2. Define appropriate quantities for the purpose of descriptive modeling.
N-Q.3. Choose a level of accuracy appropriate to limitations on measurement when
reporting quantities.
May 2013 NGSS Release Page 28 of 37
Science examples: (1) Recognize the difference between intensive and extensive
quantities (e.g., a quantity with units of Joules per kilogram is insensitive to the overall
size of the sample in question, unlike a quantity with units of Joules). (2) Attend to units
properly when using formulas such as density = mass/volume, etc. (3) Carefully format
data displays and graphs, attending to origin, scale, units, and other essential items.
Applying key takeaways from grades 6–8 mathematics. Science examples: (1) Convert a
reference value of a quantity to match the units being used in a classroom experiment. (2)
Interpret, write, or solve an equation that represents the conservation of energy or mass in a
chemical reaction.
HS.PS2 Motion and Instability: Forces and Interactions
As part of this work, teachers should give students opportunities to model with mathematics,
use basic algebra, reason quantitatively and use units to solve problems, and apply key
takeaways from grades 6–8 mathematics:
Quantities (N-Q) / Reason quantitatively and use units to solve problems:
N-Q.1. Use units as a way to understand problems and to guide the solution of multi-step
problems; choose and interpret units consistently in formulas; choose and interpret the
scale and origin in graphs and data displays.
N-Q.2. Define appropriate quantities for the purpose of descriptive modeling.
N-Q.3. Choose a level of accuracy appropriate to limitations on measurement when
reporting quantities.
Science examples: (1) Relate the units of acceleration (m/s2) to the fact that acceleration
refers to a change in velocity over time. (2) Reconstruct the units of the universal
gravitational constant G by reference to the formula F = Gm1m2/r2, instead of having to
memorize the units. (2) Attend to units properly when using formulas such as momentum
= mass times velocity, etc. (3) Carefully format data displays and graphs, attending to
origin, scale, units, and other essential items.
Seeing Structure in Expressions (A-SSE). Science example: Draw conclusions about
gravitational or other forces by interpreting the algebraic structure of formulas. For example,
conclude that the force on an object in a gravitational field is proportional to its mass, by viewing
the formula F = Gmsourcemobject/r2 as F = (Gmsource/r
2) (mobject) and recognizing the same algebraic
structure as in y = kx.
May 2013 NGSS Release Page 29 of 37
Creating Equations (A-CED). Science examples: (1) Rearrange a formula (such as F = ma or p =
mv) in order to highlight a quantity of interest. (2) Write and solve a linear equation to solve a
problem involving motion at a constant speed.
Interpreting Functions (F-IF) and Interpreting Categorical and Quantitative Data (S-ID). Science
examples: (1) Informally fit a quadratic function to the position-time data for a cart that rolls up
an incline (slowing as it climbs, then reversing direction and speeding up as it descends). Use the
algebraic expression for the fitted function to determine the magnitude of the cart’s acceleration
and initial speed. Over several trials, graph various quantities (such as acceleration vs. angle, or
peak displacement vs. initial speed squared), and interpret the results. (2) Calculate and interpret
the average speed of a moving object by using data from a distance-time graph.
Applying key takeaways from grades 6–8 mathematics. Science examples: (1) Compute ratios of
distances and times in order to distinguish accelerated motion from motion with constant speed.
Reason qualitatively on that basis (e.g., a dropped stone falls further between t = 1s and t = 2s
than it falls between t = 0s and t = 1s). (2) For an object moving at constant speed, compute the
speed by choosing a point from its distance-time graph.
HS.PS3 Energy
As part of this work, teachers should give students opportunities to reason quantitatively and
use units to solve problems, and apply key takeaways from grades 6–8 mathematics:
Quantities (N-Q) / Reason quantitatively and use units to solve problems:
N-Q.1. Use units as a way to understand problems and to guide the solution of multi-step
problems; choose and interpret units consistently in formulas; choose and interpret the
scale and origin in graphs and data displays.
N-Q.2. Define appropriate quantities for the purpose of descriptive modeling.
N-Q.3. Choose a level of accuracy appropriate to limitations on measurement when
reporting quantities.
Science examples: (1) Analyze units in expressions like mgh and ½ mv2 to show that they
both refer to forms energy. (2) Observe in a range of situations within science that
quantities being added to one another or subtracted from one another are always
quantities of the same general kind (energy, length, time, temperature, etc.); express such
terms in the same units before adding or subtracting. (3) Carefully format data displays
and graphs, attending to origin, scale, units, and other essential items.
May 2013 NGSS Release Page 30 of 37
Applying key takeaways from grades 6–8 mathematics. Science examples: (1) Fit a linear
function to a data set showing the relationship between the change in temperature of an insulated
sample of water and the number of identical hot ball-bearings dropped into it (all with the same
initial temperature). Find the slope of the graph and use it to determine the specific heat of the
metal. (2) Interpret, write, or solve an equation that represents the conservation of energy in a
given process.
HS.PS4 Waves and Their Applications in Technologies for Information Transfer
As part of this work, teachers should give students opportunities to work with basic algebra and
apply key takeaways from grades 6–8 mathematics:
Seeing Structure in Expressions (A-SSE). Science example: (1) Write expressions in equivalent
forms to solve problems. For example, relate the formulas c = f and c = /T by seeing that /T =
(1/T) = f, instead of remembering both forms separately. (2) See the conceptual and structural
similarities between formulas such as c = /T and v = d/t. How do these formulas relate to the
formula (running speed) = (stride length) × (stride frequency) which is sometimes found in track-
and-field coaching manuals?
Creating Equations (A-CED). Science examples: (1) Rearrange a formula in order to highlight a
quantity of interest. (2) Write and solve an equation in a problem involving wave motion, for
example as part of an activity to use seismograph data to locate the epicenter of an earthquake.
Applying key takeaways from grades 6–8 mathematics. Apply several proportional relationships
in combination. Science examples: (1) Estimate how long it would take a solar cell installation to
pay for itself by combining such factors as per-square-meter cost of solar cells, collection
efficiency, per-square-meter solar energy flux, per-kilowatt-hour cost of conventional electricity,
etc. (2) Will 4 lbs of food in a microwave oven take approximately four times as long to reach
the desired temperature as 1 lb of food? Why or why not? How is this situation similar to or
different from cooking in a conventional oven?
HS.LS1 From Molecules to Organisms: Structures and Processes
As part of this work, teachers should give students opportunities to model with mathematics:
Interpreting Functions (F-IF) and Building Functions (F-BF).20
Science example: Use a
spreadsheet or other technology to simulate the doubling in a process of cell division; graph the
results; write an expression to represent the number of cells after a division in terms of the
number of cells beforehand; express this in closed form as a population size in terms of time.
Discuss real-world factors in the situation that lead to deviation from the exponential model over
time.
20
See also Linear, Quadratic, and Exponential Models (F-LE).
May 2013 NGSS Release Page 31 of 37
HS.LS2 Ecosystems: Interactions, Energy, and Dynamics
As part of this work, teachers should give students opportunities to reason quantitatively and
use units to solve problems, represent quantitative data, and apply key takeaways from
grades 6–8 mathematics:
Quantities (N-Q) / Reason quantitatively and use units to solve problems:
N-Q.1. Use units as a way to understand problems and to guide the solution of multi-step
problems; choose and interpret units consistently in formulas; choose and interpret the
scale and origin in graphs and data displays.
N-Q.2. Define appropriate quantities for the purpose of descriptive modeling.
N-Q.3. Choose a level of accuracy appropriate to limitations on measurement when
reporting quantities.
Science examples: (1) Recognize the difference between intensive and extensive
quantities (e.g., a quantity with units of tons/acre is insensitive to the overall size of the
area in question, unlike a quantity with units of tons). (2) Carefully format data displays
and graphs, attending to origin, scale, units, and other essential items.
Interpreting Categorical and Quantitative Data (S-ID) and Making Inferences and Justifying
Conclusions (S-IC). Science example: Use a spreadsheet or other technology to analyze and
display a historical or simulated data set as part of an investigation of ecosystem changes.
Applying key takeaways from grades 6–8 mathematics. Science examples: (1) Compute a
percent change in a variable over the period of a historical data set, as part of an explanation of
ecosystem changes (pesticide application, disease incidence, water temperature, invasive species
population counts, etc). (2) Merge two data sets by converting values in one data set as necessary
to match the units used in the other. (3) Interpret, write, or solve an equation that represents the
conservation of energy as it is transferred from one trophic level to another.
HS.LS3 Heredity: Inheritance and Variation of Traits
As part of this work, teachers should give students opportunities to apply key takeaways from
grades 6–8:
Applying key takeaways from grades 6–8 mathematics (see especially 7.SP.B, 7.SP.C, and
8.SP.4). Science examples: (1) Use a probability model to estimate the probability that a child
May 2013 NGSS Release Page 32 of 37
will inherit a disease or other trait, given knowledge or hypotheses about the parents’ traits. (2)
Use observed or simulated frequencies to identify cases of non-Mendelian inheritance.
HS.LS4 Biological Evolution: Unity and Diversity
As part of this work, teachers should give students opportunities to apply key takeaways from
grades 6–8:
Applying key takeaways from grades 6–8 mathematics (see especially 6.SP). Science example:
Assess differences between two populations using measures of center and variation for each.
Analyze a shift in numerical distribution of traits and use these shifts as evidence to support an
explanation.
HS.ESS1 Earth’s Place in the Universe
As part of this work, teachers should give students opportunities to model with mathematics,
use basic algebra, reason quantitatively and use units to solve problems, and apply key
takeaways from grades 6–8 mathematics:
Interpreting Functions (F-IF) and Interpreting Categorical and Quantitative Data (S-ID).21
Science example: Work with exponential models in connection with radiometric dating concepts
and data.
Creating Equations (A-CED). Science examples: (1) Rearrange a formula (such as E = mc2) in
order to highlight a quantity of interest. (2) Use Kepler’s third law to write and solve an equation
in order to solve a problem involving orbital motion.
Seeing Structure in Expressions (A-SSE). Science example: Draw conclusions about
astronomical phenomena by interpreting the algebraic structure of formulas. For example,
conclude from maxT = const. that cooler stars are redder and hotter stars are bluer; conclude
from Kepler’s third law that Earth and the moon take the same amount of time to revolve around
the sun, even though they have different masses (because only the mass of the sun appears in the
law, not the mass of the orbiting body).
Quantities (N-Q) / Reason quantitatively and use units to solve problems:
N-Q.1. Use units as a way to understand problems and to guide the solution of multi-step
problems; choose and interpret units consistently in formulas; choose and interpret the
scale and origin in graphs and data displays.
21
See also Linear, Quadratic, and Exponential Models (F-LE).
May 2013 NGSS Release Page 33 of 37
N-Q.2. Define appropriate quantities for the purpose of descriptive modeling.
N-Q.3. Choose a level of accuracy appropriate to limitations on measurement when
reporting quantities.
Science examples: (1) Verify that mc2 has units of energy (e.g., has the same units as mgh
and mv2). (2) Use SI units as well as convenient units (e.g., mm/yr for seafloor spreading,
Gya for dates in the early history of Earth, etc.). (3) Attend to units properly when using
formulas such as energy = mass times speed of light squared, etc. (4) Carefully format
data displays and graphs, attending to origin, scale, units, and other essential items.
Applying key takeaways from grades 6–8 mathematics. Science examples: (1) Pinnacles
National Monument is believed to have been created when the San Andreas Fault moved part of
a volcano 195 miles northward over a period of 23 million years. On average, how fast did this
part of the volcano move, in centimeters per year? (2) Also express your answer in meters per
second using scientific notation. (3) Use a spreadsheet to scatterplot the planets’ orbital periods
against their orbital semimajor axes, and explain how these data show nonlinearity. Then
scatterplot the squares of the orbital periods against the cubes of their orbital semimajor axes,
and show that the relationship is linear.
HS.ESS2 Earth’s Systems
As part of this work, teachers should give students opportunities to reason quantitatively and
use units to solve problems, and apply key takeaways from grades 6–8 mathematics:
Quantities (N-Q) / Reason quantitatively and use units to solve problems:
N-Q.1. Use units as a way to understand problems and to guide the solution of multi-step
problems; choose and interpret units consistently in formulas; choose and interpret the
scale and origin in graphs and data displays.
N-Q.2. Define appropriate quantities for the purpose of descriptive modeling.
N-Q.3. Choose a level of accuracy appropriate to limitations on measurement when
reporting quantities.
Science examples: (1) When coastal erosion is measured, what are its units? What does
this tell you about what quantity is being measured? (2) Use SI units as well as
convenient units (e.g., My for durations of time or Gya for dates in the early history of
Earth). (3) Carefully format data displays and graphs, attending to origin, scale, units, and
other essential items.
Applying key takeaways from grades 6–8 mathematics. Science example: Use order of
magnitude thinking to appreciate relative timescales in the coevolution of Earth’s systems and
May 2013 NGSS Release Page 34 of 37
life on Earth (e.g., when did photosynthetic life alter the atmosphere? How long was it then until
the appearance of land plants?).
HS.ESS3 Earth and Human Activity
As part of this work, teachers should give students opportunities to reason quantitatively and
use units to solve problems, and apply key takeaways from grades 6–8 mathematics:
Quantities (N-Q) / Reason quantitatively and use units to solve problems:
N-Q.1. Use units as a way to understand problems and to guide the solution of multi-step
problems; choose and interpret units consistently in formulas; choose and interpret the
scale and origin in graphs and data displays.
N-Q.2. Define appropriate quantities for the purpose of descriptive modeling.
N-Q.3. Choose a level of accuracy appropriate to limitations on measurement when
reporting quantities.
Science examples: (1) Quantify the impacts of human activities on natural systems. For
example, if a certain activity creates pollution that in turn damages forests, then go
beyond a qualitative statement by quantifying both the amount of pollution and the level
of damage. (2) Carefully format data displays and graphs, attending to origin, scale, units,
and other essential items.
Applying key takeaways from grades 6–8 mathematics. Science examples: (1) Use concepts of
probability to describe risks of natural hazards (volcanic eruptions, earthquakes, tsunamis,
hurricanes, droughts, etc.) that impact human activity. (2) Use cost-benefit ratios to evaluate
competing design solutions. (3) Use per-capita measures such as consumption, cost, and resource
needs.
HS.ETS1 Engineering Design
As part of this work, teachers should give students opportunities to model with mathematics
and apply key takeaways from grades 6–8 mathematics:
Modeling. Science examples: (1) Identify variables and select those that represent essential
factors to understand, control, or optimize. (2) Use technology to vary assumptions, explore
consequences, and compare predictions with data.

May 2013 NGSS Release Page 35 of 37
Applying key takeaways from grades 6–8 mathematics. Science example: Work with tolerances,
cost constraints, quantitative impacts, and other quantitative factors in evaluating competing
design solutions.
May 2013 NGSS Release Page 36 of 37
Sources consulted:
http://www.agiweb.org/nacsn/40890_articles_article_file_1641.pdf
http://en.wikipedia.org/wiki/Atomic_mass_unit
http://www.nyc.gov/html/dot/html/about/knowthespeedlimit.shtml
http://learn.genetics.utah.edu/content/begin/cells/scale/
http://learningcenter.nsta.org
http://www.fws.gov/economics/Discussion%20Papers/USFWS_Ecosystem%20Services_Phase
%20I%20Report_04-25-2012.pdf
http://www.teebweb.org/local-and-regional-policy-makers-report/
Richard T. Woodward , Yong-Suhk Wui, The economic value of wetland services: a
metaanalysis. Ecological Economics 37 (2001) 257–270.
http://www.rssweather.com/climate/California/San%20Francisco%20County/
http://www.rssweather.com/climate/California/Sacramento/
http://www.ewg.org/losingground/report/erosion-adds-up.html
http://soils.usda.gov/technical/manual/
http://www.nrcs.usda.gov/wps/portal/nrcs/detail/national/technical/nra/nri/?cid=stelprdb1041887
http://en.wikipedia.org/wiki/Topsoil
http://www.geo.mtu.edu/UPSeis/locating.html
http://www.amazon.com/Complete-Guide-Running-How-Champion/dp/1841261629 http://www.uky.edu/Ag/CritterFiles/casefile/spiders/wolf/wolf.htm
http://libinfo.uark.edu/aas/issues/1964v18/v18a5.pdf
http://www.clemson.edu/extension/natural_resources/wildlife/publications/fs8_cottontail%20rabbit.html
http://serc.carleton.edu/NAGTWorkshops/time/activities/61171.html
http://www.nps.gov/pinn/naturescience/index.htm

May 2013 NGSS Release Page 37 of 37
http://www.thaiscience.info/Article%20for%20ThaiScience/Article/5/Ts-
5%20coastal%20erosion%20and%20mangrove%20progradation%20of%20southern%20thailand.pdf