Embed Size (px)
Citation preview
Keystone XL Project
APPENDIX K
Historical Pipeline Incident Analysis
March 2013

Keystone XL Project
-This page intentionally left blank-
March 2013
Keystone XL Pipeline Project
Historical Pipeline Incident Analysis 1
HISTORICAL PIPELINE INCIDENT ANALYSIS
The detail within the Pipeline and Hazardous Materials Safety Administration (PHMSA) incident and mileage reports was analyzed to show the distribution of historic spill volumes, incident causes, and frequencies of crude oil pipeline incidents in the PHMSA database. This analysis was done to understand what has occurred historically with respect to pipelines in the United States, and to provide input for spill impact analysis in this report. Although the results are not a direct indicator of how the proposed Project will act, it can provide insight into what could potentially occur with respect to spill volume, incident cause, and incident frequency.
1.0 BACKGROUND
The risk assessment of the previously proposed Project Final EIS (see the Supplemental EIS Appendix O, Pipeline Risk Assessment and Environmental Consequence Analysis) cited 1) the volumetric quantities of crude oil spilled in a pipeline spill event; 2) the frequency that such an event occurs; and 3) the causes of the events. PHMSA collects data on hazardous liquid pipeline systems operating in the U.S. These data can be used to provide insight into these three items.
PHMSA collects information that is available to the general public on both reportable pipeline incidents that have occurred and the total length of pipelines in operation from which the incidents have occurred.
Information collected for each incident includes:
• The date of each reportable incident;
• The hazardous liquid commodity associated with the pipeline involved in the incident;
• The volume of hazardous liquid commodity spilled in the incident;
• The part of the pipeline system from which the spill occurred;
• The diameter of the hazardous liquid pipeline involved in the incident; and
• The cause of the incident. The total mileage of pipelines in operation in the United States is collected for each of the following:
• The type of hazardous liquid commodity transported; and
• The diameter of the pipeline. In addition, for each individual pipeline system in operation in the United States, the number of breakout tanks in use is also collected. Defined in this document, linear elements refer to mainline pipe and girth welds and discrete elements are pipeline components such as pumping stations, mainline valves, and breakout tanks.
March 2013
Keystone XL Pipeline Project
Historical Pipeline Incident Analysis 2
1.1 OBJECTIVE
The objective of this data analysis is to use PHMSA hazardous liquid pipeline incident data and hazardous liquid pipeline annual (mileage) data to determine the historical spill volumes, incident causes, and incident frequencies of crude oil pipeline spills in the United States. Additionally, this analysis provides separate determinations for pipeline mainline pipe and pipeline system discrete components.
1.2 METHOD
The method is to filter the PHMSA hazardous liquid incident database covering a fixed period of time by commodity type to obtain a subset of data specific to crude oil pipeline systems. Subsequent filtering by pipeline system component, pipeline diameter, and incident cause results in separate subsets of incident counts and associated reported spill volumes for pipeline mainline pipe, mainline valves, pipeline system tanks, and other discrete pipeline components. The historical spill size distributions and incident cause distributions can then be summarized for the time period covered.
By filtering the pipeline mileage data by commodity type and pipeline diameter, an estimate of the total mileage of pipeline in service over the same fixed time period is made. Dividing the number of incidents by the number of mile-years of pipeline in service provides the frequency of historic incidents per mile-year of pipeline. Dividing the pipeline tank incidents by the number of tanks in service over the time period provides the frequency of historic tank incidents per tank-year.
Finally, by estimating the average spacing of mainline valves and pumping stations on pipeline systems in service, the number of mainline valves and pumping stations in service can be approximated. Dividing the number of mainline valve incidents with the approximate number of mainline valves in service results in an approximate frequency of incidents per valve-year. Similarly, dividing the number of pipeline discrete incidents by the approximate number of pumping stations in service results in an approximate frequency of incidents per pumping station-year.
The number of incidents resulting from each filtering set is documented to provide a quick reference for error checking while performing the analysis.
1.3 ASSUMPTIONS
PHMSA incident and mileage data for the period from January 2002 through July 2012 (10.58 years of data) are sufficient for use and are most applicable to these estimates. Data prior to January 2002 had different reporting requirements and may not provide additional useful information.
Annual mileage for 2002 and 2003 is estimated by assuming each year’s mileage is the same as that for 2004, the first year for which detailed mileage information is provided in the PHMSA data. Accepting the small discrepancies resulting from this simplification (reflecting only 2 out of 10.58 years of data) is preferable to the alternative of not assessing incidents covering the same period which would then reflect only 8.5 years of data.
March 2013
Keystone XL Pipeline Project
Historical Pipeline Incident Analysis 3
The mileage for January through July 2012 is estimated by multiplying the mileage from 2011 by 0.58 (the fraction of a year represented by January through July). Accepting this simplification is preferable to not including the incidents that occurred in January through July of 2012.
All reported database incidents are counted, even if the information was incomplete or unspecified (“blank” or “Unknown”, “Miscellaneous”, and “Other”).
2.0 RESULTS
The summaries show that:
• Spill volumes from the mainline pipeline tend to be larger than spills from discrete elements, other than tanks;
• Spill volumes from larger diameter pipelines tend to be larger than spills from smaller diameter pipelines;
• Spill volumes from pipeline tanks tend to be larger than mainline pipe spills when considering reported pipeline diameters;
• Spill volumes from pipeline tanks tend to be similar to mainline pipe spills for 16-inch and larger diameter pipelines;
• The dominant cause of a release for the mainline pipeline (linear) element is corrosion and outside force;
• Equipment failure is the primary cause for discrete equipment elements; and
• Incorrect operations represent a large proportion of reported incidents for tanks. The PHMSA liquid incident dataset, which includes incidents from hazardous liquid pipelines, can be filtered to include only crude oil pipeline incidents. The PHMSA hazardous liquid pipeline incident data do not detail the type of crude oil (e.g., dilbit, synthetic crude oil [SCO], etc.) involved with each incident, and so the historic incident summaries cannot be specific to dilbit, SCO, or Bakken crude oil, but rather can only be specific to crude oil in general.
The historic incident data can be subdivided allowing historic spill volumes and incident causes from the mainline pipe to be assessed separately from discrete elements such as pumping stations, breakout tanks, valves, and other associated equipment.
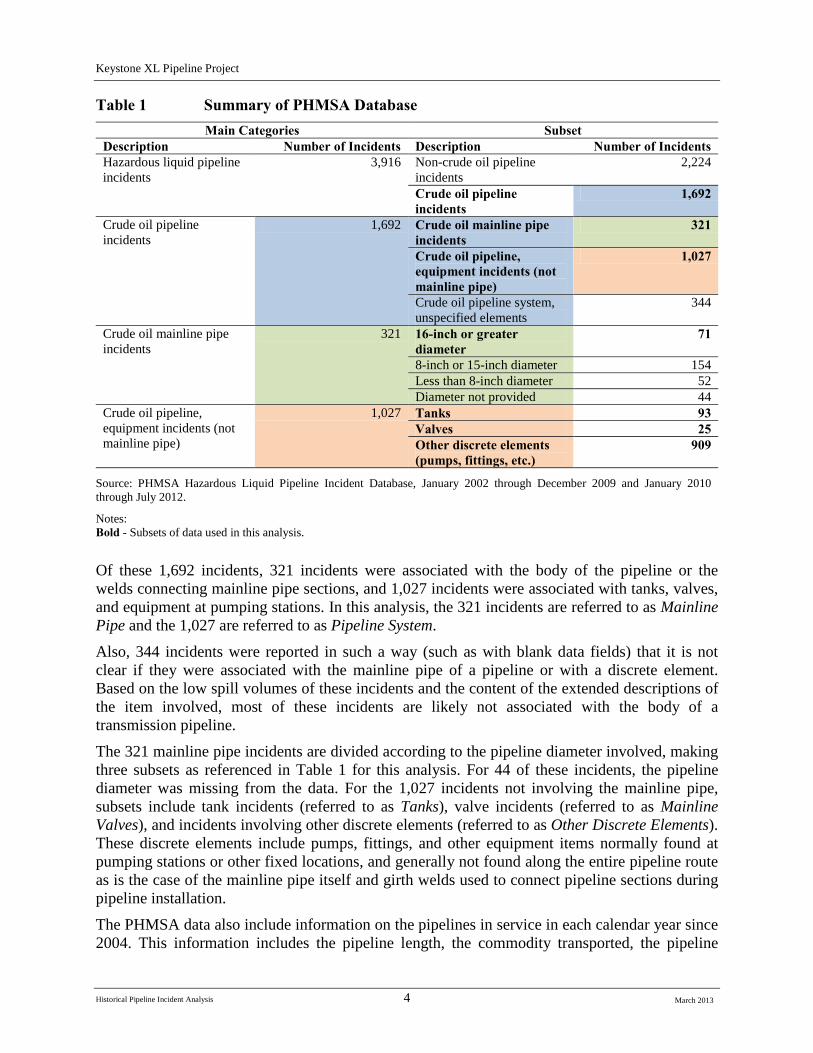
Table 1 is a summary of hazardous liquid pipeline incidents reported to PHMSA for the January 2002 through July 2012 period and shows the incident breakdown by pipeline system element (mainline pipe, tanks, valves, and other discrete equipment items associated with pumping stations or pipeline systems). The incident counts are used to derive historic incident frequencies and spill volume distributions and for referencing incident cause breakdown.
For pipeline components, including the body of the pipeline itself and associated equipment, there were 1,692 reported crude oil incidents out of a total of 3,916 incidents in the entire hazardous liquid pipeline database for the time period referenced. Of the incidents contained in Table 1, the 2,224 incidents not related to crude oil are not salient to this evaluation. The remaining 1,692 incidents involving crude oil are used.
March 2013
Keystone XL Pipeline Project
Historical Pipeline Incident Analysis 4
Table 1 Summary of PHMSA Database Main Categories Subset
Description Number of Incidents Description Number of Incidents Hazardous liquid pipeline incidents
3,916 Non-crude oil pipeline incidents
2,224
Crude oil pipeline incidents
1,692
Crude oil pipeline incidents
1,692 Crude oil mainline pipe incidents
321
Crude oil pipeline, equipment incidents (not mainline pipe)
1,027
Crude oil pipeline system, unspecified elements
344
Crude oil mainline pipe incidents
321 16-inch or greater diameter
71
8-inch or 15-inch diameter 154 Less than 8-inch diameter 52 Diameter not provided 44
Crude oil pipeline, equipment incidents (not mainline pipe)
1,027 Tanks 93 Valves 25 Other discrete elements (pumps, fittings, etc.)
909
Source: PHMSA Hazardous Liquid Pipeline Incident Database, January 2002 through December 2009 and January 2010 through July 2012.
Notes: Bold - Subsets of data used in this analysis.
Of these 1,692 incidents, 321 incidents were associated with the body of the pipeline or the welds connecting mainline pipe sections, and 1,027 incidents were associated with tanks, valves, and equipment at pumping stations. In this analysis, the 321 incidents are referred to as Mainline Pipe and the 1,027 are referred to as Pipeline System.
Also, 344 incidents were reported in such a way (such as with blank data fields) that it is not clear if they were associated with the mainline pipe of a pipeline or with a discrete element. Based on the low spill volumes of these incidents and the content of the extended descriptions of the item involved, most of these incidents are likely not associated with the body of a transmission pipeline.
The 321 mainline pipe incidents are divided according to the pipeline diameter involved, making three subsets as referenced in Table 1 for this analysis. For 44 of these incidents, the pipeline diameter was missing from the data. For the 1,027 incidents not involving the mainline pipe, subsets include tank incidents (referred to as Tanks), valve incidents (referred to as Mainline Valves), and incidents involving other discrete elements (referred to as Other Discrete Elements). These discrete elements include pumps, fittings, and other equipment items normally found at pumping stations or other fixed locations, and generally not found along the entire pipeline route as is the case of the mainline pipe itself and girth welds used to connect pipeline sections during pipeline installation.
The PHMSA data also include information on the pipelines in service in each calendar year since 2004. This information includes the pipeline length, the commodity transported, the pipeline
March 2013
Keystone XL Pipeline Project
diameter, the installation year, and the number of breakout tanks associated with the pipeline. This information is needed to determine the incident rate per mile-year of pipeline and the incident rate per tank-year.
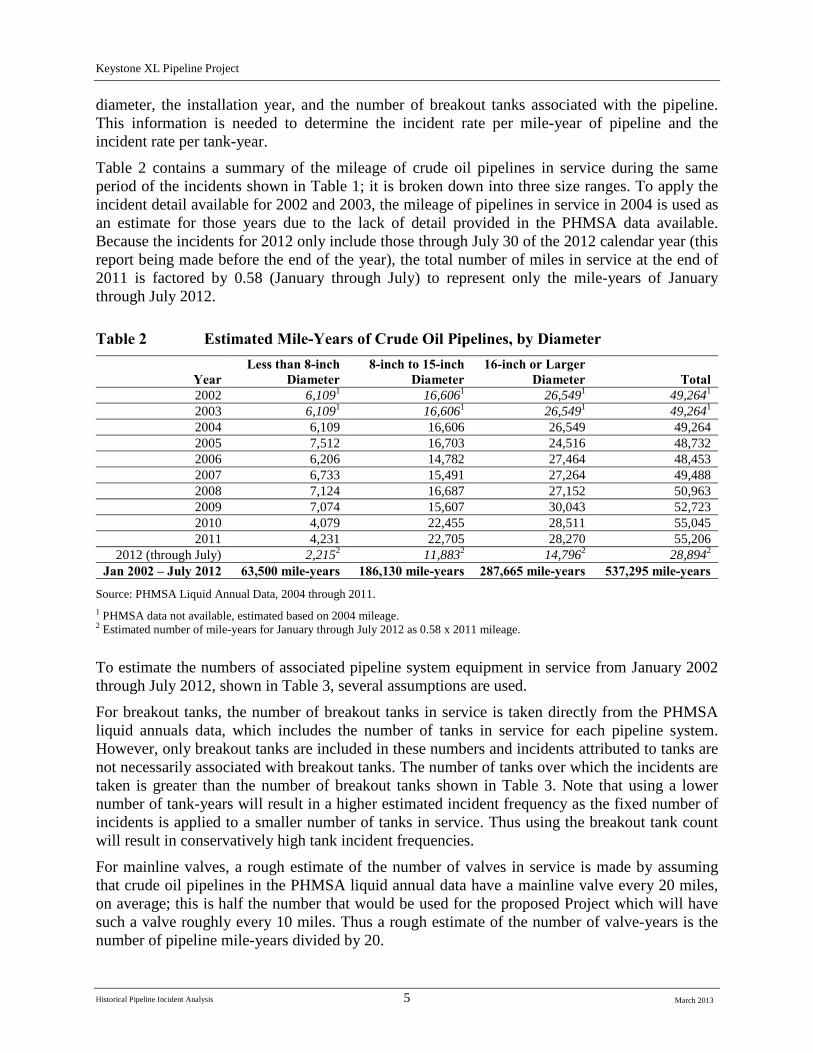
Table 2 contains a summary of the mileage of crude oil pipelines in service during the same period of the incidents shown in Table 1; it is broken down into three size ranges. To apply the incident detail available for 2002 and 2003, the mileage of pipelines in service in 2004 is used as an estimate for those years due to the lack of detail provided in the PHMSA data available. Because the incidents for 2012 only include those through July 30 of the 2012 calendar year (this report being made before the end of the year), the total number of miles in service at the end of 2011 is factored by 0.58 (January through July) to represent only the mile-years of January through July 2012.
Table 2 Estimated Mile-Years of Crude Oil Pipelines, by Diameter
Year Less than 8-inch
Diameter 8-inch to 15-inch
Diameter 16-inch or Larger
Diameter Total 2002 6,1091 16,606 1 26,549 1 49,264 1
2003 6,109 1 16,6061 26,5491 49,2641 2004 6,109 16,606 26,549 49,264 2005 7,512 16,703 24,516 48,732 2006 6,206 14,782 27,464 48,453 2007 6,733 15,491 27,264 49,488 2008 7,124 16,687 27,152 50,963 2009 7,074 15,607 30,043 52,723 2010 4,079 22,455 28,511 55,045 2011 4,231 22,705 28,270 55,206
2012 (through July) 2,2152 11,8832 14,7962 28,8942 Jan 2002 – July 2012
63,500 mile-years 186,130 mile-years 287,665 mile-years 537,295 mile-years
Source: PHMSA Liquid Annual Data, 2004 through 2011. 1 PHMSA data not available, estimated based on 2004 mileage. 2 Estimated number of mile-years for January through July 2012 as 0.58 x 2011 mileage.
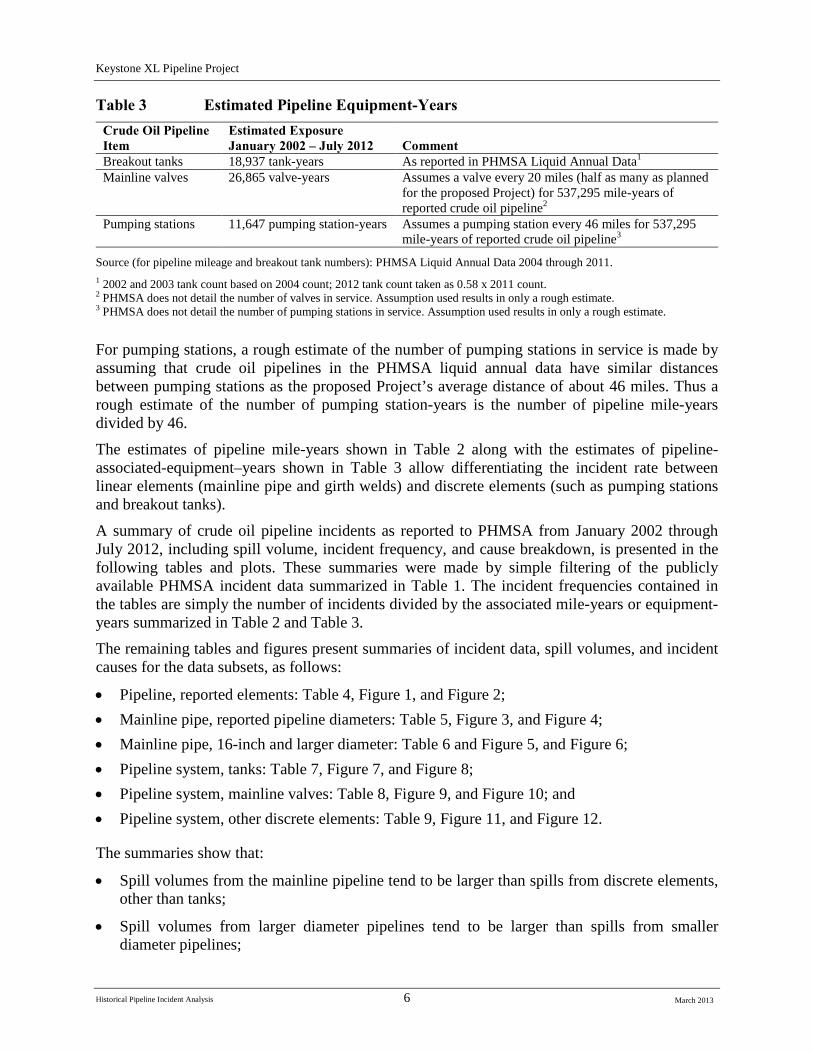
To estimate the numbers of associated pipeline system equipment in service from January 2002 through July 2012, shown in Table 3, several assumptions are used.
For breakout tanks, the number of breakout tanks in service is taken directly from the PHMSA liquid annuals data, which includes the number of tanks in service for each pipeline system. However, only breakout tanks are included in these numbers and incidents attributed to tanks are not necessarily associated with breakout tanks. The number of tanks over which the incidents are taken is greater than the number of breakout tanks shown in Table 3. Note that using a lower number of tank-years will result in a higher estimated incident frequency as the fixed number of incidents is applied to a smaller number of tanks in service. Thus using the breakout tank count will result in conservatively high tank incident frequencies.
For mainline valves, a rough estimate of the number of valves in service is made by assuming that crude oil pipelines in the PHMSA liquid annual data have a mainline valve every 20 miles, on average; this is half the number that would be used for the proposed Project which will have such a valve roughly every 10 miles. Thus a rough estimate of the number of valve-years is the number of pipeline mile-years divided by 20.
Historical Pipeline Incident Analysis 5 March 2013
Keystone XL Pipeline Project
Table 3 Estimated Pipeline Equipment-Years
Crude Oil Pipeline Item
Estimated Exposure January 2002 – July 2012 Comment
Breakout tanks 18,937 tank-years As reported in PHMSA Liquid Annual Data1 Mainline valves 26,865 valve-years Assumes a valve every 20 miles (half as many as planned
for the proposed Project) for 537,295 mile-years of reported crude oil pipeline2
Pumping stations 11,647 pumping station-years Assumes a pumping station every 46 miles for 537,295 mile-years of reported crude oil pipeline3
Source (for pipeline mileage and breakout tank numbers): PHMSA Liquid Annual Data 2004 through 2011. 1 2002 and 2003 tank count based on 2004 count; 2012 tank count taken as 0.58 x 2011 count. 2 PHMSA does not detail the number of valves in service. Assumption used results in only a rough estimate. 3 PHMSA does not detail the number of pumping stations in service. Assumption used results in only a rough estimate.
For pumping stations, a rough estimate of the number of pumping stations in service is made by assuming that crude oil pipelines in the PHMSA liquid annual data have similar distances between pumping stations as the proposed Project’s average distance of about 46 miles. Thus a rough estimate of the number of pumping station-years is the number of pipeline mile-years divided by 46.
The estimates of pipeline mile-years shown in Table 2 along with the estimates of pipeline-associated-equipment–years shown in Table 3 allow differentiating the incident rate between linear elements (mainline pipe and girth welds) and discrete elements (such as pumping stations and breakout tanks).
A summary of crude oil pipeline incidents as reported to PHMSA from January 2002 through July 2012, including spill volume, incident frequency, and cause breakdown, is presented in the following tables and plots. These summaries were made by simple filtering of the publicly available PHMSA incident data summarized in Table 1. The incident frequencies contained in the tables are simply the number of incidents divided by the associated mile-years or equipment-years summarized in Table 2 and Table 3. The remaining tables and figures present summaries of incident data, spill volumes, and incident causes for the data subsets, as follows:
• Pipeline, reported elements: Table 4, Figure 1, and Figure 2; • Mainline pipe, reported pipeline diameters: Table 5, Figure 3, and Figure 4; • Mainline pipe, 16-inch and larger diameter: Table 6 and Figure 5, and Figure 6; • Pipeline system, tanks: Table 7, Figure 7, and Figure 8; • Pipeline system, mainline valves: Table 8, Figure 9, and Figure 10; and • Pipeline system, other discrete elements: Table 9, Figure 11, and Figure 12.
The summaries show that:
• Spill volumes from the mainline pipeline tend to be larger than spills from discrete elements, other than tanks;
• Spill volumes from larger diameter pipelines tend to be larger than spills from smaller diameter pipelines;
Historical Pipeline Incident Analysis 6 March 2013
Keystone XL Pipeline Project
Historical Pipeline Incident Analysis 7
• Spill volumes from pipeline tanks tend to be larger than mainline pipe spills when considering reported pipeline diameters;
• Spill volumes from pipeline tanks tend to be similar to mainline pipe spills for 16 inch and larger diameter pipelines;
• The dominant cause for a release for the mainline pipeline (linear) element is corrosion and outside force;
• Equipment failure is the primary cause for discrete equipment elements; and
• Incorrect operations represent a large proportion of reported incidents for tanks.
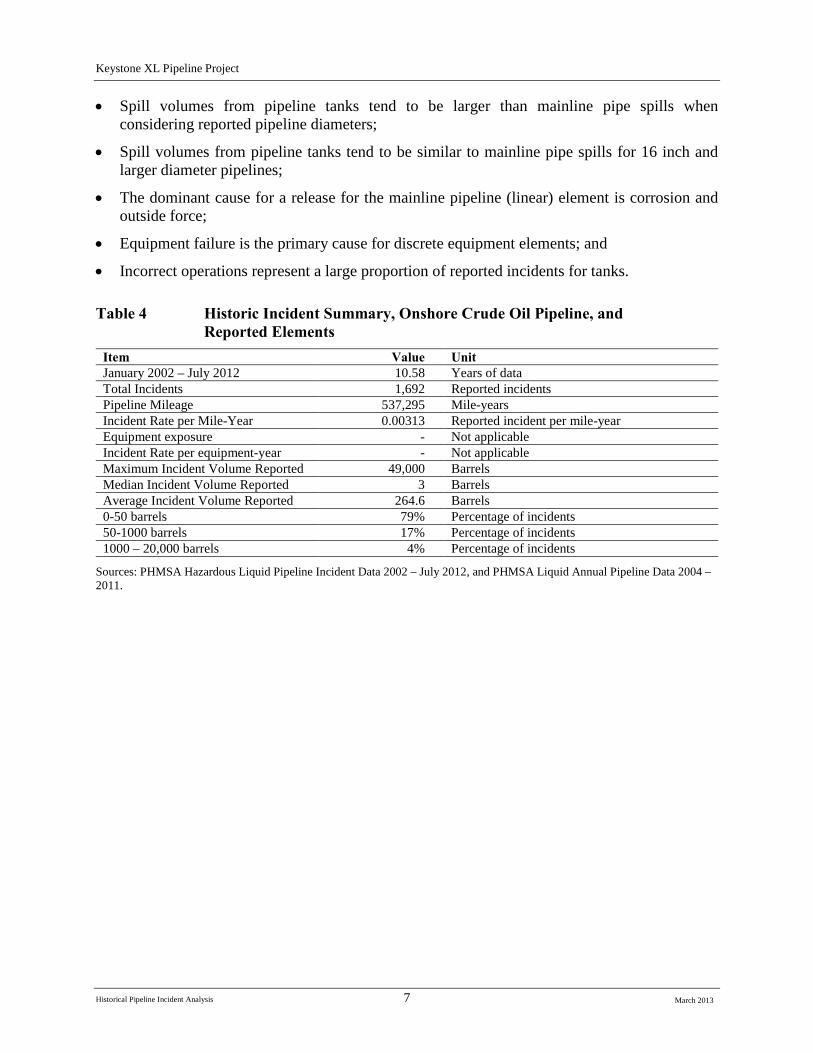
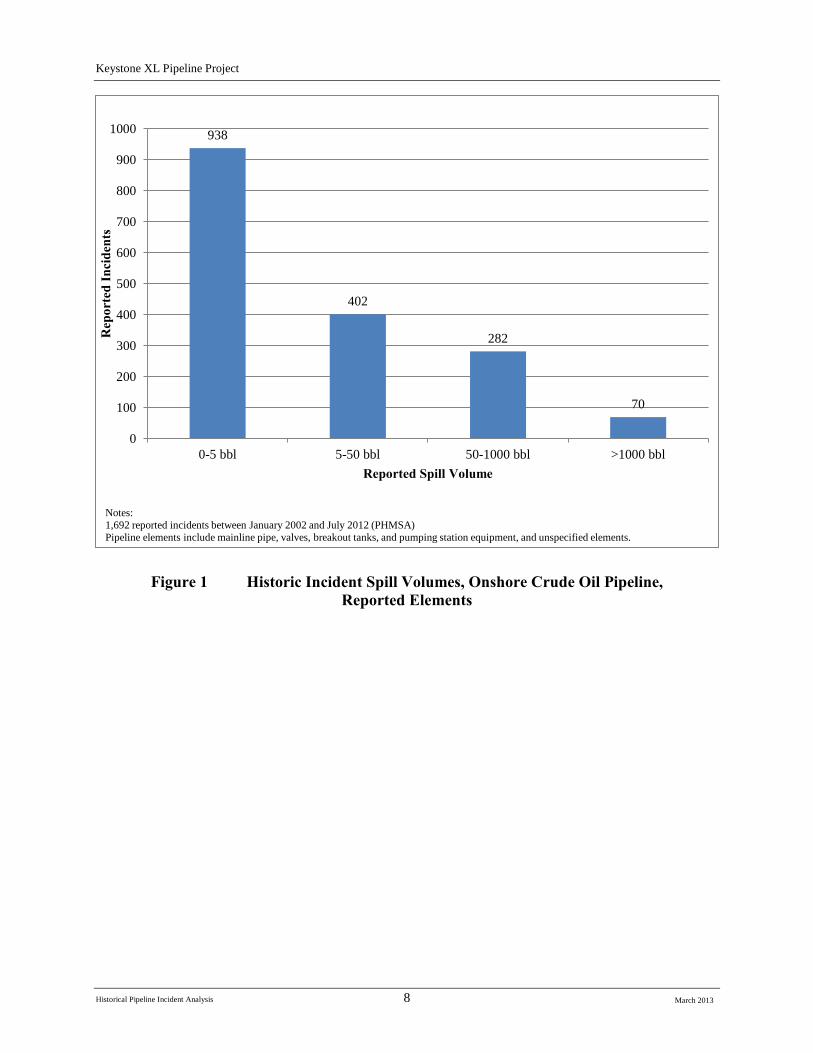
Table 4 Historic Incident Summary, Onshore Crude Oil Pipeline, and Reported Elements
Item Value Unit January 2002 – July 2012 10.58 Years of data Total Incidents 1,692 Reported incidents Pipeline Mileage 537,295 Mile-years Incident Rate per Mile-Year 0.00313 Reported incident per mile-year Equipment exposure - Not applicable Incident Rate per equipment-year - Not applicable Maximum Incident Volume Reported 49,000 Barrels Median Incident Volume Reported 3 Barrels Average Incident Volume Reported 264.6 Barrels 0-50 barrels 79% Percentage of incidents 50-1000 barrels 17% Percentage of incidents 1000 – 20,000 barrels 4% Percentage of incidents
Sources: PHMSA Hazardous Liquid Pipeline Incident Data 2002 – July 2012, and PHMSA Liquid Annual Pipeline Data 2004 – 2011.
March 2013
Keystone XL Pipeline Project
938
402
282
70
0
100
200
300
400
500
600
700
800
900
1000
0-5 bbl 5-50 bbl 50-1000 bbl >1000 bbl
Rep
orte
d In
cide
nts
Reported Spill Volume
Notes: 1,692 reported incidents between January 2002 and July 2012 (PHMSA) Pipeline elements include mainline pipe, valves, breakout tanks, and pumping station equipment, and unspecified elements.
Figure 1 Historic Incident Spill Volumes, Onshore Crude Oil Pipeline, Reported Elements
Historical Pipeline Incident Analysis 8
March 2013
Keystone XL Pipeline Project
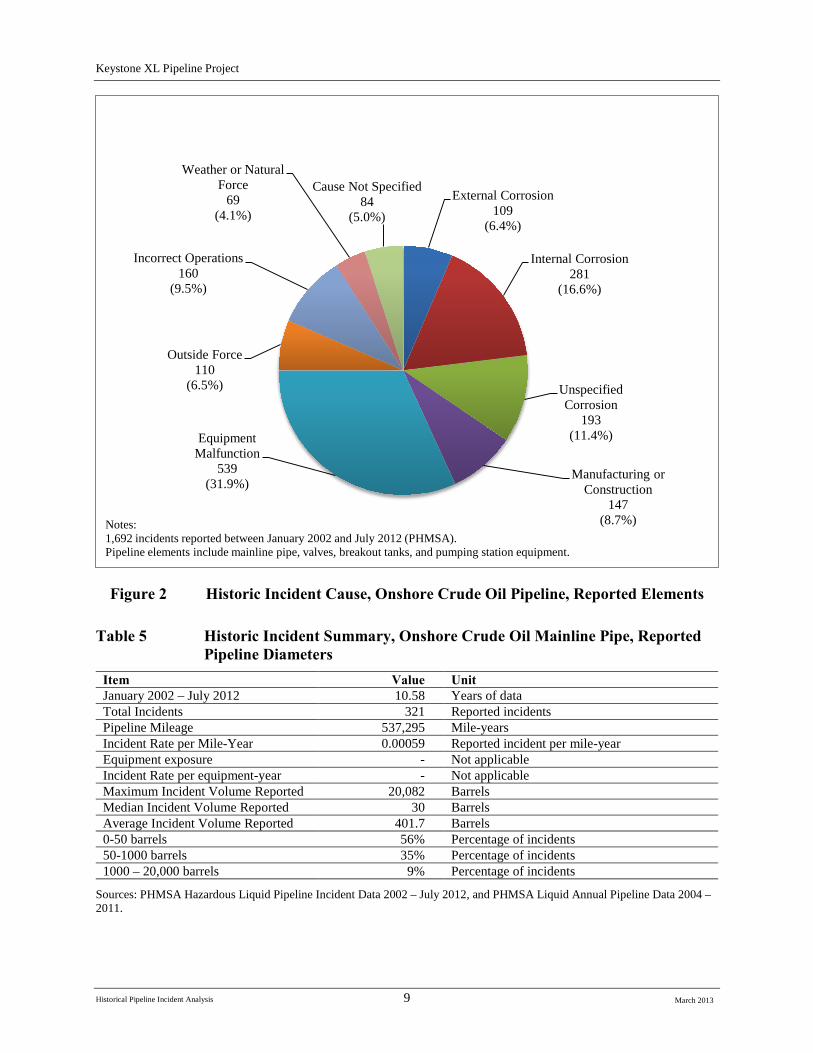
External Corrosion 109
(6.4%)
Internal Corrosion 281
(16.6%)
Unspecified Corrosion
193 (11.4%)
Manufacturing or Construction
147 (8.7%)
Equipment Malfunction
539 (31.9%)
Outside Force 110
(6.5%)
Incorrect Operations 160
(9.5%)
Weather or Natural Force
69 (4.1%)
Cause Not Specified 84
(5.0%)
Notes: 1,692 incidents reported between January 2002 and July 2012 (PHMSA). Pipeline elements include mainline pipe, valves, breakout tanks, and pumping station equipment.
Figure 2 Historic Incident Cause, Onshore Crude Oil Pipeline, Reported Elements
Table 5 Historic Incident Summary, Onshore Crude Oil Mainline Pipe, Reported Pipeline Diameters
Item Value Unit January 2002 – July 2012 10.58 Years of data Total Incidents 321 Reported incidents Pipeline Mileage 537,295 Mile-years Incident Rate per Mile-Year 0.00059 Reported incident per mile-year Equipment exposure - Not applicable Incident Rate per equipment-year - Not applicable Maximum Incident Volume Reported 20,082 Barrels Median Incident Volume Reported 30 Barrels Average Incident Volume Reported 401.7 Barrels 0-50 barrels 56% Percentage of incidents 50-1000 barrels 35% Percentage of incidents 1000 – 20,000 barrels 9% Percentage of incidents
Sources: PHMSA Hazardous Liquid Pipeline Incident Data 2002 – July 2012, and PHMSA Liquid Annual Pipeline Data 2004 – 2011.
Historical Pipeline Incident Analysis 9 March 2013
Keystone XL Pipeline Project
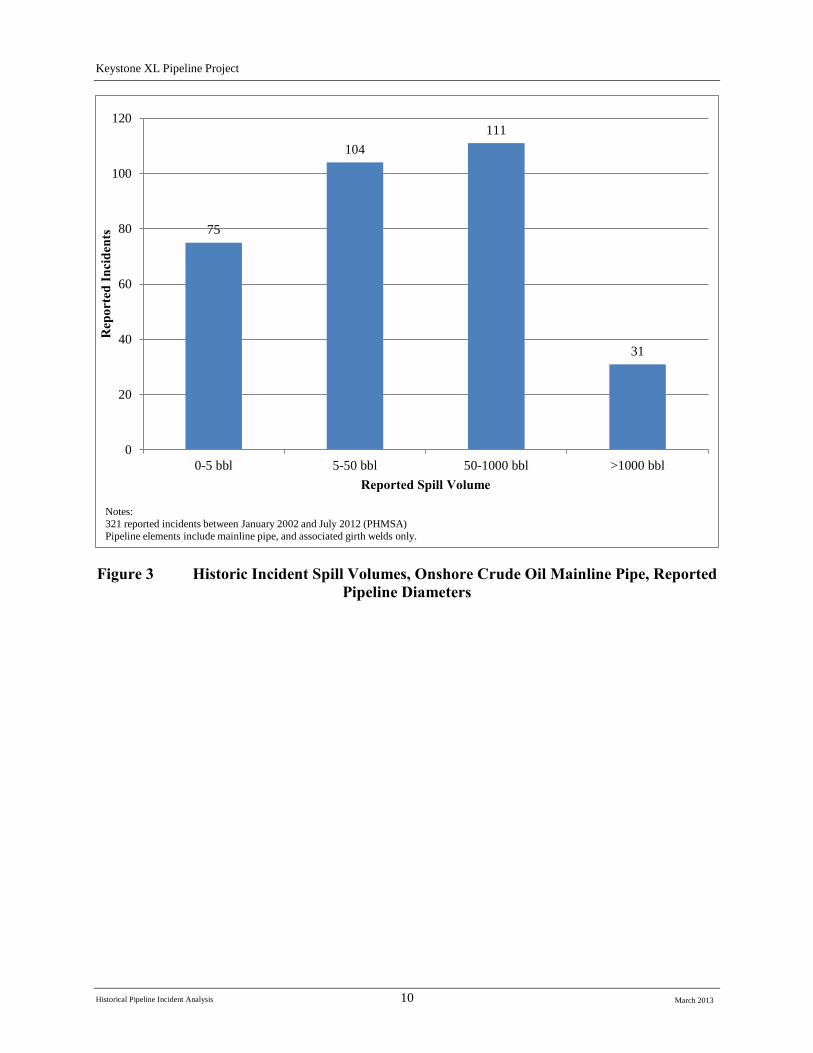
75
104 111
31
0
20
40
60
80
100
120
0-5 bbl 5-50 bbl 50-1000 bbl >1000 bbl
Rep
orte
d In
cide
nts
Reported Spill Volume
Notes: 321 reported incidents between January 2002 and July 2012 (PHMSA) Pipeline elements include mainline pipe, and associated girth welds only.
Figure 3 Historic Incident Spill Volumes, Onshore Crude Oil Mainline Pipe, Reported Pipeline Diameters
Historical Pipeline Incident Analysis 10 March 2013
Keystone XL Pipeline Project
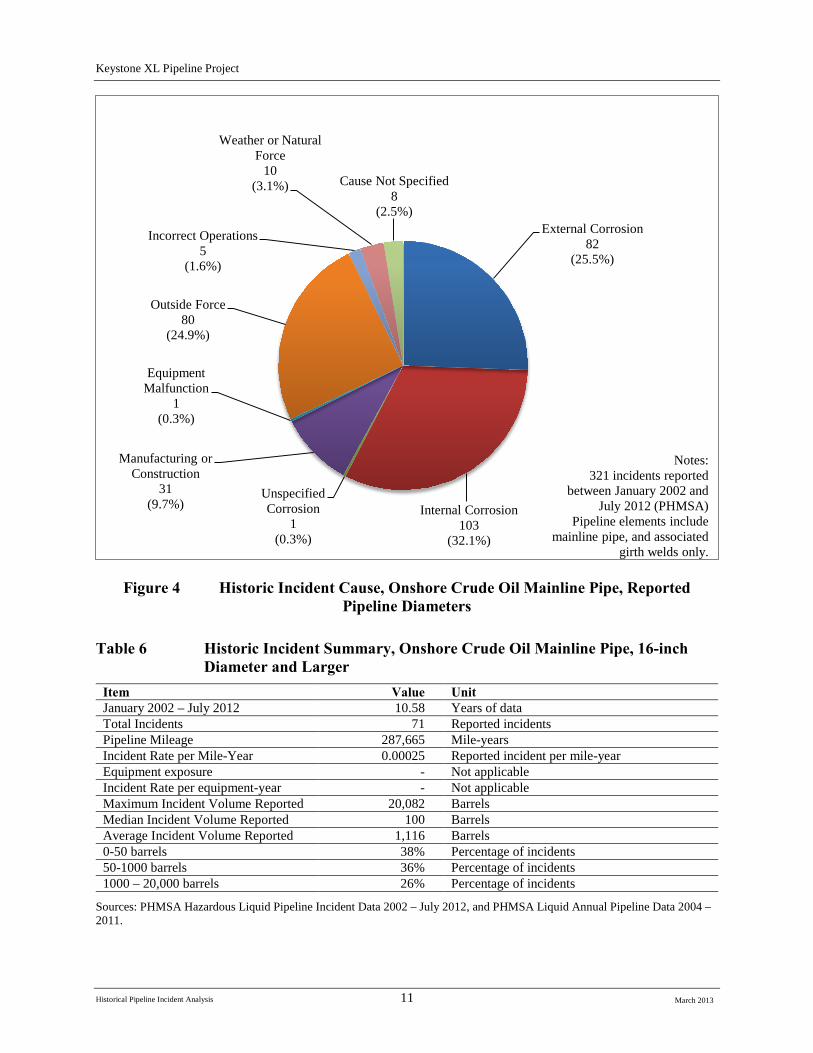
External Corrosion 82
(25.5%)
Equipment Malfunction
1 (0.3%)
Outside Force 80
(24.9%)
Incorrect Operations 5
(1.6%)
Weather or Natural Force
10 (3.1%) Cause Not Specified
8 (2.5%)
Manufacturing or Construction
31 (9.7%)
Unspecified Corrosion
1 (0.3%)
Internal Corrosion 103
(32.1%)
Notes: 321 incidents reported
between January 2002 and July 2012 (PHMSA)
Pipeline elements include mainline pipe, and associated
girth welds only.
Historical Pipeline Incident Analysis 11
Figure 4 Historic Incident Cause, Onshore Crude Oil Mainline Pipe, Reported Pipeline Diameters
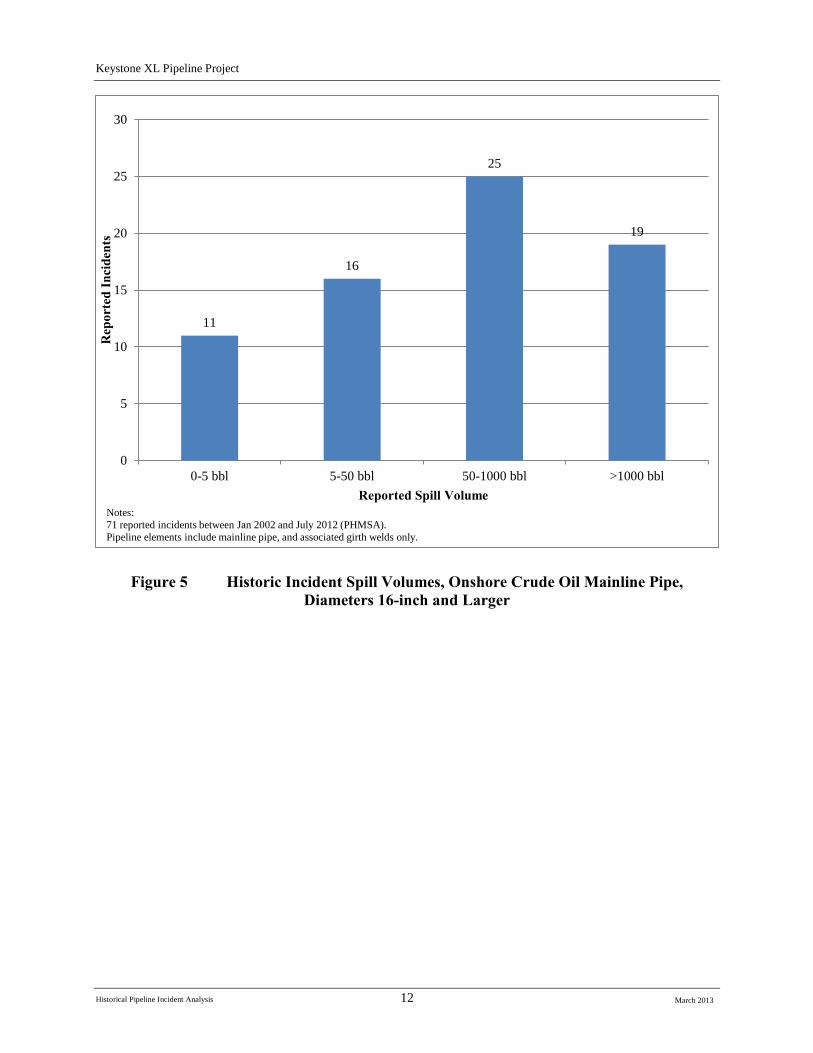
Table 6 Historic Incident Summary, Onshore Crude Oil Mainline Pipe, 16-inch Diameter and Larger
Item Value Unit January 2002 – July 2012 10.58 Years of data Total Incidents 71 Reported incidents Pipeline Mileage 287,665 Mile-years Incident Rate per Mile-Year 0.00025 Reported incident per mile-year Equipment exposure - Not applicable Incident Rate per equipment-year - Not applicable Maximum Incident Volume Reported 20,082 Barrels Median Incident Volume Reported 100 Barrels Average Incident Volume Reported 1,116 Barrels 0-50 barrels 38% Percentage of incidents 50-1000 barrels 36% Percentage of incidents 1000 – 20,000 barrels 26% Percentage of incidents
Sources: PHMSA Hazardous Liquid Pipeline Incident Data 2002 – July 2012, and PHMSA Liquid Annual Pipeline Data 2004 – 2011.
March 2013
Keystone XL Pipeline Project
11
16
25
19
0
5
10
15
20
25
30
0-5 bbl 5-50 bbl 50-1000 bbl >1000 bbl
Rep
orte
d In
cide
nts
Reported Spill Volume Notes: 71 reported incidents between Jan 2002 and July 2012 (PHMSA). Pipeline elements include mainline pipe, and associated girth welds only.
Figure 5 Historic Incident Spill Volumes, Onshore Crude Oil Mainline Pipe, Diameters 16-inch and Larger
Historical Pipeline Incident Analysis 12 March 2013
Keystone XL Pipeline Project
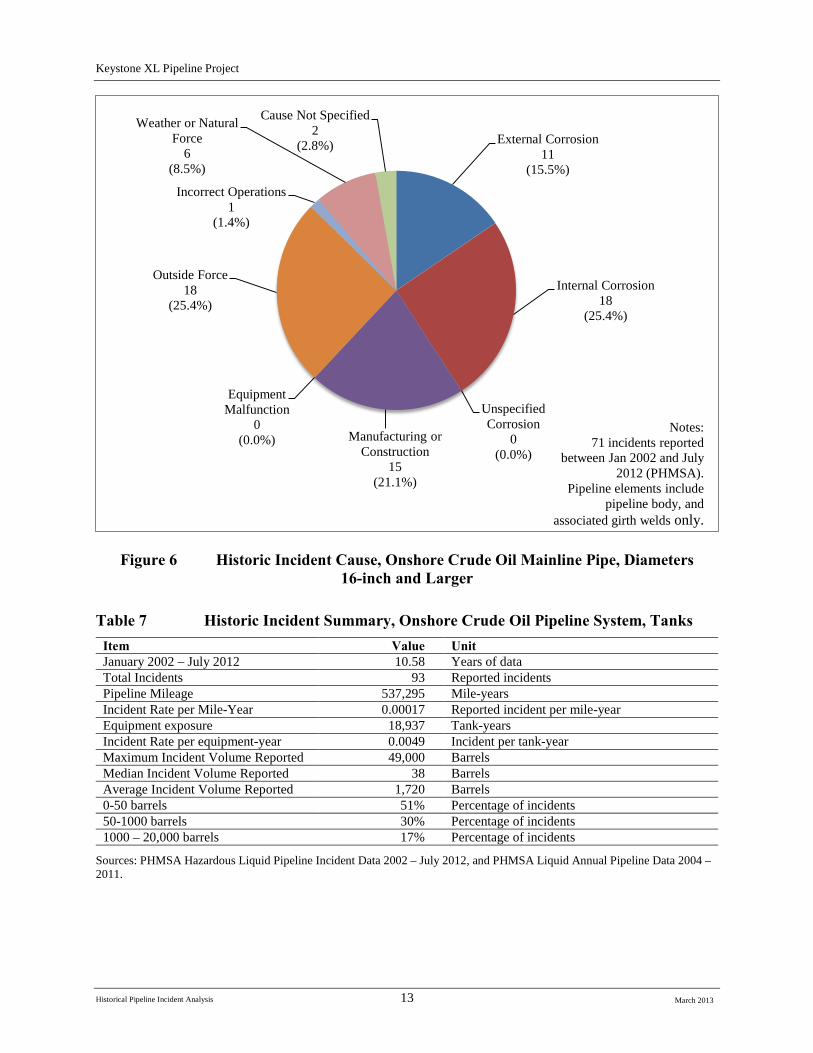
External Corrosion 11
(15.5%)
Internal Corrosion 18
(25.4%)
Unspecified Corrosion
0 (0.0%)
Manufacturing or Construction
15 (21.1%)
Equipment Malfunction
0 (0.0%)
Outside Force 18
(25.4%)
Incorrect Operations 1
(1.4%)
Weather or Natural Force
6 (8.5%)
Cause Not Specified 2
(2.8%)
Notes: 71 incidents reported
between Jan 2002 and July 2012 (PHMSA).
Pipeline elements include pipeline body, and
associated girth welds only.
Figure 6 Historic Incident Cause, Onshore Crude Oil Mainline Pipe, Diameters 16-inch and Larger
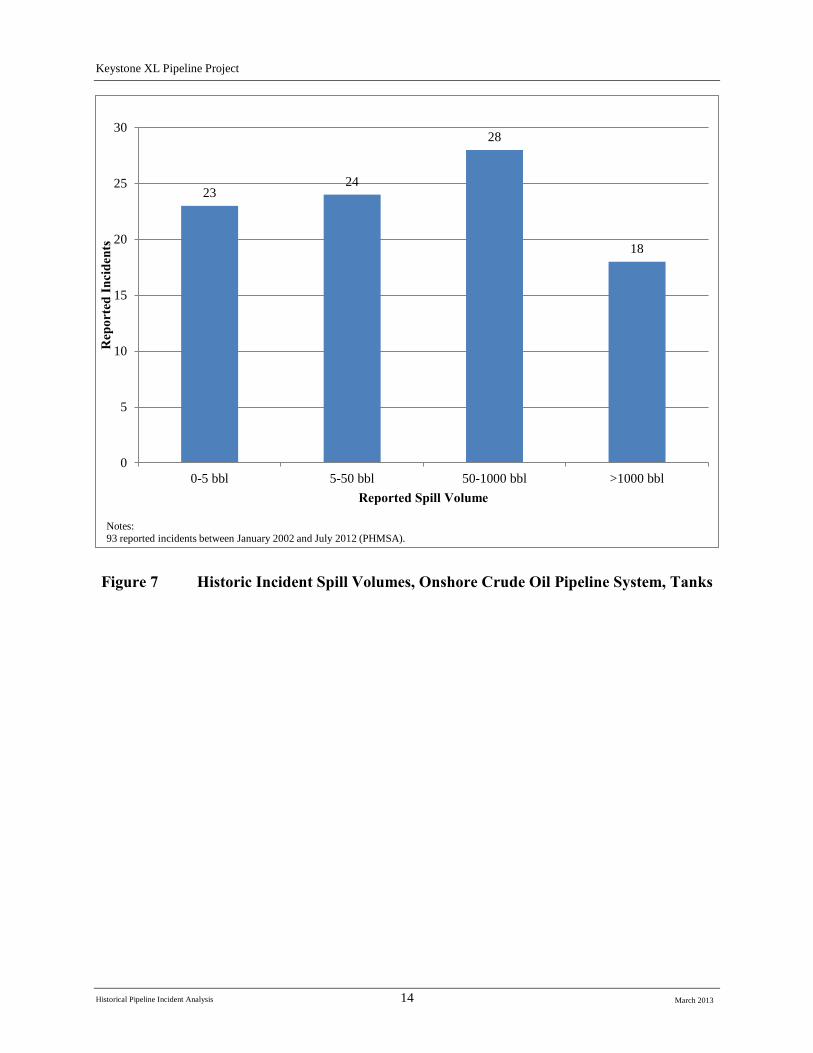
Table 7 Historic Incident Summary, Onshore Crude Oil Pipeline System, Tanks Item Value Unit January 2002 – July 2012 10.58 Years of data Total Incidents 93 Reported incidents Pipeline Mileage 537,295 Mile-years Incident Rate per Mile-Year 0.00017 Reported incident per mile-year Equipment exposure 18,937 Tank-years Incident Rate per equipment-year 0.0049 Incident per tank-year Maximum Incident Volume Reported 49,000 Barrels Median Incident Volume Reported 38 Barrels Average Incident Volume Reported 1,720 Barrels 0-50 barrels 51% Percentage of incidents 50-1000 barrels 30% Percentage of incidents 1000 – 20,000 barrels 17% Percentage of incidents
Sources: PHMSA Hazardous Liquid Pipeline Incident Data 2002 – July 2012, and PHMSA Liquid Annual Pipeline Data 2004 – 2011.
Historical Pipeline Incident Analysis 13 March 2013
Keystone XL Pipeline Project
23 24
28
18
0
5
10
15
20
25
30
0-5 bbl 5-50 bbl 50-1000 bbl >1000 bbl
Rep
orte
d In
cide
nts
Reported Spill Volume
Notes: 93 reported incidents between January 2002 and July 2012 (PHMSA).
Figure 7 Historic Incident Spill Volumes, Onshore Crude Oil Pipeline System, Tanks
Historical Pipeline Incident Analysis 14 March 2013
Keystone XL Pipeline Project
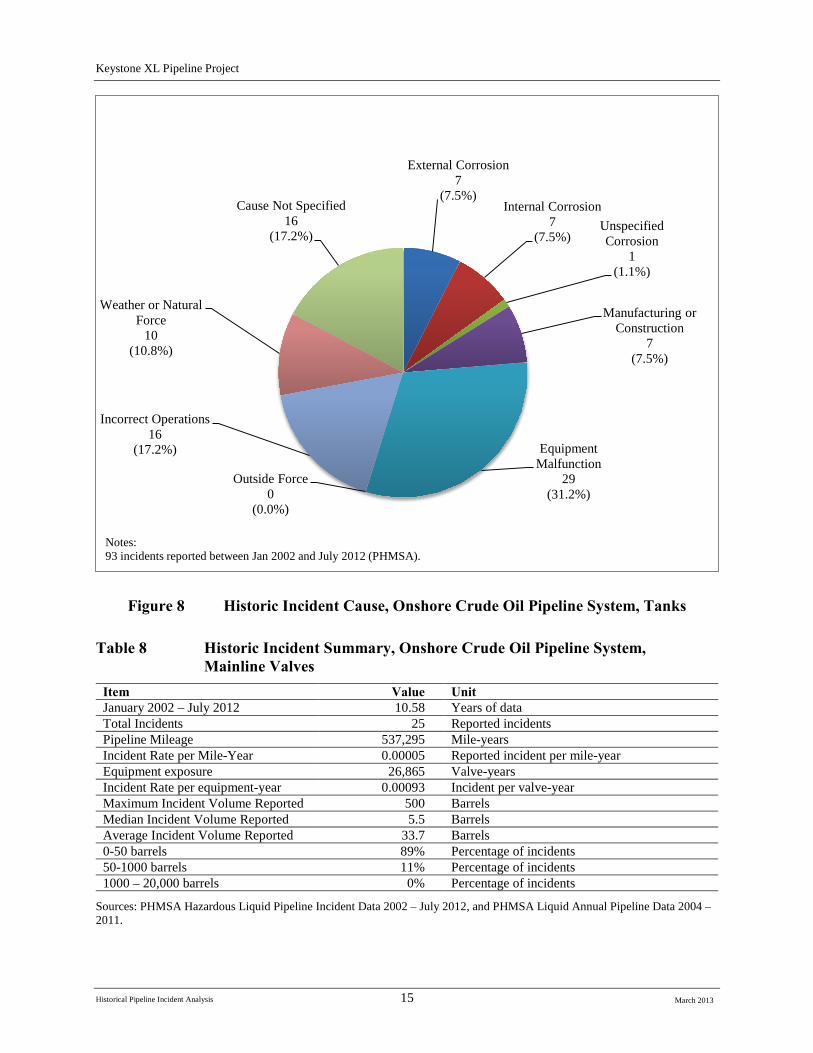
External Corrosion 7
(7.5%) Internal Corrosion
7 (7.5%)
Unspecified Corrosion
1 (1.1%)
Manufacturing or Construction
7 (7.5%)
Equipment Malfunction
29 (31.2%)
Outside Force 0
(0.0%)
Incorrect Operations 16
(17.2%)
Weather or Natural Force
10 (10.8%)
Cause Not Specified 16
(17.2%)
Notes: 93 incidents reported between Jan 2002 and July 2012 (PHMSA).
Figure 8 Historic Incident Cause, Onshore Crude Oil Pipeline System, Tanks
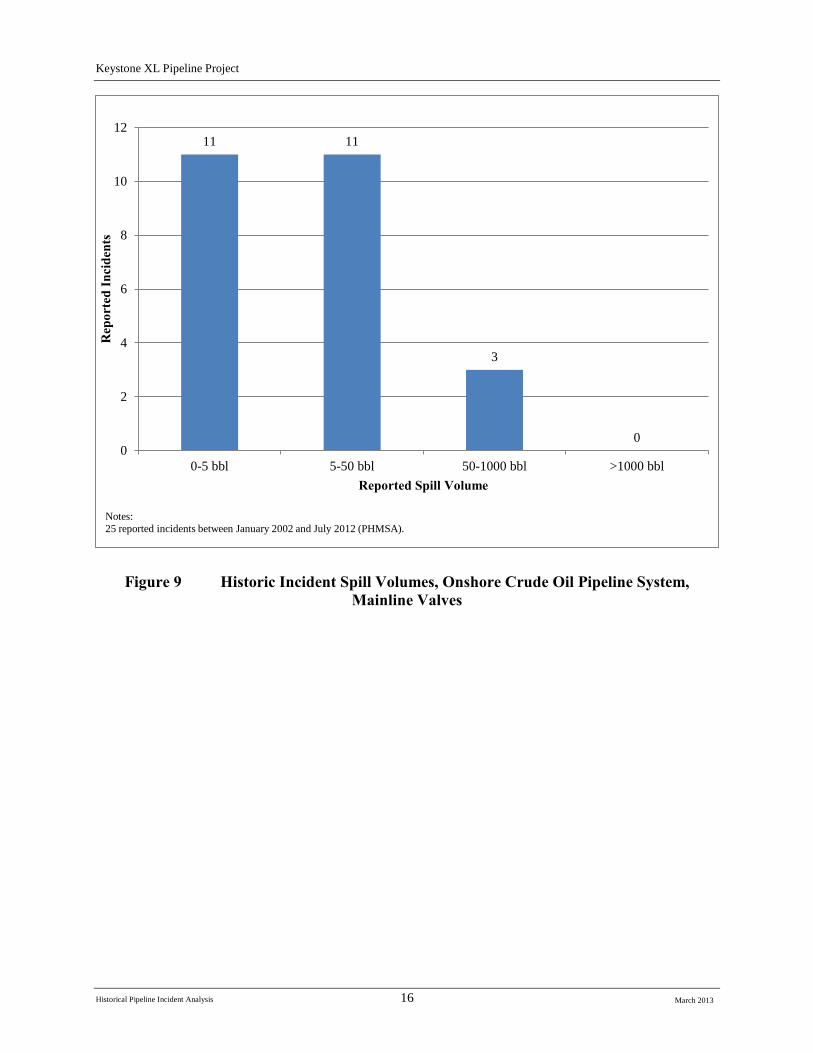
Table 8 Historic Incident Summary, Onshore Crude Oil Pipeline System, Mainline Valves
Item Value Unit January 2002 – July 2012 10.58 Years of data Total Incidents 25 Reported incidents Pipeline Mileage 537,295 Mile-years Incident Rate per Mile-Year 0.00005 Reported incident per mile-year Equipment exposure 26,865 Valve-years Incident Rate per equipment-year 0.00093 Incident per valve-year Maximum Incident Volume Reported 500 Barrels Median Incident Volume Reported 5.5 Barrels Average Incident Volume Reported 33.7 Barrels 0-50 barrels 89% Percentage of incidents 50-1000 barrels 11% Percentage of incidents 1000 – 20,000 barrels 0% Percentage of incidents
Sources: PHMSA Hazardous Liquid Pipeline Incident Data 2002 – July 2012, and PHMSA Liquid Annual Pipeline Data 2004 – 2011.
Historical Pipeline Incident Analysis 15 March 2013
Keystone XL Pipeline Project
11 11
3
0 0
2
4
6
8
10
12
0-5 bbl 5-50 bbl 50-1000 bbl >1000 bbl
Rep
orte
d In
cide
nts
Reported Spill Volume
Notes: 25 reported incidents between January 2002 and July 2012 (PHMSA).
Historical Pipeline Incident Analysis 16
Figure 9 Historic Incident Spill Volumes, Onshore Crude Oil Pipeline System, Mainline Valves
March 2013
Keystone XL Pipeline Project
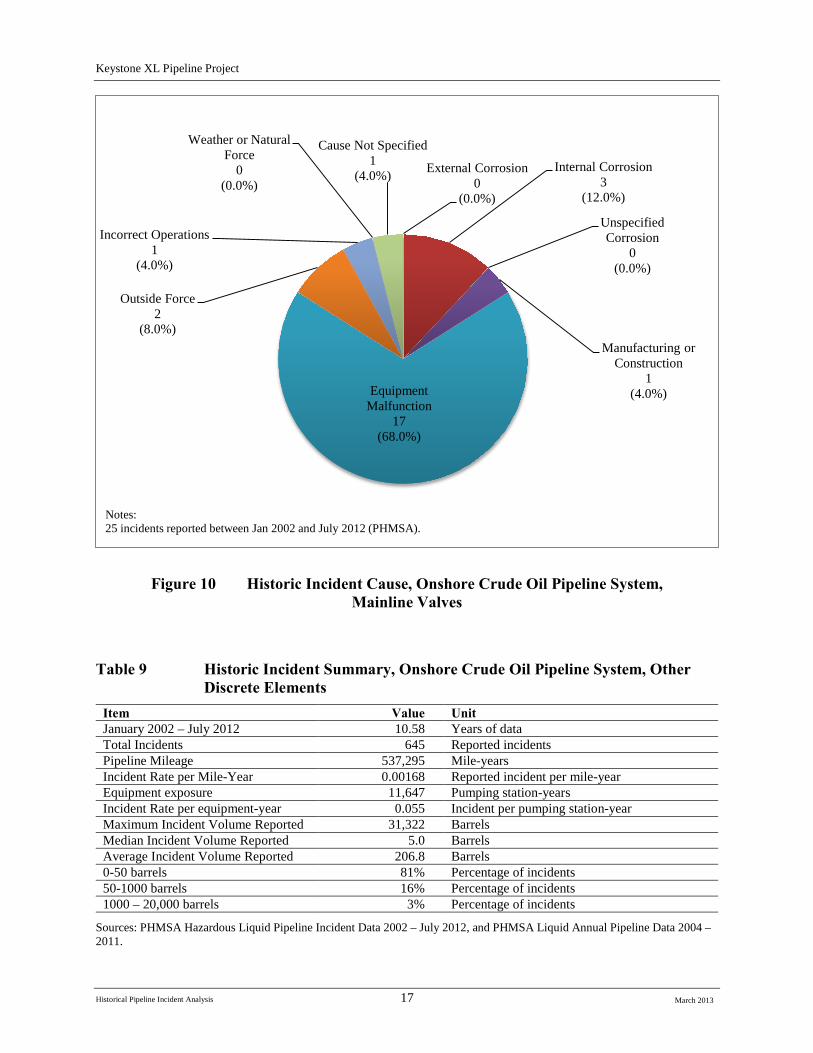
External Corrosion 0
(0.0%)
Internal Corrosion 3
(12.0%)
Unspecified Corrosion
0 (0.0%)
Manufacturing or Construction
1 (4.0%) Equipment
Malfunction 17
(68.0%)
Outside Force 2
(8.0%)
Incorrect Operations 1
(4.0%)
Weather or Natural Force
0 (0.0%)
Cause Not Specified 1
(4.0%)
Notes: 25 incidents reported between Jan 2002 and July 2012 (PHMSA).
Historical Pipeline Incident Analysis 17
Figure 10 Historic Incident Cause, Onshore Crude Oil Pipeline System, Mainline Valves
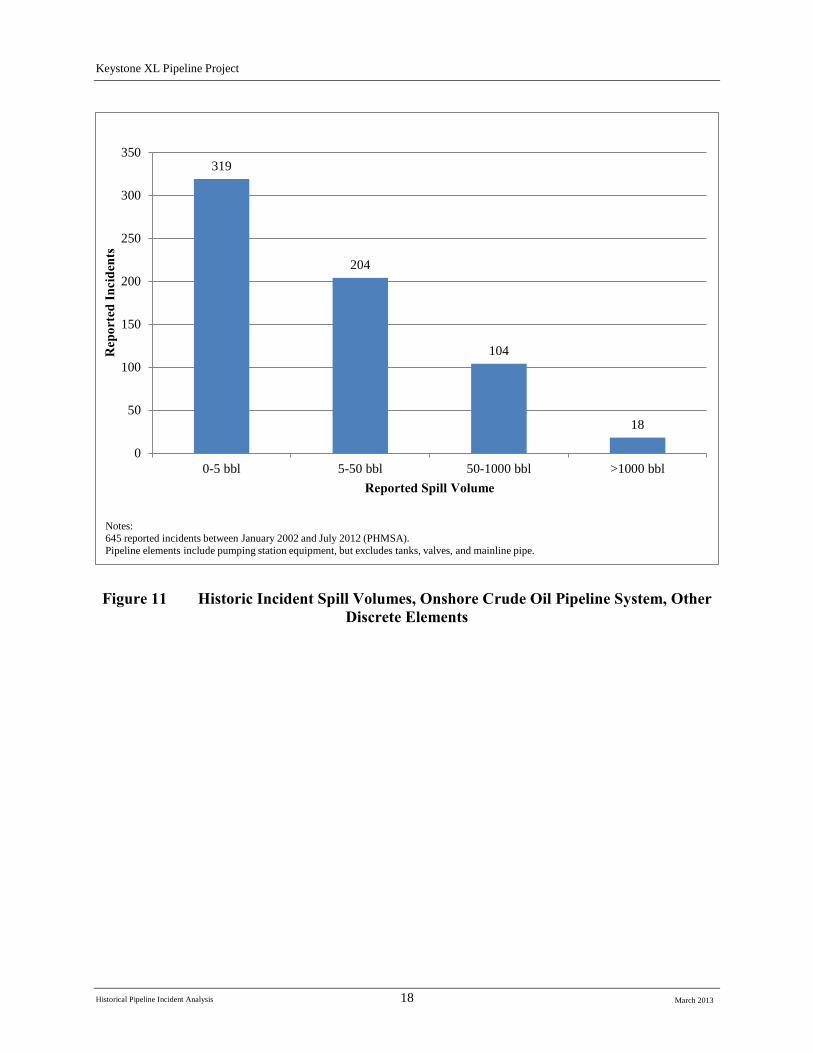
Table 9 Historic Incident Summary, Onshore Crude Oil Pipeline System, Other Discrete Elements
Item Value Unit January 2002 – July 2012 10.58 Years of data Total Incidents 645 Reported incidents Pipeline Mileage 537,295 Mile-years Incident Rate per Mile-Year 0.00168 Reported incident per mile-year Equipment exposure 11,647 Pumping station-years Incident Rate per equipment-year 0.055 Incident per pumping station-year Maximum Incident Volume Reported 31,322 Barrels Median Incident Volume Reported 5.0 Barrels Average Incident Volume Reported 206.8 Barrels 0-50 barrels 81% Percentage of incidents 50-1000 barrels 16% Percentage of incidents 1000 – 20,000 barrels 3% Percentage of incidents
Sources: PHMSA Hazardous Liquid Pipeline Incident Data 2002 – July 2012, and PHMSA Liquid Annual Pipeline Data 2004 – 2011.
March 2013
Keystone XL Pipeline Project
319
204
104
18
0
50
100
150
200
250
300
350
0-5 bbl 5-50 bbl 50-1000 bbl >1000 bbl
Rep
orte
d In
cide
nts
Reported Spill Volume
Notes: 645 reported incidents between January 2002 and July 2012 (PHMSA). Pipeline elements include pumping station equipment, but excludes tanks, valves, and mainline pipe.
Figure 11 Historic Incident Spill Volumes, Onshore Crude Oil Pipeline System, Other Discrete Elements
Historical Pipeline Incident Analysis 18 March 2013
Keystone XL Pipeline Project
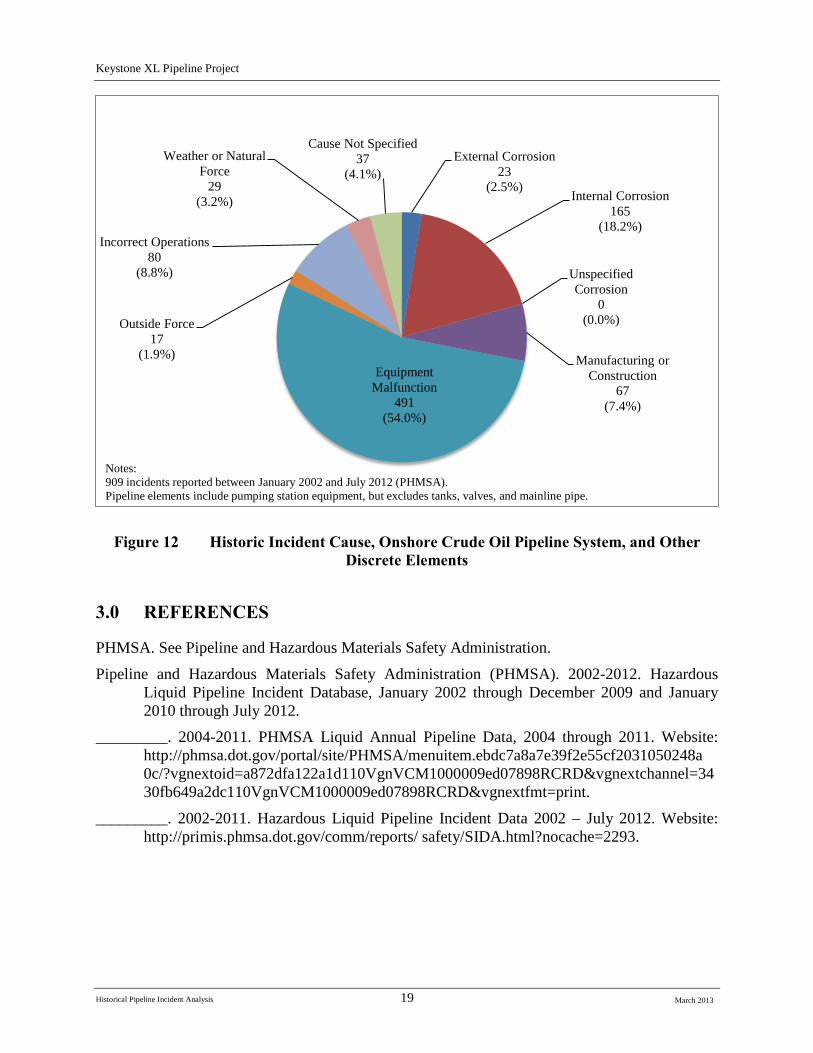
External Corrosion 23
(2.5%) Internal Corrosion
165 (18.2%)
Unspecified Corrosion
0 (0.0%)
Manufacturing or Construction
67 (7.4%)
Equipment Malfunction
491 (54.0%)
Outside Force 17
(1.9%)
Incorrect Operations 80
(8.8%)
Weather or Natural Force
29 (3.2%)
Cause Not Specified 37
(4.1%)
Notes: 909 incidents reported between January 2002 and July 2012 (PHMSA). Pipeline elements include pumping station equipment, but excludes tanks, valves, and mainline pipe.
Figure 12 Historic Incident Cause, Onshore Crude Oil Pipeline System, and Other Discrete Elements
3.0 REFERENCES
PHMSA. See Pipeline and Hazardous Materials Safety Administration.
Pipeline and Hazardous Materials Safety Administration (PHMSA). 2002-2012. Hazardous Liquid Pipeline Incident Database, January 2002 through December 2009 and January 2010 through July 2012.
_________. 2004-2011. PHMSA Liquid Annual Pipeline Data, 2004 through 2011. Website: http://phmsa.dot.gov/portal/site/PHMSA/menuitem.ebdc7a8a7e39f2e55cf2031050248a 0c/?vgnextoid=a872dfa122a1d110VgnVCM1000009ed07898RCRD&vgnextchannel=34 30fb649a2dc110VgnVCM1000009ed07898RCRD&vgnextfmt=print.
_________. 2002-2011. Hazardous Liquid Pipeline Incident Data 2002 – July 2012. Website: http://primis.phmsa.dot.gov/comm/reports/ safety/SIDA.html?nocache=2293.
Historical Pipeline Incident Analysis 19 March 2013

Keystone XL Project
-This page intentionally left blank-
March 2013