Embed Size (px)
Citation preview
EDISTO BEACH
COASTAL STORM DAMAGE REDUCTION GENERAL INVESTIGATION STUDY
APPENDIX J HARDBOTTOM AND CULTURAL
RESOURCE SURVEYS
U.S. Charl
Army Corpsleston Distri
HAR
EDISE
s of Engineeict
RDBORES
STO BEAEDISTO
ers
TTOMSOURCACH OFBEACH
PreCharl
US Army C69 Ha
Charle
PrDial Cordy 201 N. Fro
Wilmin
Panamerica91 T
Memp
A
M ANDCE SU
FFSHOREH, SOUTH
epared for:leston DistricCorps of Engagood Avenuston, SC 294
repared by:
and Associant Street, Sugton, NC 28
and
an Consultanillman Stree
phis, TN 381
April 2013
Contract ND
D CULURVEY
E BORRH CARO
ct gineers ue 403
ates Inc. uite 307 8401
nts Inc. t
111
No. W912HNDelivery Ord
LTURAYS ROW SITOLINA
N-12-D-001der No. DW0
AL
TE
16 02
Hardbottom and Cultural Resource Surveys of the
Edisto Beach Offshore Borrow Site Edisto Beach, South Carolina
APRIL 2013
Prepared for:
Charleston District US Army Corps of Engineers
69 Hagood Avenue Charleston, SC 29403
Prepared by:
Dial Cordy and Associates Inc. 201 N. Front Street, Suite 307
Wilmington, NC 28401
and
Panamerican Consultants Inc. 91 Tillman Street
Memphis, TN 38111
Hardbottom and Cultural Resource Surveys Dial Cordy and Associates Inc. Edisto Beach Offshore Borrow Site April 2013
iii
ABSTRACT
Dial Cordy and Associates Inc. and Panamerican Consultants Inc. performed a remote survey of the proposed sand borrow area during the month of February 2013 for the Edisto Beach hurricane and storm damage protection project. The project purpose was to determine the presence or absence of cultural and hardbottom resources within the proposed borrow site so as to assist in project planning, impact assessment, and for compliance with applicable federal regulations. The survey included the use of sidescan sonar, magnetometer, and a subbottom profiler to characterize resources within the study area. Eighteen magnetic anomalies, thirty-one sidescan sonar targets, and two subbottom impedance contrast features in the form of paleolandform areas were recorded during the current survey. Out of all the anomalies, sonar targets, and subbottom impedance contrast features, no anomalies were considered to potentially represent significant historic cultural resources. Several sidescan sonar contacts and subbottom features were considered to represent vestiges of paleolandforms that have the possibility of containing prehistoric cultural resources sites. Two areas of potential paleolandscape settings that should be avoided from future dredging include an area of exposed paleolandscape with multiple logs (or stumps) that has one feature of possible upright posts indicating a possible structure and a portion of a buried paleochannel. Since the first site may contain potentially eligible pre-Contact cultural resources, it should be avoided by a distance of 1,500 feet around an arbitrary point at E2213373, N232446. The second area, based on the subbottom record, is a buried paleochannel feature with horizontal margins within the study area at the far southeastern corner. Because the age of this feature is unknown, it is recommended that it should be avoided by a radius of 1,500 feet around an arbitrary center point at E2218203, N227338, or studied in more detail. Based on review of available marine resource GIS data sources and review of the collected sidescan records, there is not likely to be any hardbottom habitat within the borrow site survey area. Based on coordination with the United States Army Corps of Engineers, Charleston District, following completion of the remote survey, no further investigation is deemed necessary. Review and concurrence with the National Marine Fisheries Service, Charleston Office, is required to conclude consultation on this Essential Fish Habitat resource type. In a letter received on the draft report from the South Carolina Institute of Archaeology and Anthropology on 12 August 2013, Mr. James Spirek, State Underwater Archaeologist, concurred with the above findings. The agency did, however, request that any inadvertent discovery of potential archaeological materials, i.e., wood structure, prehistoric lithics, ceramics, etc. during dredging operations cease from that area until inspections may reveal the source of this material. Further, the agency had no objections from a submerged cultural resources viewpoint for dredging to occur within the proposed borrow area.
Hardbottom and Cultural Resource Surveys Dial Cordy and Associates Inc. Edisto Beach Offshore Borrow Site April 2013
iv
TABLE OF CONTENTS
Page
ABSTRACT ...................................................................................................................... III
1.0 INTRODUCTION .................................................................................................. 1
2.0 PREHISTORIC AND HISTORIC OVERVIEW ................................................... 2 2.1 Paleoenvironmental Setting ................................................................................ 2
2.1.1 Geology ........................................................................................................... 2 2.1.2 Sea Level History ............................................................................................ 7
2.2 Prehistoric Context .............................................................................................. 9 2.2.1 Paleoindian and Early Archaic Culture Groups .............................................. 9 2.2.2 Middle and Late Archaic Groups .................................................................. 12
2.2.2.1 Middle Archaic ..................................................................................... 13 2.2.2.2 Late Archaic .......................................................................................... 13
2.2.3 Potential For Submerged Prehistoric Sites ................................................... 14 2.3 Historic Context ................................................................................................ 15
2.3.1 Previous Investigations, Site File, Shipwreck Inventory, Automated Wreck and Obstruction Information System, and Cartographic Reviews ..........................................................................................................20
2.3.1.1 Previous Investigations ......................................................................... 20 2.3.1.2 Site File Review .................................................................................... 23 2.3.1.3 Shipwreck Inventory ............................................................................. 24 2.3.1.4 Automated Wreck and Obstruction Information System ...................... 24 2.3.1.5 Cartographic Review ............................................................................ 24
3.0 METHODS ........................................................................................................... 36 3.1 Project Area Environment................................................................................. 36 3.2 Personnel ........................................................................................................... 36 3.3 Remote Sensing Survey Equipment.................................................................. 37
3.3.1 Differential Global Positioning System ........................................................ 37 3.3.2 Magnetometer ............................................................................................... 38 3.3.3 Sidescan Sonar .............................................................................................. 39 3.3.4 Subbottom Profiler ........................................................................................ 40 3.3.5 Survey Vessel ................................................................................................ 41
3.4 Survey Procedures ............................................................................................ 41 3.5 Data Analysis .................................................................................................... 42
3.5.1 Data Processing ............................................................................................. 42 3.5.2 Magnetic Data Collection and Processing .................................................... 43 3.5.3 Sidescan Sonar Data Collection and Processing ........................................... 43 3.5.4 Subbottom Profiler Data Processing and Analysis ....................................... 45 3.5.5 Geographic Information Systems Analysis .................................................. 46
3.6 Data Analysis Criteria, Theory, and Commentary ............................................ 46 3.6.1 Magnetometer ............................................................................................... 47 3.6.2 Sidescan Sonar .............................................................................................. 51 3.6.3 Clustering ...................................................................................................... 52 3.6.4 Subbottom Profiler Analysis ......................................................................... 52
3.7 Method and Theory for Recognition of a Submerged Prehistoric Site ............. 52
Hardbottom and Cultural Resource Surveys Dial Cordy and Associates Inc. Edisto Beach Offshore Borrow Site April 2013
v
4.0 INVESTIGATIVE FINDINGS ............................................................................ 53 4.1 Submerged Cultural Resources ......................................................................... 54
4.1.1 Magnetometer Results .................................................................................. 54 4.1.2 Sidescan Sonar Results ................................................................................. 54 4.1.3 Sidescan Sonar and Subbottom Profiler Results With Respect to
Submerged Prehistoric Potentials ...................................................................67 4.1.3.1 Sidescan Sonar Results ......................................................................... 67 4.1.3.2 Subbottom Profiler Results ................................................................... 69
4.1.4 Summary ....................................................................................................... 72 4.2 Hardbottom Resources ...................................................................................... 73
5.0 CONCLUSIONS................................................................................................... 74 5.1 Cultural Resources ............................................................................................ 74 5.2 Hardbottom Resources ...................................................................................... 76
6.0 REFERENCES ..................................................................................................... 76 APPENDIX A Scope of Work Hardbottom and Cultural Resource Surveys Edisto
Beach Offshore Borrow Site, Edisto Beach, South Carolina APPENDIX B Magnetic Anomalies Contour Maps APPENDIX C Letter of Concurrence from the South Carolina Institute of Archaeology
and Anthropology
LIST OF FIGURES
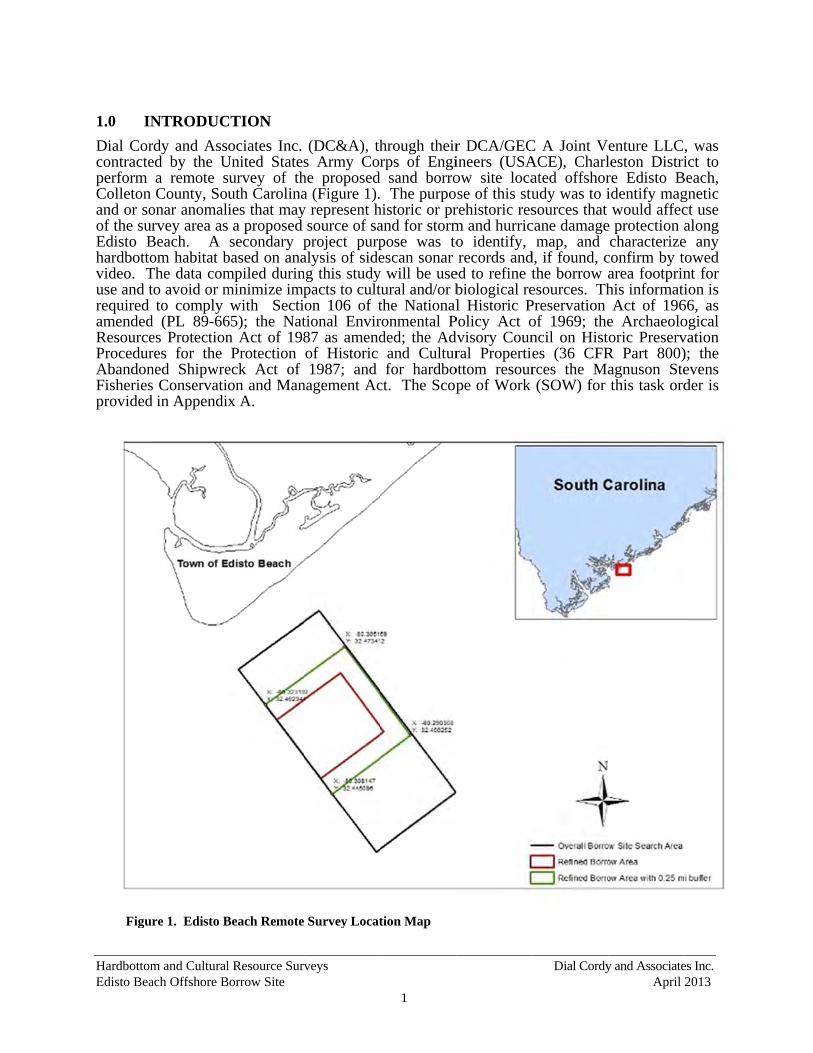
Page Figure 1. Edisto Beach Remote Survey Location Map...................................................... 1 Figure 2. Adapted from Garrison et al. (2012), this figure shows a portion of the
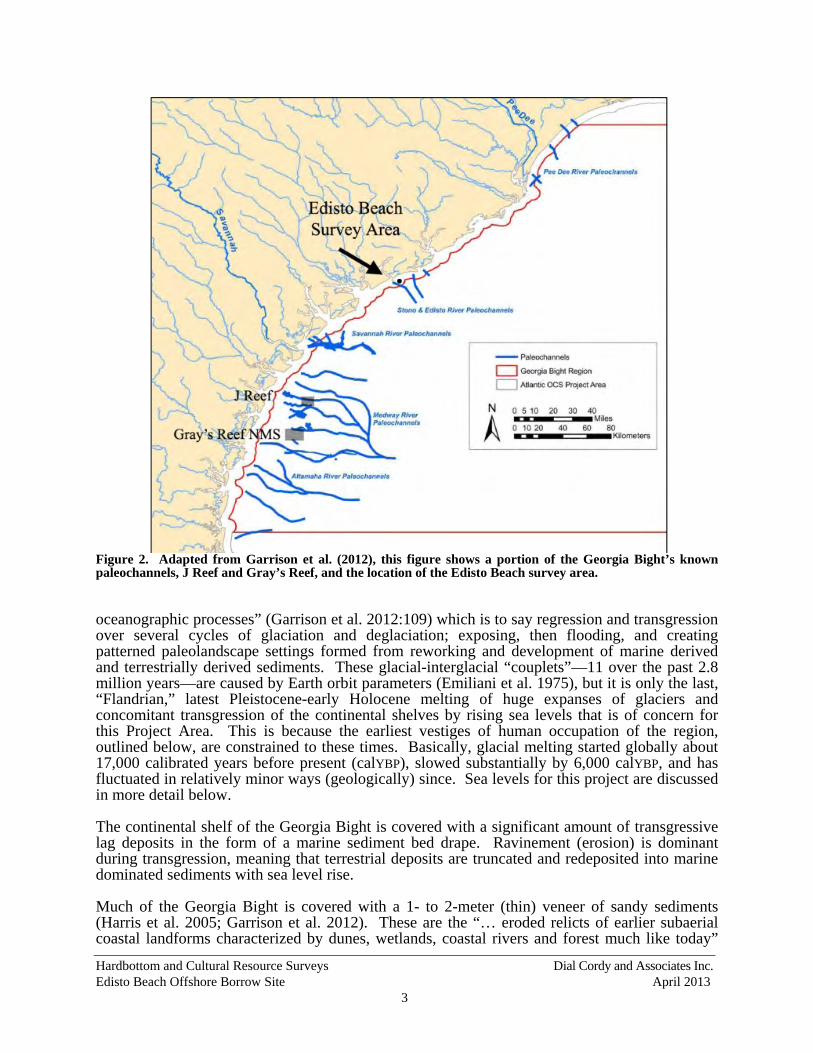
Georgia Bight’s known paleochannels, J Reef and Gray’s Reef, and the location of the Edisto Beach survey area. ..................................................................................3
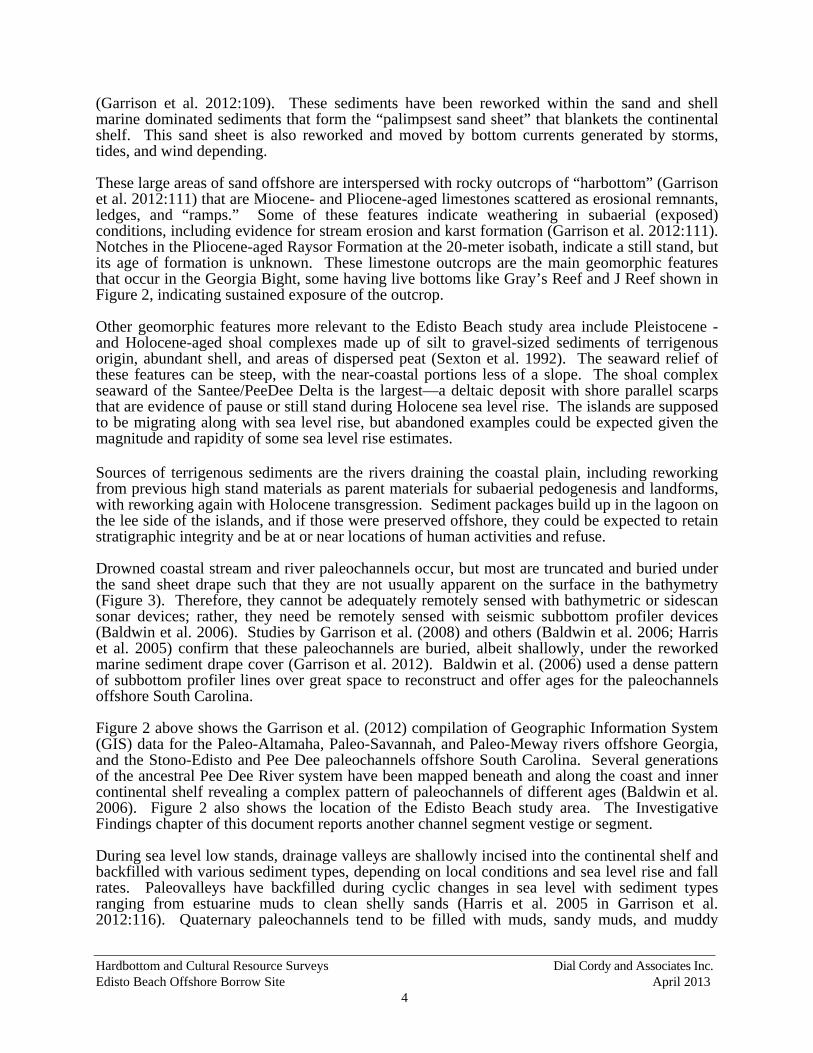
Figure 3. An example of a paleochannel underneath the sand sheet cover from Garrison et al. (2008) that is analogous to the paleochannel feature recorded in this survey project. .......................................................................................................5
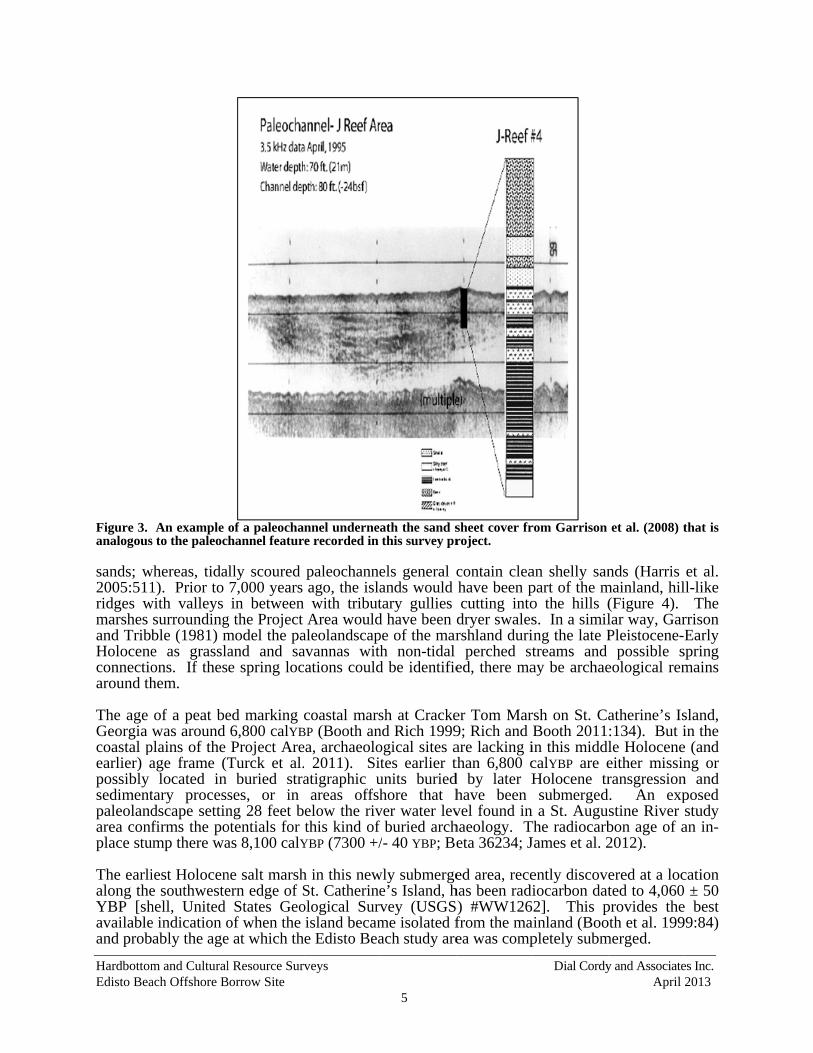
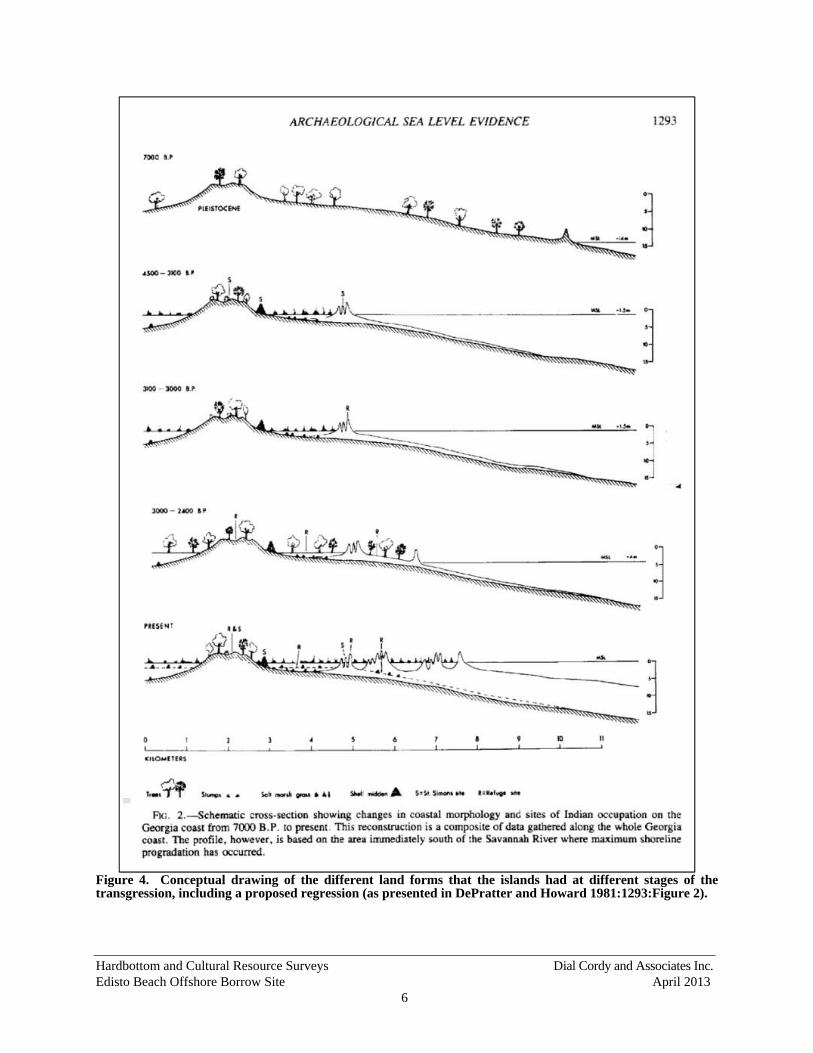
Figure 4. Conceptual drawing of the different land forms that the islands had at different stages of the transgression, including a proposed regression (as presented in DePratter and Howard 1981:1293:Figure 2). ..........................................6
Figure 5. Global eustatic sea level curve from Siddall et al. (2003) with Blanchon (2011) chronology of MWPs 1a, 1b, and 1c shown. The horizontal line represents the survey area depths, indicating submergence after 5,000 calYBP. .........8
Figure 6. Fluctuating sea level curve for South Carolina from Colquhoun et al. (1995) relevant to the Project Area showing depths recorded in the Edisto Beach study area. The implication is that the study area was terrestrial before 8,000 calYBP and probably near coastal after that, until submergence between 5,000 and 4,000. ......9
Hardbottom and Cultural Resource Surveys Dial Cordy and Associates Inc. Edisto Beach Offshore Borrow Site April 2013
vi
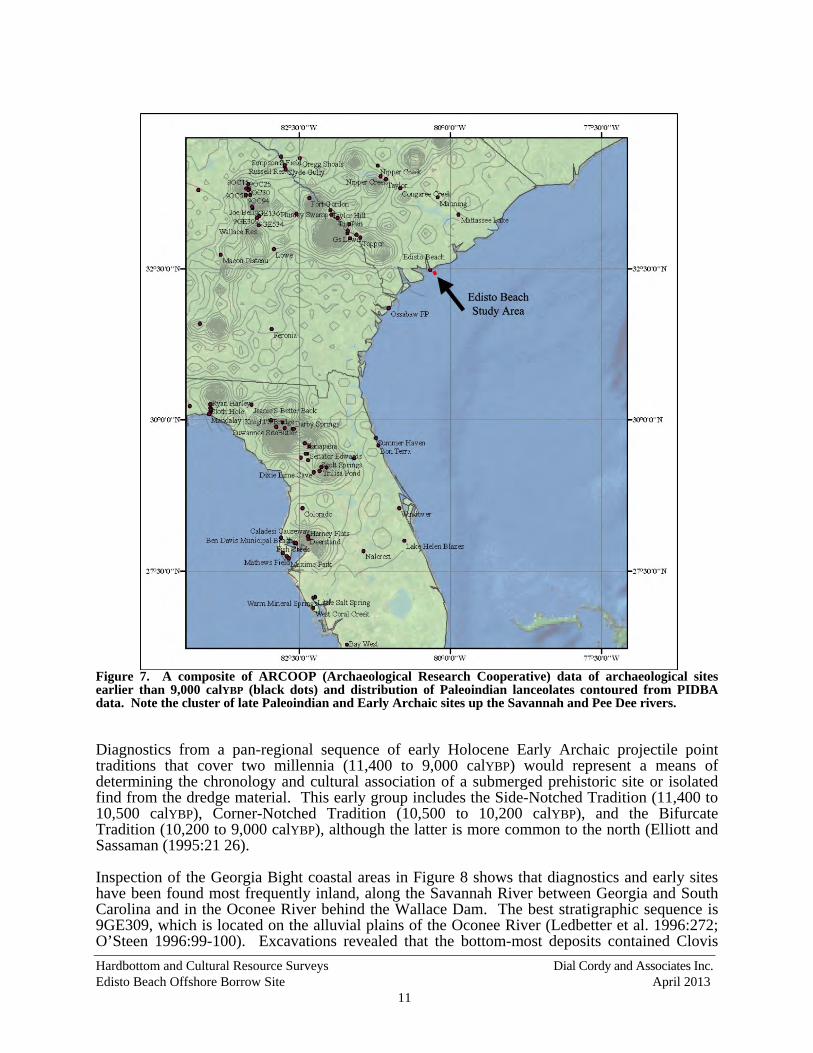
Figure 7. A composite of ARCOOP (Archaeological Research Cooperative) data of archaeological sites earlier than 9,000 calYBP (black dots) and distribution of Paleoindian lanceolates contoured from PIDBA data. Note the cluster of late Paleoindian and Early Archaic sites up the Savannah and Pee Dee rivers. ...............11
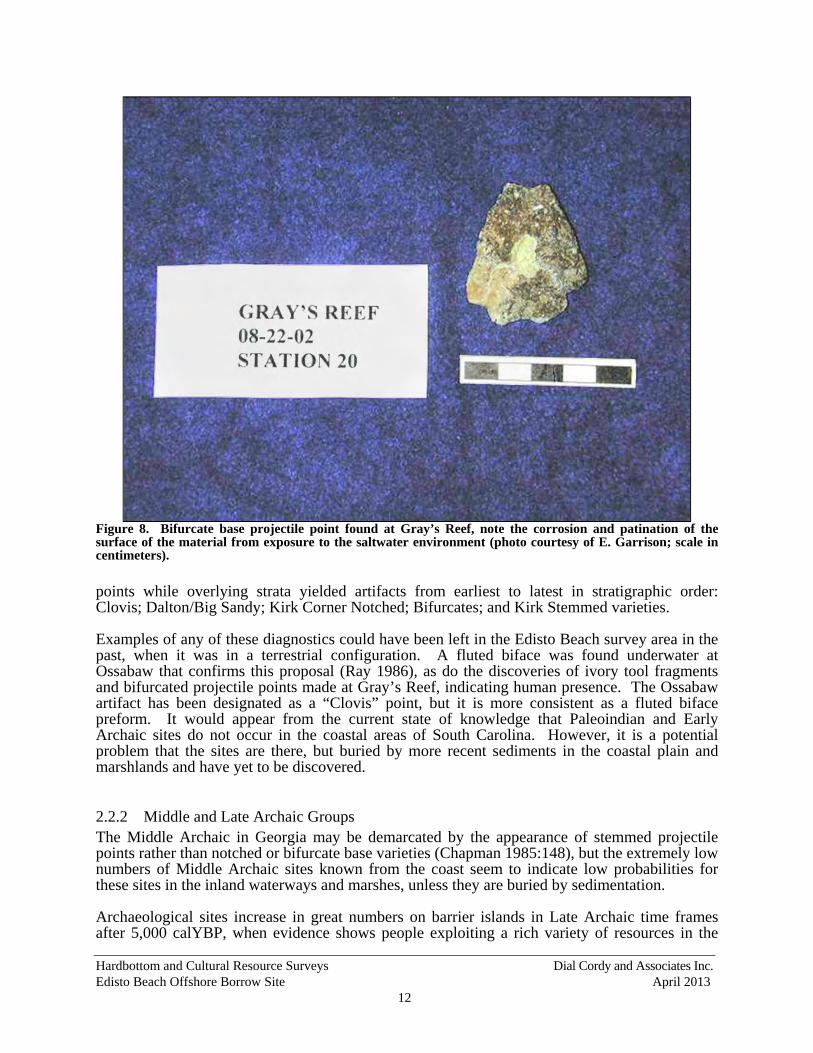
Figure 8. Bifurcate base projectile point found at Gray’s Reef, note the corrosion and patination of the surface of the material from exposure to the saltwater environment (photo courtesy of E. Garrison; scale in centimeters). ..........................12
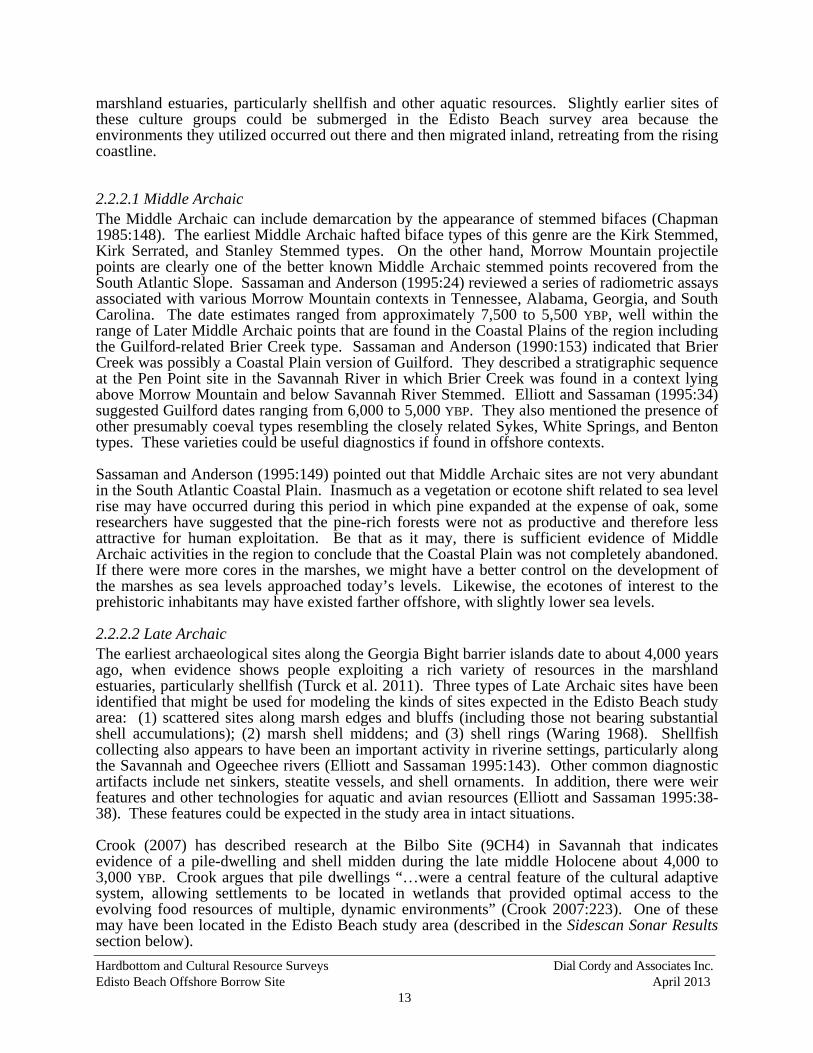
Figure 9. Cover of Thomas (2008) showing Native Americans along Georgia’s coast and the array of features and structures they had built for catching, processing, and preserving marshland fauna. These kinds of features can be preserved offshore given local preservation parameters. ...........................................14
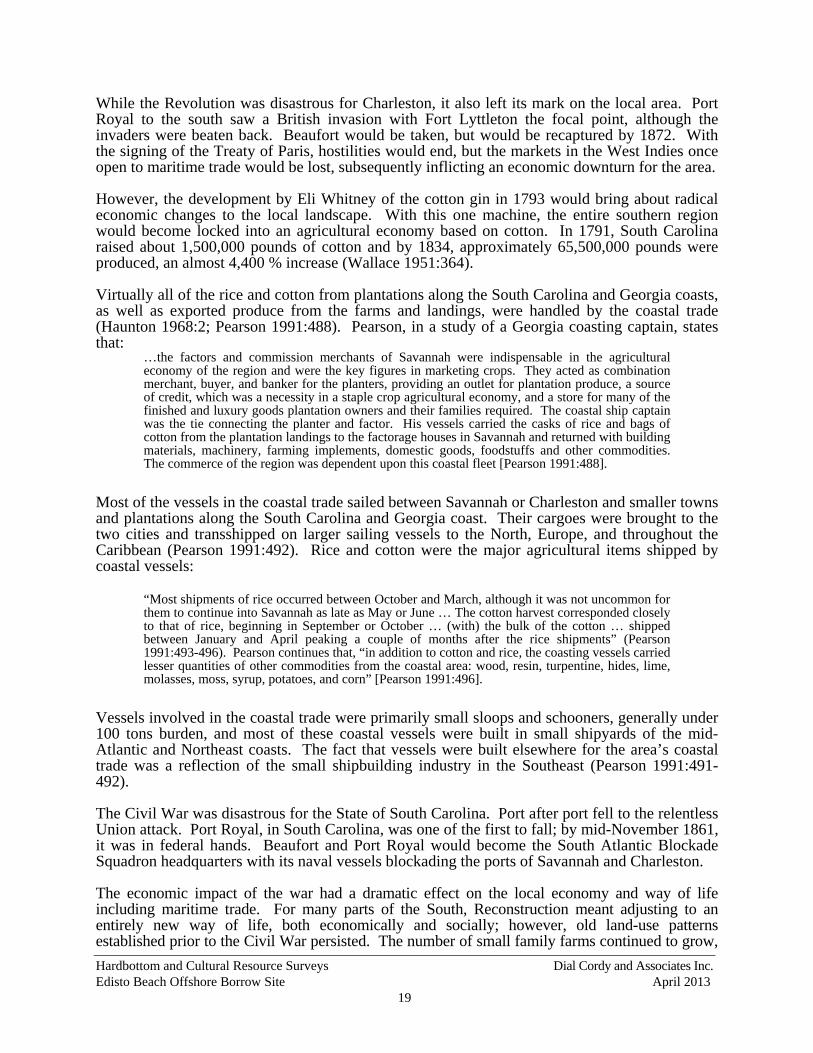
Figure 10. Excerpt from the 1857 Coastal Survey Chart “St. Helena Sound” showing single wreck notation on shore at the southern end of Hunting Island across the sound from the Project Area (Courtesy of National Oceanic and Atmospheric Administration’s Office of Coast Survey’s Historical Map and Chart Collection). .......................................................................................................22
Figure 11. Location of Site 38BU157, vessel remains suggestive of a well smack, a type of fishing vessel introduced in the 1830s-1840s (as presented in Watts 2005:17). Compare the site’s location with the wreck noted in Figure 10 above. ...22
Figure 12. Recorded cultural resources sites with trinomials in relationship to the Project Area (base map courtesy of Google Earth). Note the two sites along the shore of Hunting Island to the south are shipwreck sites mentioned above. .............23
Figure 13. 1857 Coastal Survey Chart “St. Helena Sound.” Note the Project Area upper right and Light Ship marking the channel into the sound circled in red at lower left. No buoys or directions are noted for entering South Edisto River, while buoys mark the entrance into the sound channel (courtesy of NOAA’s Office of Coast Survey’s Historical Map and Chart Collection; Project Area is approximate and not geo-referenced). .......................................................................25
Figure 14. 1864 Coastal Survey Chart “St. Helena Sound.” Note that navigation directions are present for entering South Edisto River and goes between two sets of breakers, one on each side of a very narrow channel (courtesy of NOAA’s Office of Coast Survey’s Historical Map and Chart Collection). ...............26
Figure 15. 1867 Coastal Survey Chart “St. Helena Sound” showing no change from the 1864 chart (courtesy of NOAA’s Office of Coast Survey’s Historical Map and Chart Collection). ................................................................................................27
Figure 16. 1878 Coastal Survey Chart “St. Helena Sound.” Note the South Edisto River entrance channel now has two buoys marking the channel through the breakers (courtesy of NOAA’s Office of Coast Survey’s Historical Map and Chart Collection). .......................................................................................................28
Figure 17. 1897 Coastal Survey Chart “St. Helena Sound.” Note the South Edisto River entrance channel is well marked by two buoys. A “Sea Whistle” buoy is now in place offshore the entrance channels for the Sound and South Edisto River (courtesy of NOAA’s Office of Coast Survey’s Historical Map and Chart Collection). .................................................................................................................30
Figure 18. 1903 Coastal Survey Chart “St. Helena Sound.” There are no real changes from the 1897 chart, and no wreck symbols are present (courtesy of NOAA’s Office of Coast Survey’s Historical Map and Chart Collection). ...............31
Hardbottom and Cultural Resource Surveys Dial Cordy and Associates Inc. Edisto Beach Offshore Borrow Site April 2013
vii
Figure 19. 1918 Coastal Survey Chart “St. Helena Sound.” Note the buoys once marking the South Edisto River entrance channel are not present, indicating a possible closure of the channel by shifting sands or storm. (courtesy of NOAA’s Office of Coast Survey’s Historical Map and Chart Collection). ..............................32
Figure 20. 1931 Coastal Survey Chart “St. Helena Sound” shows no buoys marking the channel through the breakers. Note that the beach on Edisto Island is labeled McConkie Beach. Bay Point is also labeled (courtesy of NOAA’s Office of Coast Survey’s Historical Map and Chart Collection). ..............................33
Figure 21. 1974 Coastal Survey Chart “St. Helena Sound” showing the channel is marked with two channel markers. Some exposed/above high tide shoals are now noted for the area. No wreck symbols are present (courtesy of NOAA’s Office of Coast Survey’s Historical Map and Chart Collection). ..............................34
Figure 22. 2007 Coastal Survey Chart “St. Helena Sound.” Note the channel is well marked with very little shoaling. Breakers are still labeled on the northern side of the channel. A wreck symbol is present to the southeast of the Project Area and another is located well to the northeast closer to shore. These are not noted in AWOIS (courtesy of NOAA’s Office of Coast Survey’s Historical Map and Chart Collection). .......................................................................................................35
Figure 23. Looking north towards Edisto Beach from the southern end of Project Area. Boom at left holds the subbottom profiler. The smooth sea state shown here is the exception rather than the rough norm encountered during the survey. ....36
Figure 24. Trimble Navigation DSM 12/212 global-based positioning system used during the investigation. .............................................................................................37
Figure 25. Equipment schematic illustrating layback (courtesy of Coastal Oceanographics, Inc.). ...............................................................................................38
Figure 26. Survey instruments employed during the investigation included (from right to left) the magnetometer, the sidescan sonar, and the subbottom profiler. Honda generator employed to power the instruments is in the background adjacent to the transom. .............................................................................................39
Figure 27. DC&A’s 25-foot Haley Ann employed for the survey investigations. ............41 Figure 28. Planned survey lines within the Edisto Beach borrow area. ...........................42 Figure 29. Hypack Single Beam Editor magnetic data display of a section of a
survey line. Using these windows one can analyze anomaly position, strength, duration, and type. The peaks of these variations are the locations of target coordinates; their width is the duration. .....................................................................43
Figure 30. Sonar mosaic generated in SonarWiz.MAP showing 100% coverage of the Project Area. .........................................................................................................44
Figure 31. SonarWiz.MAP sonar contact data automatically generated in tabular format. The target pictured here is SS-13, which lacks a magnetic signature and is likely a cluster of tree trunks or post. .....................................................................45
Figure 32. Trackline configuration example and various “reflector” features digitized. .....................................................................................................................45
Figure 33. SonarWiz.MAP subbottom waterfall image example showing the seismic profile-digitizing window. The blue cross hairs in the background chart show the location of the cursor, which at the time of the image was directly over the peak of the positive relief feature shown. ..................................................................46
Hardbottom and Cultural Resource Surveys Dial Cordy and Associates Inc. Edisto Beach Offshore Borrow Site April 2013
viii
Figure 34. Magnetic contour map in GIS with the RNC chart as the background. Map presents layers of magnetic anomalies, sonar contacts, magnetic contours, and survey track lines. ................................................................................................47
Figure 35. Map Key for Appendix B. ...............................................................................55 Figure 36. Sidescan sonar mosaic with labeled contacts. .................................................67 Figure 37. Example of the blocky, rugged topography observed in multiple locations
in the northern corner. ................................................................................................68 Figure 38. Mosaic with arrows marking changes in the surface expression of the
bottom. .......................................................................................................................69 Figure 39. Subbottom trackline record ghosted, bolded tracklines shown in the
profile composite in Figure 40. Features were mapped in SonarWiz.MAp during the analysis of the data. ..................................................................................70
Figure 40. Selected subbottom profiles showing the topography and seismic stratigraphy of the study area. ....................................................................................71
Figure 41. Close up of the paleochannel and horizontal margins recorded in the southeastern corner of the study area. ........................................................................72
Figure 42. Recommended avoidance zones. .....................................................................74 Figure 43. Two recommended avoidance zones. ..............................................................75
LIST OF TABLES Page
Table 1. Edisto Beach Borrow Site Survey Area Coordinates. ......................................... 2 Table 2. Characterization of Late Pleistocene and Holocene Transgression Sequence,
Magnitude and Rates.* ................................................................................................. 8 Table 3. Inventory Of Known Shipwrecks in the Project Area Vicinity.* ...................... 21 Table 4. Compilation of Magnetic Data from Various Sources. ..................................... 49 Table 5. Magnetic Data from Steamboat Wreck Sites. .................................................... 50 Table 6. Magnetic Anomalies. ......................................................................................... 55 Table 7. Sidescan Sonar Targets within the Survey Area. ............................................... 56 Table 8. Sidescan Sonar Target Images. .......................................................................... 57
Hardbottom and Cultural Resource Surveys Dial Cordy and Associates Inc. Edisto Beach Offshore Borrow Site April 2013
ix
LIST OF ACRONYMS ARCOOP Archaeological Research Cooperative AWOIS Automated Wreck and Obstruction Information System calybp Calibrated Years Before Present DC&A Dial Cordy and Associates Inc. DGPS Digital Global-based Positioning Software GIS Geographic Information Systems GPS Global-based Positioning Software LGM Late Glacial Maximum MSK Minimum-Shift Keying MST Marine Sonic Technology MWP Meltwater Pulses NMFS National Marine Fisheries Service NOAA National Oceanic and Atmospheric Administration Panamerican Panamerican Consultants, Inc. PIDBA Paleoindian Database of the Americas RNC Raster Navigation Charts ROW Right of Way SEAMAP Southeast Area Monitoring and Assessment Program SOW Scope of Work SCDAH South Carolina Department of Archives and History SCIAA South Carolina Institute of Archaeology and Anthropology US United States USACE United States Army Corps of Engineers USGS United States Geological Survey ybp Years Before Present
HardbottomEdisto Bea
1.0 IN
Dial Corcontracteperform Colleton and or soof the surEdisto Bhardbottovideo. Tuse and trequired amendedResourceProcedurAbandonFisheriesprovided
Figu
m and Culturalach Offshore B
NTRODUC
rdy and Assed by the Ua remote sCounty, Sou
onar anomalirvey area as
Beach. A om habitat bThe data comto avoid or mto comply
d (PL 89-66es Protectionres for the ned Shipwres Conservatiod in Appendix
re 1. Edisto B
l Resource SurvBorrow Site
CTION
ociates Inc. United States
urvey of thuth Carolinaies that may a proposed secondary p
based on anampiled durinminimize impwith Secti
65); the Natn Act of 198Protection
eck Act of on and Manx A.
Beach Remote
veys
(DC&A), ths Army Cor
he proposeda (Figure 1).y represent h
source of saproject purpalysis of sideng this studypacts to culton 106 of ttional Envir87 as amendof Historic 1987; and
nagement Ac
Survey Locat
1
hrough theirrps of Engi
d sand borro The purpo
historic or prand for stormpose was toescan sonar
y will be usetural and/or bthe Nationalronmental Pded; the Ad
and Culturfor hardbo
ct. The Scop
tion Map
r DCA/GECineers (USAow site locase of this stu
rehistoric resm and hurrico identify, records and
ed to refine tbiological rel Historic P
Policy Act odvisory Counral Propertie
ottom resourpe of Work
Dial Cordy
C A Joint VACE), Charlated offshorudy was to isources that cane damage
map, and d, if found, cthe borrow aesources. ThPreservation of 1969; thencil on Histes (36 CFRrces the Ma(SOW) for
y and Associate April
enture LLCleston Distrire Edisto Bidentify magwould affec
e protection acharacterize
confirm by tarea footprinhis informatiAct of 196
e Archaeolooric Preserv
R Part 800)agnuson Stethis task ord
es Inc. 2013
, was ict to
Beach, gnetic ct use along
e any owed nt for ion is
66, as ogical vation ); the evens der is
Hardbottom and Cultural Resource Surveys Dial Cordy and Associates Inc. Edisto Beach Offshore Borrow Site April 2013
2
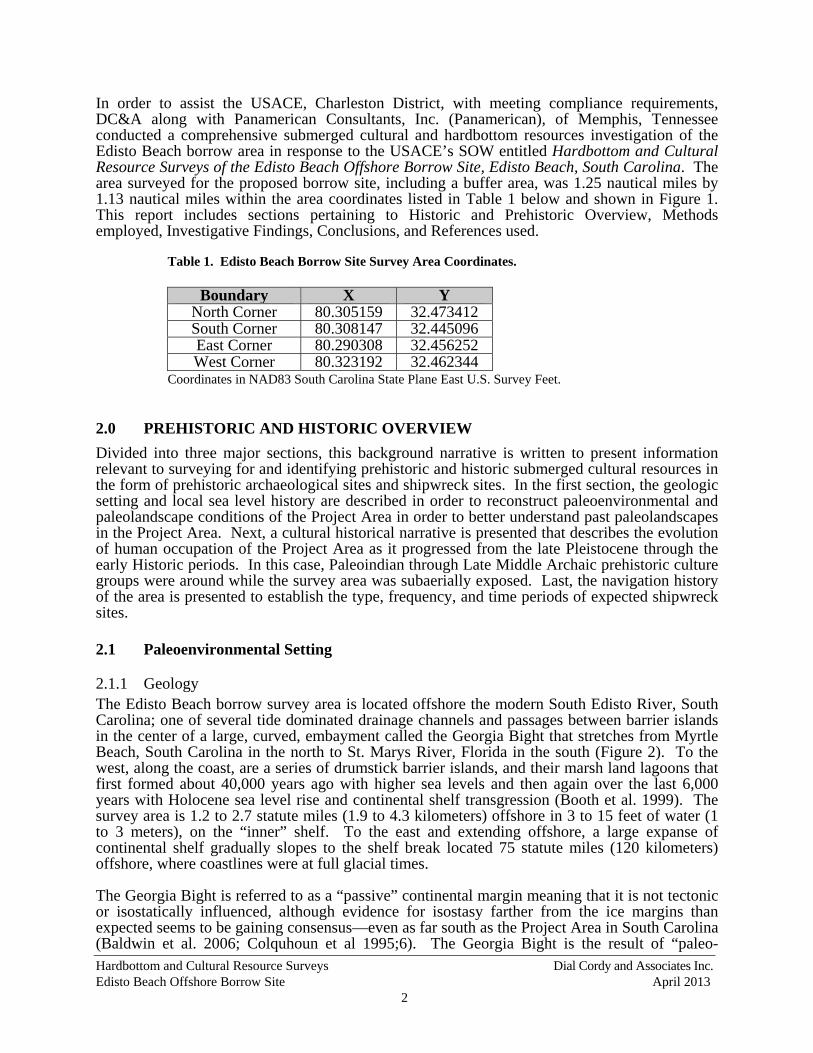
In order to assist the USACE, Charleston District, with meeting compliance requirements, DC&A along with Panamerican Consultants, Inc. (Panamerican), of Memphis, Tennessee conducted a comprehensive submerged cultural and hardbottom resources investigation of the Edisto Beach borrow area in response to the USACE’s SOW entitled Hardbottom and Cultural Resource Surveys of the Edisto Beach Offshore Borrow Site, Edisto Beach, South Carolina. The area surveyed for the proposed borrow site, including a buffer area, was 1.25 nautical miles by 1.13 nautical miles within the area coordinates listed in Table 1 below and shown in Figure 1. This report includes sections pertaining to Historic and Prehistoric Overview, Methods employed, Investigative Findings, Conclusions, and References used.
Table 1. Edisto Beach Borrow Site Survey Area Coordinates.
Boundary X YNorth Corner 80.305159 32.473412South Corner 80.308147 32.445096East Corner 80.290308 32.456252West Corner 80.323192 32.462344
Coordinates in NAD83 South Carolina State Plane East U.S. Survey Feet.
2.0 PREHISTORIC AND HISTORIC OVERVIEW
Divided into three major sections, this background narrative is written to present information relevant to surveying for and identifying prehistoric and historic submerged cultural resources in the form of prehistoric archaeological sites and shipwreck sites. In the first section, the geologic setting and local sea level history are described in order to reconstruct paleoenvironmental and paleolandscape conditions of the Project Area in order to better understand past paleolandscapes in the Project Area. Next, a cultural historical narrative is presented that describes the evolution of human occupation of the Project Area as it progressed from the late Pleistocene through the early Historic periods. In this case, Paleoindian through Late Middle Archaic prehistoric culture groups were around while the survey area was subaerially exposed. Last, the navigation history of the area is presented to establish the type, frequency, and time periods of expected shipwreck sites.
2.1 Paleoenvironmental Setting
2.1.1 Geology The Edisto Beach borrow survey area is located offshore the modern South Edisto River, South Carolina; one of several tide dominated drainage channels and passages between barrier islands in the center of a large, curved, embayment called the Georgia Bight that stretches from Myrtle Beach, South Carolina in the north to St. Marys River, Florida in the south (Figure 2). To the west, along the coast, are a series of drumstick barrier islands, and their marsh land lagoons that first formed about 40,000 years ago with higher sea levels and then again over the last 6,000 years with Holocene sea level rise and continental shelf transgression (Booth et al. 1999). The survey area is 1.2 to 2.7 statute miles (1.9 to 4.3 kilometers) offshore in 3 to 15 feet of water (1 to 3 meters), on the “inner” shelf. To the east and extending offshore, a large expanse of continental shelf gradually slopes to the shelf break located 75 statute miles (120 kilometers) offshore, where coastlines were at full glacial times. The Georgia Bight is referred to as a “passive” continental margin meaning that it is not tectonic or isostatically influenced, although evidence for isostasy farther from the ice margins than expected seems to be gaining consensus—even as far south as the Project Area in South Carolina (Baldwin et al. 2006; Colquhoun et al 1995;6). The Georgia Bight is the result of “paleo-
Hardbottom and Cultural Resource Surveys Dial Cordy and Associates Inc. Edisto Beach Offshore Borrow Site April 2013
3
Figure 2. Adapted from Garrison et al. (2012), this figure shows a portion of the Georgia Bight’s known paleochannels, J Reef and Gray’s Reef, and the location of the Edisto Beach survey area. oceanographic processes” (Garrison et al. 2012:109) which is to say regression and transgression over several cycles of glaciation and deglaciation; exposing, then flooding, and creating patterned paleolandscape settings formed from reworking and development of marine derived and terrestrially derived sediments. These glacial-interglacial “couplets”—11 over the past 2.8 million years—are caused by Earth orbit parameters (Emiliani et al. 1975), but it is only the last, “Flandrian,” latest Pleistocene-early Holocene melting of huge expanses of glaciers and concomitant transgression of the continental shelves by rising sea levels that is of concern for this Project Area. This is because the earliest vestiges of human occupation of the region, outlined below, are constrained to these times. Basically, glacial melting started globally about 17,000 calibrated years before present (calYBP), slowed substantially by 6,000 calYBP, and has fluctuated in relatively minor ways (geologically) since. Sea levels for this project are discussed in more detail below. The continental shelf of the Georgia Bight is covered with a significant amount of transgressive lag deposits in the form of a marine sediment bed drape. Ravinement (erosion) is dominant during transgression, meaning that terrestrial deposits are truncated and redeposited into marine dominated sediments with sea level rise. Much of the Georgia Bight is covered with a 1- to 2-meter (thin) veneer of sandy sediments (Harris et al. 2005; Garrison et al. 2012). These are the “… eroded relicts of earlier subaerial coastal landforms characterized by dunes, wetlands, coastal rivers and forest much like today”
Hardbottom and Cultural Resource Surveys Dial Cordy and Associates Inc. Edisto Beach Offshore Borrow Site April 2013
4
(Garrison et al. 2012:109). These sediments have been reworked within the sand and shell marine dominated sediments that form the “palimpsest sand sheet” that blankets the continental shelf. This sand sheet is also reworked and moved by bottom currents generated by storms, tides, and wind depending. These large areas of sand offshore are interspersed with rocky outcrops of “harbottom” (Garrison et al. 2012:111) that are Miocene- and Pliocene-aged limestones scattered as erosional remnants, ledges, and “ramps.” Some of these features indicate weathering in subaerial (exposed) conditions, including evidence for stream erosion and karst formation (Garrison et al. 2012:111). Notches in the Pliocene-aged Raysor Formation at the 20-meter isobath, indicate a still stand, but its age of formation is unknown. These limestone outcrops are the main geomorphic features that occur in the Georgia Bight, some having live bottoms like Gray’s Reef and J Reef shown in Figure 2, indicating sustained exposure of the outcrop. Other geomorphic features more relevant to the Edisto Beach study area include Pleistocene - and Holocene-aged shoal complexes made up of silt to gravel-sized sediments of terrigenous origin, abundant shell, and areas of dispersed peat (Sexton et al. 1992). The seaward relief of these features can be steep, with the near-coastal portions less of a slope. The shoal complex seaward of the Santee/PeeDee Delta is the largest—a deltaic deposit with shore parallel scarps that are evidence of pause or still stand during Holocene sea level rise. The islands are supposed to be migrating along with sea level rise, but abandoned examples could be expected given the magnitude and rapidity of some sea level rise estimates. Sources of terrigenous sediments are the rivers draining the coastal plain, including reworking from previous high stand materials as parent materials for subaerial pedogenesis and landforms, with reworking again with Holocene transgression. Sediment packages build up in the lagoon on the lee side of the islands, and if those were preserved offshore, they could be expected to retain stratigraphic integrity and be at or near locations of human activities and refuse. Drowned coastal stream and river paleochannels occur, but most are truncated and buried under the sand sheet drape such that they are not usually apparent on the surface in the bathymetry (Figure 3). Therefore, they cannot be adequately remotely sensed with bathymetric or sidescan sonar devices; rather, they need be remotely sensed with seismic subbottom profiler devices (Baldwin et al. 2006). Studies by Garrison et al. (2008) and others (Baldwin et al. 2006; Harris et al. 2005) confirm that these paleochannels are buried, albeit shallowly, under the reworked marine sediment drape cover (Garrison et al. 2012). Baldwin et al. (2006) used a dense pattern of subbottom profiler lines over great space to reconstruct and offer ages for the paleochannels offshore South Carolina. Figure 2 above shows the Garrison et al. (2012) compilation of Geographic Information System (GIS) data for the Paleo-Altamaha, Paleo-Savannah, and Paleo-Meway rivers offshore Georgia, and the Stono-Edisto and Pee Dee paleochannels offshore South Carolina. Several generations of the ancestral Pee Dee River system have been mapped beneath and along the coast and inner continental shelf revealing a complex pattern of paleochannels of different ages (Baldwin et al. 2006). Figure 2 also shows the location of the Edisto Beach study area. The Investigative Findings chapter of this document reports another channel segment vestige or segment. During sea level low stands, drainage valleys are shallowly incised into the continental shelf and backfilled with various sediment types, depending on local conditions and sea level rise and fall rates. Paleovalleys have backfilled during cyclic changes in sea level with sediment types ranging from estuarine muds to clean shelly sands (Harris et al. 2005 in Garrison et al. 2012:116). Quaternary paleochannels tend to be filled with muds, sandy muds, and muddy
HardbottomEdisto Bea
Figure 3. analogous sands; w2005:511ridges wmarshes and TribbHoloceneconnectioaround th The age Georgia wcoastal pearlier) apossibly sedimentpaleolandarea confplace stu The earlialong theYBP [shavailableand prob
m and Culturalach Offshore B
An example s to the paleoc
whereas, tida1). Prior to
with valleys surroundingble (1981) me as grasslaons. If theshem.
of a peat bewas around
plains of the age frame (T
located in tary processdscape settinfirms the pomp there wa
iest Holocene southwestehell, United e indication oably the age
l Resource SurvBorrow Site
of a paleochahannel featur
lly scoured 7,000 years in between
g the Project model the paand and sae spring loc
ed marking c6,800 calYBProject Are
Turck et al.buried stra
ses, or in ng 28 feet botentials for as 8,100 calY
ne salt marshern edge of S
States Geoof when the e at which th
veys
nnel underneae recorded in
paleochanneago, the islawith tribut
Area wouldaleolandscapavannas withations could
coastal marsBP (Booth anea, archaeolo 2011). Sitatigraphic uareas offsh
elow the rivthis kind of
YBP (7300 +/
h in this newSt. Catherineological Survisland became Edisto Bea
5
ath the sand sthis survey pr
els general cands would tary gullies d have been pe of the marh non-tidal
d be identifie
sh at Crackend Rich 1999ogical sites ates earlier t
units buriedhore that h
ver water levf buried arch/- 40 YBP; Be
wly submergee’s Island, hvey (USGSme isolated fach study are
sheet cover frroject.
contain cleahave been pcutting into
dryer swalesrshland duri
perched sted, there ma
er Tom Mar9; Rich and are lacking ithan 6,800 cd by later Hhave been vel found inhaeology. Teta 36234; J
ed area, recehas been radiS) #WW126from the maea was comp
Dial Cordy
rom Garrison
an shelly sanpart of the mo the hills (s. In a similing the late Ptreams and ay be archae
rsh on St. CaBooth 2011in this middlcalYBP are eHolocene trsubmerged
n a St. AuguThe radiocarbJames et al. 2
ently discoveiocarbon dat2]. This p
ainland (Boopletely subm
y and Associate April
et al. (2008) t
nds (Harris mainland, hil(Figure 4). lar way, GarPleistocene-
possible seological rem
atherine’s Is:134). But ile Holoceneeither missinransgression
d. An expstine River bon age of a2012).
ered at a locted to 4,060
provides theoth et al. 199merged.
es Inc. 2013
that is
et al. ll-like The
rrison Early
spring mains
sland, in the e (and ng or
n and posed study an in-
cation ± 50
e best 99:84)
Hardbottom and Cultural Resource Surveys Dial Cordy and Associates Inc. Edisto Beach Offshore Borrow Site April 2013
6
Figure 4. Conceptual drawing of the different land forms that the islands had at different stages of the transgression, including a proposed regression (as presented in DePratter and Howard 1981:1293:Figure 2).
Hardbottom and Cultural Resource Surveys Dial Cordy and Associates Inc. Edisto Beach Offshore Borrow Site April 2013
7
The configuration of the survey area appears to be a paleobarrier feature transgressed by late Holocene sea level rise. Paleochannel margins, of late Pleistocene early Holocene age, are prime locations for submerged pre-Contact archaeological sites and barrier-marsh coastal systems are likely draws to humans for a variety of resources.
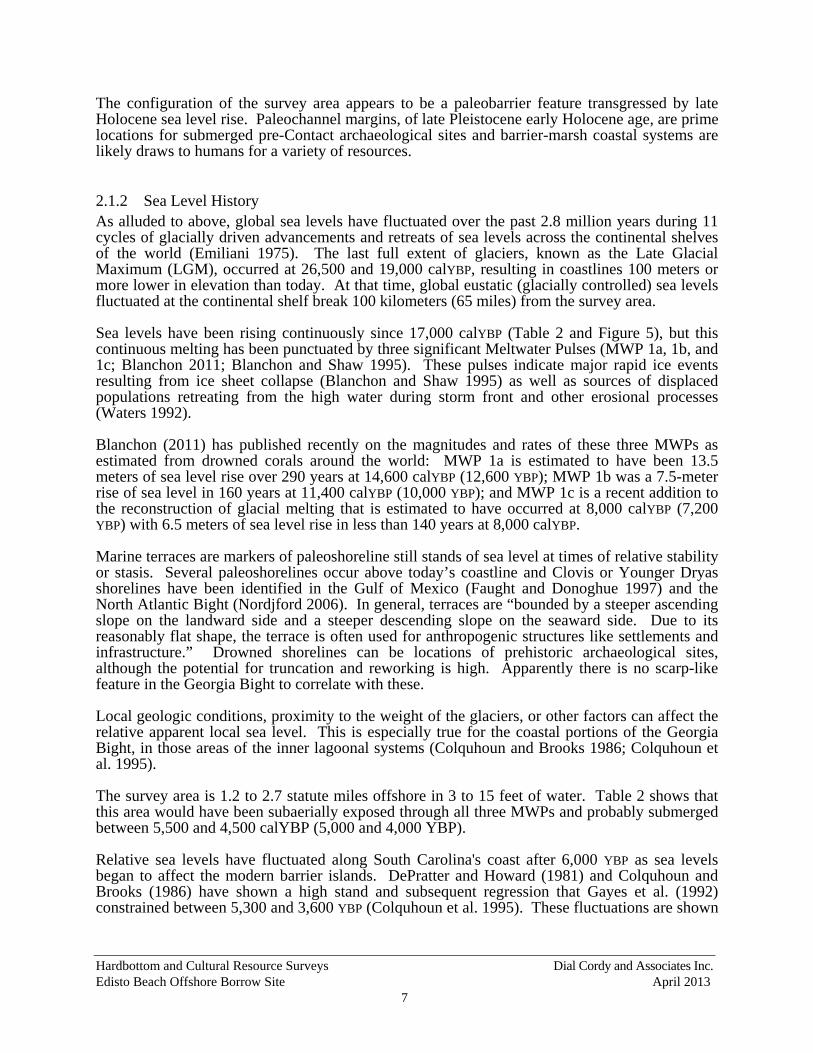
2.1.2 Sea Level History As alluded to above, global sea levels have fluctuated over the past 2.8 million years during 11 cycles of glacially driven advancements and retreats of sea levels across the continental shelves of the world (Emiliani 1975). The last full extent of glaciers, known as the Late Glacial Maximum (LGM), occurred at 26,500 and 19,000 calYBP, resulting in coastlines 100 meters or more lower in elevation than today. At that time, global eustatic (glacially controlled) sea levels fluctuated at the continental shelf break 100 kilometers (65 miles) from the survey area. Sea levels have been rising continuously since 17,000 calYBP (Table 2 and Figure 5), but this continuous melting has been punctuated by three significant Meltwater Pulses (MWP 1a, 1b, and 1c; Blanchon 2011; Blanchon and Shaw 1995). These pulses indicate major rapid ice events resulting from ice sheet collapse (Blanchon and Shaw 1995) as well as sources of displaced populations retreating from the high water during storm front and other erosional processes (Waters 1992). Blanchon (2011) has published recently on the magnitudes and rates of these three MWPs as estimated from drowned corals around the world: MWP 1a is estimated to have been 13.5 meters of sea level rise over 290 years at 14,600 calYBP (12,600 YBP); MWP 1b was a 7.5-meter rise of sea level in 160 years at 11,400 calYBP (10,000 YBP); and MWP 1c is a recent addition to the reconstruction of glacial melting that is estimated to have occurred at 8,000 calYBP (7,200 YBP) with 6.5 meters of sea level rise in less than 140 years at 8,000 calYBP. Marine terraces are markers of paleoshoreline still stands of sea level at times of relative stability or stasis. Several paleoshorelines occur above today’s coastline and Clovis or Younger Dryas shorelines have been identified in the Gulf of Mexico (Faught and Donoghue 1997) and the North Atlantic Bight (Nordjford 2006). In general, terraces are “bounded by a steeper ascending slope on the landward side and a steeper descending slope on the seaward side. Due to its reasonably flat shape, the terrace is often used for anthropogenic structures like settlements and infrastructure.” Drowned shorelines can be locations of prehistoric archaeological sites, although the potential for truncation and reworking is high. Apparently there is no scarp-like feature in the Georgia Bight to correlate with these. Local geologic conditions, proximity to the weight of the glaciers, or other factors can affect the relative apparent local sea level. This is especially true for the coastal portions of the Georgia Bight, in those areas of the inner lagoonal systems (Colquhoun and Brooks 1986; Colquhoun et al. 1995). The survey area is 1.2 to 2.7 statute miles offshore in 3 to 15 feet of water. Table 2 shows that this area would have been subaerially exposed through all three MWPs and probably submerged between 5,500 and 4,500 calYBP (5,000 and 4,000 YBP). Relative sea levels have fluctuated along South Carolina's coast after 6,000 YBP as sea levels began to affect the modern barrier islands. DePratter and Howard (1981) and Colquhoun and Brooks (1986) have shown a high stand and subsequent regression that Gayes et al. (1992) constrained between 5,300 and 3,600 YBP (Colquhoun et al. 1995). These fluctuations are shown
Hardbottom and Cultural Resource Surveys Dial Cordy and Associates Inc. Edisto Beach Offshore Borrow Site April 2013
8
Table 2. Characterization of Late Pleistocene and Holocene Transgression Sequence, Magnitude and Rates.*
Time Period (YBP) Description
Late Glacial Maximum 26,500 to ~19,000 calYBP Melting begins 17,000 calYBP Meltwater Pulse 1a 14,600 calYBP 13.5 meters in 290 years
Full glacial conditions, sea levels at maximum lowering and full exposure of the continental shelf offshore 120-60m. Glacial melting begins after 14,000 with a major pulse of melting at 14,600 calYBP (Blanchon 2011) at a rate and magnitude of 13.5 meters in 290 years. Almost half of the total glacial melting occurred between MWP 1a and MWP 1b. Sea levels rose somewhere between 40- and 60-meter isobaths depending on regional particulars (Balsillie and Donoghue 2004; Lowery et al. 2012; Siddall et al. 2003).
Younger Dryas (YD) 13,000 to 11,400 calYBP Reduction in melting
Younger Dryas return to glacial conditions. The abrupt initiation of climate change is absolutely coterminous with the appearance of Clovis Paleoindian cultural groups.
Meltwater Pulse 1b 11,400 to 9,000 calYBP 7.5 meters in 160 years
Dramatic glacial melting occurred a second time known as MWP 1b. Early Archaic cultural time frame.
Meltwater Pulse 1c at 8,000 calYBP 6.5 meters in less than 140 years
MWP 1c is the last pulse of meltwater.
After 5,000 less than 5 m below today, fluctuations
High and low stands proposed
*From Blanchon 2011
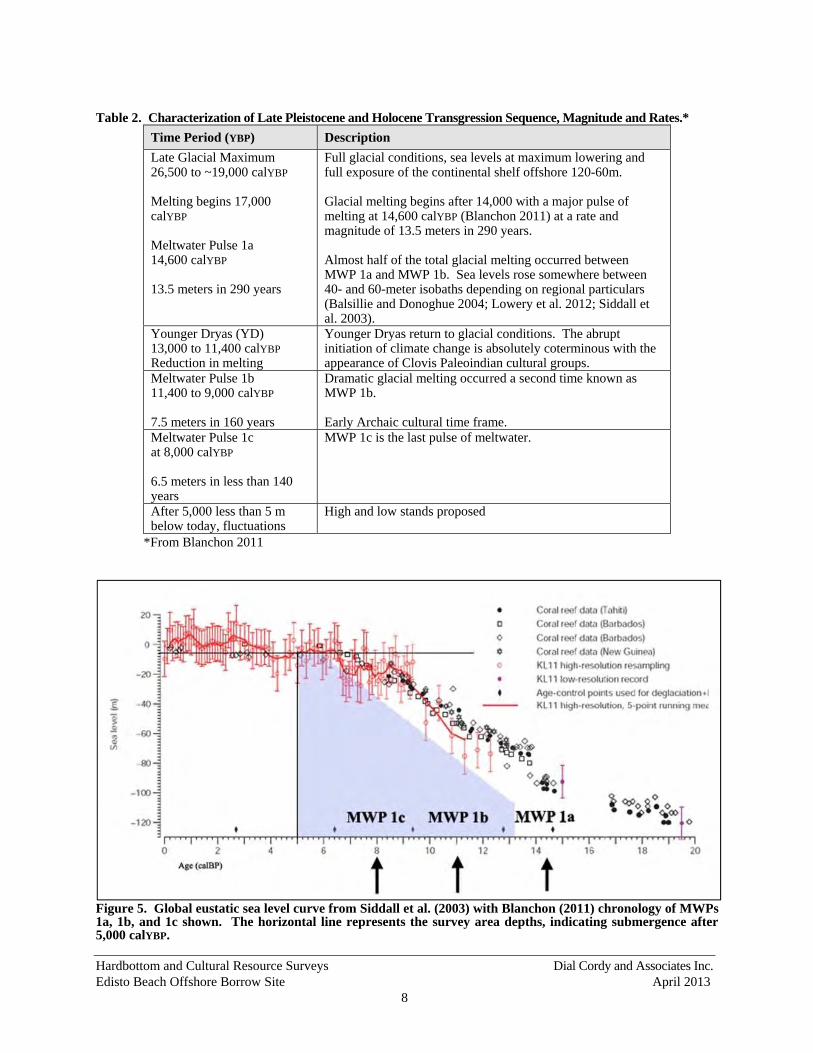
Figure 5. Global eustatic sea level curve from Siddall et al. (2003) with Blanchon (2011) chronology of MWPs 1a, 1b, and 1c shown. The horizontal line represents the survey area depths, indicating submergence after 5,000 calYBP.
Hardbottom and Cultural Resource Surveys Dial Cordy and Associates Inc. Edisto Beach Offshore Borrow Site April 2013
9
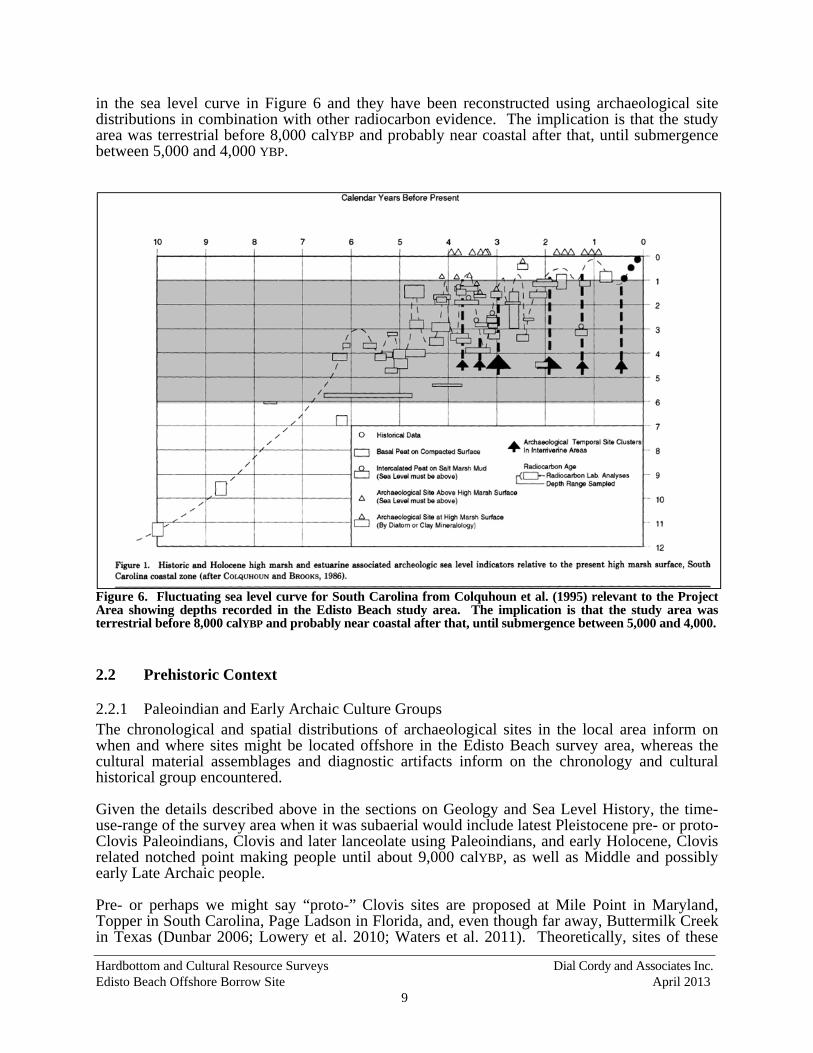
in the sea level curve in Figure 6 and they have been reconstructed using archaeological site distributions in combination with other radiocarbon evidence. The implication is that the study area was terrestrial before 8,000 calYBP and probably near coastal after that, until submergence between 5,000 and 4,000 YBP.
Figure 6. Fluctuating sea level curve for South Carolina from Colquhoun et al. (1995) relevant to the Project Area showing depths recorded in the Edisto Beach study area. The implication is that the study area was terrestrial before 8,000 calYBP and probably near coastal after that, until submergence between 5,000 and 4,000.
2.2 Prehistoric Context
2.2.1 Paleoindian and Early Archaic Culture Groups The chronological and spatial distributions of archaeological sites in the local area inform on when and where sites might be located offshore in the Edisto Beach survey area, whereas the cultural material assemblages and diagnostic artifacts inform on the chronology and cultural historical group encountered. Given the details described above in the sections on Geology and Sea Level History, the time-use-range of the survey area when it was subaerial would include latest Pleistocene pre- or proto-Clovis Paleoindians, Clovis and later lanceolate using Paleoindians, and early Holocene, Clovis related notched point making people until about 9,000 calYBP, as well as Middle and possibly early Late Archaic people. Pre- or perhaps we might say “proto-” Clovis sites are proposed at Mile Point in Maryland, Topper in South Carolina, Page Ladson in Florida, and, even though far away, Buttermilk Creek in Texas (Dunbar 2006; Lowery et al. 2010; Waters et al. 2011). Theoretically, sites of these
Hardbottom and Cultural Resource Surveys Dial Cordy and Associates Inc. Edisto Beach Offshore Borrow Site April 2013
10
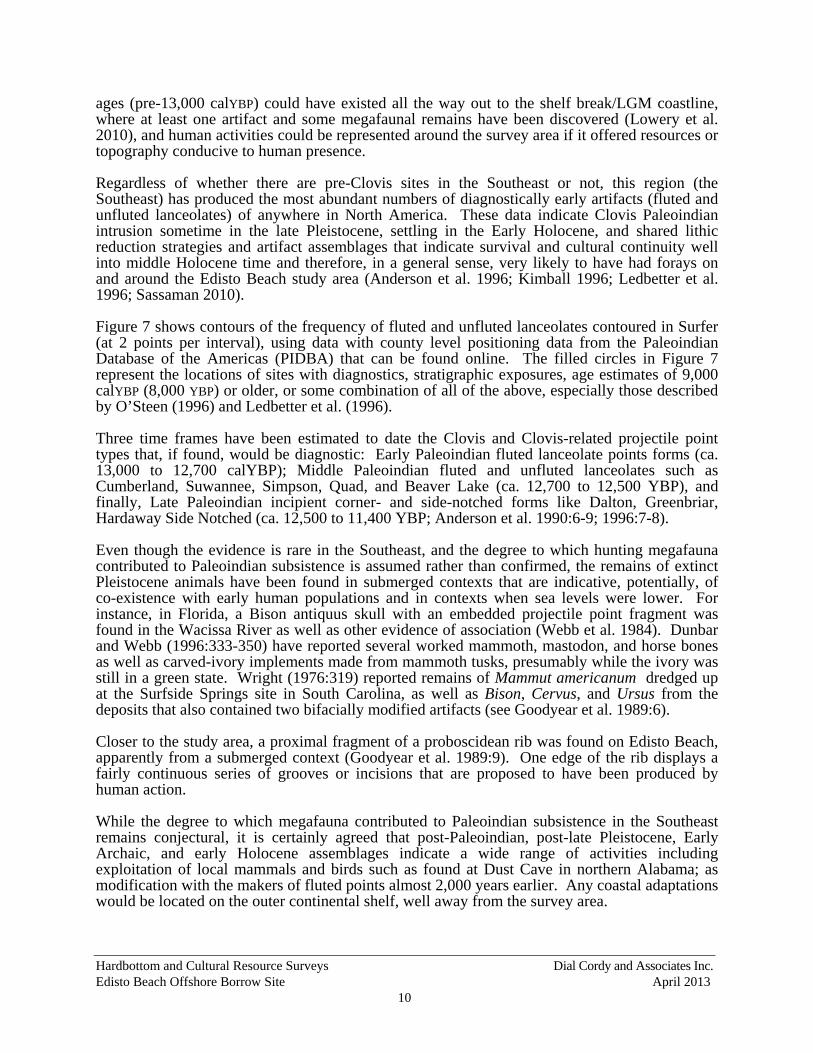
ages (pre-13,000 calYBP) could have existed all the way out to the shelf break/LGM coastline, where at least one artifact and some megafaunal remains have been discovered (Lowery et al. 2010), and human activities could be represented around the survey area if it offered resources or topography conducive to human presence. Regardless of whether there are pre-Clovis sites in the Southeast or not, this region (the Southeast) has produced the most abundant numbers of diagnostically early artifacts (fluted and unfluted lanceolates) of anywhere in North America. These data indicate Clovis Paleoindian intrusion sometime in the late Pleistocene, settling in the Early Holocene, and shared lithic reduction strategies and artifact assemblages that indicate survival and cultural continuity well into middle Holocene time and therefore, in a general sense, very likely to have had forays on and around the Edisto Beach study area (Anderson et al. 1996; Kimball 1996; Ledbetter et al. 1996; Sassaman 2010). Figure 7 shows contours of the frequency of fluted and unfluted lanceolates contoured in Surfer (at 2 points per interval), using data with county level positioning data from the Paleoindian Database of the Americas (PIDBA) that can be found online. The filled circles in Figure 7 represent the locations of sites with diagnostics, stratigraphic exposures, age estimates of 9,000 calYBP (8,000 YBP) or older, or some combination of all of the above, especially those described by O’Steen (1996) and Ledbetter et al. (1996). Three time frames have been estimated to date the Clovis and Clovis-related projectile point types that, if found, would be diagnostic: Early Paleoindian fluted lanceolate points forms (ca. 13,000 to 12,700 calYBP); Middle Paleoindian fluted and unfluted lanceolates such as Cumberland, Suwannee, Simpson, Quad, and Beaver Lake (ca. 12,700 to 12,500 YBP), and finally, Late Paleoindian incipient corner- and side-notched forms like Dalton, Greenbriar, Hardaway Side Notched (ca. 12,500 to 11,400 YBP; Anderson et al. 1990:6-9; 1996:7-8). Even though the evidence is rare in the Southeast, and the degree to which hunting megafauna contributed to Paleoindian subsistence is assumed rather than confirmed, the remains of extinct Pleistocene animals have been found in submerged contexts that are indicative, potentially, of co-existence with early human populations and in contexts when sea levels were lower. For instance, in Florida, a Bison antiquus skull with an embedded projectile point fragment was found in the Wacissa River as well as other evidence of association (Webb et al. 1984). Dunbar and Webb (1996:333-350) have reported several worked mammoth, mastodon, and horse bones as well as carved-ivory implements made from mammoth tusks, presumably while the ivory was still in a green state. Wright (1976:319) reported remains of Mammut americanum dredged up at the Surfside Springs site in South Carolina, as well as Bison, Cervus, and Ursus from the deposits that also contained two bifacially modified artifacts (see Goodyear et al. 1989:6). Closer to the study area, a proximal fragment of a proboscidean rib was found on Edisto Beach, apparently from a submerged context (Goodyear et al. 1989:9). One edge of the rib displays a fairly continuous series of grooves or incisions that are proposed to have been produced by human action. While the degree to which megafauna contributed to Paleoindian subsistence in the Southeast remains conjectural, it is certainly agreed that post-Paleoindian, post-late Pleistocene, Early Archaic, and early Holocene assemblages indicate a wide range of activities including exploitation of local mammals and birds such as found at Dust Cave in northern Alabama; as modification with the makers of fluted points almost 2,000 years earlier. Any coastal adaptations would be located on the outer continental shelf, well away from the survey area.
Hardbottom and Cultural Resource Surveys Dial Cordy and Associates Inc. Edisto Beach Offshore Borrow Site April 2013
11
Figure 7. A composite of ARCOOP (Archaeological Research Cooperative) data of archaeological sites earlier than 9,000 calYBP (black dots) and distribution of Paleoindian lanceolates contoured from PIDBA data. Note the cluster of late Paleoindian and Early Archaic sites up the Savannah and Pee Dee rivers. Diagnostics from a pan-regional sequence of early Holocene Early Archaic projectile point traditions that cover two millennia (11,400 to 9,000 calYBP) would represent a means of determining the chronology and cultural association of a submerged prehistoric site or isolated find from the dredge material. This early group includes the Side-Notched Tradition (11,400 to 10,500 calYBP), Corner-Notched Tradition (10,500 to 10,200 calYBP), and the Bifurcate Tradition (10,200 to 9,000 calYBP), although the latter is more common to the north (Elliott and Sassaman (1995:21 26). Inspection of the Georgia Bight coastal areas in Figure 8 shows that diagnostics and early sites have been found most frequently inland, along the Savannah River between Georgia and South Carolina and in the Oconee River behind the Wallace Dam. The best stratigraphic sequence is 9GE309, which is located on the alluvial plains of the Oconee River (Ledbetter et al. 1996:272; O’Steen 1996:99-100). Excavations revealed that the bottom-most deposits contained Clovis
Hardbottom and Cultural Resource Surveys Dial Cordy and Associates Inc. Edisto Beach Offshore Borrow Site April 2013
12
Figure 8. Bifurcate base projectile point found at Gray’s Reef, note the corrosion and patination of the surface of the material from exposure to the saltwater environment (photo courtesy of E. Garrison; scale in centimeters).
points while overlying strata yielded artifacts from earliest to latest in stratigraphic order: Clovis; Dalton/Big Sandy; Kirk Corner Notched; Bifurcates; and Kirk Stemmed varieties. Examples of any of these diagnostics could have been left in the Edisto Beach survey area in the past, when it was in a terrestrial configuration. A fluted biface was found underwater at Ossabaw that confirms this proposal (Ray 1986), as do the discoveries of ivory tool fragments and bifurcated projectile points made at Gray’s Reef, indicating human presence. The Ossabaw artifact has been designated as a “Clovis” point, but it is more consistent as a fluted biface preform. It would appear from the current state of knowledge that Paleoindian and Early Archaic sites do not occur in the coastal areas of South Carolina. However, it is a potential problem that the sites are there, but buried by more recent sediments in the coastal plain and marshlands and have yet to be discovered.
2.2.2 Middle and Late Archaic Groups The Middle Archaic in Georgia may be demarcated by the appearance of stemmed projectile points rather than notched or bifurcate base varieties (Chapman 1985:148), but the extremely low numbers of Middle Archaic sites known from the coast seem to indicate low probabilities for these sites in the inland waterways and marshes, unless they are buried by sedimentation. Archaeological sites increase in great numbers on barrier islands in Late Archaic time frames after 5,000 calYBP, when evidence shows people exploiting a rich variety of resources in the
Hardbottom and Cultural Resource Surveys Dial Cordy and Associates Inc. Edisto Beach Offshore Borrow Site April 2013
13
marshland estuaries, particularly shellfish and other aquatic resources. Slightly earlier sites of these culture groups could be submerged in the Edisto Beach survey area because the environments they utilized occurred out there and then migrated inland, retreating from the rising coastline.
2.2.2.1 Middle Archaic The Middle Archaic can include demarcation by the appearance of stemmed bifaces (Chapman 1985:148). The earliest Middle Archaic hafted biface types of this genre are the Kirk Stemmed, Kirk Serrated, and Stanley Stemmed types. On the other hand, Morrow Mountain projectile points are clearly one of the better known Middle Archaic stemmed points recovered from the South Atlantic Slope. Sassaman and Anderson (1995:24) reviewed a series of radiometric assays associated with various Morrow Mountain contexts in Tennessee, Alabama, Georgia, and South Carolina. The date estimates ranged from approximately 7,500 to 5,500 YBP, well within the range of Later Middle Archaic points that are found in the Coastal Plains of the region including the Guilford-related Brier Creek type. Sassaman and Anderson (1990:153) indicated that Brier Creek was possibly a Coastal Plain version of Guilford. They described a stratigraphic sequence at the Pen Point site in the Savannah River in which Brier Creek was found in a context lying above Morrow Mountain and below Savannah River Stemmed. Elliott and Sassaman (1995:34) suggested Guilford dates ranging from 6,000 to 5,000 YBP. They also mentioned the presence of other presumably coeval types resembling the closely related Sykes, White Springs, and Benton types. These varieties could be useful diagnostics if found in offshore contexts. Sassaman and Anderson (1995:149) pointed out that Middle Archaic sites are not very abundant in the South Atlantic Coastal Plain. Inasmuch as a vegetation or ecotone shift related to sea level rise may have occurred during this period in which pine expanded at the expense of oak, some researchers have suggested that the pine-rich forests were not as productive and therefore less attractive for human exploitation. Be that as it may, there is sufficient evidence of Middle Archaic activities in the region to conclude that the Coastal Plain was not completely abandoned. If there were more cores in the marshes, we might have a better control on the development of the marshes as sea levels approached today’s levels. Likewise, the ecotones of interest to the prehistoric inhabitants may have existed farther offshore, with slightly lower sea levels.
2.2.2.2 Late Archaic The earliest archaeological sites along the Georgia Bight barrier islands date to about 4,000 years ago, when evidence shows people exploiting a rich variety of resources in the marshland estuaries, particularly shellfish (Turck et al. 2011). Three types of Late Archaic sites have been identified that might be used for modeling the kinds of sites expected in the Edisto Beach study area: (1) scattered sites along marsh edges and bluffs (including those not bearing substantial shell accumulations); (2) marsh shell middens; and (3) shell rings (Waring 1968). Shellfish collecting also appears to have been an important activity in riverine settings, particularly along the Savannah and Ogeechee rivers (Elliott and Sassaman 1995:143). Other common diagnostic artifacts include net sinkers, steatite vessels, and shell ornaments. In addition, there were weir features and other technologies for aquatic and avian resources (Elliott and Sassaman 1995:38-38). These features could be expected in the study area in intact situations. Crook (2007) has described research at the Bilbo Site (9CH4) in Savannah that indicates evidence of a pile-dwelling and shell midden during the late middle Holocene about 4,000 to 3,000 YBP. Crook argues that pile dwellings “…were a central feature of the cultural adaptive system, allowing settlements to be located in wetlands that provided optimal access to the evolving food resources of multiple, dynamic environments” (Crook 2007:223). One of these may have been located in the Edisto Beach study area (described in the Sidescan Sonar Results section below).
Hardbottom and Cultural Resource Surveys Dial Cordy and Associates Inc. Edisto Beach Offshore Borrow Site April 2013
14
There is little potential for Woodland period or later culture groups in the Edisto Beach study area and therefore no need to continue describing the local prehistoric background.
2.2.3 Potential For Submerged Prehistoric Sites As Garrison et al. (2012) point out; the potential for sites offshore is directly related to the presence of more recent quaternary age strata, which are most often significantly eroded. Sediment packages can build up in the lagoon on the lee side of barrier islands, and if those were preserved offshore, they could be expected to retain stratigraphic integrity and be at or near locations of human activities and refuse. The margins of paleochannels and terraces are prime locales for submerged prehistoric sites, and it is known that paleochannels can be preserved offshore (Figure 9). On the other hand, paleochannels are not perceivable by bathymetry because of the marine sediment cover, indicating that seismic (subbottom profiler) remote sensing is a critical tool for site survey and prediction (Garrison et al. 2008).
Figure 9. Cover of Thomas (2008) showing Native Americans along Georgia’s coast and the array of features and structures they had built for catching, processing, and preserving marshland fauna. These kinds of features can be preserved offshore given local preservation parameters.
Hardbottom and Cultural Resource Surveys Dial Cordy and Associates Inc. Edisto Beach Offshore Borrow Site April 2013
15
2.3 Historic Context The Project Area, located just offshore the South Edisto River Inlet, represents a minor maritime approach into and out of the South Edisto River and its tributaries, and to a lesser extent into and out of St. Helena Sound and its tributaries throughout the Historic period. This involved navigating through the often hazardous and constantly changing bars found across the mouth of the Sound. Located between the major commercial maritime ports of Charleston to the north and Savannah to the south, the history and associated maritime economies of the Project Area are in large part tied to these two centers. A historical accounting of these areas is therefore relevant when it comes to a discussion of the Project Area and any potential for historic shipwreck sites. The initial European contact within the Carolinas took place in 1514, as Luis Vasquez de Ayllon sent an agent to find a source of labor for his plantations in the Caribbean. In 1521, Francisco Gordillo, supported by de Ayllon, sailed along the American coast north of Florida. Although the adventure was unprofitable for Ayllon, he still held hopes of profiting in the region. In 1523, he received a patent from the King of Spain to explore the coast and set up a colony. After an initial reconnaissance in 1525, he fitted out four vessels with over 500 colonists and left Santo Domingo for the Carolinas in 1526 (Edgar 1998:21; Morison 1971:332). The initial landing, suspected near the Cape Fear River, was unsuccessful and they moved south and established San Miguel de Gualdape near the mouth of the Waccamaw River, South Carolina—although some place it at Punta de Santa Elena, which is the sight of modern Port Royal to the south of the Project Area. By 1527, Ayllon was dead and the colony broke up; approximately 150 survivors straggled back to Hispaniola (Coker 1987:2). Three years after Gordillo’s initial Carolina reconnaissance, Verrazano, an Italian from Florence sailing for Francois I, the King of France, left Europe on a voyage to find a route to China in January 1524. His vessel La Dauphine, named after the French heir to the throne, was 100 tons and manned by a crew of 50. After a tempest-tossed crossing, he fetched up close to Cape Fear, North Carolina in early March. Verrazano initially coasted south along the eastern coast of present day South Carolina for approximately 100 miles, but then turned north to avoid the Spanish who had dominant control over the Caribbean (as well as Floridian) waters. After some brief reconnaissance along the coast, he continued on his voyage north and eventually returned to France in July. Being a competent seaman and navigator, Verrazano was able to conclude that he did not reach China, but a New World (Morison 1971:314). The French, however, did not follow up on Verrazano’s discovery of these lands. Hernando de Soto explored the southeastern coast starting from north of Florida to the Mississippi River. Part of de Soto’s itinerary took him through the sand hills and piedmont region of South Carolina. His travels aided in reinforcing the Spanish claim to the lands north of Florida. In 1559, King Philip II of Spain ordered a settlement be placed at Punta Santa Elena in Port Royal Sound, the best natural harbor in the Southeast (just south of St. Helena Sound and the Project Area). This settlement was to act as a buffer to other encroaching European powers. The settlement was a failure however, as a hurricane destroyed three of the four vessels and 26 of the ~100 men involved in the expedition died (Edgar 1998:22-26). During 1562, the French sent two more vessels to explore along the Carolina coast. Jean Ribaut took possession of the area in the name of the King of France Charles IX. The original settlement at Port Royal did not survive long, as there was internal dissention and the post was abandoned. The French were not to be discouraged and two years later a second attempt, under Rene de Laudonniere, established a settlement at Fort Caroline, on the St. Johns River in Florida (Coker 1987:3). The French settlement in Florida was a danger to the Spanish homeward fleets carrying New World wealth to Spain. King Philip II of Spain dispatched Menendez de Aviles to eradicate the
Hardbottom and Cultural Resource Surveys Dial Cordy and Associates Inc. Edisto Beach Offshore Borrow Site April 2013
16
problem in 1565. Fort Caroline was taken by a land assault and, after a promise of fair treatment; the defenders were all put to death. The French avenged the treachery three years later when the fort was retaken and all Spanish prisoners were murdered (Morison 1971:470). The Spanish, in an attempt to maintain sovereignty over the region, resettled at Port Royal in 1566. When Francis Drake captured and burned St. Augustine in 1586, the post was abandoned. Being on the edge of Empire, South Carolina took on a frontier characteristic. The English, late into the colonization lottery, established some New World colonies and concentrated north of Virginia. There were attempts to settle the area between Virginia and Spanish-controlled Florida, but all failed until the 1660s. On March 24, 1663, King Charles II of England granted a charter to eight men to be the “absolute lords and proprietors” of a colony between Virginia and Spanish Florida (Edgar 1998:39). The same year Captain William Hilton, for which Hilton Head Island is named, along with Robert Sanford would explore the Port Royal Sound and identify the area as suitable for a settlement. Prompted by the discoveries, a settlement was begun on the Ashley River on a bluff called Albemarle Point. The same year, with the aid of the local Indians, the English established their first permanent South Carolina settlement at Charles Towne in 1670. A decade later it was reported that there were between 1,000 and 1,200 residents in town (Coker 1987:8). As Charleston became an English commercial center, advantageously situated just off the Gulf Stream, it attracted a various number of entrepreneurs. Close proximity to the Spanish and French positions in the Caribbean encouraged trade, both legal and illegal. During the early Colonial period, piracy was an activity that was tolerated, if not encouraged; if the intended targets were of the mother country’s adversary and there was an advantage to be gained (Ritchie 1986:11-26). Throughout the years, men such as Drake and Morgan were lionized by the English for their activities against the Spanish. In America, New York, Boston, Newport, and Charleston were havens for many pirates (Cordingly 1995:15). Coker (1987:10) states, at Charleston, “The authorities of the fledgling colony were in no position to challenge them. In fact, they may have encouraged these outlaws of the sea, since their booty was scattered around generously.” At first, these coastal ports took advantage of the “wealth” created by these individuals. Nevertheless, as frontier status moved inland and coastal ports expanded as economic and cultural centers, attitudes changed. By the end of the seventeenth century, views towards piracy began to change. English pressure continued to increase on the northern Spanish border as the seventeenth century progressed. In 1680, an attack on the town of Santa Catalina was repelled, but the inhabitants were ordered to pull back to the south, out of attack range. This move may have protected Spanish settlements from English attack, but the Spanish departure also encouraged the Yamasee to revolt under the leadership of Chief Altamaha in 1683. This revolt resulted in a Spanish order to withdraw from the Guale area entirely and into the Spanish territory of Florida. With the Spanish out of Guale and the English coming in from the north out of Charles Towne, some Yamasee moved into central Georgia, while others moved into the interior of South Carolina and Florida (McKivergan and Fryman 1996:70; Coleman 1991:13). In 1702, European politics spilled over into the colonies when Queen Anne’s War (The War of Spanish Succession) erupted in 1702. This war had a devastating effect on Spanish colonial holdings in America. In this war, the Governor of Carolina, James Moore, swept through Guale and into Florida. When the war ended in 1713, most Spanish missions in Georgia and Florida were completely destroyed, as was St. Augustine. Only the fortress at St. Augustine escaped destruction by Moore’s force. Immediately following Queen Anne’s War, the Yamasee rebelled against what they felt were unfair trading practices by British traders, despite having, just two years earlier in 1711, fought on the side of the British in the Tuscarora War. This revolt, known as the Yamasee War, was
Hardbottom and Cultural Resource Surveys Dial Cordy and Associates Inc. Edisto Beach Offshore Borrow Site April 2013
17
characterized by repeated attacks on English frontier outposts and settlements. Over 400 colonists and an unknown number of Yamasee were killed (Braley et al. 1985:4). Much of this was played out near the Project Area when, after several massacres in Colleton County and across the Edisto River, Governor Craven on Good Friday 1715 dispatched the militia which defeated a band of eight to ten Indian canoes at the southern tip of Daufuskie Island. After the defeat of the Yamasee, the General Assembly of South Carolina opened Indian lands for settlement. With the establishment of Georgia in the 1730s as a defensive buffer between Spanish Florida and English planters in Charles Towne, the Yamasee were permanently relocated with the Spanish in Florida, who then moved some of them to Cuba and Veracruz, Mexico, as slaves, with the exception of a few scattered remnants of the Yamacraw. This signaled the removal of the last significant numbers of native people from the coastal South Carolina area (Divine et al. 1995:58-60; McKivergan and Fryman 1996:70-71). During this period, the town of Beaufort was founded based on its position to offer commerce in naval stores. With the establishment of the town, and the final 1728 raid against the Yamasee, St. Augustine signaled the beginning of settlement of the coastal lowlands and allowed the emergence of rice cultivation, which would form one of the mainstays for the area’s maritime commerce along with Sea Island cotton and naval stores. Free labor was not an option at this time, as it seems that it took the terror of the slave system to compel men and women to accomplish the herculean tasks involved in rice production. The crop had managed to sink its roots into South Carolina, and by the dawn of the eighteenth century, it was well established. In less than 25 years, it would become one of the most important commodities produced in South Carolina. At first, rice had been planted in an upland setting on marshy soil, but in the first half of the eighteenth century, an irrigation method was developed that utilized the swamps so common in the area. Everything about the production of rice was labor intensive and this labor was conducted with nothing more than hand tools; from clearing swamps, planting, and cultivating, to threshing and polishing the rice. Every step involved backbreaking work (Clifton 1978). In the upland setting, rice could be grown on a small-scale, but its production was not dependable. In the early 1750s, a new technique was developed that utilized the coastal tidal flow to move freshwater in and out of the cultivated rice fields (Clifton 1978). This technique would eventually supplant the upland method, but on the eastern coast it was only a viable option along the river systems south of Cape Fear to the Georgia coast and within 10 to 20 miles above saltwater. To make the land ready for this type of cultivation, a monumental amount of work was required. Generally, as one gang of slaves worked on clearing the area of trees and stumps, another built a large dyke around the area to be cultivated. Inside this enclosed area a smaller series of levees were built to encompass rice fields, usually about 20 acres in size. Canals and ditches were dug with trunk culverts serving as floodgates to control the water flow. Leaving an indelible mark in the maritime economies of the region, the outline of the rice plantation fields can still be seen along the banks of the South Edisto River on Jehossee and Sampson Islands. By the eighteenth century, piracy became a liability as a national strategy and for colonial commerce as best exampled by the fate of Captain Kidd. Originally under charter with establishment patronage, Kidd was later hung as a pirate in 1701 (Ritchie 1986). Cities that once welcomed pirate loot were soon targets of their predications. The early eighteenth century saw this shift in tactics, and Charleston (formerly Charles Town) was a perfect example of the phenomena. In August 1717, a pirate known as Stede Bonnet plundered a brigantine outside Charleston Harbor (Coker 1987:20). In late 1718, Captain Vane took eight vessels off the coast of South Carolina (Cordingly 1995:111). During the same year, the famous pirate Blackbeard (Edward Teach) plundered many vessels, disturbing much trade. Blackbeard then disbanded his pirate fleet off the coast (Coker 1987:18; Cordingly 1995:136). Other pirates left their mark on Charleston during the first decades of the eighteenth century as well. The colony of South
Hardbottom and Cultural Resource Surveys Dial Cordy and Associates Inc. Edisto Beach Offshore Borrow Site April 2013
18
Carolina soon looked to England and other colonies for help in ridding her waters of the sea marauders. British initiative to stop piracy took an active role at the beginning of the eighteenth century as a new form of national policy. The penalty for piracy was death, usually hanging. Charleston saw one of the largest executions of pirates in 1717 with the demise of Captain Stede Bonnet, when he and 29 of his men were hanged (Cordingly 1995:245). By 1720, Royal navy vessels patrolled off the coast of South Carolina to keep both the marauders and the Spanish away from the colony. In 1724, George Anson was stationed at Charleston as a permanent feature of English protection. When he left his station in 1730, the colony was in a much more tranquil state (Coker 1987:29-34). However, in 1741, Spanish privateers operated in South Carolina waters and one was often seen operating in the waters of St. Helena Sound. In March 1742, one anchored in the Edisto Inlet for several days culminating in a running gun battle in the Sound between the privateer and the Elizabeth, a brigantine out of New York, with the brigantine escaping capture (Rowland 1996:149). The English soon established Savannah, Georgia on the banks of the Savannah River in 1733, between South Carolina and Spanish Florida. This colony acted as a buffer to Charleston and aided in the growth and relative security of South Carolina. The final Spanish land advance north was stopped in 1742 at the Battle of Bloody Marsh on St. Simons Island, Georgia (Ginn 1987). The Treaty of Paris (1763) settled the matter, as the Spanish relinquished all claim to lands north of the St. Mary’s River. With a population expanding into the interior, the production of agricultural goods for export trade began to flourish. Timber, naval stores, rice, indigo, and eventually cotton were the main agricultural products exported from coastal, and later, the interior of South Carolina. Trade was to be the economic driving force of the colony. Situated at an important juncture along traditional sailing routes, Charleston prospered by this proximity. Vessels sailing from the Caribbean to points north and Europe could easily stop over to fill their vessels with local products. Charleston, one of only two major ports in the Southeast (the second being Savannah), extended its trade influence into Georgia and North Carolina. Just prior to the Revolution, the port cleared approximately 450 vessels and had total annual imports and exports to Great Britain of some 800,000 pounds (Labaree 1999:101-103). Charleston also controlled the slave trade of the southern colonies. The Carolina low country produced rice and indigo, with cotton soon becoming the major cash crop. Such large tracts of land required a large work force generally made up of African slaves; hence, the slave population expanded greatly. Early in the history of the province, it was feared that the African population was becoming numerically superior. By 1703, there were actually a few more blacks in South Carolina than whites. Twenty years later, blacks outnumbered whites 2 to 1, a ratio which would continue to the Revolution (Edgar 1998:69). The reason for this was the slave trade and economic dependence on labor-intensive agriculture. “Between 1700 and 1775, 40 percent of the Africans imported into North America came through Charleston” (Edgar 1998:67). During the American Revolution, the Carolina backcountry was a bit of an anomaly. Railing against their defacto disenfranchisement by coastal areas and more inclined to self-rule, parts of the backcounty supported the British. At first, the British counted on the support of the large Germanic community in support of England’s German King George III. However, the conflict became a local hell with Tory/British supporters and Whig/Republicans committing numerous acts of cruelty upon each other in the region, disrupting settlements and agriculture (Savage 1956:207, 214-218). However, the shippers and planters along the coast were firmly in the camp of the republican cause.
Hardbottom and Cultural Resource Surveys Dial Cordy and Associates Inc. Edisto Beach Offshore Borrow Site April 2013
19
While the Revolution was disastrous for Charleston, it also left its mark on the local area. Port Royal to the south saw a British invasion with Fort Lyttleton the focal point, although the invaders were beaten back. Beaufort would be taken, but would be recaptured by 1872. With the signing of the Treaty of Paris, hostilities would end, but the markets in the West Indies once open to maritime trade would be lost, subsequently inflicting an economic downturn for the area. However, the development by Eli Whitney of the cotton gin in 1793 would bring about radical economic changes to the local landscape. With this one machine, the entire southern region would become locked into an agricultural economy based on cotton. In 1791, South Carolina raised about 1,500,000 pounds of cotton and by 1834, approximately 65,500,000 pounds were produced, an almost 4,400 % increase (Wallace 1951:364). Virtually all of the rice and cotton from plantations along the South Carolina and Georgia coasts, as well as exported produce from the farms and landings, were handled by the coastal trade (Haunton 1968:2; Pearson 1991:488). Pearson, in a study of a Georgia coasting captain, states that:
…the factors and commission merchants of Savannah were indispensable in the agricultural economy of the region and were the key figures in marketing crops. They acted as combination merchant, buyer, and banker for the planters, providing an outlet for plantation produce, a source of credit, which was a necessity in a staple crop agricultural economy, and a store for many of the finished and luxury goods plantation owners and their families required. The coastal ship captain was the tie connecting the planter and factor. His vessels carried the casks of rice and bags of cotton from the plantation landings to the factorage houses in Savannah and returned with building materials, machinery, farming implements, domestic goods, foodstuffs and other commodities. The commerce of the region was dependent upon this coastal fleet [Pearson 1991:488].
Most of the vessels in the coastal trade sailed between Savannah or Charleston and smaller towns and plantations along the South Carolina and Georgia coast. Their cargoes were brought to the two cities and transshipped on larger sailing vessels to the North, Europe, and throughout the Caribbean (Pearson 1991:492). Rice and cotton were the major agricultural items shipped by coastal vessels:
“Most shipments of rice occurred between October and March, although it was not uncommon for them to continue into Savannah as late as May or June … The cotton harvest corresponded closely to that of rice, beginning in September or October … (with) the bulk of the cotton … shipped between January and April peaking a couple of months after the rice shipments” (Pearson 1991:493-496). Pearson continues that, “in addition to cotton and rice, the coasting vessels carried lesser quantities of other commodities from the coastal area: wood, resin, turpentine, hides, lime, molasses, moss, syrup, potatoes, and corn” [Pearson 1991:496].
Vessels involved in the coastal trade were primarily small sloops and schooners, generally under 100 tons burden, and most of these coastal vessels were built in small shipyards of the mid-Atlantic and Northeast coasts. The fact that vessels were built elsewhere for the area’s coastal trade was a reflection of the small shipbuilding industry in the Southeast (Pearson 1991:491-492). The Civil War was disastrous for the State of South Carolina. Port after port fell to the relentless Union attack. Port Royal, in South Carolina, was one of the first to fall; by mid-November 1861, it was in federal hands. Beaufort and Port Royal would become the South Atlantic Blockade Squadron headquarters with its naval vessels blockading the ports of Savannah and Charleston. The economic impact of the war had a dramatic effect on the local economy and way of life including maritime trade. For many parts of the South, Reconstruction meant adjusting to an entirely new way of life, both economically and socially; however, old land-use patterns established prior to the Civil War persisted. The number of small family farms continued to grow,
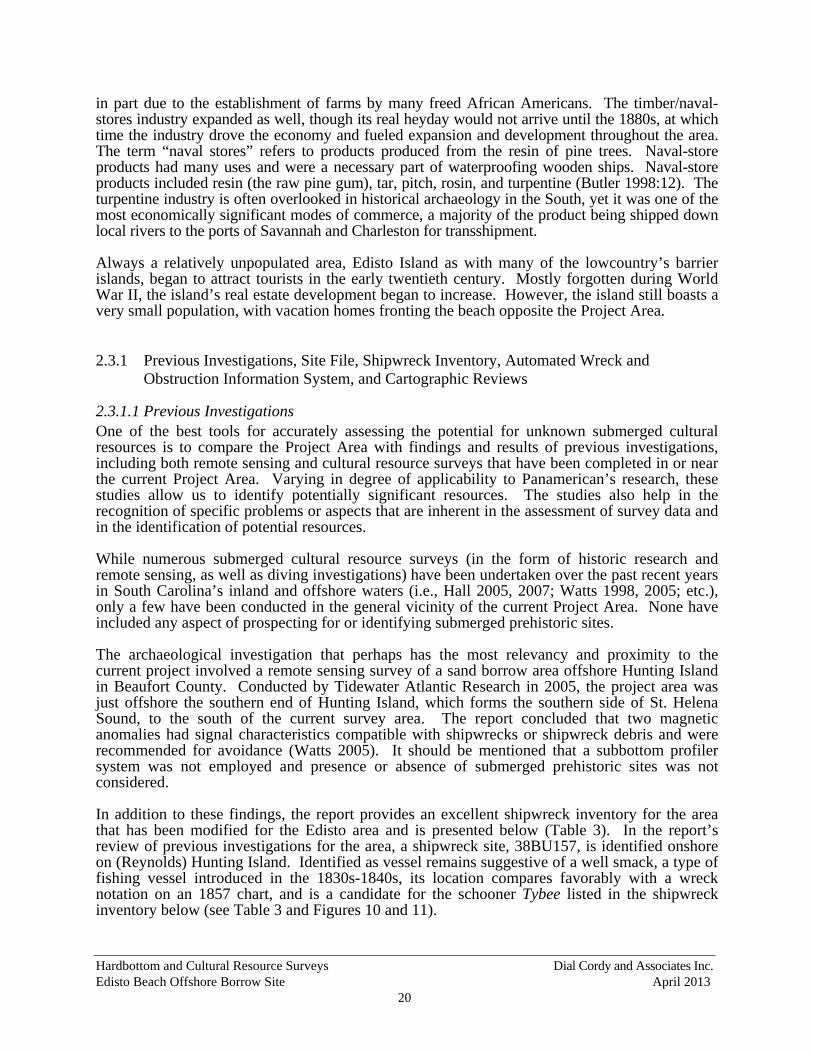
Hardbottom and Cultural Resource Surveys Dial Cordy and Associates Inc. Edisto Beach Offshore Borrow Site April 2013
20
in part due to the establishment of farms by many freed African Americans. The timber/naval-stores industry expanded as well, though its real heyday would not arrive until the 1880s, at which time the industry drove the economy and fueled expansion and development throughout the area. The term “naval stores” refers to products produced from the resin of pine trees. Naval-store products had many uses and were a necessary part of waterproofing wooden ships. Naval-store products included resin (the raw pine gum), tar, pitch, rosin, and turpentine (Butler 1998:12). The turpentine industry is often overlooked in historical archaeology in the South, yet it was one of the most economically significant modes of commerce, a majority of the product being shipped down local rivers to the ports of Savannah and Charleston for transshipment. Always a relatively unpopulated area, Edisto Island as with many of the lowcountry’s barrier islands, began to attract tourists in the early twentieth century. Mostly forgotten during World War II, the island’s real estate development began to increase. However, the island still boasts a very small population, with vacation homes fronting the beach opposite the Project Area.
2.3.1 Previous Investigations, Site File, Shipwreck Inventory, Automated Wreck and Obstruction Information System, and Cartographic Reviews
2.3.1.1 Previous Investigations One of the best tools for accurately assessing the potential for unknown submerged cultural resources is to compare the Project Area with findings and results of previous investigations, including both remote sensing and cultural resource surveys that have been completed in or near the current Project Area. Varying in degree of applicability to Panamerican’s research, these studies allow us to identify potentially significant resources. The studies also help in the recognition of specific problems or aspects that are inherent in the assessment of survey data and in the identification of potential resources. While numerous submerged cultural resource surveys (in the form of historic research and remote sensing, as well as diving investigations) have been undertaken over the past recent years in South Carolina’s inland and offshore waters (i.e., Hall 2005, 2007; Watts 1998, 2005; etc.), only a few have been conducted in the general vicinity of the current Project Area. None have included any aspect of prospecting for or identifying submerged prehistoric sites. The archaeological investigation that perhaps has the most relevancy and proximity to the current project involved a remote sensing survey of a sand borrow area offshore Hunting Island in Beaufort County. Conducted by Tidewater Atlantic Research in 2005, the project area was just offshore the southern end of Hunting Island, which forms the southern side of St. Helena Sound, to the south of the current survey area. The report concluded that two magnetic anomalies had signal characteristics compatible with shipwrecks or shipwreck debris and were recommended for avoidance (Watts 2005). It should be mentioned that a subbottom profiler system was not employed and presence or absence of submerged prehistoric sites was not considered. In addition to these findings, the report provides an excellent shipwreck inventory for the area that has been modified for the Edisto area and is presented below (Table 3). In the report’s review of previous investigations for the area, a shipwreck site, 38BU157, is identified onshore on (Reynolds) Hunting Island. Identified as vessel remains suggestive of a well smack, a type of fishing vessel introduced in the 1830s-1840s, its location compares favorably with a wreck notation on an 1857 chart, and is a candidate for the schooner Tybee listed in the shipwreck inventory below (see Table 3 and Figures 10 and 11).
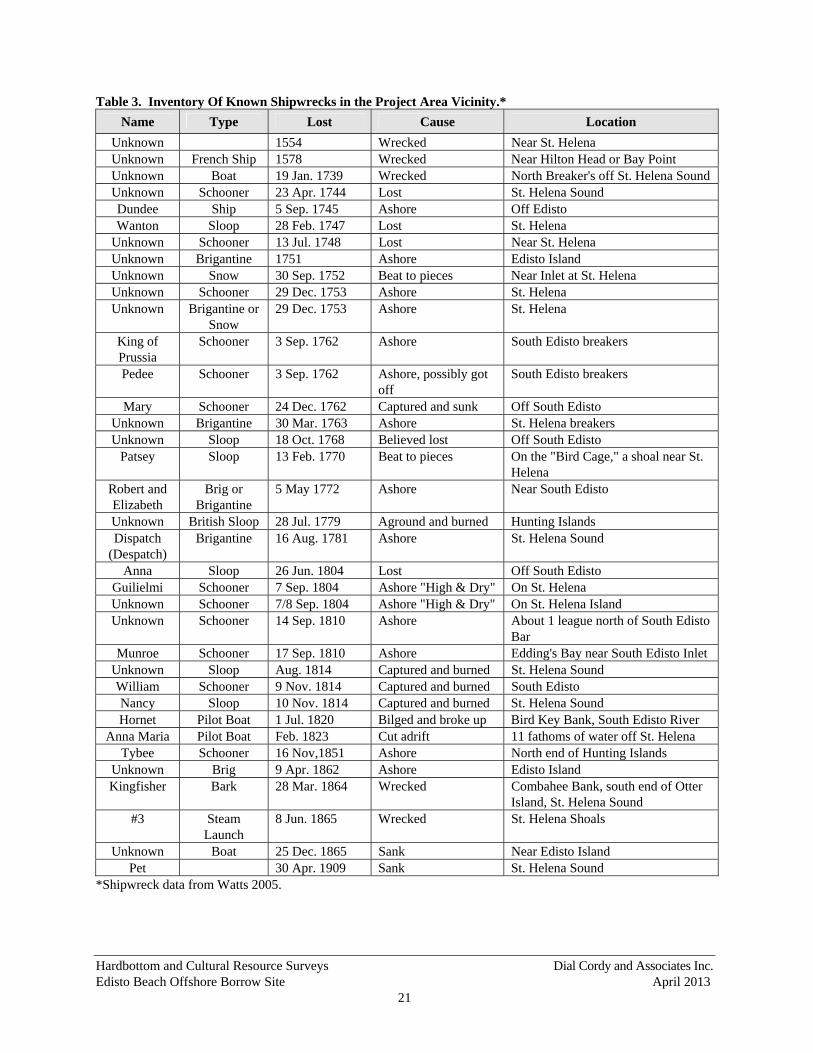
Hardbottom and Cultural Resource Surveys Dial Cordy and Associates Inc. Edisto Beach Offshore Borrow Site April 2013
21
Table 3. Inventory Of Known Shipwrecks in the Project Area Vicinity.*
Name Type Lost Cause Location
Unknown 1554 Wrecked Near St. Helena Unknown French Ship 1578 Wrecked Near Hilton Head or Bay Point Unknown Boat 19 Jan. 1739 Wrecked North Breaker's off St. Helena Sound Unknown Schooner 23 Apr. 1744 Lost St. Helena Sound Dundee Ship 5 Sep. 1745 Ashore Off Edisto Wanton Sloop 28 Feb. 1747 Lost St. Helena
Unknown Schooner 13 Jul. 1748 Lost Near St. Helena Unknown Brigantine 1751 Ashore Edisto Island Unknown Snow 30 Sep. 1752 Beat to pieces Near Inlet at St. Helena Unknown Schooner 29 Dec. 1753 Ashore St. Helena Unknown Brigantine or
Snow 29 Dec. 1753 Ashore St. Helena
King of Prussia
Schooner 3 Sep. 1762 Ashore South Edisto breakers
Pedee Schooner 3 Sep. 1762 Ashore, possibly got off
South Edisto breakers
Mary Schooner 24 Dec. 1762 Captured and sunk Off South Edisto Unknown Brigantine 30 Mar. 1763 Ashore St. Helena breakers Unknown Sloop 18 Oct. 1768 Believed lost Off South Edisto
Patsey Sloop 13 Feb. 1770 Beat to pieces On the "Bird Cage," a shoal near St. Helena
Robert and Elizabeth
Brig or Brigantine
5 May 1772 Ashore Near South Edisto
Unknown British Sloop 28 Jul. 1779 Aground and burned Hunting Islands Dispatch
(Despatch) Brigantine 16 Aug. 1781 Ashore St. Helena Sound
Anna Sloop 26 Jun. 1804 Lost Off South Edisto Guilielmi Schooner 7 Sep. 1804 Ashore "High & Dry" On St. Helena Unknown Schooner 7/8 Sep. 1804 Ashore "High & Dry" On St. Helena Island Unknown Schooner 14 Sep. 1810 Ashore About 1 league north of South Edisto
Bar Munroe Schooner 17 Sep. 1810 Ashore Edding's Bay near South Edisto Inlet
Unknown Sloop Aug. 1814 Captured and burned St. Helena Sound William Schooner 9 Nov. 1814 Captured and burned South Edisto Nancy Sloop 10 Nov. 1814 Captured and burned St. Helena Sound Hornet Pilot Boat 1 Jul. 1820 Bilged and broke up Bird Key Bank, South Edisto River
Anna Maria Pilot Boat Feb. 1823 Cut adrift 11 fathoms of water off St. Helena Tybee Schooner 16 Nov,1851 Ashore North end of Hunting Islands
Unknown Brig 9 Apr. 1862 Ashore Edisto Island Kingfisher Bark 28 Mar. 1864 Wrecked Combahee Bank, south end of Otter
Island, St. Helena Sound #3 Steam
Launch 8 Jun. 1865 Wrecked St. Helena Shoals
Unknown Boat 25 Dec. 1865 Sank Near Edisto Island Pet 30 Apr. 1909 Sank St. Helena Sound
*Shipwreck data from Watts 2005.
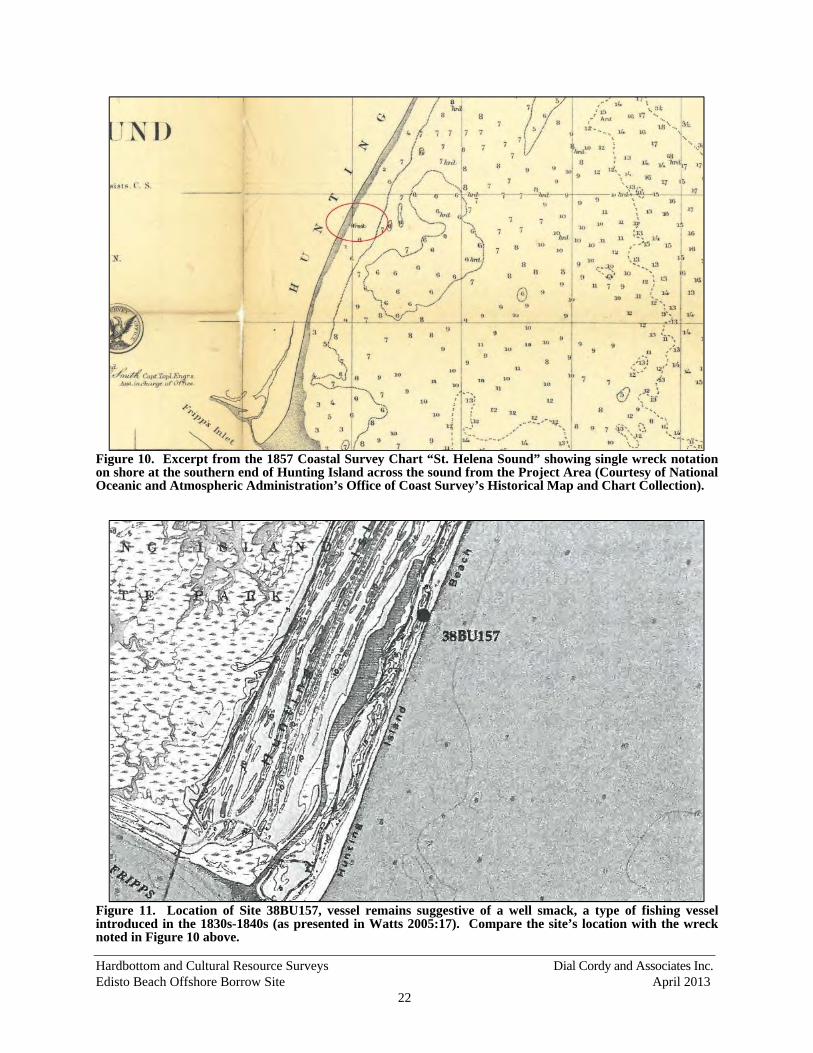
Hardbottom and Cultural Resource Surveys Dial Cordy and Associates Inc. Edisto Beach Offshore Borrow Site April 2013
22
Figure 10. Excerpt from the 1857 Coastal Survey Chart “St. Helena Sound” showing single wreck notation on shore at the southern end of Hunting Island across the sound from the Project Area (Courtesy of National Oceanic and Atmospheric Administration’s Office of Coast Survey’s Historical Map and Chart Collection).
Figure 11. Location of Site 38BU157, vessel remains suggestive of a well smack, a type of fishing vessel introduced in the 1830s-1840s (as presented in Watts 2005:17). Compare the site’s location with the wreck noted in Figure 10 above.
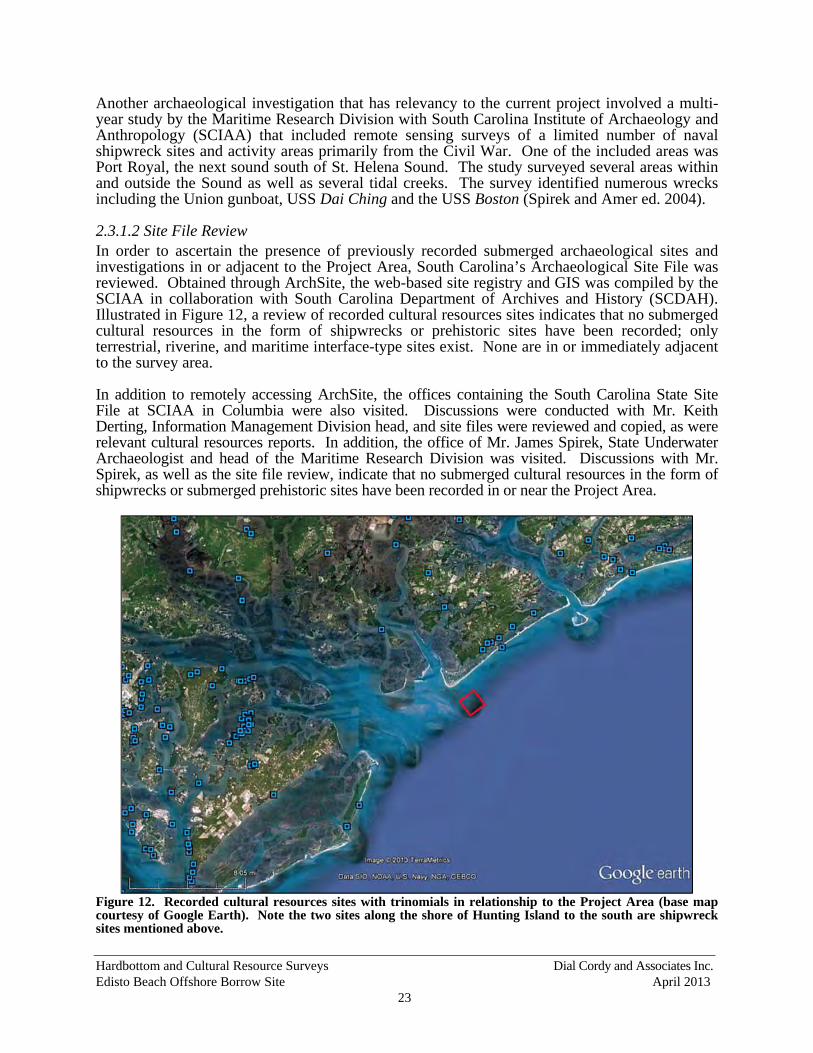
Hardbottom and Cultural Resource Surveys Dial Cordy and Associates Inc. Edisto Beach Offshore Borrow Site April 2013
23
Another archaeological investigation that has relevancy to the current project involved a multi-year study by the Maritime Research Division with South Carolina Institute of Archaeology and Anthropology (SCIAA) that included remote sensing surveys of a limited number of naval shipwreck sites and activity areas primarily from the Civil War. One of the included areas was Port Royal, the next sound south of St. Helena Sound. The study surveyed several areas within and outside the Sound as well as several tidal creeks. The survey identified numerous wrecks including the Union gunboat, USS Dai Ching and the USS Boston (Spirek and Amer ed. 2004).
2.3.1.2 Site File Review In order to ascertain the presence of previously recorded submerged archaeological sites and investigations in or adjacent to the Project Area, South Carolina’s Archaeological Site File was reviewed. Obtained through ArchSite, the web-based site registry and GIS was compiled by the SCIAA in collaboration with South Carolina Department of Archives and History (SCDAH). Illustrated in Figure 12, a review of recorded cultural resources sites indicates that no submerged cultural resources in the form of shipwrecks or prehistoric sites have been recorded; only terrestrial, riverine, and maritime interface-type sites exist. None are in or immediately adjacent to the survey area. In addition to remotely accessing ArchSite, the offices containing the South Carolina State Site File at SCIAA in Columbia were also visited. Discussions were conducted with Mr. Keith Derting, Information Management Division head, and site files were reviewed and copied, as were relevant cultural resources reports. In addition, the office of Mr. James Spirek, State Underwater Archaeologist and head of the Maritime Research Division was visited. Discussions with Mr. Spirek, as well as the site file review, indicate that no submerged cultural resources in the form of shipwrecks or submerged prehistoric sites have been recorded in or near the Project Area.
Figure 12. Recorded cultural resources sites with trinomials in relationship to the Project Area (base map courtesy of Google Earth). Note the two sites along the shore of Hunting Island to the south are shipwreck sites mentioned above.
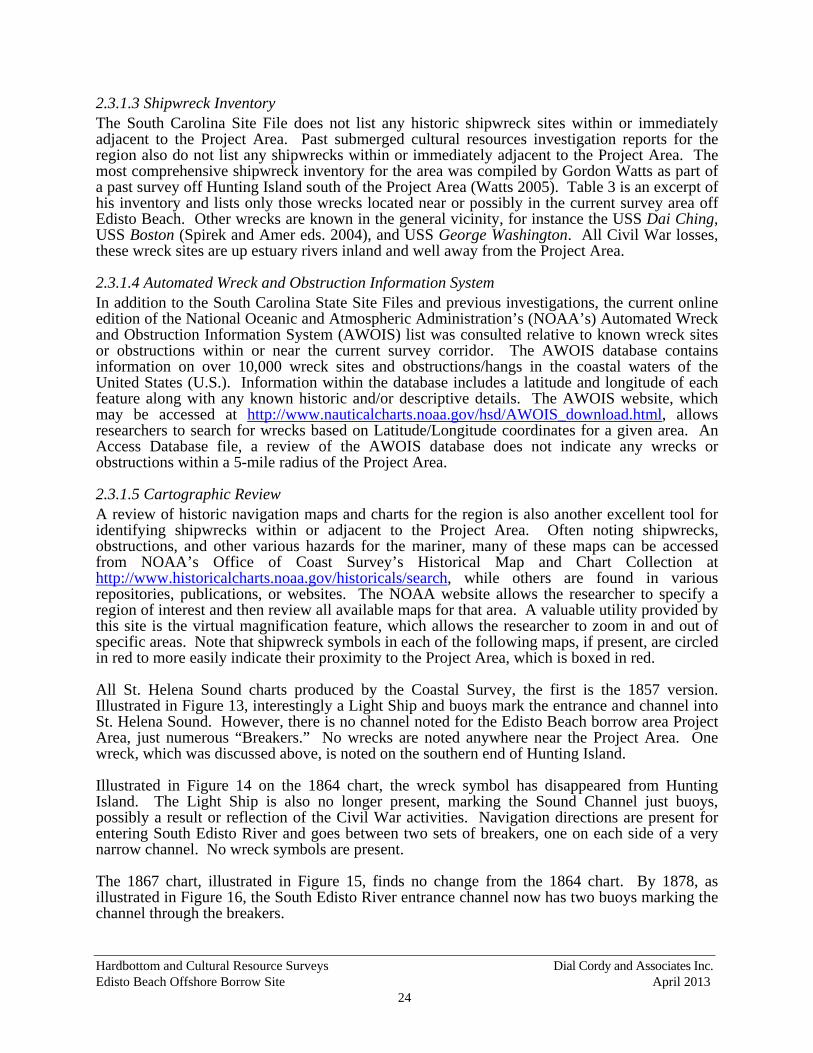
Hardbottom and Cultural Resource Surveys Dial Cordy and Associates Inc. Edisto Beach Offshore Borrow Site April 2013
24
2.3.1.3 Shipwreck Inventory The South Carolina Site File does not list any historic shipwreck sites within or immediately adjacent to the Project Area. Past submerged cultural resources investigation reports for the region also do not list any shipwrecks within or immediately adjacent to the Project Area. The most comprehensive shipwreck inventory for the area was compiled by Gordon Watts as part of a past survey off Hunting Island south of the Project Area (Watts 2005). Table 3 is an excerpt of his inventory and lists only those wrecks located near or possibly in the current survey area off Edisto Beach. Other wrecks are known in the general vicinity, for instance the USS Dai Ching, USS Boston (Spirek and Amer eds. 2004), and USS George Washington. All Civil War losses, these wreck sites are up estuary rivers inland and well away from the Project Area.
2.3.1.4 Automated Wreck and Obstruction Information System In addition to the South Carolina State Site Files and previous investigations, the current online edition of the National Oceanic and Atmospheric Administration’s (NOAA’s) Automated Wreck and Obstruction Information System (AWOIS) list was consulted relative to known wreck sites or obstructions within or near the current survey corridor. The AWOIS database contains information on over 10,000 wreck sites and obstructions/hangs in the coastal waters of the United States (U.S.). Information within the database includes a latitude and longitude of each feature along with any known historic and/or descriptive details. The AWOIS website, which may be accessed at http://www.nauticalcharts.noaa.gov/hsd/AWOIS_download.html, allows researchers to search for wrecks based on Latitude/Longitude coordinates for a given area. An Access Database file, a review of the AWOIS database does not indicate any wrecks or obstructions within a 5-mile radius of the Project Area.
2.3.1.5 Cartographic Review A review of historic navigation maps and charts for the region is also another excellent tool for identifying shipwrecks within or adjacent to the Project Area. Often noting shipwrecks, obstructions, and other various hazards for the mariner, many of these maps can be accessed from NOAA’s Office of Coast Survey’s Historical Map and Chart Collection at http://www.historicalcharts.noaa.gov/historicals/search, while others are found in various repositories, publications, or websites. The NOAA website allows the researcher to specify a region of interest and then review all available maps for that area. A valuable utility provided by this site is the virtual magnification feature, which allows the researcher to zoom in and out of specific areas. Note that shipwreck symbols in each of the following maps, if present, are circled in red to more easily indicate their proximity to the Project Area, which is boxed in red. All St. Helena Sound charts produced by the Coastal Survey, the first is the 1857 version. Illustrated in Figure 13, interestingly a Light Ship and buoys mark the entrance and channel into St. Helena Sound. However, there is no channel noted for the Edisto Beach borrow area Project Area, just numerous “Breakers.” No wrecks are noted anywhere near the Project Area. One wreck, which was discussed above, is noted on the southern end of Hunting Island. Illustrated in Figure 14 on the 1864 chart, the wreck symbol has disappeared from Hunting Island. The Light Ship is also no longer present, marking the Sound Channel just buoys, possibly a result or reflection of the Civil War activities. Navigation directions are present for entering South Edisto River and goes between two sets of breakers, one on each side of a very narrow channel. No wreck symbols are present. The 1867 chart, illustrated in Figure 15, finds no change from the 1864 chart. By 1878, as illustrated in Figure 16, the South Edisto River entrance channel now has two buoys marking the channel through the breakers.
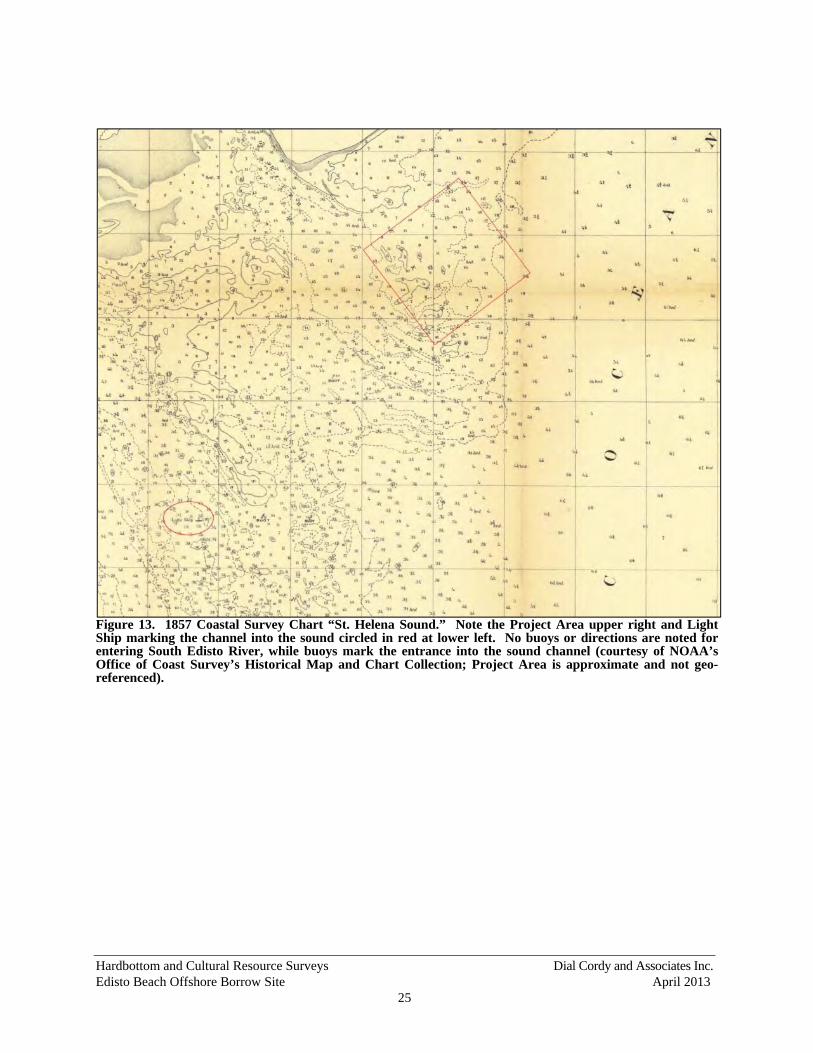
Hardbottom and Cultural Resource Surveys Dial Cordy and Associates Inc. Edisto Beach Offshore Borrow Site April 2013
25
Figure 13. 1857 Coastal Survey Chart “St. Helena Sound.” Note the Project Area upper right and Light Ship marking the channel into the sound circled in red at lower left. No buoys or directions are noted for entering South Edisto River, while buoys mark the entrance into the sound channel (courtesy of NOAA’s Office of Coast Survey’s Historical Map and Chart Collection; Project Area is approximate and not geo-referenced).
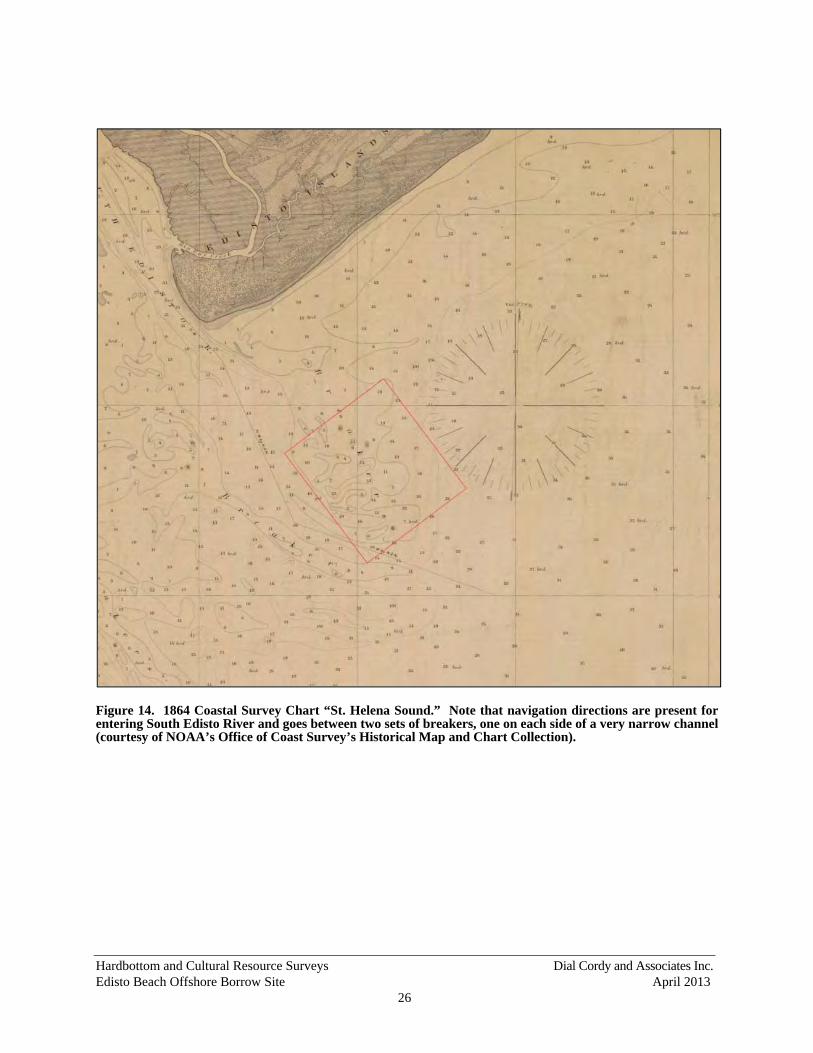
Hardbottom and Cultural Resource Surveys Dial Cordy and Associates Inc. Edisto Beach Offshore Borrow Site April 2013
26
Figure 14. 1864 Coastal Survey Chart “St. Helena Sound.” Note that navigation directions are present for entering South Edisto River and goes between two sets of breakers, one on each side of a very narrow channel (courtesy of NOAA’s Office of Coast Survey’s Historical Map and Chart Collection).
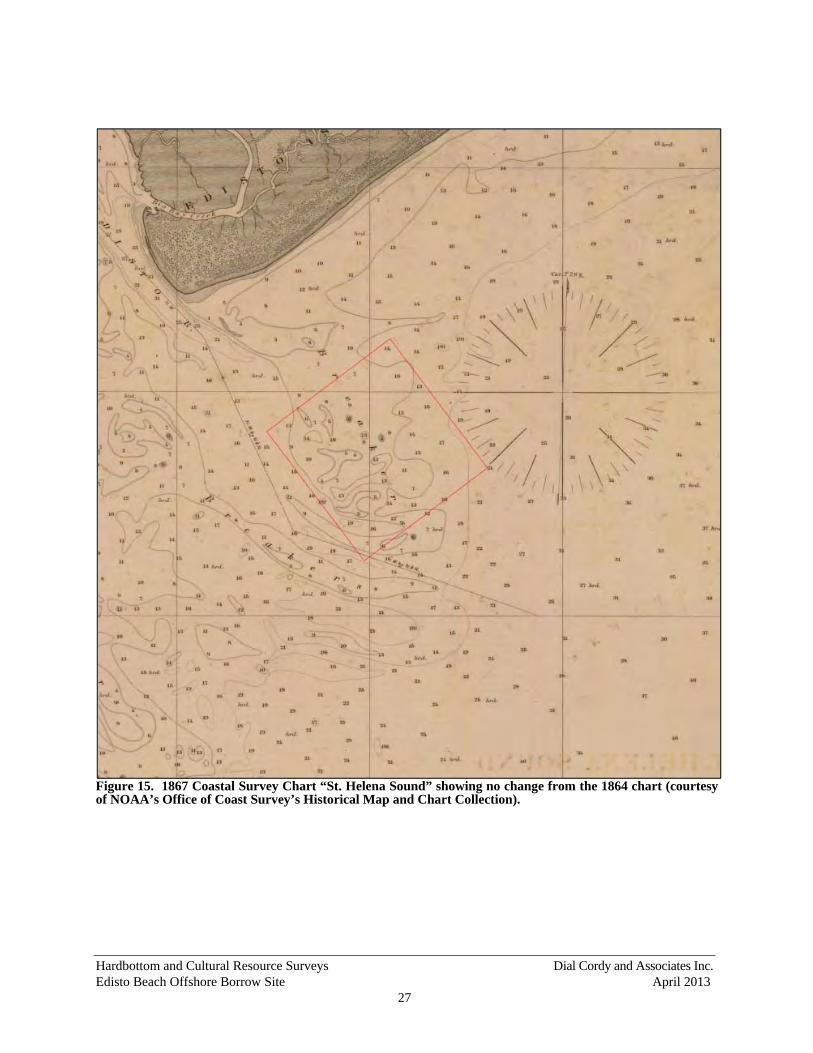
Hardbottom and Cultural Resource Surveys Dial Cordy and Associates Inc. Edisto Beach Offshore Borrow Site April 2013
27
Figure 15. 1867 Coastal Survey Chart “St. Helena Sound” showing no change from the 1864 chart (courtesy of NOAA’s Office of Coast Survey’s Historical Map and Chart Collection).
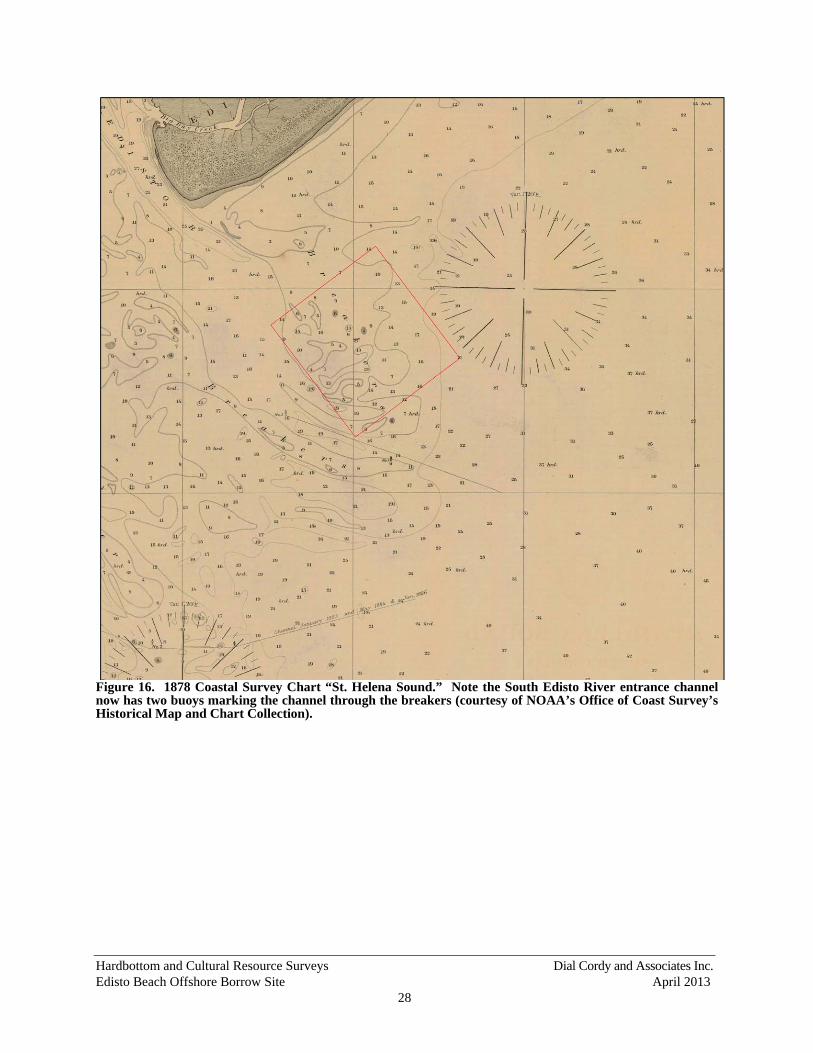
Hardbottom and Cultural Resource Surveys Dial Cordy and Associates Inc. Edisto Beach Offshore Borrow Site April 2013
28
Figure 16. 1878 Coastal Survey Chart “St. Helena Sound.” Note the South Edisto River entrance channel now has two buoys marking the channel through the breakers (courtesy of NOAA’s Office of Coast Survey’s Historical Map and Chart Collection).
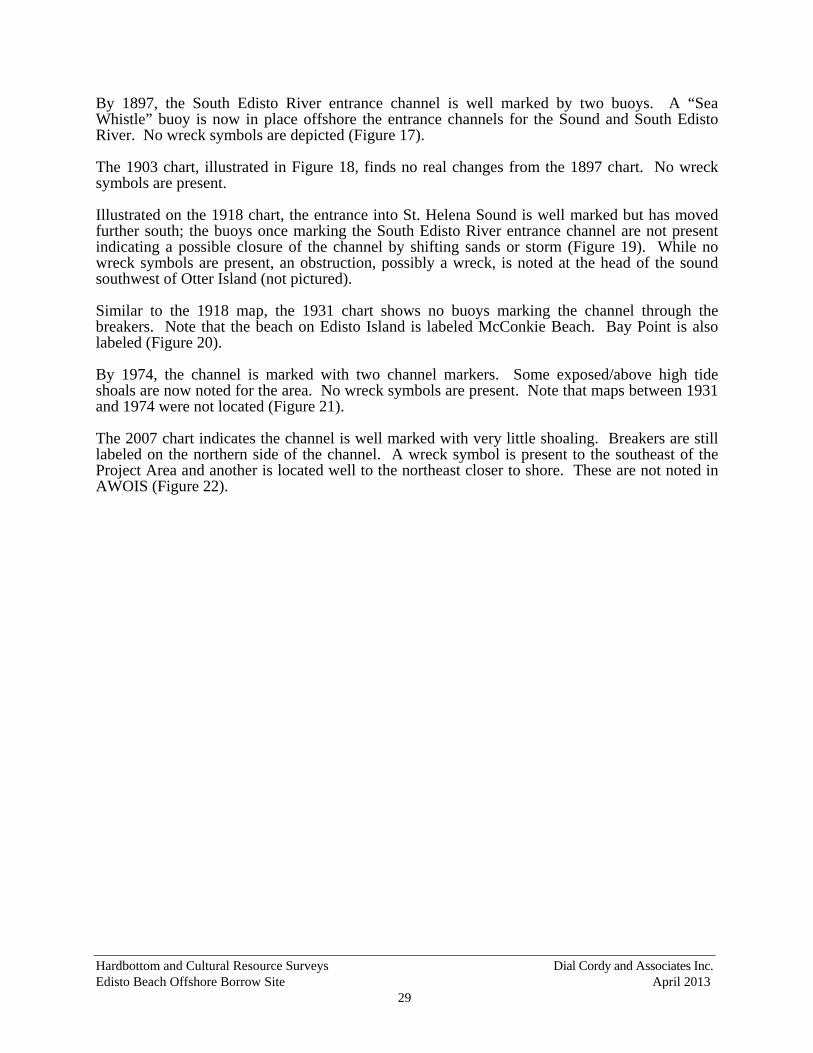
Hardbottom and Cultural Resource Surveys Dial Cordy and Associates Inc. Edisto Beach Offshore Borrow Site April 2013
29
By 1897, the South Edisto River entrance channel is well marked by two buoys. A “Sea Whistle” buoy is now in place offshore the entrance channels for the Sound and South Edisto River. No wreck symbols are depicted (Figure 17). The 1903 chart, illustrated in Figure 18, finds no real changes from the 1897 chart. No wreck symbols are present. Illustrated on the 1918 chart, the entrance into St. Helena Sound is well marked but has moved further south; the buoys once marking the South Edisto River entrance channel are not present indicating a possible closure of the channel by shifting sands or storm (Figure 19). While no wreck symbols are present, an obstruction, possibly a wreck, is noted at the head of the sound southwest of Otter Island (not pictured). Similar to the 1918 map, the 1931 chart shows no buoys marking the channel through the breakers. Note that the beach on Edisto Island is labeled McConkie Beach. Bay Point is also labeled (Figure 20). By 1974, the channel is marked with two channel markers. Some exposed/above high tide shoals are now noted for the area. No wreck symbols are present. Note that maps between 1931 and 1974 were not located (Figure 21). The 2007 chart indicates the channel is well marked with very little shoaling. Breakers are still labeled on the northern side of the channel. A wreck symbol is present to the southeast of the Project Area and another is located well to the northeast closer to shore. These are not noted in AWOIS (Figure 22).
Hardbottom and Cultural Resource Surveys Dial Cordy and Associates Inc. Edisto Beach Offshore Borrow Site April 2013
30
Figure 17. 1897 Coastal Survey Chart “St. Helena Sound.” Note the South Edisto River entrance channel is well marked by two buoys. A “Sea Whistle” buoy is now in place offshore the entrance channels for the Sound and South Edisto River (courtesy of NOAA’s Office of Coast Survey’s Historical Map and Chart Collection).
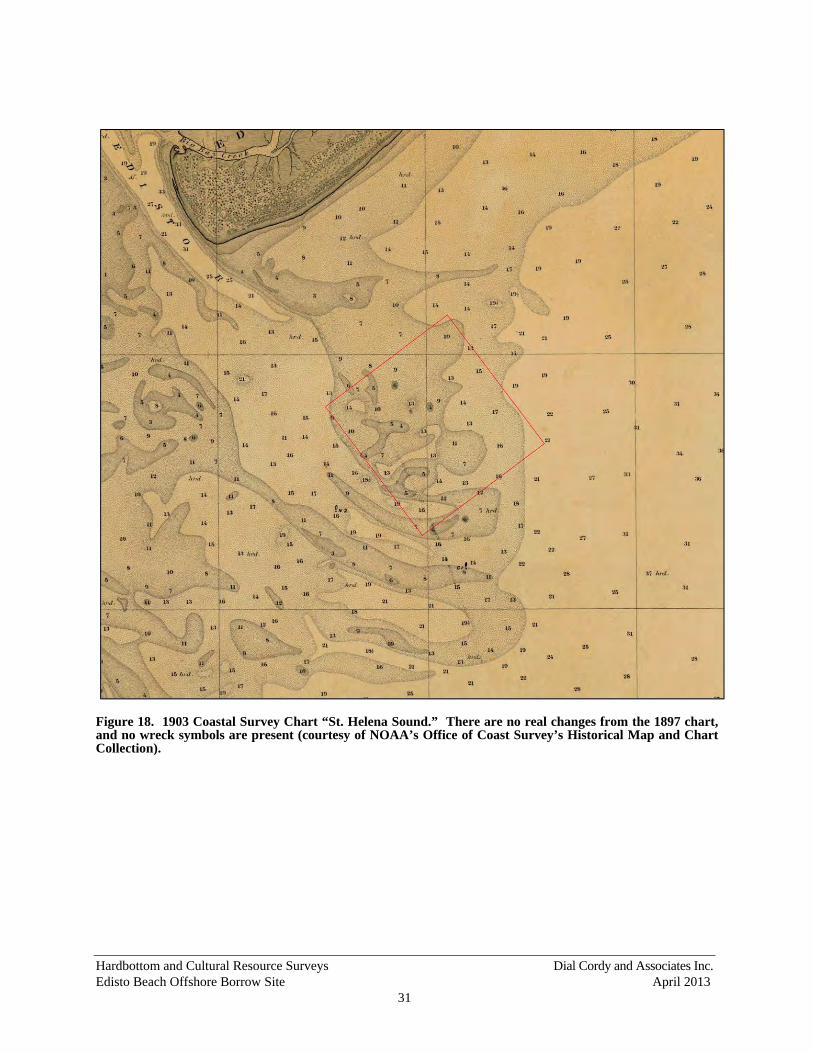
Hardbottom and Cultural Resource Surveys Dial Cordy and Associates Inc. Edisto Beach Offshore Borrow Site April 2013
31
Figure 18. 1903 Coastal Survey Chart “St. Helena Sound.” There are no real changes from the 1897 chart, and no wreck symbols are present (courtesy of NOAA’s Office of Coast Survey’s Historical Map and Chart Collection).
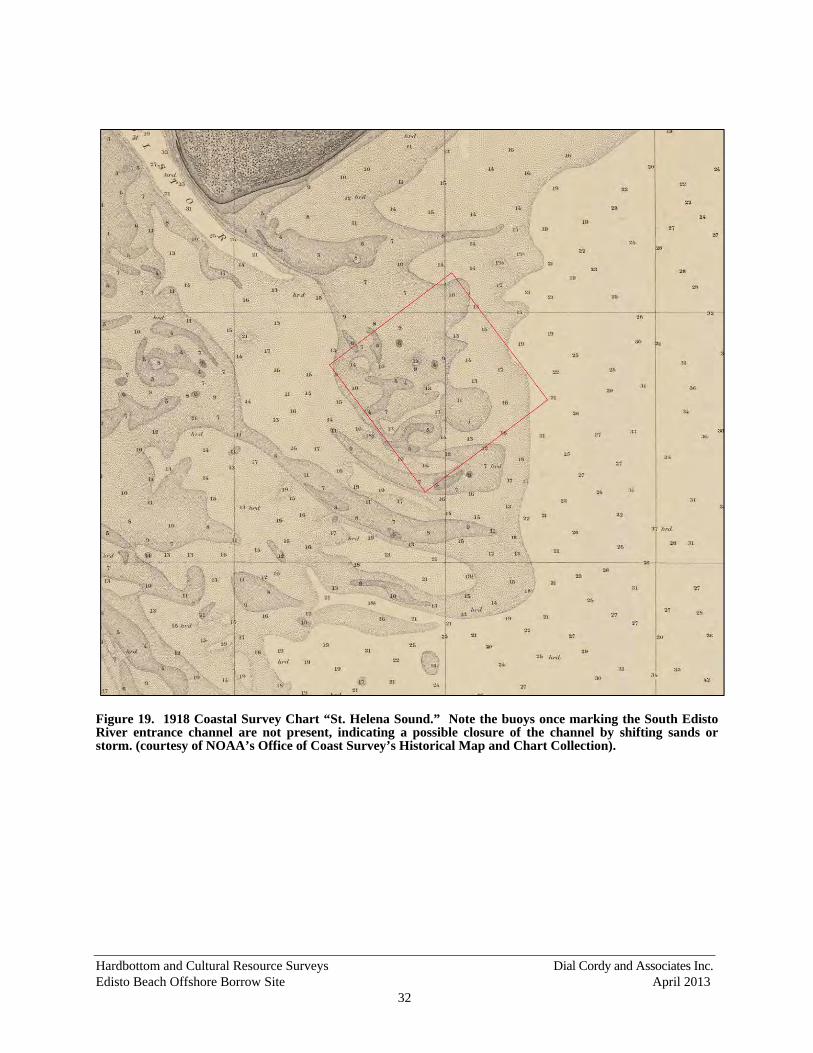
Hardbottom and Cultural Resource Surveys Dial Cordy and Associates Inc. Edisto Beach Offshore Borrow Site April 2013
32
Figure 19. 1918 Coastal Survey Chart “St. Helena Sound.” Note the buoys once marking the South Edisto River entrance channel are not present, indicating a possible closure of the channel by shifting sands or storm. (courtesy of NOAA’s Office of Coast Survey’s Historical Map and Chart Collection).
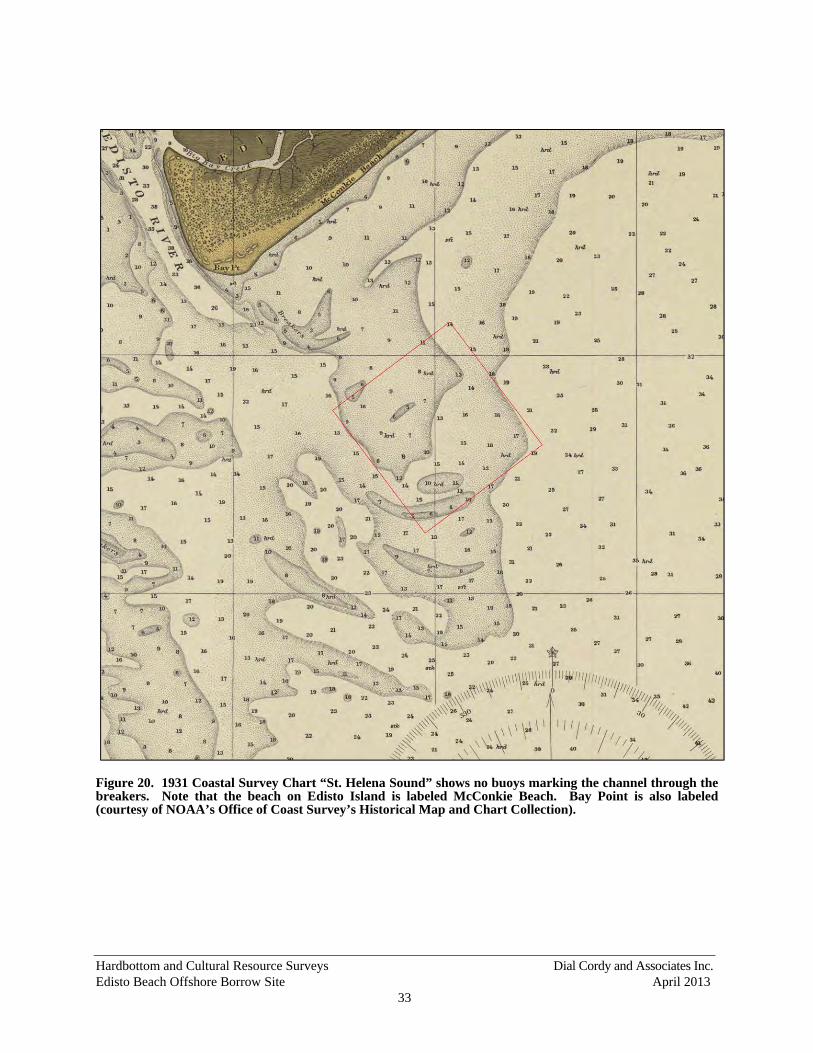
Hardbottom and Cultural Resource Surveys Dial Cordy and Associates Inc. Edisto Beach Offshore Borrow Site April 2013
33
Figure 20. 1931 Coastal Survey Chart “St. Helena Sound” shows no buoys marking the channel through the breakers. Note that the beach on Edisto Island is labeled McConkie Beach. Bay Point is also labeled (courtesy of NOAA’s Office of Coast Survey’s Historical Map and Chart Collection).
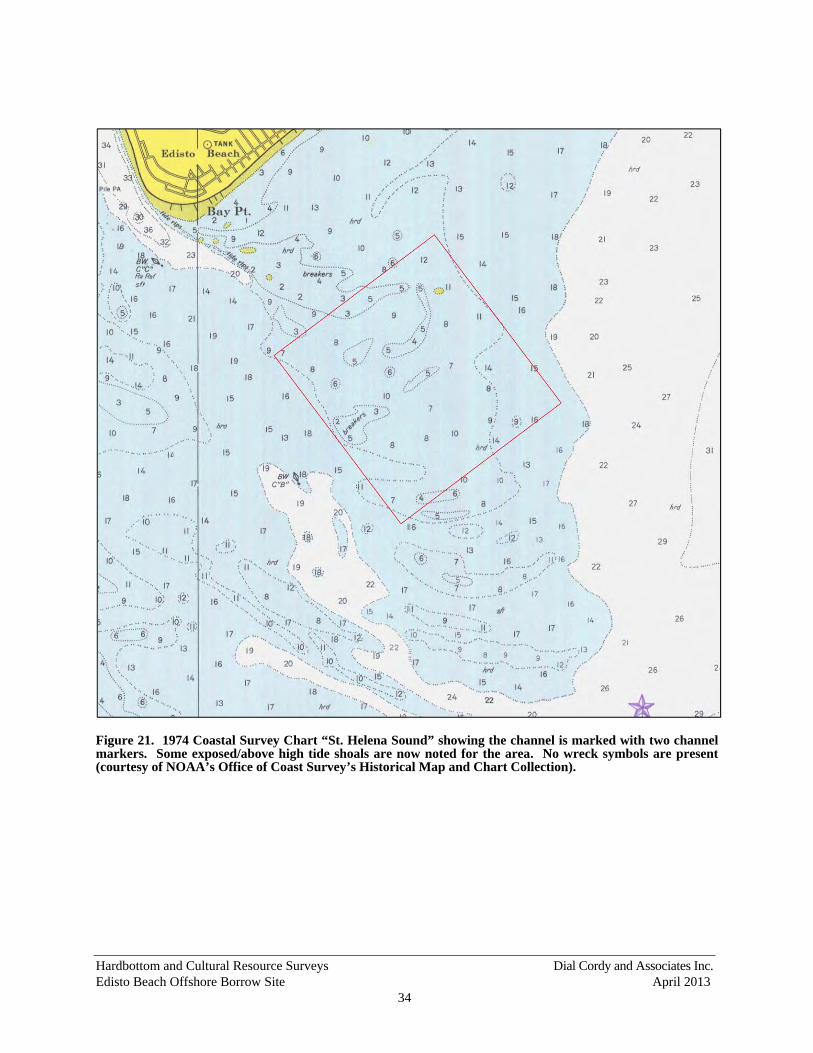
Hardbottom and Cultural Resource Surveys Dial Cordy and Associates Inc. Edisto Beach Offshore Borrow Site April 2013
34
Figure 21. 1974 Coastal Survey Chart “St. Helena Sound” showing the channel is marked with two channel markers. Some exposed/above high tide shoals are now noted for the area. No wreck symbols are present (courtesy of NOAA’s Office of Coast Survey’s Historical Map and Chart Collection).
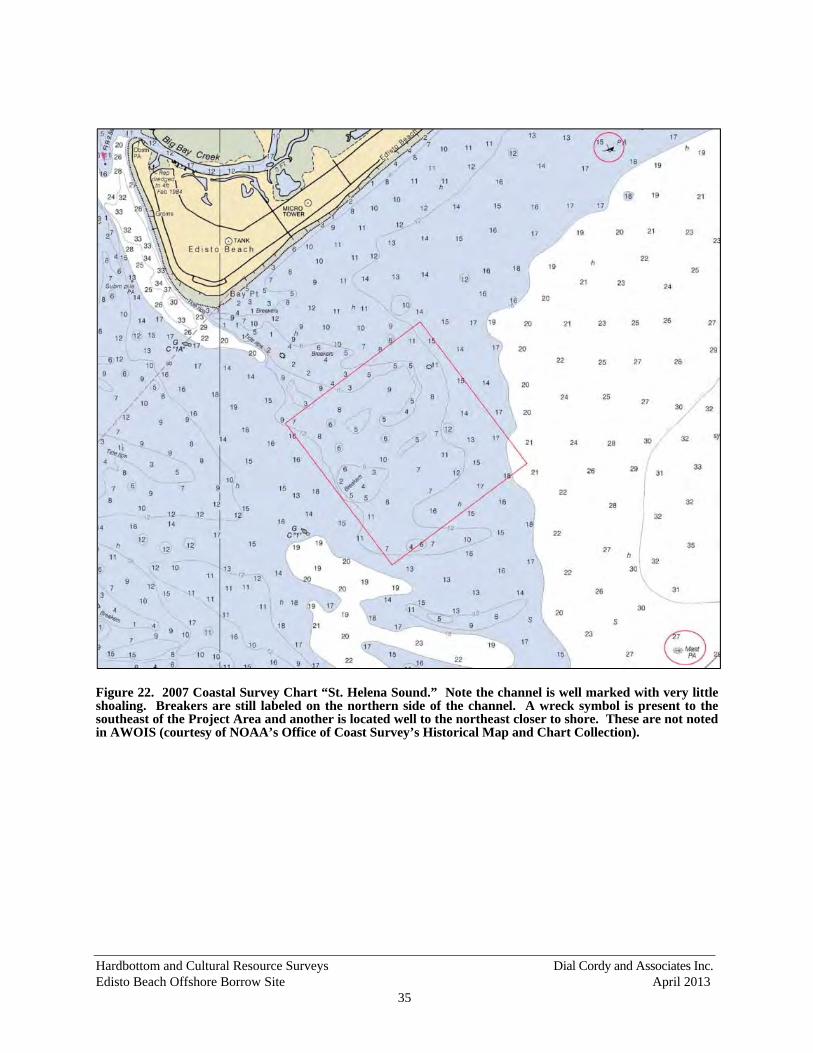
Hardbottom and Cultural Resource Surveys Dial Cordy and Associates Inc. Edisto Beach Offshore Borrow Site April 2013
35
Figure 22. 2007 Coastal Survey Chart “St. Helena Sound.” Note the channel is well marked with very little shoaling. Breakers are still labeled on the northern side of the channel. A wreck symbol is present to the southeast of the Project Area and another is located well to the northeast closer to shore. These are not noted in AWOIS (courtesy of NOAA’s Office of Coast Survey’s Historical Map and Chart Collection).
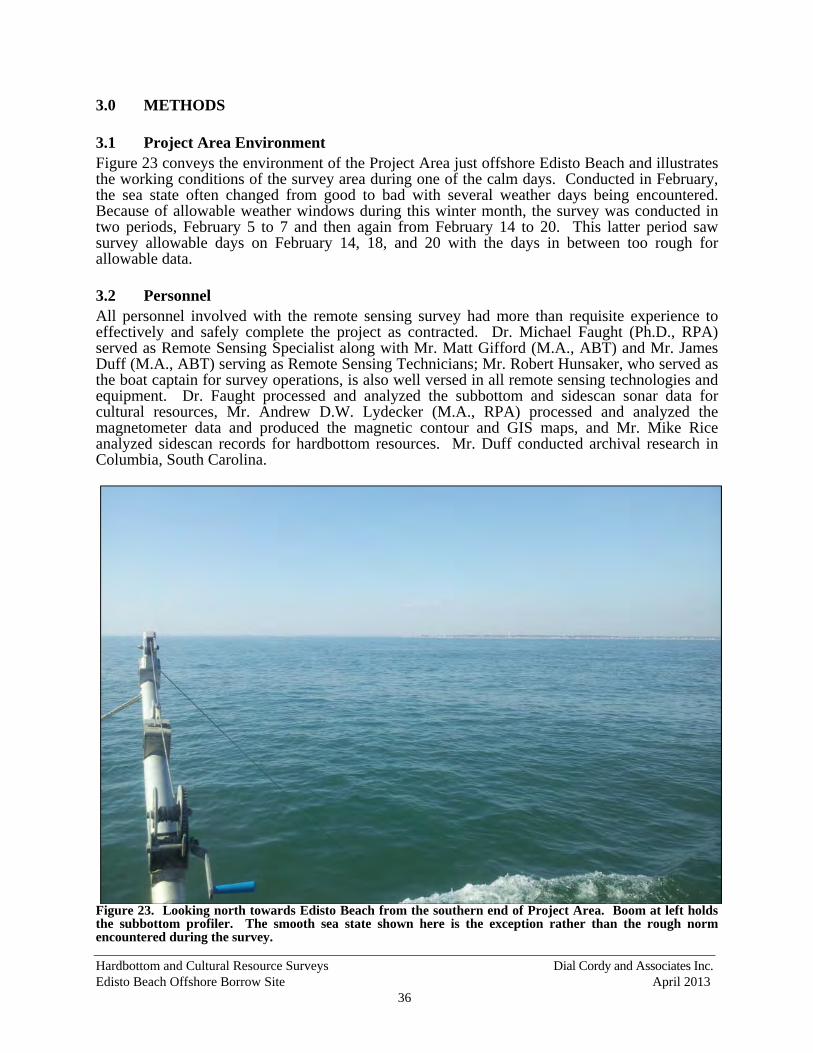
Hardbottom and Cultural Resource Surveys Dial Cordy and Associates Inc. Edisto Beach Offshore Borrow Site April 2013
36
3.0 METHODS
3.1 Project Area Environment Figure 23 conveys the environment of the Project Area just offshore Edisto Beach and illustrates the working conditions of the survey area during one of the calm days. Conducted in February, the sea state often changed from good to bad with several weather days being encountered. Because of allowable weather windows during this winter month, the survey was conducted in two periods, February 5 to 7 and then again from February 14 to 20. This latter period saw survey allowable days on February 14, 18, and 20 with the days in between too rough for allowable data.
3.2 Personnel All personnel involved with the remote sensing survey had more than requisite experience to effectively and safely complete the project as contracted. Dr. Michael Faught (Ph.D., RPA) served as Remote Sensing Specialist along with Mr. Matt Gifford (M.A., ABT) and Mr. James Duff (M.A., ABT) serving as Remote Sensing Technicians; Mr. Robert Hunsaker, who served as the boat captain for survey operations, is also well versed in all remote sensing technologies and equipment. Dr. Faught processed and analyzed the subbottom and sidescan sonar data for cultural resources, Mr. Andrew D.W. Lydecker (M.A., RPA) processed and analyzed the magnetometer data and produced the magnetic contour and GIS maps, and Mr. Mike Rice analyzed sidescan records for hardbottom resources. Mr. Duff conducted archival research in Columbia, South Carolina.
Figure 23. Looking north towards Edisto Beach from the southern end of Project Area. Boom at left holds the subbottom profiler. The smooth sea state shown here is the exception rather than the rough norm encountered during the survey.
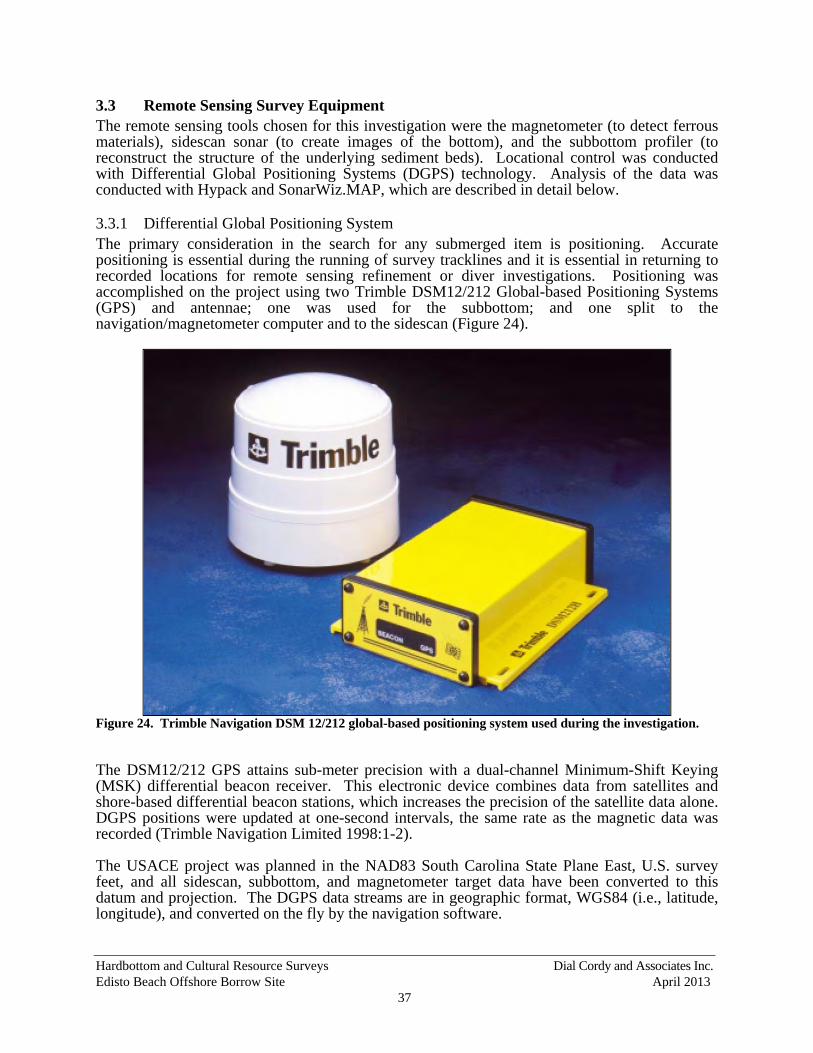
Hardbottom and Cultural Resource Surveys Dial Cordy and Associates Inc. Edisto Beach Offshore Borrow Site April 2013
37
3.3 Remote Sensing Survey Equipment The remote sensing tools chosen for this investigation were the magnetometer (to detect ferrous materials), sidescan sonar (to create images of the bottom), and the subbottom profiler (to reconstruct the structure of the underlying sediment beds). Locational control was conducted with Differential Global Positioning Systems (DGPS) technology. Analysis of the data was conducted with Hypack and SonarWiz.MAP, which are described in detail below.
3.3.1 Differential Global Positioning System The primary consideration in the search for any submerged item is positioning. Accurate positioning is essential during the running of survey tracklines and it is essential in returning to recorded locations for remote sensing refinement or diver investigations. Positioning was accomplished on the project using two Trimble DSM12/212 Global-based Positioning Systems (GPS) and antennae; one was used for the subbottom; and one split to the navigation/magnetometer computer and to the sidescan (Figure 24).
Figure 24. Trimble Navigation DSM 12/212 global-based positioning system used during the investigation. The DSM12/212 GPS attains sub-meter precision with a dual-channel Minimum-Shift Keying (MSK) differential beacon receiver. This electronic device combines data from satellites and shore-based differential beacon stations, which increases the precision of the satellite data alone. DGPS positions were updated at one-second intervals, the same rate as the magnetic data was recorded (Trimble Navigation Limited 1998:1-2). The USACE project was planned in the NAD83 South Carolina State Plane East, U.S. survey feet, and all sidescan, subbottom, and magnetometer target data have been converted to this datum and projection. The DGPS data streams are in geographic format, WGS84 (i.e., latitude, longitude), and converted on the fly by the navigation software.
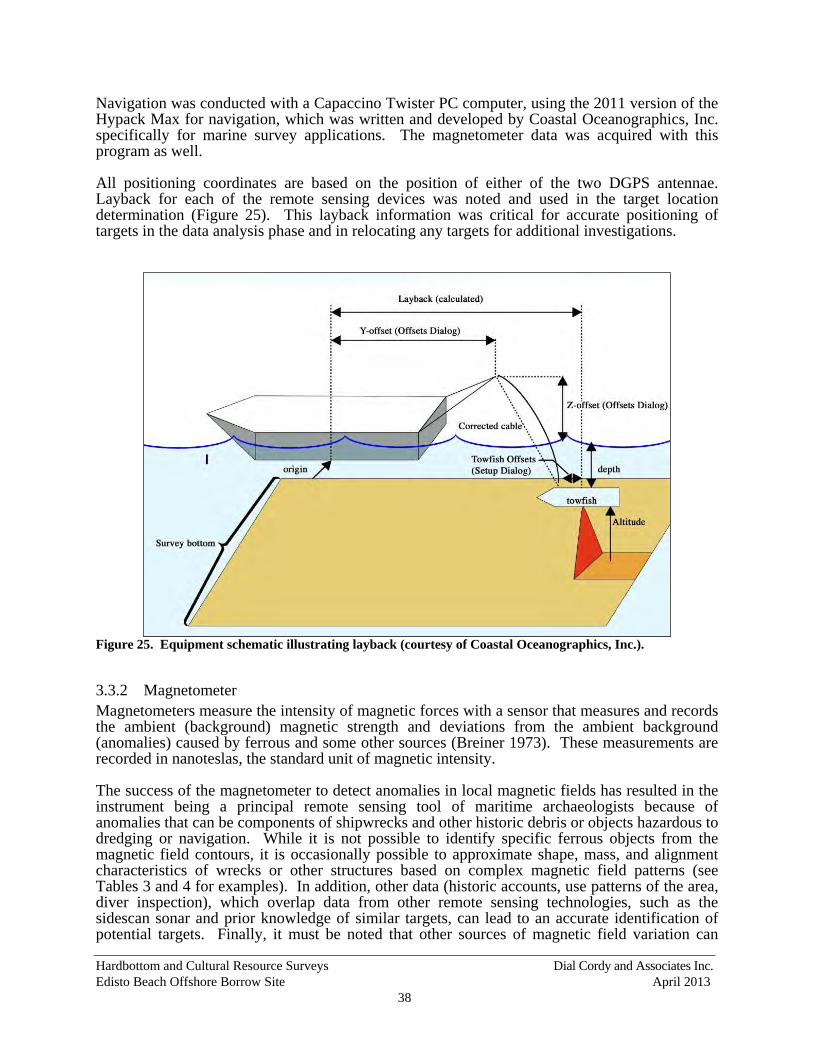
Hardbottom and Cultural Resource Surveys Dial Cordy and Associates Inc. Edisto Beach Offshore Borrow Site April 2013
38
Navigation was conducted with a Capaccino Twister PC computer, using the 2011 version of the Hypack Max for navigation, which was written and developed by Coastal Oceanographics, Inc. specifically for marine survey applications. The magnetometer data was acquired with this program as well. All positioning coordinates are based on the position of either of the two DGPS antennae. Layback for each of the remote sensing devices was noted and used in the target location determination (Figure 25). This layback information was critical for accurate positioning of targets in the data analysis phase and in relocating any targets for additional investigations.
Figure 25. Equipment schematic illustrating layback (courtesy of Coastal Oceanographics, Inc.).
3.3.2 Magnetometer Magnetometers measure the intensity of magnetic forces with a sensor that measures and records the ambient (background) magnetic strength and deviations from the ambient background (anomalies) caused by ferrous and some other sources (Breiner 1973). These measurements are recorded in nanoteslas, the standard unit of magnetic intensity. The success of the magnetometer to detect anomalies in local magnetic fields has resulted in the instrument being a principal remote sensing tool of maritime archaeologists because of anomalies that can be components of shipwrecks and other historic debris or objects hazardous to dredging or navigation. While it is not possible to identify specific ferrous objects from the magnetic field contours, it is occasionally possible to approximate shape, mass, and alignment characteristics of wrecks or other structures based on complex magnetic field patterns (see Tables 3 and 4 for examples). In addition, other data (historic accounts, use patterns of the area, diver inspection), which overlap data from other remote sensing technologies, such as the sidescan sonar and prior knowledge of similar targets, can lead to an accurate identification of potential targets. Finally, it must be noted that other sources of magnetic field variation can
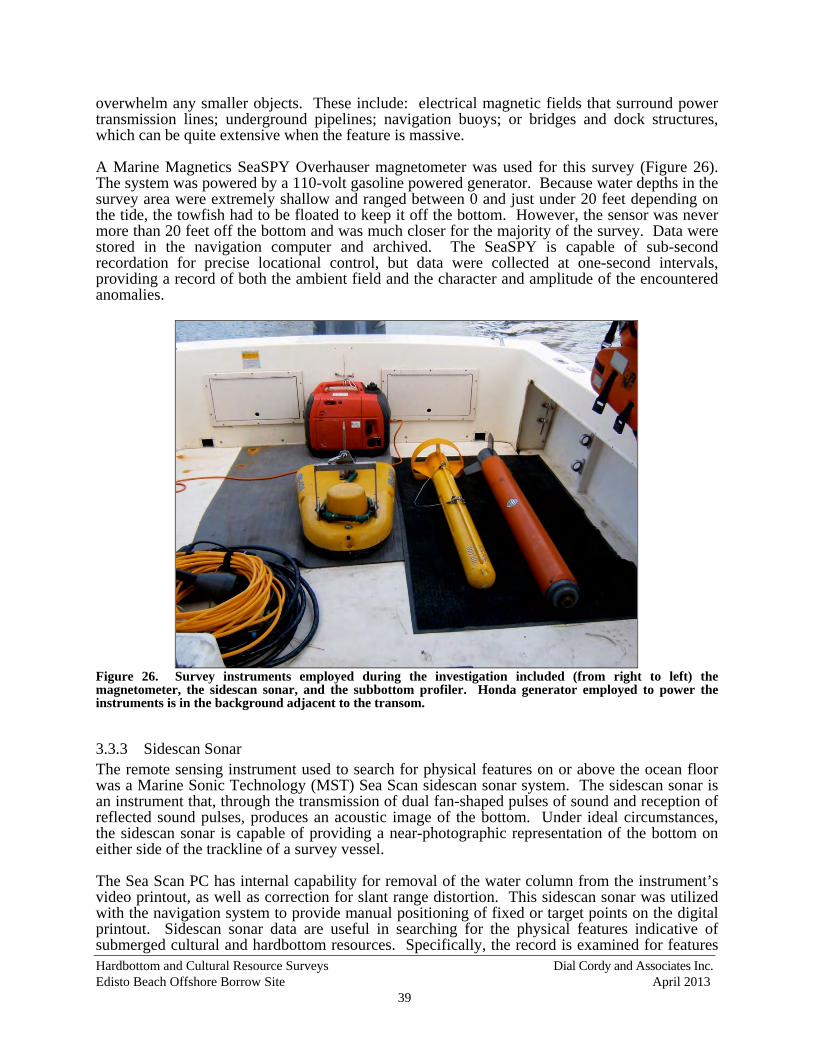
Hardbottom and Cultural Resource Surveys Dial Cordy and Associates Inc. Edisto Beach Offshore Borrow Site April 2013
39
overwhelm any smaller objects. These include: electrical magnetic fields that surround power transmission lines; underground pipelines; navigation buoys; or bridges and dock structures, which can be quite extensive when the feature is massive. A Marine Magnetics SeaSPY Overhauser magnetometer was used for this survey (Figure 26). The system was powered by a 110-volt gasoline powered generator. Because water depths in the survey area were extremely shallow and ranged between 0 and just under 20 feet depending on the tide, the towfish had to be floated to keep it off the bottom. However, the sensor was never more than 20 feet off the bottom and was much closer for the majority of the survey. Data were stored in the navigation computer and archived. The SeaSPY is capable of sub-second recordation for precise locational control, but data were collected at one-second intervals, providing a record of both the ambient field and the character and amplitude of the encountered anomalies.
Figure 26. Survey instruments employed during the investigation included (from right to left) the magnetometer, the sidescan sonar, and the subbottom profiler. Honda generator employed to power the instruments is in the background adjacent to the transom.
3.3.3 Sidescan Sonar The remote sensing instrument used to search for physical features on or above the ocean floor was a Marine Sonic Technology (MST) Sea Scan sidescan sonar system. The sidescan sonar is an instrument that, through the transmission of dual fan-shaped pulses of sound and reception of reflected sound pulses, produces an acoustic image of the bottom. Under ideal circumstances, the sidescan sonar is capable of providing a near-photographic representation of the bottom on either side of the trackline of a survey vessel. The Sea Scan PC has internal capability for removal of the water column from the instrument’s video printout, as well as correction for slant range distortion. This sidescan sonar was utilized with the navigation system to provide manual positioning of fixed or target points on the digital printout. Sidescan sonar data are useful in searching for the physical features indicative of submerged cultural and hardbottom resources. Specifically, the record is examined for features
Hardbottom and Cultural Resource Surveys Dial Cordy and Associates Inc. Edisto Beach Offshore Borrow Site April 2013
40
showing characteristics such as height above bottom, linearity, and structural form. Additionally, potential acoustic targets are checked for any locational match with the data derived from the magnetometer and the subbottom profiler. The MST Sea Scan PC sidescan sonar was linked to a towfish that employed a 600-kilohertz power setting and a variable side range of 20 meters-per-channel (131 feet) on each of the survey lines. The 20 meters-per-channel setting was chosen to provide detail and 100% overlapping coverage with the 50-foot line spacing to ensure full coverage of the survey area. The power setting was selected in order to provide maximum possible detail on the record generated; 600 kilohertz was the preferred frequency.
3.3.4 Subbottom Profiler Employed to determine the character of near-surface geologic features over the survey area, subbottom profilers generate low frequency (0.5 to 30 kilohertz) sound pulses capable of penetrating the seabed and reflecting off sediment boundaries or larger objects below the surface. The data are then processed and reproduced as cross sections based on two-way travel time (the time taken for the pulse to travel from the source to the reflector and back to the receiver). This travel time is then interpolated to depth in the sediment column by calculating at 1,500 meters-per-second (the average speed of sound in water). Subbottom profilers have different ranges of sound wave frequency (sparkers, boomers, pingers, and chirp systems). Sparkers and boomers operate at low frequency (5 hertz to 2 kilohertz) and afford deep geologic penetration and low resolution, useful for deep geologic time. Pingers (3.5 and 7 kilohertz) are more useful to penetrate late Pleistocene- and Holocene-aged deposits or paleolandscape features of interest to prehistoric archaeologists. CHIRP systems sweep multiple frequency ranges and are the most precise and accurate of the subbottom profiler systems; they operate at ranges of between 3 to 40 kilohertz. The resolution can be on the order of 10 centimeters (6 inches) depending on sediment type and the quality of the acoustic return. An EdgeTech 3100 CHIRP subbottom profiler system with a topside power unit, laptop processor and SB-424 towfish was used for this survey. The device was operated at a setting of 4 to 16 kilohertz, the lowest setting of the device, for maximum penetration. Seismic cross sections reconstruct the shapes and extents of reflectors such as facies in channel sediments, rock/sediment interfaces, marine sand bed cover, and so forth. In addition to subbottom profiling, and depending on the density of data points, the first bottom return data can be used for high-resolution bathymetry. Shipwrecks can be studied with subbottom profilers once their location is known. Finding shipwrecks with a subbottom profiler survey is less useful. High and low amplitude reflectors (light and dark returns) distinguish differences of sediment characteristics such as particle size and consolidation (Stevenson et al. 2002). Facies contacts can be identified by discontinuities in the extent, slope angle, or shape of the reflector returns. This latter fact is important when identifying the sinusoidal shapes of drowned channel systems and other relict and buried fluvial system features (e.g., estuarine, tidal, lowland, upland areas around drainage features). Parabolic-shaped reflectors indicate individual objects of sufficient size and consolidation. The parabolic shape is the result of sound propagating outwardly from the item. There are also five types of signals that may cause misinterpretation in the two dimensional records: direct arrivals from the sound source; water surface reflection; side echoes; reflection multiples; and point source reflections. Judicious analysis is required to identify them. Peats tend to reflect strongly, as do other fine-grained or muddy sediments. Sand and shell deposits like those around and in the South Carolina coast are less reflective, and difficult to
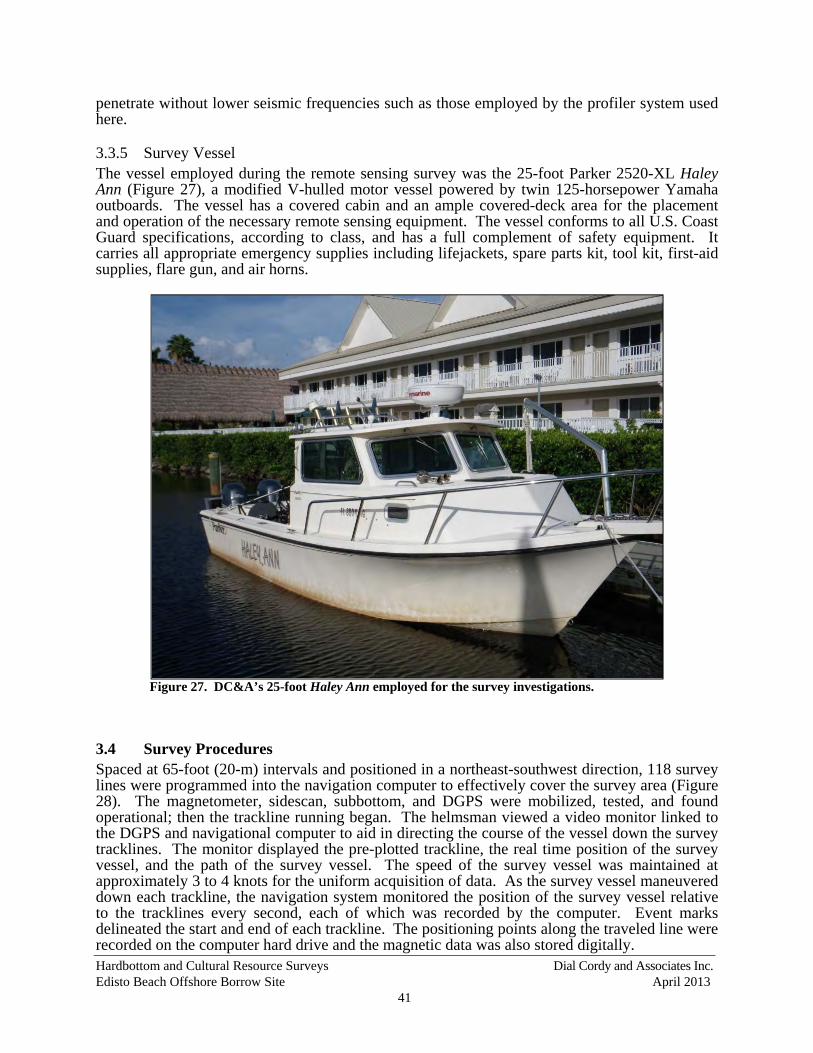
Hardbottom and Cultural Resource Surveys Dial Cordy and Associates Inc. Edisto Beach Offshore Borrow Site April 2013
41
penetrate without lower seismic frequencies such as those employed by the profiler system used here.
3.3.5 Survey Vessel The vessel employed during the remote sensing survey was the 25-foot Parker 2520-XL Haley Ann (Figure 27), a modified V-hulled motor vessel powered by twin 125-horsepower Yamaha outboards. The vessel has a covered cabin and an ample covered-deck area for the placement and operation of the necessary remote sensing equipment. The vessel conforms to all U.S. Coast Guard specifications, according to class, and has a full complement of safety equipment. It carries all appropriate emergency supplies including lifejackets, spare parts kit, tool kit, first-aid supplies, flare gun, and air horns.
Figure 27. DC&A’s 25-foot Haley Ann employed for the survey investigations.
3.4 Survey Procedures Spaced at 65-foot (20-m) intervals and positioned in a northeast-southwest direction, 118 survey lines were programmed into the navigation computer to effectively cover the survey area (Figure 28). The magnetometer, sidescan, subbottom, and DGPS were mobilized, tested, and found operational; then the trackline running began. The helmsman viewed a video monitor linked to the DGPS and navigational computer to aid in directing the course of the vessel down the survey tracklines. The monitor displayed the pre-plotted trackline, the real time position of the survey vessel, and the path of the survey vessel. The speed of the survey vessel was maintained at approximately 3 to 4 knots for the uniform acquisition of data. As the survey vessel maneuvered down each trackline, the navigation system monitored the position of the survey vessel relative to the tracklines every second, each of which was recorded by the computer. Event marks delineated the start and end of each trackline. The positioning points along the traveled line were recorded on the computer hard drive and the magnetic data was also stored digitally.
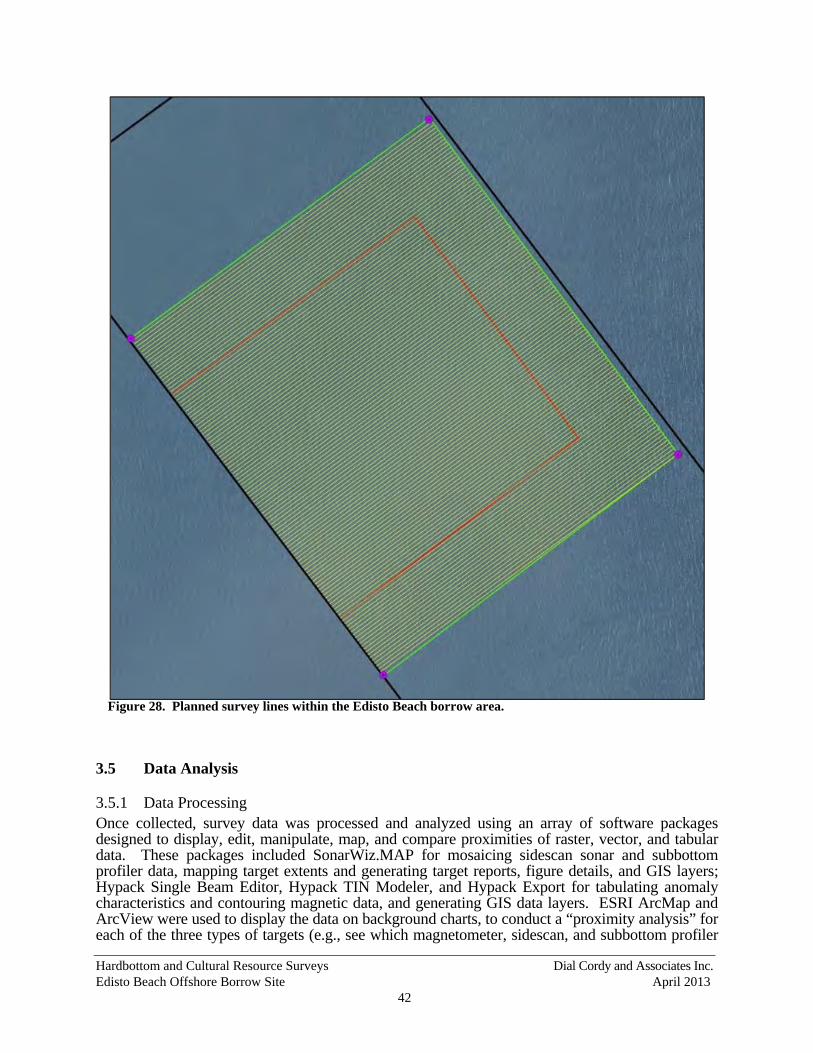
Hardbottom and Cultural Resource Surveys Dial Cordy and Associates Inc. Edisto Beach Offshore Borrow Site April 2013
42
Figure 28. Planned survey lines within the Edisto Beach borrow area.
3.5 Data Analysis
3.5.1 Data Processing Once collected, survey data was processed and analyzed using an array of software packages designed to display, edit, manipulate, map, and compare proximities of raster, vector, and tabular data. These packages included SonarWiz.MAP for mosaicing sidescan sonar and subbottom profiler data, mapping target extents and generating target reports, figure details, and GIS layers; Hypack Single Beam Editor, Hypack TIN Modeler, and Hypack Export for tabulating anomaly characteristics and contouring magnetic data, and generating GIS data layers. ESRI ArcMap and ArcView were used to display the data on background charts, to conduct a “proximity analysis” for each of the three types of targets (e.g., see which magnetometer, sidescan, and subbottom profiler
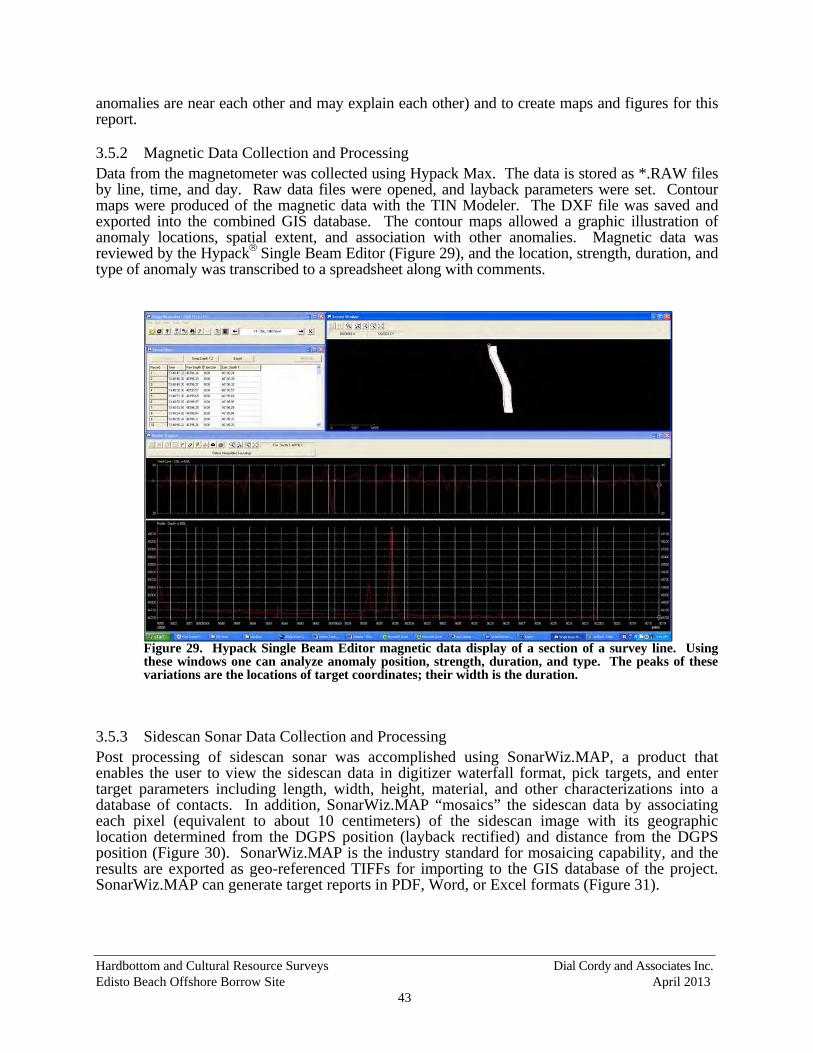
Hardbottom and Cultural Resource Surveys Dial Cordy and Associates Inc. Edisto Beach Offshore Borrow Site April 2013
43
anomalies are near each other and may explain each other) and to create maps and figures for this report.
3.5.2 Magnetic Data Collection and Processing Data from the magnetometer was collected using Hypack Max. The data is stored as *.RAW files by line, time, and day. Raw data files were opened, and layback parameters were set. Contour maps were produced of the magnetic data with the TIN Modeler. The DXF file was saved and exported into the combined GIS database. The contour maps allowed a graphic illustration of anomaly locations, spatial extent, and association with other anomalies. Magnetic data was reviewed by the Hypack Single Beam Editor (Figure 29), and the location, strength, duration, and type of anomaly was transcribed to a spreadsheet along with comments.
Figure 29. Hypack Single Beam Editor magnetic data display of a section of a survey line. Using these windows one can analyze anomaly position, strength, duration, and type. The peaks of these variations are the locations of target coordinates; their width is the duration.
3.5.3 Sidescan Sonar Data Collection and Processing Post processing of sidescan sonar was accomplished using SonarWiz.MAP, a product that enables the user to view the sidescan data in digitizer waterfall format, pick targets, and enter target parameters including length, width, height, material, and other characterizations into a database of contacts. In addition, SonarWiz.MAP “mosaics” the sidescan data by associating each pixel (equivalent to about 10 centimeters) of the sidescan image with its geographic location determined from the DGPS position (layback rectified) and distance from the DGPS position (Figure 30). SonarWiz.MAP is the industry standard for mosaicing capability, and the results are exported as geo-referenced TIFFs for importing to the GIS database of the project. SonarWiz.MAP can generate target reports in PDF, Word, or Excel formats (Figure 31).
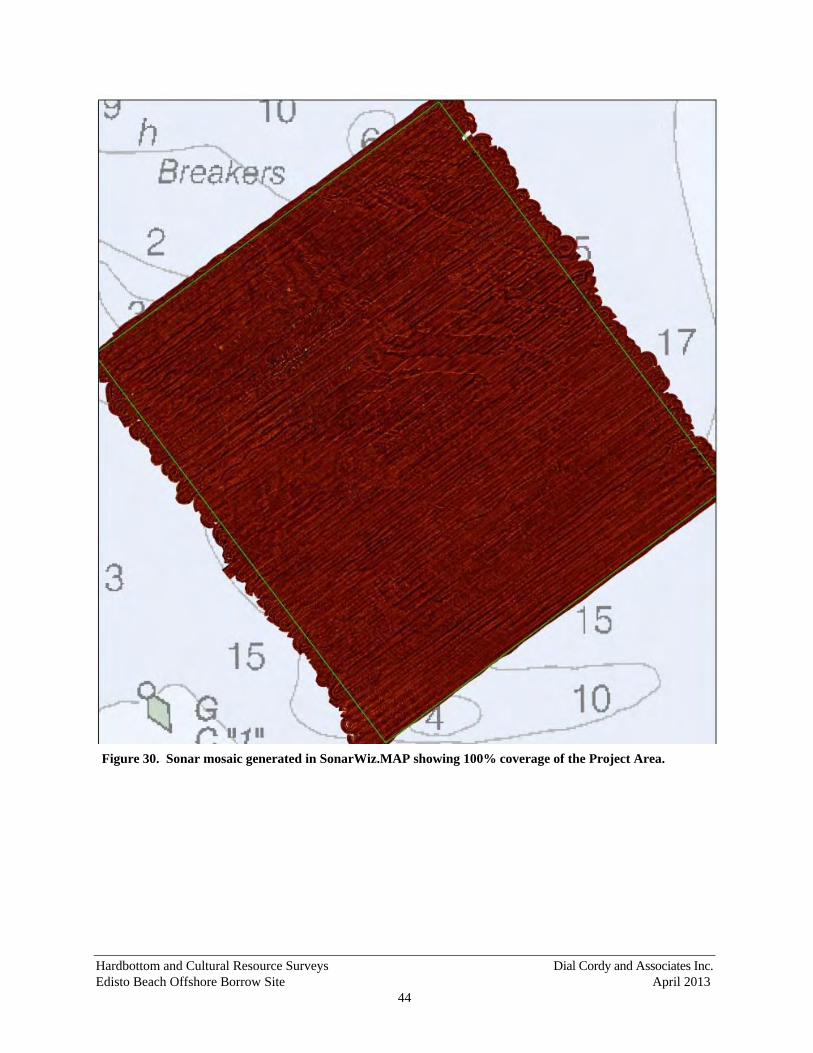
Hardbottom and Cultural Resource Surveys Dial Cordy and Associates Inc. Edisto Beach Offshore Borrow Site April 2013
44
Figure 30. Sonar mosaic generated in SonarWiz.MAP showing 100% coverage of the Project Area.
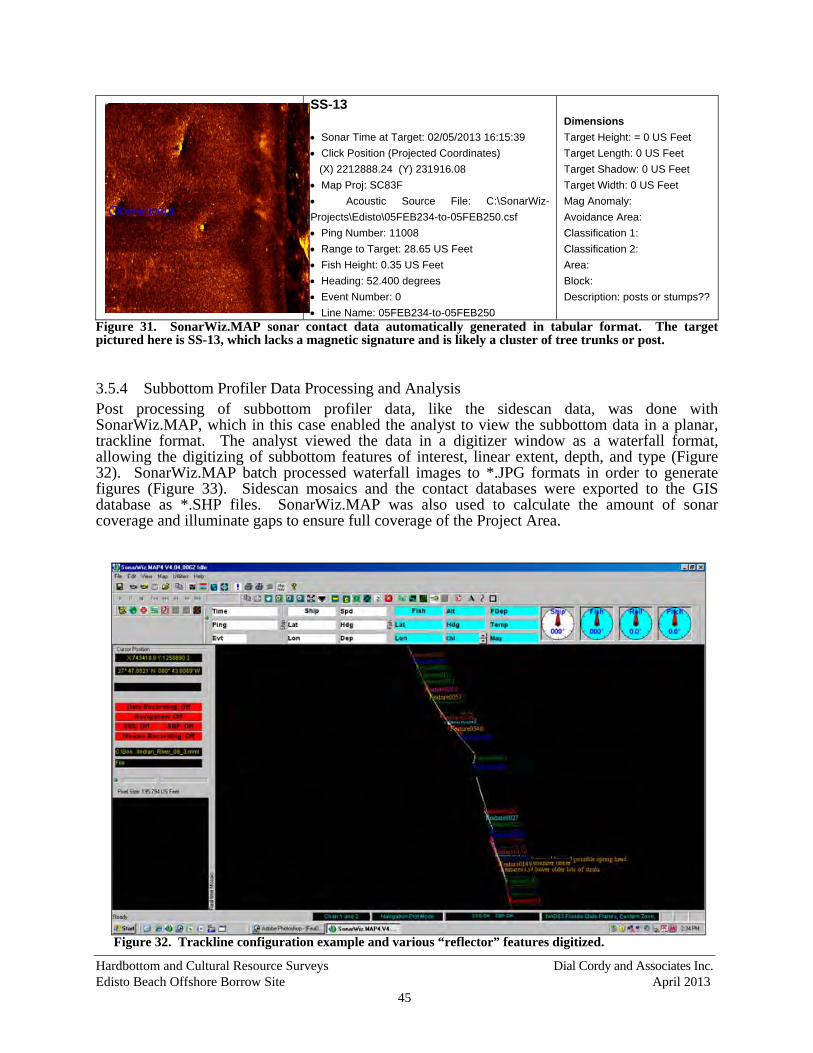
Hardbottom and Cultural Resource Surveys Dial Cordy and Associates Inc. Edisto Beach Offshore Borrow Site April 2013
45
SS-13 Sonar Time at Target: 02/05/2013 16:15:39 Click Position (Projected Coordinates) (X) 2212888.24 (Y) 231916.08 Map Proj: SC83F Acoustic Source File: C:\SonarWiz-Projects\Edisto\05FEB234-to-05FEB250.csf Ping Number: 11008 Range to Target: 28.65 US Feet Fish Height: 0.35 US Feet Heading: 52.400 degrees Event Number: 0 Line Name: 05FEB234-to-05FEB250
Dimensions Target Height: = 0 US Feet Target Length: 0 US Feet Target Shadow: 0 US Feet Target Width: 0 US Feet Mag Anomaly: Avoidance Area: Classification 1: Classification 2: Area: Block: Description: posts or stumps??
Figure 31. SonarWiz.MAP sonar contact data automatically generated in tabular format. The target pictured here is SS-13, which lacks a magnetic signature and is likely a cluster of tree trunks or post.
3.5.4 Subbottom Profiler Data Processing and Analysis Post processing of subbottom profiler data, like the sidescan data, was done with SonarWiz.MAP, which in this case enabled the analyst to view the subbottom data in a planar, trackline format. The analyst viewed the data in a digitizer window as a waterfall format, allowing the digitizing of subbottom features of interest, linear extent, depth, and type (Figure 32). SonarWiz.MAP batch processed waterfall images to *.JPG formats in order to generate figures (Figure 33). Sidescan mosaics and the contact databases were exported to the GIS database as *.SHP files. SonarWiz.MAP was also used to calculate the amount of sonar coverage and illuminate gaps to ensure full coverage of the Project Area.
Figure 32. Trackline configuration example and various “reflector” features digitized.
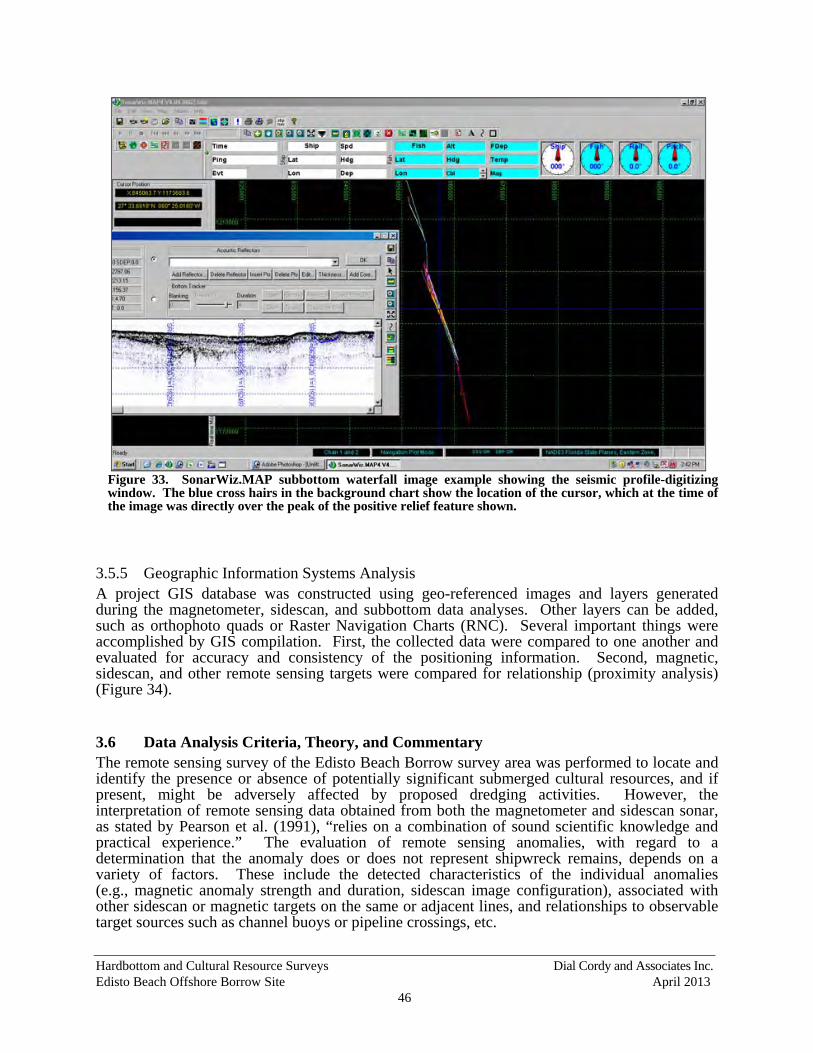
Hardbottom and Cultural Resource Surveys Dial Cordy and Associates Inc. Edisto Beach Offshore Borrow Site April 2013
46
Figure 33. SonarWiz.MAP subbottom waterfall image example showing the seismic profile-digitizing window. The blue cross hairs in the background chart show the location of the cursor, which at the time of the image was directly over the peak of the positive relief feature shown.
3.5.5 Geographic Information Systems Analysis A project GIS database was constructed using geo-referenced images and layers generated during the magnetometer, sidescan, and subbottom data analyses. Other layers can be added, such as orthophoto quads or Raster Navigation Charts (RNC). Several important things were accomplished by GIS compilation. First, the collected data were compared to one another and evaluated for accuracy and consistency of the positioning information. Second, magnetic, sidescan, and other remote sensing targets were compared for relationship (proximity analysis) (Figure 34).
3.6 Data Analysis Criteria, Theory, and Commentary The remote sensing survey of the Edisto Beach Borrow survey area was performed to locate and identify the presence or absence of potentially significant submerged cultural resources, and if present, might be adversely affected by proposed dredging activities. However, the interpretation of remote sensing data obtained from both the magnetometer and sidescan sonar, as stated by Pearson et al. (1991), “relies on a combination of sound scientific knowledge and practical experience.” The evaluation of remote sensing anomalies, with regard to a determination that the anomaly does or does not represent shipwreck remains, depends on a variety of factors. These include the detected characteristics of the individual anomalies (e.g., magnetic anomaly strength and duration, sidescan image configuration), associated with other sidescan or magnetic targets on the same or adjacent lines, and relationships to observable target sources such as channel buoys or pipeline crossings, etc.
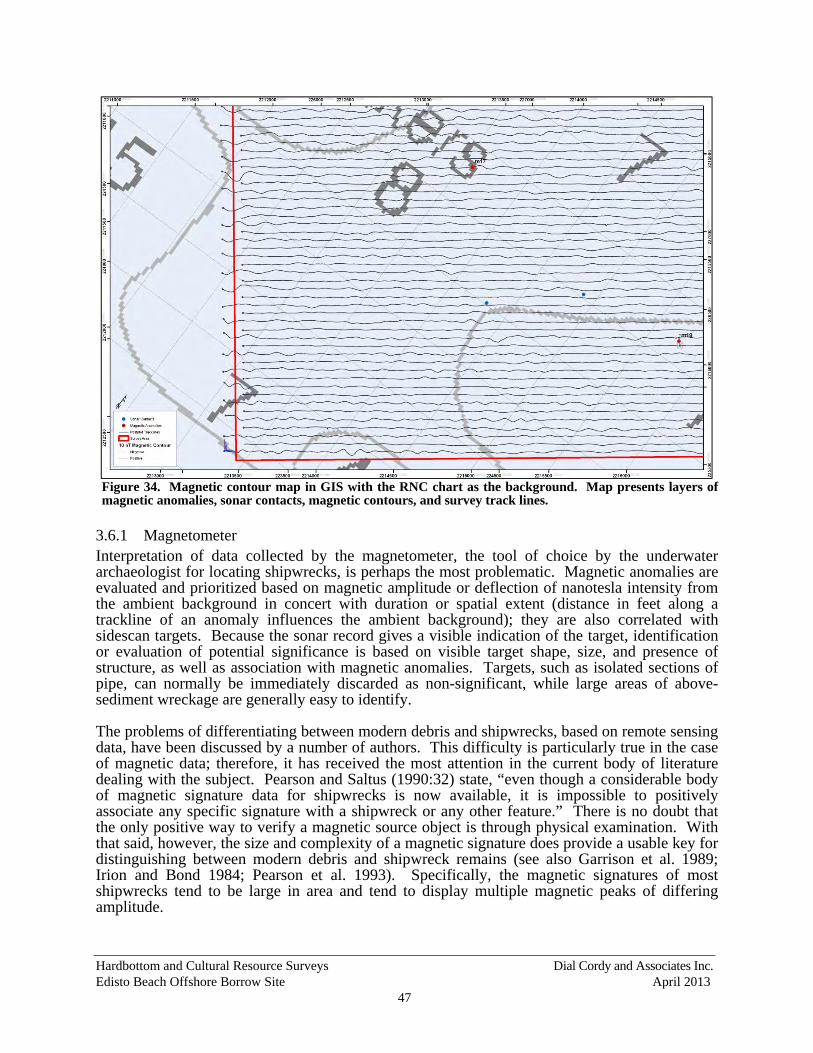
Hardbottom and Cultural Resource Surveys Dial Cordy and Associates Inc. Edisto Beach Offshore Borrow Site April 2013
47
Figure 34. Magnetic contour map in GIS with the RNC chart as the background. Map presents layers of magnetic anomalies, sonar contacts, magnetic contours, and survey track lines.
3.6.1 Magnetometer Interpretation of data collected by the magnetometer, the tool of choice by the underwater archaeologist for locating shipwrecks, is perhaps the most problematic. Magnetic anomalies are evaluated and prioritized based on magnetic amplitude or deflection of nanotesla intensity from the ambient background in concert with duration or spatial extent (distance in feet along a trackline of an anomaly influences the ambient background); they are also correlated with sidescan targets. Because the sonar record gives a visible indication of the target, identification or evaluation of potential significance is based on visible target shape, size, and presence of structure, as well as association with magnetic anomalies. Targets, such as isolated sections of pipe, can normally be immediately discarded as non-significant, while large areas of above-sediment wreckage are generally easy to identify. The problems of differentiating between modern debris and shipwrecks, based on remote sensing data, have been discussed by a number of authors. This difficulty is particularly true in the case of magnetic data; therefore, it has received the most attention in the current body of literature dealing with the subject. Pearson and Saltus (1990:32) state, “even though a considerable body of magnetic signature data for shipwrecks is now available, it is impossible to positively associate any specific signature with a shipwreck or any other feature.” There is no doubt that the only positive way to verify a magnetic source object is through physical examination. With that said, however, the size and complexity of a magnetic signature does provide a usable key for distinguishing between modern debris and shipwreck remains (see also Garrison et al. 1989; Irion and Bond 1984; Pearson et al. 1993). Specifically, the magnetic signatures of most shipwrecks tend to be large in area and tend to display multiple magnetic peaks of differing amplitude.
Hardbottom and Cultural Resource Surveys Dial Cordy and Associates Inc. Edisto Beach Offshore Borrow Site April 2013
48
In a study conducted for the Burea of Ocean and Energy Management for magnetic anomalies in the northern Gulf of Mexico, Garrison et al. (1989) indicate that a shipwreck signature will cover an area between 10,000 and 50,000 square meters. Using the Garrison et al. (1989) study, as well as years of “practical experience,” in an effort to assess potential significance of remote sensing targets, the Pearson et al. (1991) study developed general characteristics of magnetometer signatures most likely to represent shipwrecks. The report states that “the amplitude of magnetic anomalies associated with shipwrecks varies considerably, but in general, the signature of large watercraft or portions of watercraft, range from moderate to high intensity (greater than 50 nanoteslas) when the sensor is at distances of 20 feet or so” (Pearson et al. 1991:70). Employing a table of magnetic data from various sources as baseline data, the report goes on to state that “data suggests that at a distance of 20 feet or fewer, watercraft of moderate size are likely to produce a magnetic anomaly [this would be a complex signature (i.e., a cluster of dipoles and/or monopoles)] greater than 80 or 90 feet across the smallest dimension...” (Pearson et al. 1991:70).
While establishing baseline amounts of amplitude and duration, reflective of the magnetic characteristics for a shipwreck site, the report “recognizes that a considerable amount of variability does occur” (Pearson et al. 1991:70). Generated in an effort to test the 50-nanotesla/80-foot criteria and to determine the amount of variability, Table 4 lists numerous shipwrecks as well as single and multiple-source objects located by magnetic survey and verified by divers. All shipwrecks meet and surpass the 50-nanotesla/80-foot criteria, while the majority of single-object readings fall below the criteria (with the exception of the pipeline, the two sections of pipe, and one of the seven rocket motors). However, the signature of the pipeline should appear as a linear feature on a magnetic contour map and not be confused with a single-source object. The strengths of the two sections of pipe represent refinement readings that sought to produce the highest reading possible and should perhaps be discounted from the sample. With respect to the rocket motors, they are single objects that, because of their association with the space program, must be considered potentially significant. While the shipwrecks and most single-source objects adhere to the 50-nanotesla/80-foot criteria, the multiple-source objects do not. If all targets listed on the table required prioritization of potential significance based on the 50-nanotesla/80-foot criteria, the two multiple-source object targets would be classified as potentially significant.
While the 50-nanotesla/80-foot criteria is a good general guide for most conditions, several recent studies have suggested that a 50-nanotesla/80-foot duration applied to remote sensing data as a baseline for all wreck sites are much too low. Allowing for a larger and more focused database on which to assess signature characteristics of specific vessel classes, the findings from these investigations argue for higher nanotesla and duration criteria for specific types of sites. Table 5 indicates the sizable magnetic deviation and duration of previously recorded and located steamboat wreck sites. However, there is one exception, each of the known steamboat wrecks investigated has a magnetic deviation of at least 500 nanoteslas and a duration of no fewer than 110 feet, usually in the greater than 200-foot range. As opposed to single objects, steamboat wrecks documented during previous investigations are generally much larger in magnetic strength (although not always), tend to have a longer duration, and typically have multi-component signatures. It should be noted, however, that each steamboat wreck signature differs markedly due to environmental conditions, amount of hull/machinery remaining, and the depth of water/overburden over the wreck site. Furthermore, it should be inferred that one of the biggest influences on a wreck site’s magnetic signature is directly related to the distance from the magnetometer sensor to the wreck site. As stated in Pearson and Birchett:
“For a typical iron object, the intensity of its magnetic signature (i.e., anomaly) is inversely proportional to the cube of the distance. One pound of iron, for example, would produce an anomaly of 100 nanoteslas at a distance of 2 feet. At a distance of 10 feet the same pound of iron would produce an anomaly of only 1 nanotesla. A 1,000-ton ship could produce a 700-nanotesla anomaly at 100 feet and a barely discernible 0.7-nanotesla anomaly at 1,000 feet” [1999:4-13].
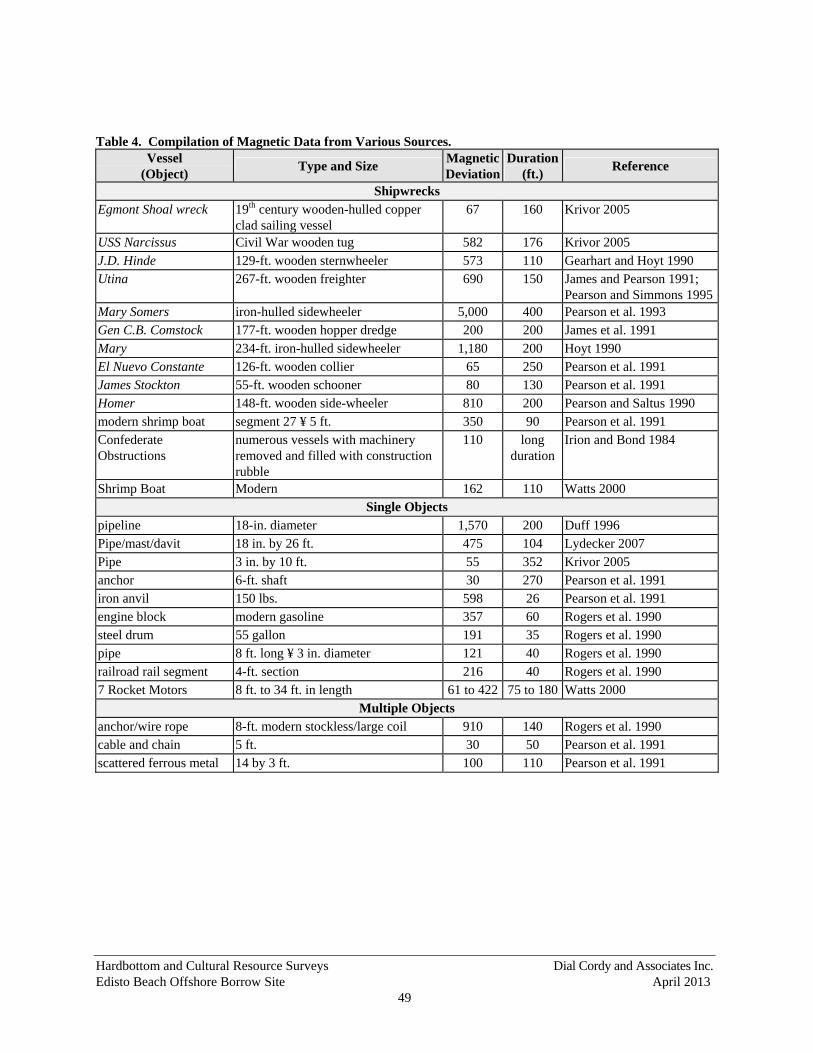
Hardbottom and Cultural Resource Surveys Dial Cordy and Associates Inc. Edisto Beach Offshore Borrow Site April 2013
49
Table 4. Compilation of Magnetic Data from Various Sources.
Vessel (Object)
Type and Size Magnetic Deviation
Duration (ft.)
Reference
Shipwrecks Egmont Shoal wreck 19th century wooden-hulled copper
clad sailing vessel 67 160 Krivor 2005
USS Narcissus Civil War wooden tug 582 176 Krivor 2005 J.D. Hinde 129-ft. wooden sternwheeler 573 110 Gearhart and Hoyt 1990 Utina 267-ft. wooden freighter 690 150 James and Pearson 1991;
Pearson and Simmons 1995Mary Somers iron-hulled sidewheeler 5,000 400 Pearson et al. 1993 Gen C.B. Comstock 177-ft. wooden hopper dredge 200 200 James et al. 1991 Mary 234-ft. iron-hulled sidewheeler 1,180 200 Hoyt 1990 El Nuevo Constante 126-ft. wooden collier 65 250 Pearson et al. 1991 James Stockton 55-ft. wooden schooner 80 130 Pearson et al. 1991 Homer 148-ft. wooden side-wheeler 810 200 Pearson and Saltus 1990 modern shrimp boat segment 27 ¥ 5 ft. 350 90 Pearson et al. 1991 Confederate Obstructions
numerous vessels with machinery removed and filled with construction rubble
110 long duration
Irion and Bond 1984
Shrimp Boat Modern 162 110 Watts 2000 Single Objects
pipeline 18-in. diameter 1,570 200 Duff 1996 Pipe/mast/davit 18 in. by 26 ft. 475 104 Lydecker 2007 Pipe 3 in. by 10 ft. 55 352 Krivor 2005 anchor 6-ft. shaft 30 270 Pearson et al. 1991 iron anvil 150 lbs. 598 26 Pearson et al. 1991 engine block modern gasoline 357 60 Rogers et al. 1990 steel drum 55 gallon 191 35 Rogers et al. 1990 pipe 8 ft. long ¥ 3 in. diameter 121 40 Rogers et al. 1990 railroad rail segment 4-ft. section 216 40 Rogers et al. 1990 7 Rocket Motors 8 ft. to 34 ft. in length 61 to 422 75 to 180 Watts 2000
Multiple Objects anchor/wire rope 8-ft. modern stockless/large coil 910 140 Rogers et al. 1990 cable and chain 5 ft. 30 50 Pearson et al. 1991 scattered ferrous metal 14 by 3 ft. 100 110 Pearson et al. 1991
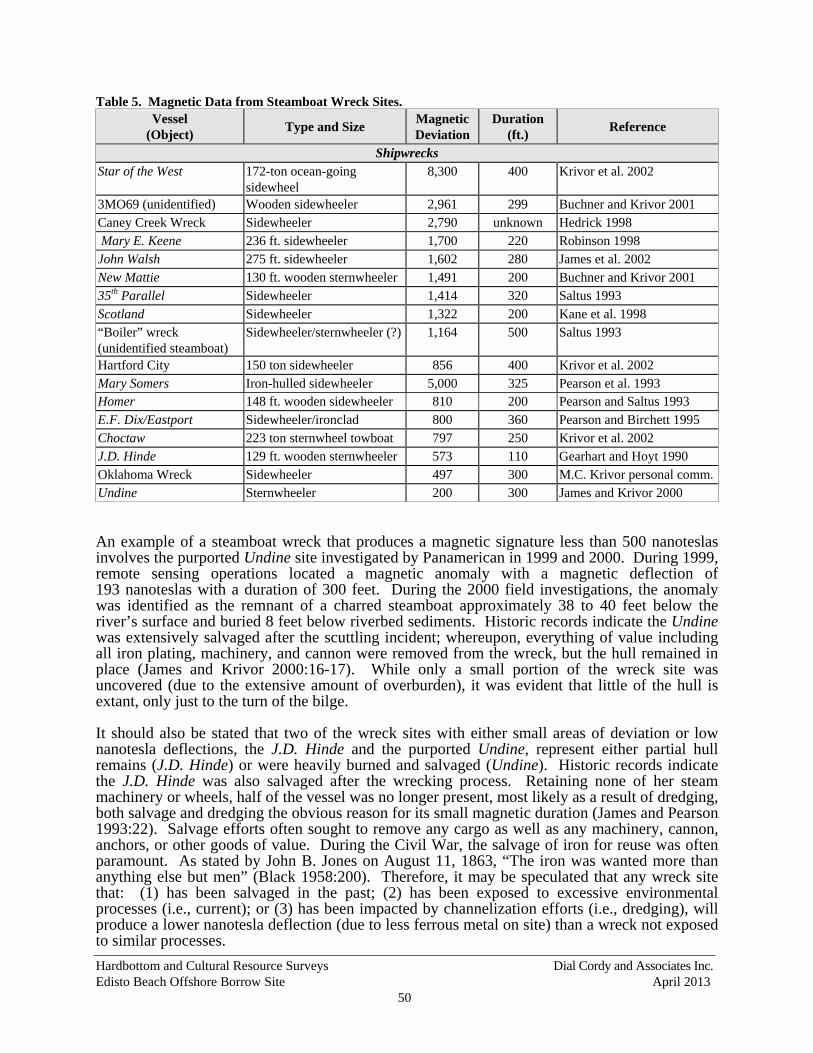
Hardbottom and Cultural Resource Surveys Dial Cordy and Associates Inc. Edisto Beach Offshore Borrow Site April 2013
50
Table 5. Magnetic Data from Steamboat Wreck Sites. Vessel
(Object) Type and Size
Magnetic Deviation
Duration (ft.)
Reference
Shipwrecks Star of the West 172-ton ocean-going
sidewheel 8,300 400 Krivor et al. 2002
3MO69 (unidentified) Wooden sidewheeler 2,961 299 Buchner and Krivor 2001 Caney Creek Wreck Sidewheeler 2,790 unknown Hedrick 1998 Mary E. Keene 236 ft. sidewheeler 1,700 220 Robinson 1998 John Walsh 275 ft. sidewheeler 1,602 280 James et al. 2002 New Mattie 130 ft. wooden sternwheeler 1,491 200 Buchner and Krivor 2001 35th Parallel Sidewheeler 1,414 320 Saltus 1993 Scotland Sidewheeler 1,322 200 Kane et al. 1998 “Boiler” wreck (unidentified steamboat)
Sidewheeler/sternwheeler (?) 1,164 500 Saltus 1993
Hartford City 150 ton sidewheeler 856 400 Krivor et al. 2002 Mary Somers Iron-hulled sidewheeler 5,000 325 Pearson et al. 1993 Homer 148 ft. wooden sidewheeler 810 200 Pearson and Saltus 1993 E.F. Dix/Eastport Sidewheeler/ironclad 800 360 Pearson and Birchett 1995 Choctaw 223 ton sternwheel towboat 797 250 Krivor et al. 2002 J.D. Hinde 129 ft. wooden sternwheeler 573 110 Gearhart and Hoyt 1990 Oklahoma Wreck Sidewheeler 497 300 M.C. Krivor personal comm.Undine Sternwheeler 200 300 James and Krivor 2000 An example of a steamboat wreck that produces a magnetic signature less than 500 nanoteslas involves the purported Undine site investigated by Panamerican in 1999 and 2000. During 1999, remote sensing operations located a magnetic anomaly with a magnetic deflection of 193 nanoteslas with a duration of 300 feet. During the 2000 field investigations, the anomaly was identified as the remnant of a charred steamboat approximately 38 to 40 feet below the river’s surface and buried 8 feet below riverbed sediments. Historic records indicate the Undine was extensively salvaged after the scuttling incident; whereupon, everything of value including all iron plating, machinery, and cannon were removed from the wreck, but the hull remained in place (James and Krivor 2000:16-17). While only a small portion of the wreck site was uncovered (due to the extensive amount of overburden), it was evident that little of the hull is extant, only just to the turn of the bilge. It should also be stated that two of the wreck sites with either small areas of deviation or low nanotesla deflections, the J.D. Hinde and the purported Undine, represent either partial hull remains (J.D. Hinde) or were heavily burned and salvaged (Undine). Historic records indicate the J.D. Hinde was also salvaged after the wrecking process. Retaining none of her steam machinery or wheels, half of the vessel was no longer present, most likely as a result of dredging, both salvage and dredging the obvious reason for its small magnetic duration (James and Pearson 1993:22). Salvage efforts often sought to remove any cargo as well as any machinery, cannon, anchors, or other goods of value. During the Civil War, the salvage of iron for reuse was often paramount. As stated by John B. Jones on August 11, 1863, “The iron was wanted more than anything else but men” (Black 1958:200). Therefore, it may be speculated that any wreck site that: (1) has been salvaged in the past; (2) has been exposed to excessive environmental processes (i.e., current); or (3) has been impacted by channelization efforts (i.e., dredging), will produce a lower nanotesla deflection (due to less ferrous metal on site) than a wreck not exposed to similar processes.
Hardbottom and Cultural Resource Surveys Dial Cordy and Associates Inc. Edisto Beach Offshore Borrow Site April 2013
51
If the signatures of all the steamboat wrecks listed in Table 5 are averaged, a magnetic deviation averaging 1,576 nanoteslas with an average duration of 234 feet is obtained. While the sensor distance, environmental factors, and the amount of ferrous metal remaining on any given steamboat site must be taken into account, previously identified wreck sites have tended to produce sizable, greater than 200-nanotesla magnetic deviations, with a minimum duration of 110 feet. While the 110-foot duration represents the lowest duration of any of the known steamboat wreck sites, it must be stated that in such cases a portion of the wreck is no longer extant due to previous salvage and dredging/channelization efforts. However, until further surveys show that this short duration is an “anomaly” so to speak, it must be employed as the baseline duration. Similarly, with the exception of the Undine site, which as stated previously was heavily salvaged, all other surveyed steamboats have nanotesla deviations approaching 500 nanoteslas or above, but the 200-nanotesla reading must be employed as the baseline amplitude. While the data indicates the validity of employing specific nanotesla strength and duration criteria when assessing magnetic anomalies, other factors must be taken into account. Pearson and Hudson (1990) have argued that the past and recent use of a water body must be an important consideration in the interpretation of remote sensing data; in many cases, this should supposedly be the most important criterion. Unless the remote sensing data, the historical record, or the specific environment (i.e., harbor entrance channel) provides compelling and overriding evidence, it is otherwise believed that the history of use should be a primary consideration in the interpretation. The constitution of “compelling evidence” is, to some extent, left to the discretion of the researcher; however, in settings where modern commercial traffic and historic use have been intensive, such as the current Project Area, the presence of a large quantity of modern debris must be anticipated. In harbor, bay, or riverine situations where traffic is heavy, this debris will be scattered along the channel Right Of Way (ROW), although it may be concentrated in areas where traffic would slow or halt, and it will appear on remote sensing survey records as discrete, small objects. This is, in fact, the case for many of the anomalies recorded during the current investigation. In addition to anomaly strength and duration considerations, all anomalies were assessed for type [monopole (negative or positive influence), dipole (negative and positive influence), or complex] and association with other magnetic anomalies (i.e., clustering) and sidescan sonar targets. With regard to analysis of these anomalies, relative to potential significance, many will be found to represent a small, single-source object (a localized deviation), and are generally identified and labeled as non-significant, especially in an area of high use, such as adjacent to a navigation channel, similar to the current environment. As seen on contour maps, the contour lines for this type of anomaly can be seen to approach, or go to but not beyond, the adjacent survey trackline on which it is located. This visual interpretation is corroborated during the analysis of the electronic magnetometer strip-chart data of each survey trackline. An examination of a strip chart will show that the target was recorded only on a single transect, and that it was not recorded (i.e., did not influence the ambient magnetic background) on adjacent lines. This is especially true when an anomaly’s readings are large deviations but are recorded on only one line. This indicates the source for this target must be a small, discrete object, and the magnetometer sensor must have passed closely by or directly over the object in order to generate the large readings on this survey line, yet not be recorded or have had an influence on adjacent lines; especially relevant when employing a 50-foot transect interval. Because these anomalies represent single-source objects, they are not considered representative of a potentially significant submerged cultural resource and are not recommended for avoidance.
3.6.2 Sidescan Sonar In contrast to magnetic data, sidescan interpretation is less problematic, as objects are reconstructed as they look to the eye. Targets, such as isolated sections of pipe, can normally be
Hardbottom and Cultural Resource Surveys Dial Cordy and Associates Inc. Edisto Beach Offshore Borrow Site April 2013
52
immediately discarded as non-significant, while large areas of above-sediment wreckage as well as some exposed paleofeatures are generally apparent. The chief factors considered in analyzing sidescan data, with regard to wreckage, include: linearity, height off bottom, size, associated magnetics, and environmental context. Since historic resources in the form of shipwrecks usually contain large amounts of ferrous compounds, complex sidescan targets with complex magnetic anomalies are of the greatest importance. The usual outcome of targets with no associated magnetics is items, such as rocks, trees, and other non-historic debris of limited interest to the archaeologist.
3.6.3 Clustering Since an archaeological remote sensing survey involves the collection of several different types of data, each of which has the potential to locate significant cultural resources, attention must be given to groups of targets. These groupings, referred to as clustering, occur when a target exists that produces both a sidescan sonar return and a magnetic signature. In addition, a magnetic source that extends across several survey lines will produce an anomaly on each line, and since these anomalies are related, they will form a cluster. Previously discovered archaeological sites will also be considered as an aspect of clustering. Although criteria used to determine a cluster is somewhat subjective, anomalies, sidescan targets, and previously identified archaeological sites will generally be included in a cluster if they lie within 65 feet of one another.
3.6.4 Subbottom Profiler Analysis Subbottom profilers generate low frequency acoustic waves that penetrate the seabed and reflect off boundaries or objects located in the subsurface. The data are then processed and reproduced as a cross section using two-way travel time to determine depth (the time taken for the pulse to travel from the source to the reflector and back to the receiver by a constant). The shapes, relationships, and extents of reflectors are used to infer bottom and subbottom geomorphological characteristics. In general, high and low amplitude linear reflectors (light and dark lines) distinguish between sediment beds; parabolic reflectors indicate point-source objects with sound propagating out from them; and erosional or non-depositional contacts can be identified by discontinuities in extent, slope angle, and the shape of the reflector morphology. This latter fact is important when identifying buried and drowned channel systems and other relict and buried fluvial system features (e.g., estuarine, tidal, lowland, and upland areas around drainage features). In caution, there are five spurious signals that may cause confusion in the two-dimensional records that specialists recognize: direct arrival from the sound source; reflection multiples; water surface reflection; side echoes; and point-source reflections. Judicious analysis is required to identify these sound underwater imagery phenomena. Precise inference of a sediment bed or other anomaly from the subbottom profiler data would necessitate coring or excavation. While it is challenging to know which reflectors are significant, the intent is to identify paleolandscape features likely to be conducive to human occupation and where preservation may be enhanced based on local geology and archaeology. In analysis, seismic returns indicating positive relief features as possible mounds and negative relief features as a probable channel or other fluvial feature with margins and sediment beds indicate higher potentials for prehistoric remains.
3.7 Method and Theory for Recognition of a Submerged Prehistoric Site The methodology used for identifying submerged prehistoric sites entails developing criteria for the discovery of a “site” in any particular setting. The criteria are based on the geology and archaeology of the Project Area and models of site submergence. Models for the presence and
Hardbottom and Cultural Resource Surveys Dial Cordy and Associates Inc. Edisto Beach Offshore Borrow Site April 2013
53
preservation of submerged archaeological sites are discussed by several researchers, including Waters (1992) in his chapter on coastal processes, Kraft et al. (1983), and others. Much of this has to do with the identification of landforms identifiable with remote sensing that have the potential for archaeological site presence. For instance, two models used in this project were horizontal surfaces near channel features and positive relief features considered potentially to represent midden feature(s). Causeways, fishing weirs, or other prehistoric infrastructure features are difficult to identify. Publications are more limited that are specific to recognizing sedimentary signatures of the deposits that make up sites that have been transgressed by rising sea levels and then remained submerged, perhaps buried, until exposure. One such study specifically focused on such information is Gagliano et al.’s (1982) Sedimentary Studies of Prehistoric Archaeological Sites: Criteria for the identification of submerged archaeological Sites of the Northern Gulf of Mexico Continental Shelf. This document is one of high value, but limited distribution. Gagliano’s group chose 15 terrestrial sites in Louisiana and Texas as analogs from eight identifiable and mappable landforms with which archaeological sites are commonly and consistently associated on land, terrestrially. Their local geomorphic features included major natural levee, minor natural levee, Chenier and accretion ridges, barrier island, salt dome margin, estuarine margin, channel on Pleistocene terrace, and lake margins. They sampled sediments with excavations and box core sampling; recorded color, bedding, and contact descriptions; sorted the sediments to particle size; conducted point count and grain size analysis; and then geochemically analyzed the samples by levels. They showed that sites were recognized most frequently by shell content, fish bones, and charred wood. Some ceramic and lithic artifacts were identified, but they were rare and often small. Another aspect to realize about submerged prehistoric sites is that virtually all examples of inundated sites are partially, or wholly, reworked in ways somewhat analogous to deflation (Masters and Flemming 1983; Fischer 1995). This is caused by fluidization of sediments at times of inundation and the removal of fine particles that are often re-deposited with material by subsidence of the inundation or wave action. Faught (2002–2004; 1996) has shown sites with late Pleistocene, early Holocene, and middle Holocene artifacts to be reworked by sea level rise and submergence, but that artifact arrays remain cohesive as surface and near surface remains. Because of these factors, recognition that deposits are indeed cultural is not always immediately apparent to the diver, or at first glance of the collected materials. Artifacts are important, but not always part of the site, as Gagliano et al. (1982) has systematically determined. Expectations for midden deposits include dominance of unarticulated specimens of particular mollusk species, faunal bone, and manuports (i.e., geologic items out of place). On the other hand, discovery of any artifact would be important, especially in any sediment bed below a marine bed.
4.0 INVESTIGATIVE FINDINGS
Eighteen magnetic anomalies, thirty-one sidescan sonar targets, and two subbottom impedance contrast paleolandform feature areas were recorded during the current survey. Employing the previous discussions on target analysis, magnetic anomalies were assessed for potential significance based on magnetic deviation (above and/or below ambient background), duration (distance in feet, along a trackline, an anomaly influences the ambient background), type [monopole (negative or positive influence), dipole (negative and positive influence), or complex], and association with other magnetic anomalies (i.e., clustering) and/or sidescan sonar contacts. Sidescan sonar contacts, as visual images, were assessed for linearity, height off bottom, size, associated magnetics, backscatter characteristics, and visual surface associations (i.e., buoys, etc.). Subbottom features were assessed as to feature type, and association with other subbottom features and sidescan targets.
Hardbottom and Cultural Resource Surveys Dial Cordy and Associates Inc. Edisto Beach Offshore Borrow Site April 2013
54
Out of all the anomalies, sonar targets, and subbottom impedance contrast features, no anomalies were considered to potentially represent significant historic cultural resources. Several sidescan sonar contacts and subbottom features were considered to represent vestiges of paleolandforms that have the possibility of containing prehistoric cultural resources sites. From review of the sidescan records, no apparent hardbottom features were identified.
4.1 Submerged Cultural Resources
4.1.1 Magnetometer Results As listed in Table 6 and illustrated in Figure 35 (which corresponds to Appendix B: Magnetic Anomalies Contour Maps), a total of 18 magnetic anomalies with variations of approximately 10 nanoteslas or higher were recorded during the investigation within the survey area. Table 2 includes target location, type (i.e., monopole, dipole, complex), anomaly deviation in nanoteslas, duration in feet, and association with other targets (both magnetic and sidescan) from the current survey. The magnetic contour maps (Appendix B) are presented at a 10-nanotesla contour. Based in part on the anomaly signature (i.e., linearity) and/or sidescan target association, the recorded anomalies have been identified as mainly single point source anomalies, with only one unknown, M18. Many of the single-source anomaly readings have large deviations (yet were recorded on only one line); this indicates the source for these targets must be small, discrete objects. This is further evidenced by the very shallow nature of the survey area. The magnetometer sensor must have passed closely by or directly over the object to generate the large readings on a survey line, but not be recorded or have had an influence on an adjacent line. The single-source anomaly type is not considered representative of a potentially significant submerged cultural resource. The one unknown anomaly is M18. The unknown designation means there is no readily available explanation as to its source; it has no associated acoustic image. Its signal was recorded on two lines, but more on one line than the other; indicating it sits between the two lines. With only a 30-nanotesla total deviation and of relatively short duration, this anomaly is not considered to meet criteria for a potentially significant anomaly, as discussed in Section 2.0.
4.1.2 Sidescan Sonar Results Listed in Tables 7 and 8, and illustrated in Figure 36, thirty-one sidescan sonar contacts were recorded during the analysis of the data. Their locations are shown on the magnetic contour maps in Appendix B, these “contacts” included any object or anomalous bottom return that was not uniform sand. Of the 31 sidescan sonar contacts, none represent potentially submerged cultural resources of a historic nature (i.e., shipwrecks). They represent small isolated debris (i.e., crab pots, etc.) that do not possess characteristics indicative of vessel wreckage, and none are associated with magnetic anomalies, adding further evidence to this statement. However, and as discussed below, several are indicators of paleolandscape settings and may have prehistoric site potentials.
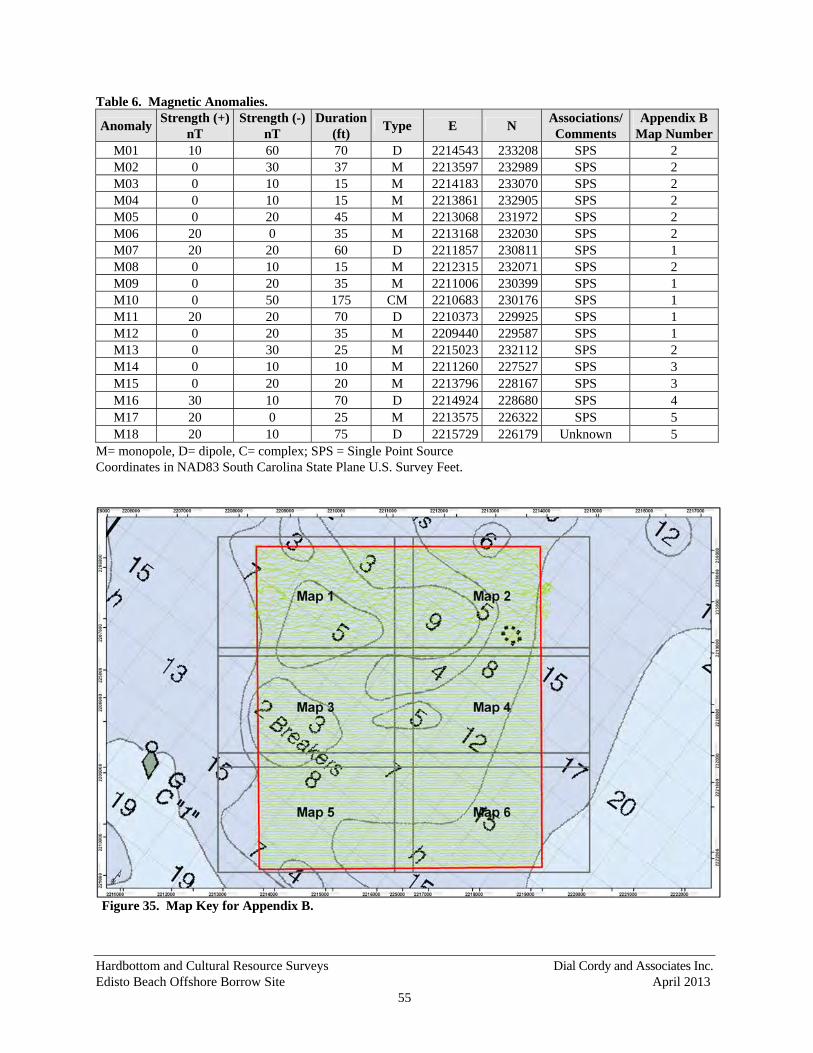
Hardbottom and Cultural Resource Surveys Dial Cordy and Associates Inc. Edisto Beach Offshore Borrow Site April 2013
55
Table 6. Magnetic Anomalies.
Anomaly Strength (+)
nT Strength (-)
nT Duration
(ft) Type E N
Associations/Comments
Appendix B Map Number
M01 10 60 70 D 2214543 233208 SPS 2 M02 0 30 37 M 2213597 232989 SPS 2 M03 0 10 15 M 2214183 233070 SPS 2 M04 0 10 15 M 2213861 232905 SPS 2 M05 0 20 45 M 2213068 231972 SPS 2 M06 20 0 35 M 2213168 232030 SPS 2 M07 20 20 60 D 2211857 230811 SPS 1 M08 0 10 15 M 2212315 232071 SPS 2 M09 0 20 35 M 2211006 230399 SPS 1 M10 0 50 175 CM 2210683 230176 SPS 1 M11 20 20 70 D 2210373 229925 SPS 1 M12 0 20 35 M 2209440 229587 SPS 1 M13 0 30 25 M 2215023 232112 SPS 2 M14 0 10 10 M 2211260 227527 SPS 3 M15 0 20 20 M 2213796 228167 SPS 3 M16 30 10 70 D 2214924 228680 SPS 4 M17 20 0 25 M 2213575 226322 SPS 5 M18 20 10 75 D 2215729 226179 Unknown 5
M= monopole, D= dipole, C= complex; SPS = Single Point Source Coordinates in NAD83 South Carolina State Plane U.S. Survey Feet.
Figure 35. Map Key for Appendix B.
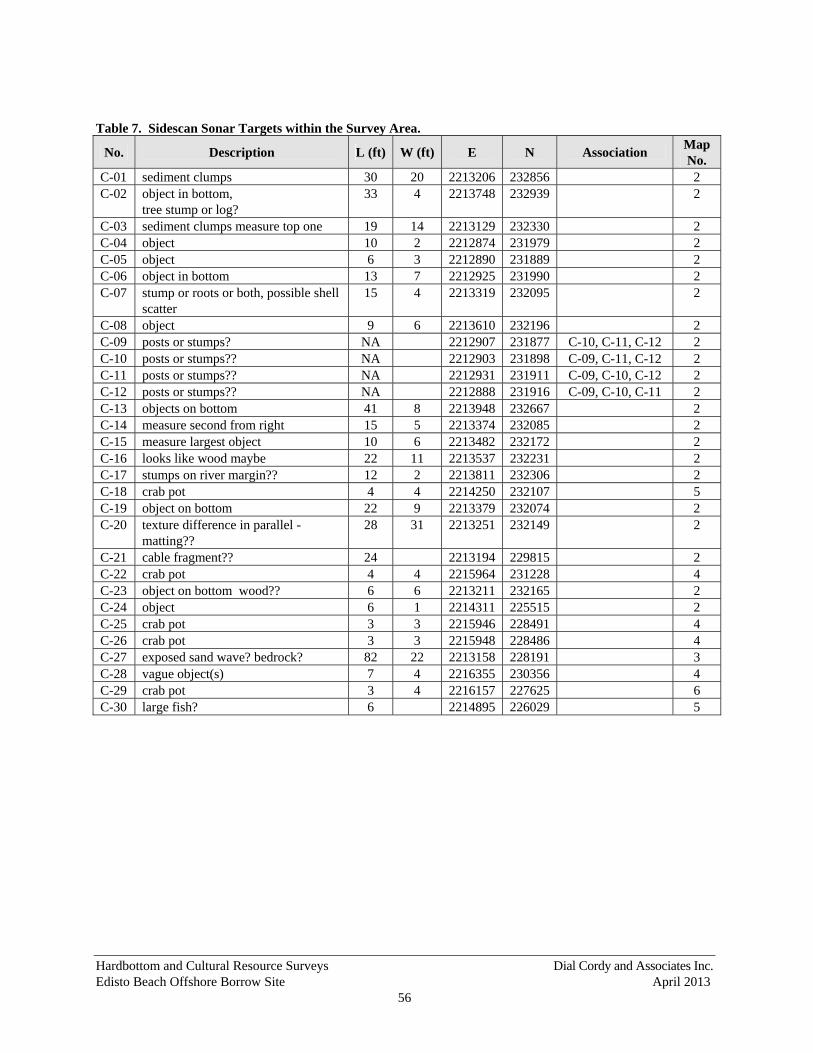
Hardbottom and Cultural Resource Surveys Dial Cordy and Associates Inc. Edisto Beach Offshore Borrow Site April 2013
56
Table 7. Sidescan Sonar Targets within the Survey Area.
No. Description L (ft) W (ft) E N Association Map No.
C-01 sediment clumps 30 20 2213206 232856 2 C-02 object in bottom,
tree stump or log? 33 4 2213748 232939 2
C-03 sediment clumps measure top one 19 14 2213129 232330 2C-04 object 10 2 2212874 231979 2C-05 object 6 3 2212890 231889 2C-06 object in bottom 13 7 2212925 231990 2C-07 stump or roots or both, possible shell
scatter 15 4 2213319 232095 2
C-08 object 9 6 2213610 232196 2C-09 posts or stumps? NA 2212907 231877 C-10, C-11, C-12 2C-10 posts or stumps?? NA 2212903 231898 C-09, C-11, C-12 2C-11 posts or stumps?? NA 2212931 231911 C-09, C-10, C-12 2C-12 posts or stumps?? NA 2212888 231916 C-09, C-10, C-11 2C-13 objects on bottom 41 8 2213948 232667 2C-14 measure second from right 15 5 2213374 232085 2C-15 measure largest object 10 6 2213482 232172 2C-16 looks like wood maybe 22 11 2213537 232231 2C-17 stumps on river margin?? 12 2 2213811 232306 2C-18 crab pot 4 4 2214250 232107 5 C-19 object on bottom 22 9 2213379 232074 2 C-20 texture difference in parallel -
matting?? 28 31 2213251 232149 2
C-21 cable fragment?? 24 2213194 229815 2 C-22 crab pot 4 4 2215964 231228 4 C-23 object on bottom wood?? 6 6 2213211 232165 2 C-24 object 6 1 2214311 225515 2 C-25 crab pot 3 3 2215946 228491 4 C-26 crab pot 3 3 2215948 228486 4 C-27 exposed sand wave? bedrock? 82 22 2213158 228191 3 C-28 vague object(s) 7 4 2216355 230356 4 C-29 crab pot 3 4 2216157 227625 6 C-30 large fish? 6 2214895 226029 5
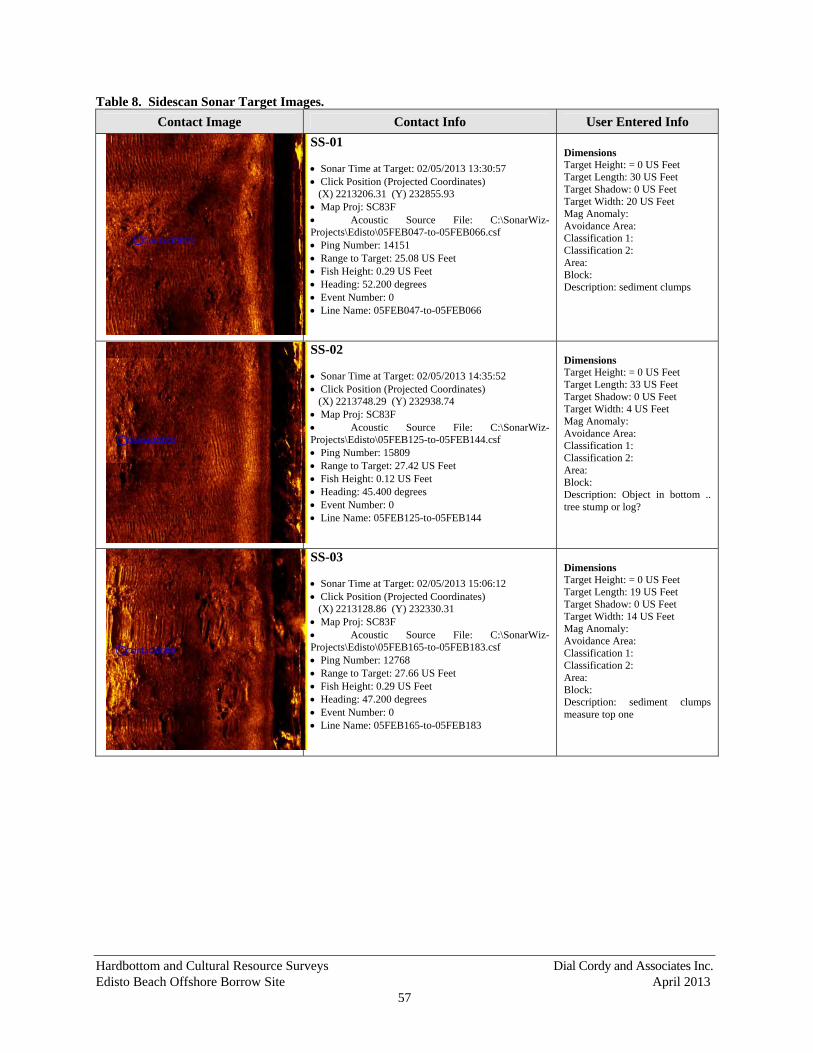
Hardbottom and Cultural Resource Surveys Dial Cordy and Associates Inc. Edisto Beach Offshore Borrow Site April 2013
57
Table 8. Sidescan Sonar Target Images.
Contact Image Contact Info User Entered Info
SS-01 Sonar Time at Target: 02/05/2013 13:30:57 Click Position (Projected Coordinates) (X) 2213206.31 (Y) 232855.93 Map Proj: SC83F Acoustic Source File: C:\SonarWiz-Projects\Edisto\05FEB047-to-05FEB066.csf Ping Number: 14151 Range to Target: 25.08 US Feet Fish Height: 0.29 US Feet Heading: 52.200 degrees Event Number: 0 Line Name: 05FEB047-to-05FEB066
Dimensions Target Height: = 0 US Feet Target Length: 30 US Feet Target Shadow: 0 US Feet Target Width: 20 US Feet Mag Anomaly: Avoidance Area: Classification 1: Classification 2: Area: Block: Description: sediment clumps
SS-02 Sonar Time at Target: 02/05/2013 14:35:52 Click Position (Projected Coordinates) (X) 2213748.29 (Y) 232938.74 Map Proj: SC83F Acoustic Source File: C:\SonarWiz-Projects\Edisto\05FEB125-to-05FEB144.csf Ping Number: 15809 Range to Target: 27.42 US Feet Fish Height: 0.12 US Feet Heading: 45.400 degrees Event Number: 0 Line Name: 05FEB125-to-05FEB144
Dimensions Target Height: = 0 US Feet Target Length: 33 US Feet Target Shadow: 0 US Feet Target Width: 4 US Feet Mag Anomaly: Avoidance Area: Classification 1: Classification 2: Area: Block: Description: Object in bottom .. tree stump or log?
SS-03 Sonar Time at Target: 02/05/2013 15:06:12 Click Position (Projected Coordinates) (X) 2213128.86 (Y) 232330.31 Map Proj: SC83F Acoustic Source File: C:\SonarWiz-Projects\Edisto\05FEB165-to-05FEB183.csf Ping Number: 12768 Range to Target: 27.66 US Feet Fish Height: 0.29 US Feet Heading: 47.200 degrees Event Number: 0 Line Name: 05FEB165-to-05FEB183
Dimensions Target Height: = 0 US Feet Target Length: 19 US Feet Target Shadow: 0 US Feet Target Width: 14 US Feet Mag Anomaly: Avoidance Area: Classification 1: Classification 2: Area: Block: Description: sediment clumps measure top one
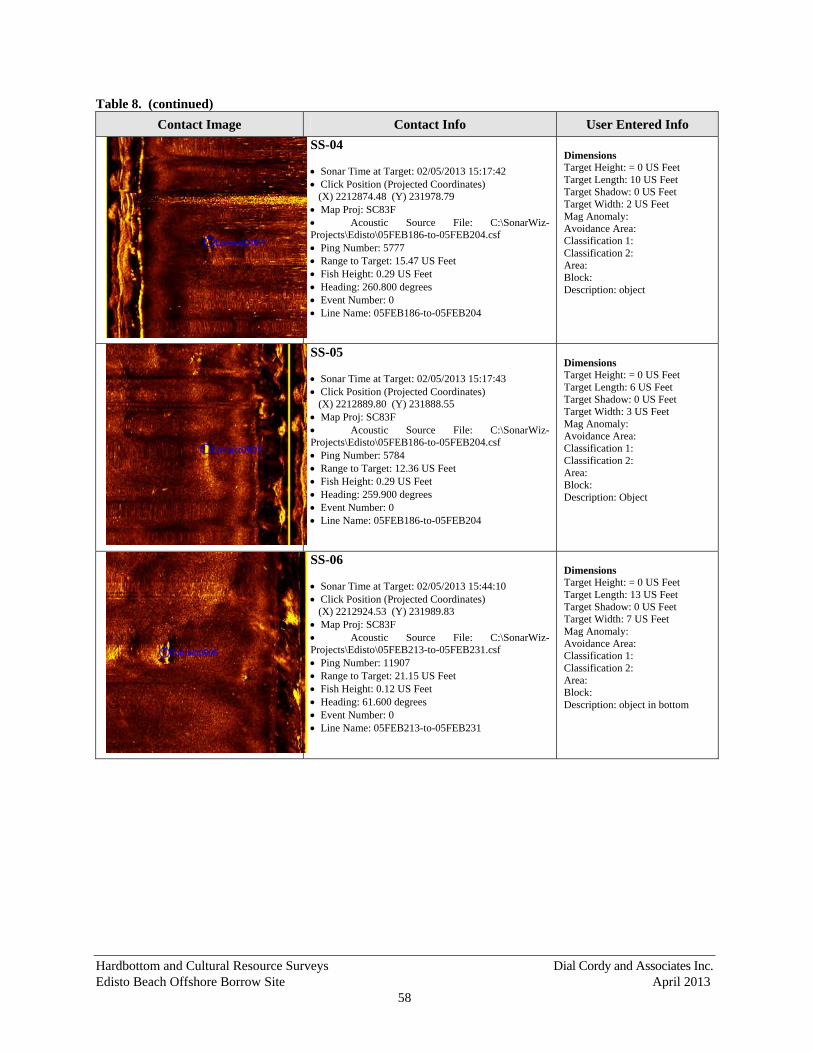
Hardbottom and Cultural Resource Surveys Dial Cordy and Associates Inc. Edisto Beach Offshore Borrow Site April 2013
58
Table 8. (continued)
Contact Image Contact Info User Entered Info
SS-04 Sonar Time at Target: 02/05/2013 15:17:42 Click Position (Projected Coordinates) (X) 2212874.48 (Y) 231978.79 Map Proj: SC83F Acoustic Source File: C:\SonarWiz-Projects\Edisto\05FEB186-to-05FEB204.csf Ping Number: 5777 Range to Target: 15.47 US Feet Fish Height: 0.29 US Feet Heading: 260.800 degrees Event Number: 0 Line Name: 05FEB186-to-05FEB204
Dimensions Target Height: = 0 US Feet Target Length: 10 US Feet Target Shadow: 0 US Feet Target Width: 2 US Feet Mag Anomaly: Avoidance Area: Classification 1: Classification 2: Area: Block: Description: object
SS-05 Sonar Time at Target: 02/05/2013 15:17:43 Click Position (Projected Coordinates) (X) 2212889.80 (Y) 231888.55 Map Proj: SC83F Acoustic Source File: C:\SonarWiz-Projects\Edisto\05FEB186-to-05FEB204.csf Ping Number: 5784 Range to Target: 12.36 US Feet Fish Height: 0.29 US Feet Heading: 259.900 degrees Event Number: 0 Line Name: 05FEB186-to-05FEB204
Dimensions Target Height: = 0 US Feet Target Length: 6 US Feet Target Shadow: 0 US Feet Target Width: 3 US Feet Mag Anomaly: Avoidance Area: Classification 1: Classification 2: Area: Block: Description: Object
SS-06 Sonar Time at Target: 02/05/2013 15:44:10 Click Position (Projected Coordinates) (X) 2212924.53 (Y) 231989.83 Map Proj: SC83F Acoustic Source File: C:\SonarWiz-Projects\Edisto\05FEB213-to-05FEB231.csf Ping Number: 11907 Range to Target: 21.15 US Feet Fish Height: 0.12 US Feet Heading: 61.600 degrees Event Number: 0 Line Name: 05FEB213-to-05FEB231
Dimensions Target Height: = 0 US Feet Target Length: 13 US Feet Target Shadow: 0 US Feet Target Width: 7 US Feet Mag Anomaly: Avoidance Area: Classification 1: Classification 2: Area: Block: Description: object in bottom

Hardbottom and Cultural Resource Surveys Dial Cordy and Associates Inc. Edisto Beach Offshore Borrow Site April 2013
59
Table 8. (continued)
Contact Image Contact Info User Entered Info
SS-07 Sonar Time at Target: 02/05/2013 15:44:58 Click Position (Projected Coordinates) (X) 2213318.79 (Y) 232094.90 Map Proj: SC83F Acoustic Source File: C:\SonarWiz-Projects\Edisto\05FEB213-to-05FEB231.csf Ping Number: 12837 Range to Target: 26.31 US Feet Fish Height: 0.12 US Feet Heading: 35.000 degrees Event Number: 0 Line Name: 05FEB213-to-05FEB231
Dimensions Target Height: = 0 US Feet Target Length: 15 US Feet Target Shadow: 0 US Feet Target Width: 4 US Feet Mag Anomaly: Avoidance Area: Classification 1: Classification 2: Area: Block: Description: stump or roots or both possible shell scatter
SS-08 Sonar Time at Target: 02/05/2013 16:47:16 Click Position (Projected Coordinates) (X) 2213610.34 (Y) 232196.29 Map Proj: SC83F Acoustic Source File: C:\SonarWiz-Projects\Edisto\05FEB233-to-05FEB269.csf Ping Number: 14523 Range to Target: 13.77 US Feet Fish Height: 0.76 US Feet Heading: 43.200 degrees Event Number: 0 Line Name: 05FEB233-to-05FEB269
Dimensions Target Height: = 0 US Feet Target Length: 9 US Feet Target Shadow: 0 US Feet Target Width: 6 US Feet Mag Anomaly: Avoidance Area: Classification 1: Classification 2: Area: Block: Description: object
SS-09 Sonar Time at Target: 02/05/2013 16:15:38 Click Position (Projected Coordinates) (X) 2212906.93 (Y) 231877.37 Map Proj: SC83F Acoustic Source File: C:\SonarWiz-Projects\Edisto\05FEB234-to-05FEB250.csf Ping Number: 10984 Range to Target: 15.94 US Feet Fish Height: 0.35 US Feet Heading: 50.700 degrees Event Number: 0 Line Name: 05FEB234-to-05FEB250
Dimensions Target Height: = 0 US Feet Target Length: 0 US Feet Target Shadow: 0 US Feet Target Width: 0 US Feet Mag Anomaly: Avoidance Area: Classification 1: Classification 2: Area: Block: Description: posts or stumps?? buried structure
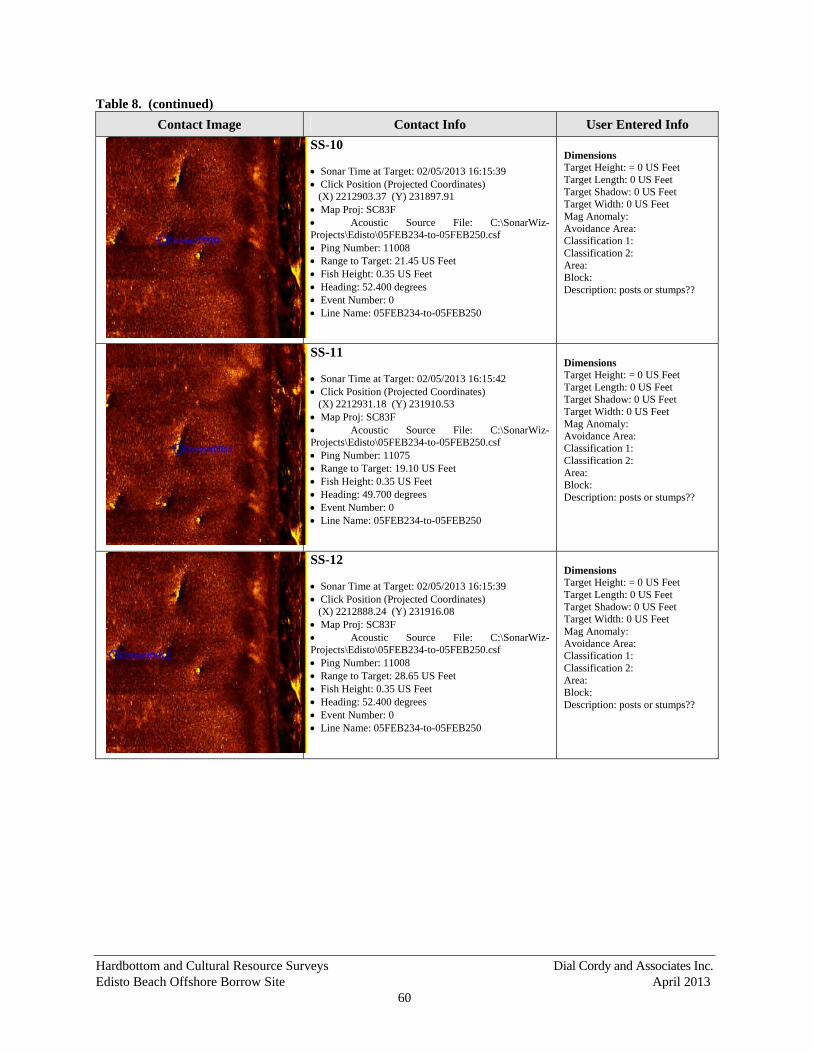
Hardbottom and Cultural Resource Surveys Dial Cordy and Associates Inc. Edisto Beach Offshore Borrow Site April 2013
60
Table 8. (continued)
Contact Image Contact Info User Entered Info
SS-10 Sonar Time at Target: 02/05/2013 16:15:39 Click Position (Projected Coordinates) (X) 2212903.37 (Y) 231897.91 Map Proj: SC83F Acoustic Source File: C:\SonarWiz-Projects\Edisto\05FEB234-to-05FEB250.csf Ping Number: 11008 Range to Target: 21.45 US Feet Fish Height: 0.35 US Feet Heading: 52.400 degrees Event Number: 0 Line Name: 05FEB234-to-05FEB250
Dimensions Target Height: = 0 US Feet Target Length: 0 US Feet Target Shadow: 0 US Feet Target Width: 0 US Feet Mag Anomaly: Avoidance Area: Classification 1: Classification 2: Area: Block: Description: posts or stumps??
SS-11 Sonar Time at Target: 02/05/2013 16:15:42 Click Position (Projected Coordinates) (X) 2212931.18 (Y) 231910.53 Map Proj: SC83F Acoustic Source File: C:\SonarWiz-Projects\Edisto\05FEB234-to-05FEB250.csf Ping Number: 11075 Range to Target: 19.10 US Feet Fish Height: 0.35 US Feet Heading: 49.700 degrees Event Number: 0 Line Name: 05FEB234-to-05FEB250
Dimensions Target Height: = 0 US Feet Target Length: 0 US Feet Target Shadow: 0 US Feet Target Width: 0 US Feet Mag Anomaly: Avoidance Area: Classification 1: Classification 2: Area: Block: Description: posts or stumps??
SS-12 Sonar Time at Target: 02/05/2013 16:15:39 Click Position (Projected Coordinates) (X) 2212888.24 (Y) 231916.08 Map Proj: SC83F Acoustic Source File: C:\SonarWiz-Projects\Edisto\05FEB234-to-05FEB250.csf Ping Number: 11008 Range to Target: 28.65 US Feet Fish Height: 0.35 US Feet Heading: 52.400 degrees Event Number: 0 Line Name: 05FEB234-to-05FEB250
Dimensions Target Height: = 0 US Feet Target Length: 0 US Feet Target Shadow: 0 US Feet Target Width: 0 US Feet Mag Anomaly: Avoidance Area: Classification 1: Classification 2: Area: Block: Description: posts or stumps??
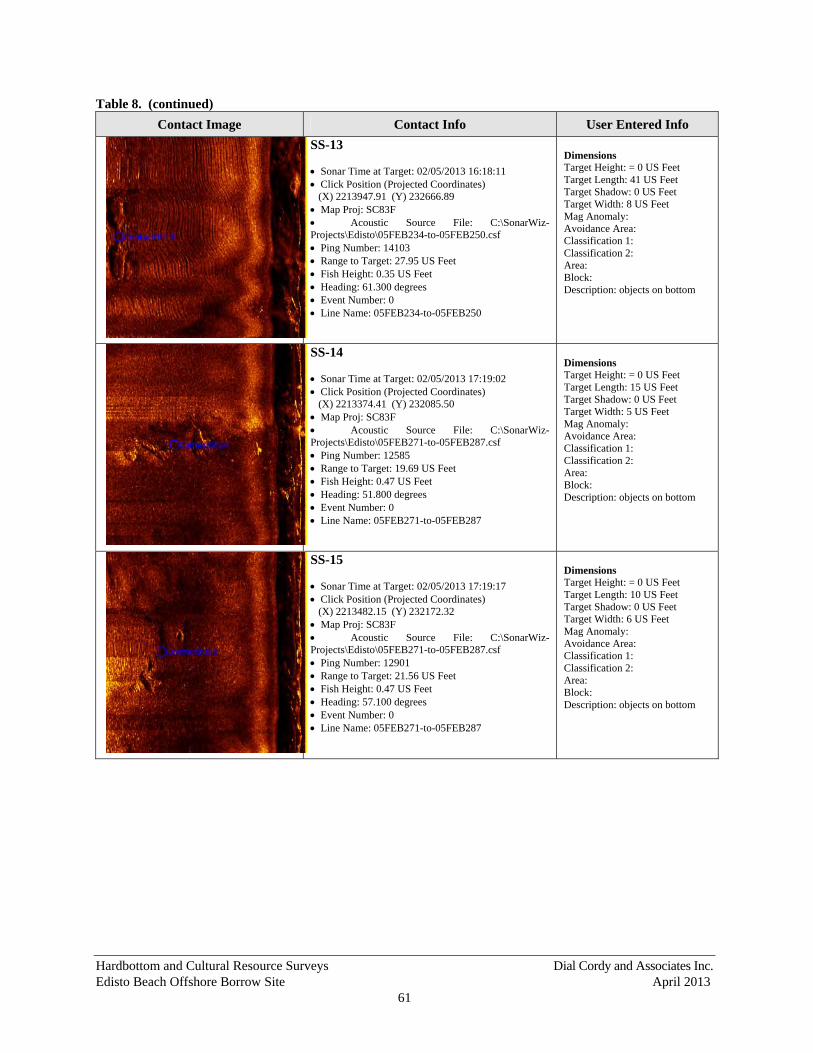
Hardbottom and Cultural Resource Surveys Dial Cordy and Associates Inc. Edisto Beach Offshore Borrow Site April 2013
61
Table 8. (continued)
Contact Image Contact Info User Entered Info
SS-13 Sonar Time at Target: 02/05/2013 16:18:11 Click Position (Projected Coordinates) (X) 2213947.91 (Y) 232666.89 Map Proj: SC83F Acoustic Source File: C:\SonarWiz-Projects\Edisto\05FEB234-to-05FEB250.csf Ping Number: 14103 Range to Target: 27.95 US Feet Fish Height: 0.35 US Feet Heading: 61.300 degrees Event Number: 0 Line Name: 05FEB234-to-05FEB250
Dimensions Target Height: = 0 US Feet Target Length: 41 US Feet Target Shadow: 0 US Feet Target Width: 8 US Feet Mag Anomaly: Avoidance Area: Classification 1: Classification 2: Area: Block: Description: objects on bottom
SS-14 Sonar Time at Target: 02/05/2013 17:19:02 Click Position (Projected Coordinates) (X) 2213374.41 (Y) 232085.50 Map Proj: SC83F Acoustic Source File: C:\SonarWiz-Projects\Edisto\05FEB271-to-05FEB287.csf Ping Number: 12585 Range to Target: 19.69 US Feet Fish Height: 0.47 US Feet Heading: 51.800 degrees Event Number: 0 Line Name: 05FEB271-to-05FEB287
Dimensions Target Height: = 0 US Feet Target Length: 15 US Feet Target Shadow: 0 US Feet Target Width: 5 US Feet Mag Anomaly: Avoidance Area: Classification 1: Classification 2: Area: Block: Description: objects on bottom
SS-15 Sonar Time at Target: 02/05/2013 17:19:17 Click Position (Projected Coordinates) (X) 2213482.15 (Y) 232172.32 Map Proj: SC83F Acoustic Source File: C:\SonarWiz-Projects\Edisto\05FEB271-to-05FEB287.csf Ping Number: 12901 Range to Target: 21.56 US Feet Fish Height: 0.47 US Feet Heading: 57.100 degrees Event Number: 0 Line Name: 05FEB271-to-05FEB287
Dimensions Target Height: = 0 US Feet Target Length: 10 US Feet Target Shadow: 0 US Feet Target Width: 6 US Feet Mag Anomaly: Avoidance Area: Classification 1: Classification 2: Area: Block: Description: objects on bottom
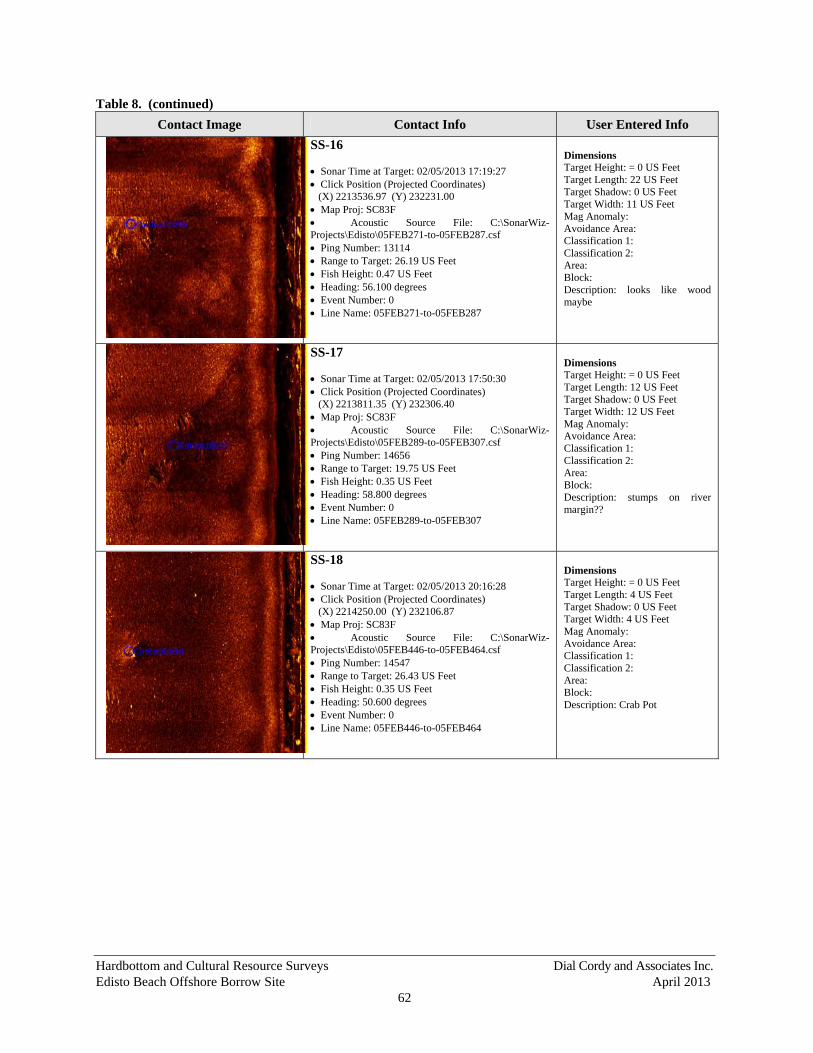
Hardbottom and Cultural Resource Surveys Dial Cordy and Associates Inc. Edisto Beach Offshore Borrow Site April 2013
62
Table 8. (continued)
Contact Image Contact Info User Entered Info
SS-16 Sonar Time at Target: 02/05/2013 17:19:27 Click Position (Projected Coordinates) (X) 2213536.97 (Y) 232231.00 Map Proj: SC83F Acoustic Source File: C:\SonarWiz-Projects\Edisto\05FEB271-to-05FEB287.csf Ping Number: 13114 Range to Target: 26.19 US Feet Fish Height: 0.47 US Feet Heading: 56.100 degrees Event Number: 0 Line Name: 05FEB271-to-05FEB287
Dimensions Target Height: = 0 US Feet Target Length: 22 US Feet Target Shadow: 0 US Feet Target Width: 11 US Feet Mag Anomaly: Avoidance Area: Classification 1: Classification 2: Area: Block: Description: looks like wood maybe
SS-17 Sonar Time at Target: 02/05/2013 17:50:30 Click Position (Projected Coordinates) (X) 2213811.35 (Y) 232306.40 Map Proj: SC83F Acoustic Source File: C:\SonarWiz-Projects\Edisto\05FEB289-to-05FEB307.csf Ping Number: 14656 Range to Target: 19.75 US Feet Fish Height: 0.35 US Feet Heading: 58.800 degrees Event Number: 0 Line Name: 05FEB289-to-05FEB307
Dimensions Target Height: = 0 US Feet Target Length: 12 US Feet Target Shadow: 0 US Feet Target Width: 12 US Feet Mag Anomaly: Avoidance Area: Classification 1: Classification 2: Area: Block: Description: stumps on river margin??
SS-18 Sonar Time at Target: 02/05/2013 20:16:28 Click Position (Projected Coordinates) (X) 2214250.00 (Y) 232106.87 Map Proj: SC83F Acoustic Source File: C:\SonarWiz-Projects\Edisto\05FEB446-to-05FEB464.csf Ping Number: 14547 Range to Target: 26.43 US Feet Fish Height: 0.35 US Feet Heading: 50.600 degrees Event Number: 0 Line Name: 05FEB446-to-05FEB464
Dimensions Target Height: = 0 US Feet Target Length: 4 US Feet Target Shadow: 0 US Feet Target Width: 4 US Feet Mag Anomaly: Avoidance Area: Classification 1: Classification 2: Area: Block: Description: Crab Pot
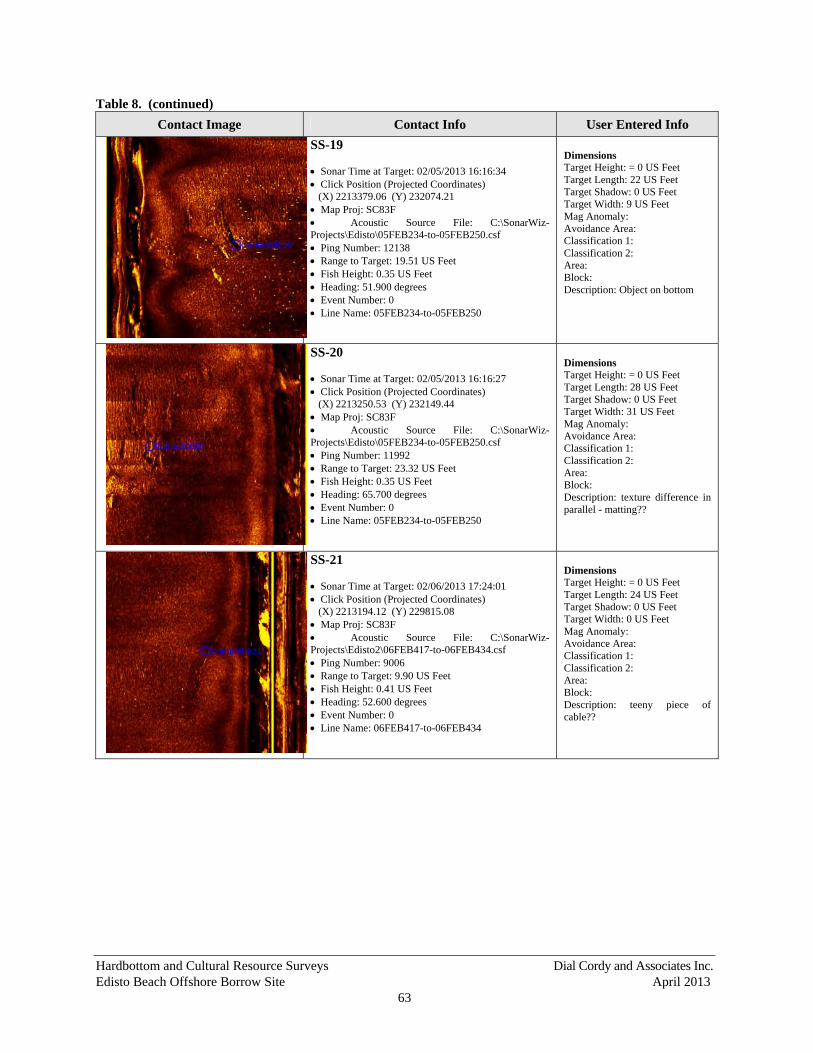
Hardbottom and Cultural Resource Surveys Dial Cordy and Associates Inc. Edisto Beach Offshore Borrow Site April 2013
63
Table 8. (continued)
Contact Image Contact Info User Entered Info
SS-19 Sonar Time at Target: 02/05/2013 16:16:34 Click Position (Projected Coordinates) (X) 2213379.06 (Y) 232074.21 Map Proj: SC83F Acoustic Source File: C:\SonarWiz-Projects\Edisto\05FEB234-to-05FEB250.csf Ping Number: 12138 Range to Target: 19.51 US Feet Fish Height: 0.35 US Feet Heading: 51.900 degrees Event Number: 0 Line Name: 05FEB234-to-05FEB250
Dimensions Target Height: = 0 US Feet Target Length: 22 US Feet Target Shadow: 0 US Feet Target Width: 9 US Feet Mag Anomaly: Avoidance Area: Classification 1: Classification 2: Area: Block: Description: Object on bottom
SS-20 Sonar Time at Target: 02/05/2013 16:16:27 Click Position (Projected Coordinates) (X) 2213250.53 (Y) 232149.44 Map Proj: SC83F Acoustic Source File: C:\SonarWiz-Projects\Edisto\05FEB234-to-05FEB250.csf Ping Number: 11992 Range to Target: 23.32 US Feet Fish Height: 0.35 US Feet Heading: 65.700 degrees Event Number: 0 Line Name: 05FEB234-to-05FEB250
Dimensions Target Height: = 0 US Feet Target Length: 28 US Feet Target Shadow: 0 US Feet Target Width: 31 US Feet Mag Anomaly: Avoidance Area: Classification 1: Classification 2: Area: Block: Description: texture difference in parallel - matting??
SS-21 Sonar Time at Target: 02/06/2013 17:24:01 Click Position (Projected Coordinates) (X) 2213194.12 (Y) 229815.08 Map Proj: SC83F Acoustic Source File: C:\SonarWiz-Projects\Edisto2\06FEB417-to-06FEB434.csf Ping Number: 9006 Range to Target: 9.90 US Feet Fish Height: 0.41 US Feet Heading: 52.600 degrees Event Number: 0 Line Name: 06FEB417-to-06FEB434
Dimensions Target Height: = 0 US Feet Target Length: 24 US Feet Target Shadow: 0 US Feet Target Width: 0 US Feet Mag Anomaly: Avoidance Area: Classification 1: Classification 2: Area: Block: Description: teeny piece of cable??
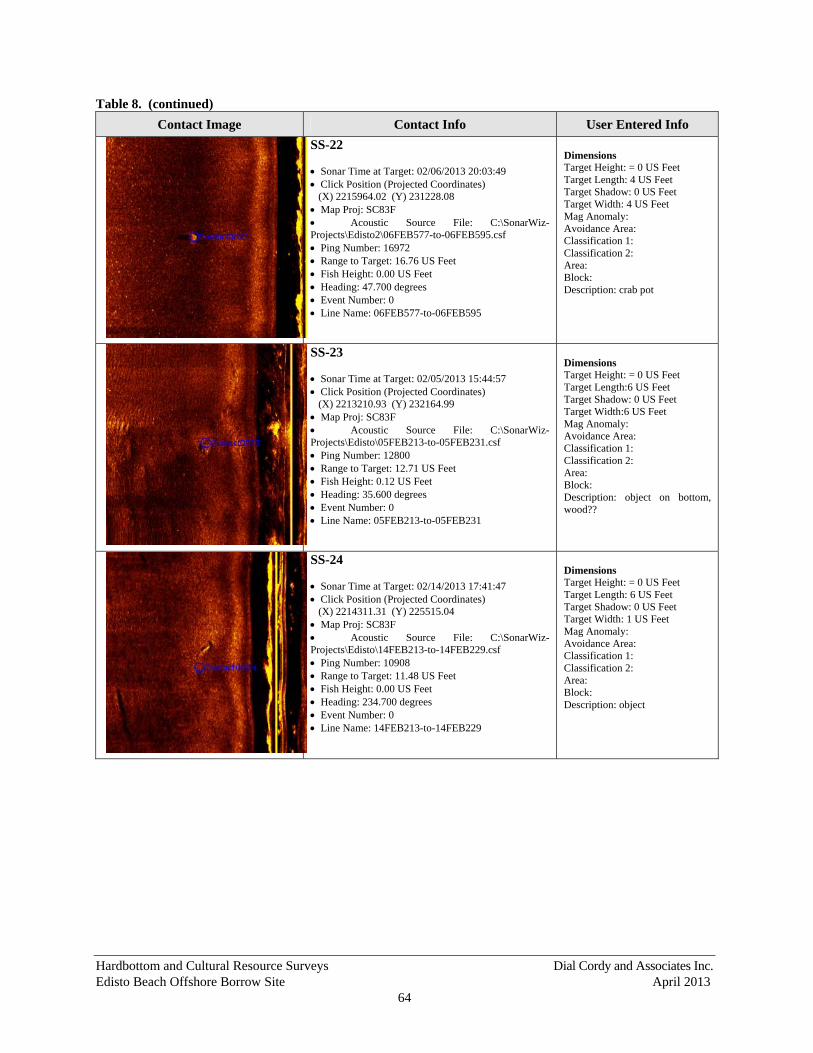
Hardbottom and Cultural Resource Surveys Dial Cordy and Associates Inc. Edisto Beach Offshore Borrow Site April 2013
64
Table 8. (continued)
Contact Image Contact Info User Entered Info
SS-22 Sonar Time at Target: 02/06/2013 20:03:49 Click Position (Projected Coordinates) (X) 2215964.02 (Y) 231228.08 Map Proj: SC83F Acoustic Source File: C:\SonarWiz-Projects\Edisto2\06FEB577-to-06FEB595.csf Ping Number: 16972 Range to Target: 16.76 US Feet Fish Height: 0.00 US Feet Heading: 47.700 degrees Event Number: 0 Line Name: 06FEB577-to-06FEB595
Dimensions Target Height: = 0 US Feet Target Length: 4 US Feet Target Shadow: 0 US Feet Target Width: 4 US Feet Mag Anomaly: Avoidance Area: Classification 1: Classification 2: Area: Block: Description: crab pot
SS-23 Sonar Time at Target: 02/05/2013 15:44:57 Click Position (Projected Coordinates) (X) 2213210.93 (Y) 232164.99 Map Proj: SC83F Acoustic Source File: C:\SonarWiz-Projects\Edisto\05FEB213-to-05FEB231.csf Ping Number: 12800 Range to Target: 12.71 US Feet Fish Height: 0.12 US Feet Heading: 35.600 degrees Event Number: 0 Line Name: 05FEB213-to-05FEB231
Dimensions Target Height: = 0 US Feet Target Length:6 US Feet Target Shadow: 0 US Feet Target Width:6 US Feet Mag Anomaly: Avoidance Area: Classification 1: Classification 2: Area: Block: Description: object on bottom, wood??
SS-24 Sonar Time at Target: 02/14/2013 17:41:47 Click Position (Projected Coordinates) (X) 2214311.31 (Y) 225515.04 Map Proj: SC83F Acoustic Source File: C:\SonarWiz-Projects\Edisto\14FEB213-to-14FEB229.csf Ping Number: 10908 Range to Target: 11.48 US Feet Fish Height: 0.00 US Feet Heading: 234.700 degrees Event Number: 0 Line Name: 14FEB213-to-14FEB229
Dimensions Target Height: = 0 US Feet Target Length: 6 US Feet Target Shadow: 0 US Feet Target Width: 1 US Feet Mag Anomaly: Avoidance Area: Classification 1: Classification 2: Area: Block: Description: object
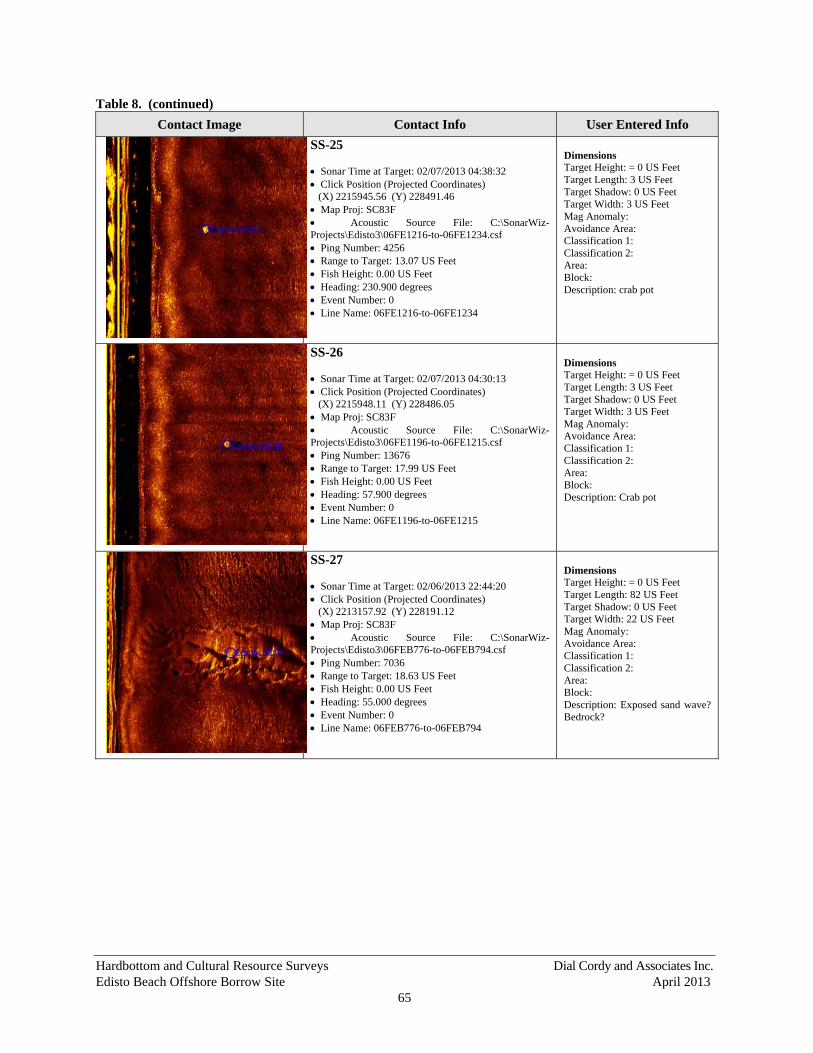
Hardbottom and Cultural Resource Surveys Dial Cordy and Associates Inc. Edisto Beach Offshore Borrow Site April 2013
65
Table 8. (continued)
Contact Image Contact Info User Entered Info
SS-25 Sonar Time at Target: 02/07/2013 04:38:32 Click Position (Projected Coordinates) (X) 2215945.56 (Y) 228491.46 Map Proj: SC83F Acoustic Source File: C:\SonarWiz-Projects\Edisto3\06FE1216-to-06FE1234.csf Ping Number: 4256 Range to Target: 13.07 US Feet Fish Height: 0.00 US Feet Heading: 230.900 degrees Event Number: 0 Line Name: 06FE1216-to-06FE1234
Dimensions Target Height: = 0 US Feet Target Length: 3 US Feet Target Shadow: 0 US Feet Target Width: 3 US Feet Mag Anomaly: Avoidance Area: Classification 1: Classification 2: Area: Block: Description: crab pot
SS-26 Sonar Time at Target: 02/07/2013 04:30:13 Click Position (Projected Coordinates) (X) 2215948.11 (Y) 228486.05 Map Proj: SC83F Acoustic Source File: C:\SonarWiz-Projects\Edisto3\06FE1196-to-06FE1215.csf Ping Number: 13676 Range to Target: 17.99 US Feet Fish Height: 0.00 US Feet Heading: 57.900 degrees Event Number: 0 Line Name: 06FE1196-to-06FE1215
Dimensions Target Height: = 0 US Feet Target Length: 3 US Feet Target Shadow: 0 US Feet Target Width: 3 US Feet Mag Anomaly: Avoidance Area: Classification 1: Classification 2: Area: Block: Description: Crab pot
SS-27 Sonar Time at Target: 02/06/2013 22:44:20 Click Position (Projected Coordinates) (X) 2213157.92 (Y) 228191.12 Map Proj: SC83F Acoustic Source File: C:\SonarWiz-Projects\Edisto3\06FEB776-to-06FEB794.csf Ping Number: 7036 Range to Target: 18.63 US Feet Fish Height: 0.00 US Feet Heading: 55.000 degrees Event Number: 0 Line Name: 06FEB776-to-06FEB794
Dimensions Target Height: = 0 US Feet Target Length: 82 US Feet Target Shadow: 0 US Feet Target Width: 22 US Feet Mag Anomaly: Avoidance Area: Classification 1: Classification 2: Area: Block: Description: Exposed sand wave? Bedrock?
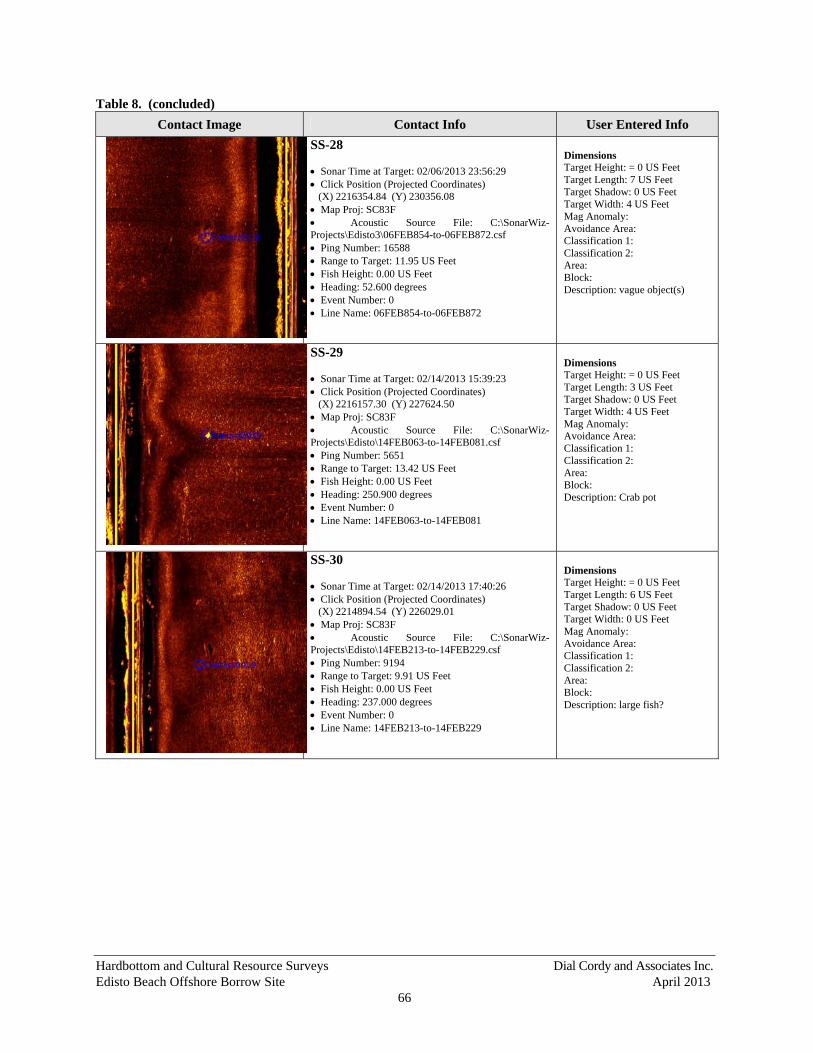
Hardbottom and Cultural Resource Surveys Dial Cordy and Associates Inc. Edisto Beach Offshore Borrow Site April 2013
66
Table 8. (concluded)
Contact Image Contact Info User Entered Info
SS-28 Sonar Time at Target: 02/06/2013 23:56:29 Click Position (Projected Coordinates) (X) 2216354.84 (Y) 230356.08 Map Proj: SC83F Acoustic Source File: C:\SonarWiz-Projects\Edisto3\06FEB854-to-06FEB872.csf Ping Number: 16588 Range to Target: 11.95 US Feet Fish Height: 0.00 US Feet Heading: 52.600 degrees Event Number: 0 Line Name: 06FEB854-to-06FEB872
Dimensions Target Height: = 0 US Feet Target Length: 7 US Feet Target Shadow: 0 US Feet Target Width: 4 US Feet Mag Anomaly: Avoidance Area: Classification 1: Classification 2: Area: Block: Description: vague object(s)
SS-29 Sonar Time at Target: 02/14/2013 15:39:23 Click Position (Projected Coordinates) (X) 2216157.30 (Y) 227624.50 Map Proj: SC83F Acoustic Source File: C:\SonarWiz-Projects\Edisto\14FEB063-to-14FEB081.csf Ping Number: 5651 Range to Target: 13.42 US Feet Fish Height: 0.00 US Feet Heading: 250.900 degrees Event Number: 0 Line Name: 14FEB063-to-14FEB081
Dimensions Target Height: = 0 US Feet Target Length: 3 US Feet Target Shadow: 0 US Feet Target Width: 4 US Feet Mag Anomaly: Avoidance Area: Classification 1: Classification 2: Area: Block: Description: Crab pot
SS-30 Sonar Time at Target: 02/14/2013 17:40:26 Click Position (Projected Coordinates) (X) 2214894.54 (Y) 226029.01 Map Proj: SC83F Acoustic Source File: C:\SonarWiz-Projects\Edisto\14FEB213-to-14FEB229.csf Ping Number: 9194 Range to Target: 9.91 US Feet Fish Height: 0.00 US Feet Heading: 237.000 degrees Event Number: 0 Line Name: 14FEB213-to-14FEB229
Dimensions Target Height: = 0 US Feet Target Length: 6 US Feet Target Shadow: 0 US Feet Target Width: 0 US Feet Mag Anomaly: Avoidance Area: Classification 1: Classification 2: Area: Block: Description: large fish?
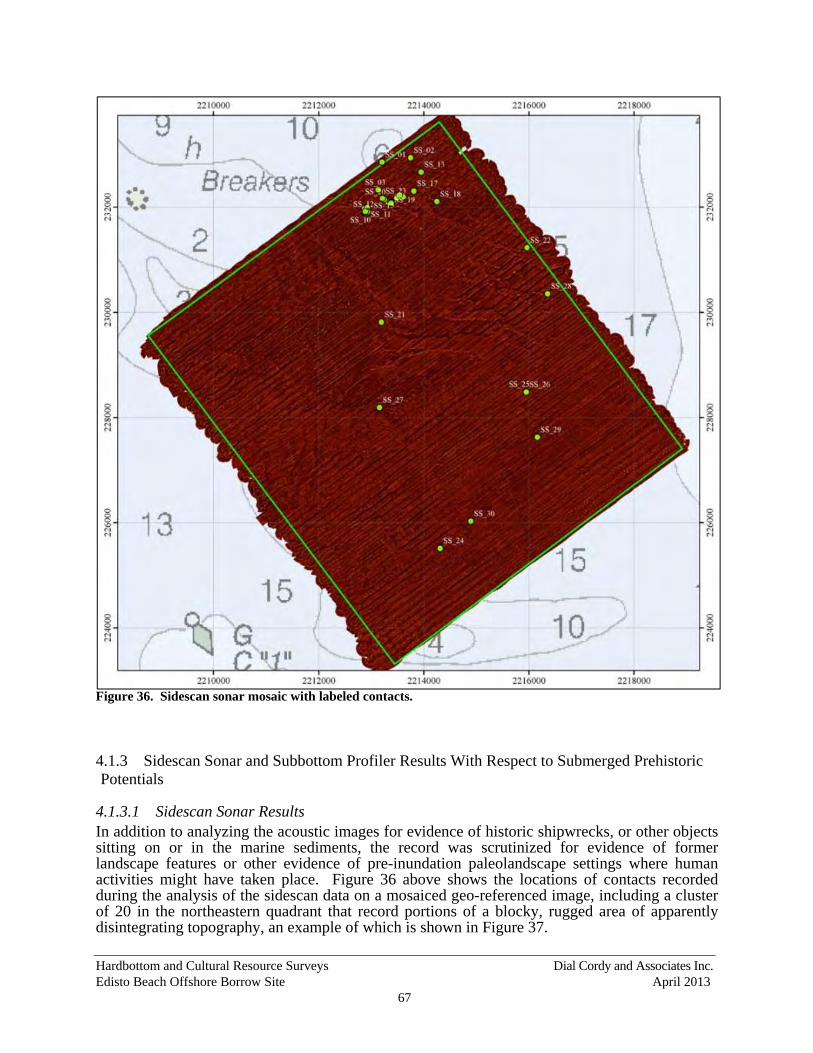
Hardbottom and Cultural Resource Surveys Dial Cordy and Associates Inc. Edisto Beach Offshore Borrow Site April 2013
67
Figure 36. Sidescan sonar mosaic with labeled contacts.
4.1.3 Sidescan Sonar and Subbottom Profiler Results With Respect to Submerged Prehistoric Potentials
4.1.3.1 Sidescan Sonar Results In addition to analyzing the acoustic images for evidence of historic shipwrecks, or other objects sitting on or in the marine sediments, the record was scrutinized for evidence of former landscape features or other evidence of pre-inundation paleolandscape settings where human activities might have taken place. Figure 36 above shows the locations of contacts recorded during the analysis of the sidescan data on a mosaiced geo-referenced image, including a cluster of 20 in the northeastern quadrant that record portions of a blocky, rugged area of apparently disintegrating topography, an example of which is shown in Figure 37.
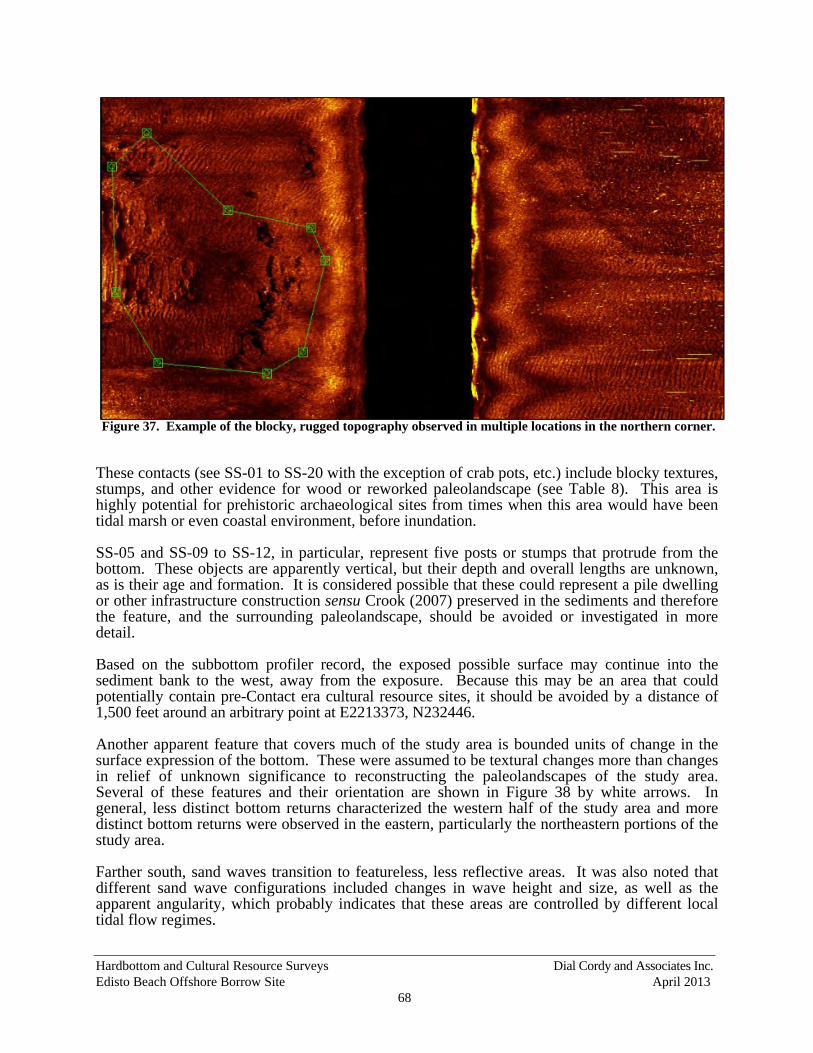
Hardbottom and Cultural Resource Surveys Dial Cordy and Associates Inc. Edisto Beach Offshore Borrow Site April 2013
68
Figure 37. Example of the blocky, rugged topography observed in multiple locations in the northern corner.
These contacts (see SS-01 to SS-20 with the exception of crab pots, etc.) include blocky textures, stumps, and other evidence for wood or reworked paleolandscape (see Table 8). This area is highly potential for prehistoric archaeological sites from times when this area would have been tidal marsh or even coastal environment, before inundation. SS-05 and SS-09 to SS-12, in particular, represent five posts or stumps that protrude from the bottom. These objects are apparently vertical, but their depth and overall lengths are unknown, as is their age and formation. It is considered possible that these could represent a pile dwelling or other infrastructure construction sensu Crook (2007) preserved in the sediments and therefore the feature, and the surrounding paleolandscape, should be avoided or investigated in more detail. Based on the subbottom profiler record, the exposed possible surface may continue into the sediment bank to the west, away from the exposure. Because this may be an area that could potentially contain pre-Contact era cultural resource sites, it should be avoided by a distance of 1,500 feet around an arbitrary point at E2213373, N232446. Another apparent feature that covers much of the study area is bounded units of change in the surface expression of the bottom. These were assumed to be textural changes more than changes in relief of unknown significance to reconstructing the paleolandscapes of the study area. Several of these features and their orientation are shown in Figure 38 by white arrows. In general, less distinct bottom returns characterized the western half of the study area and more distinct bottom returns were observed in the eastern, particularly the northeastern portions of the study area. Farther south, sand waves transition to featureless, less reflective areas. It was also noted that different sand wave configurations included changes in wave height and size, as well as the apparent angularity, which probably indicates that these areas are controlled by different local tidal flow regimes.
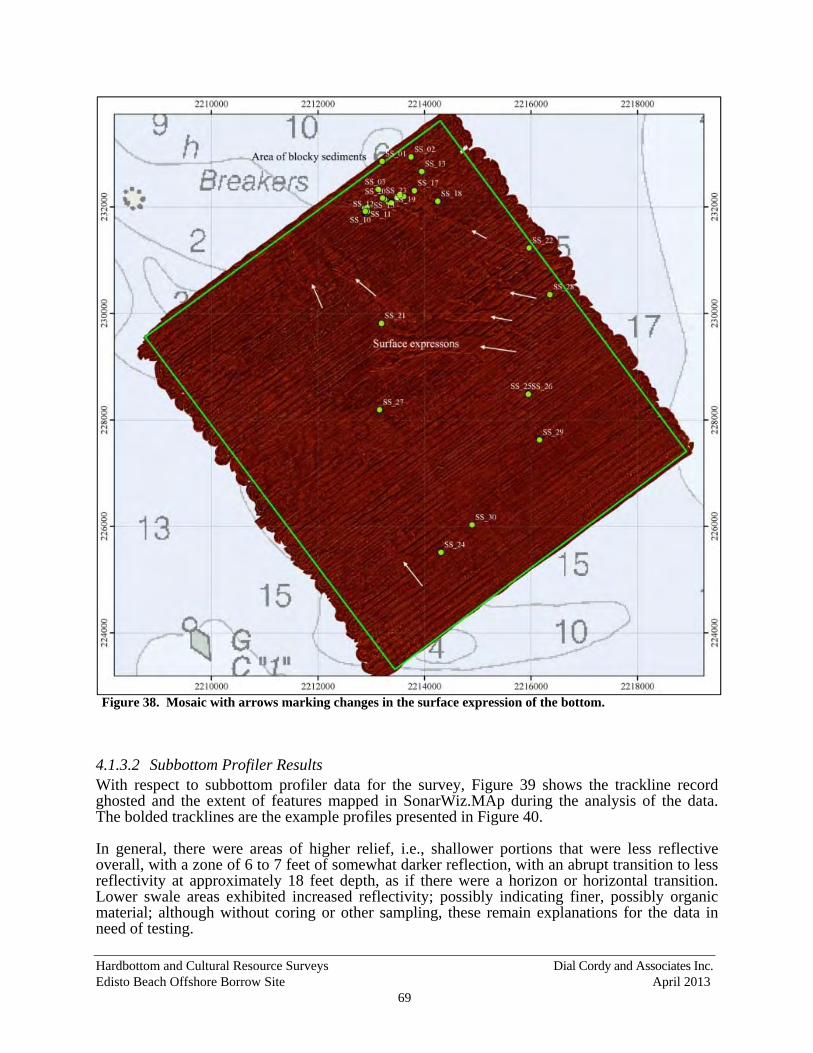
Hardbottom and Cultural Resource Surveys Dial Cordy and Associates Inc. Edisto Beach Offshore Borrow Site April 2013
69
Figure 38. Mosaic with arrows marking changes in the surface expression of the bottom.
4.1.3.2 Subbottom Profiler Results With respect to subbottom profiler data for the survey, Figure 39 shows the trackline record ghosted and the extent of features mapped in SonarWiz.MAp during the analysis of the data. The bolded tracklines are the example profiles presented in Figure 40. In general, there were areas of higher relief, i.e., shallower portions that were less reflective overall, with a zone of 6 to 7 feet of somewhat darker reflection, with an abrupt transition to less reflectivity at approximately 18 feet depth, as if there were a horizon or horizontal transition. Lower swale areas exhibited increased reflectivity; possibly indicating finer, possibly organic material; although without coring or other sampling, these remain explanations for the data in need of testing.
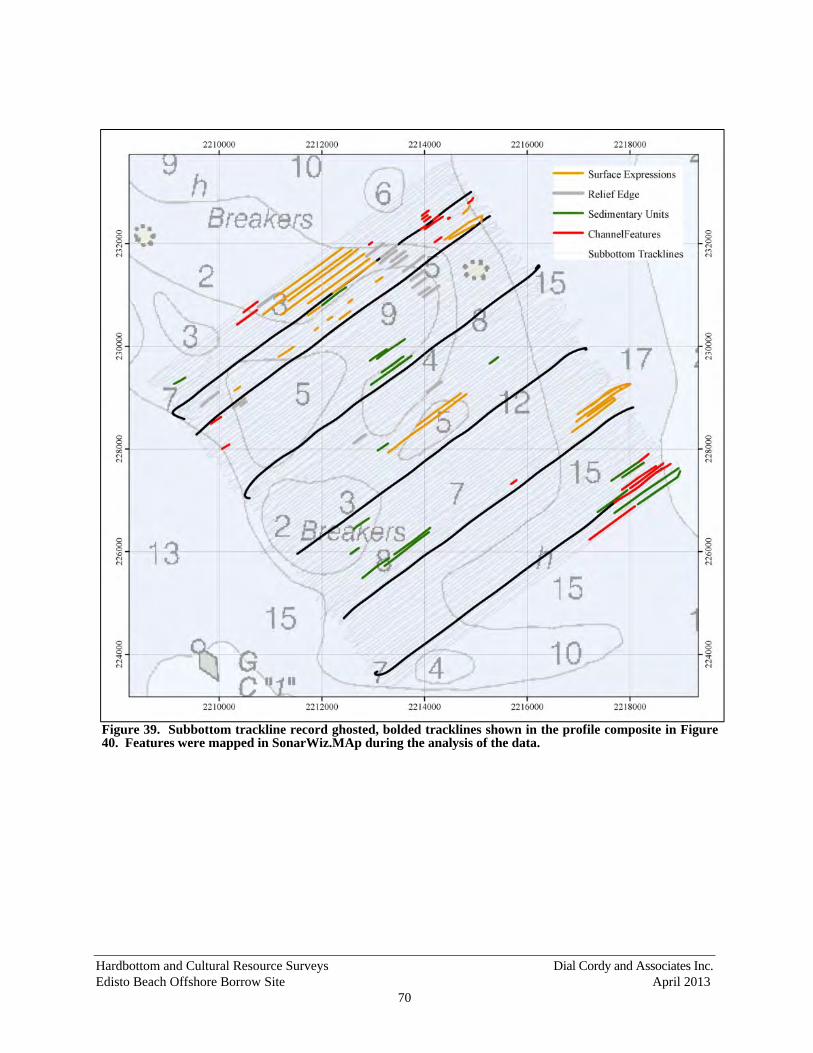
Hardbottom and Cultural Resource Surveys Dial Cordy and Associates Inc. Edisto Beach Offshore Borrow Site April 2013
70
Figure 39. Subbottom trackline record ghosted, bolded tracklines shown in the profile composite in Figure 40. Features were mapped in SonarWiz.MAp during the analysis of the data.
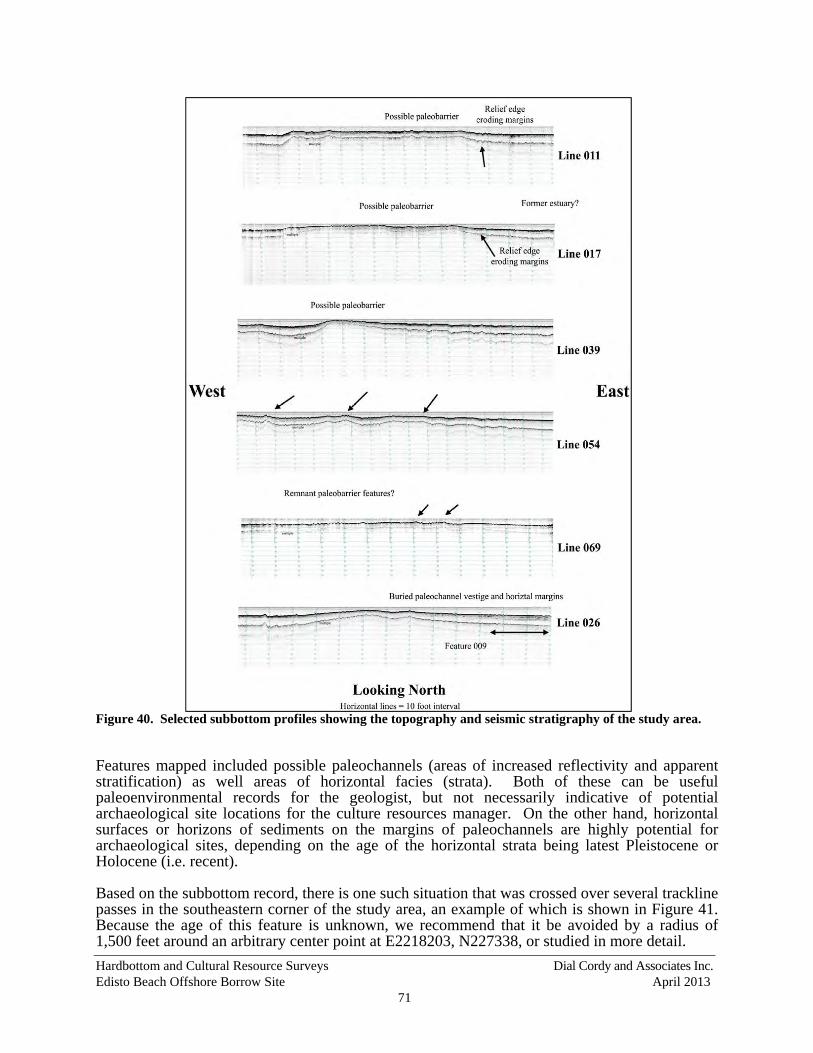
Hardbottom and Cultural Resource Surveys Dial Cordy and Associates Inc. Edisto Beach Offshore Borrow Site April 2013
71
Figure 40. Selected subbottom profiles showing the topography and seismic stratigraphy of the study area. Features mapped included possible paleochannels (areas of increased reflectivity and apparent stratification) as well areas of horizontal facies (strata). Both of these can be useful paleoenvironmental records for the geologist, but not necessarily indicative of potential archaeological site locations for the culture resources manager. On the other hand, horizontal surfaces or horizons of sediments on the margins of paleochannels are highly potential for archaeological sites, depending on the age of the horizontal strata being latest Pleistocene or Holocene (i.e. recent). Based on the subbottom record, there is one such situation that was crossed over several trackline passes in the southeastern corner of the study area, an example of which is shown in Figure 41. Because the age of this feature is unknown, we recommend that it be avoided by a radius of 1,500 feet around an arbitrary center point at E2218203, N227338, or studied in more detail.
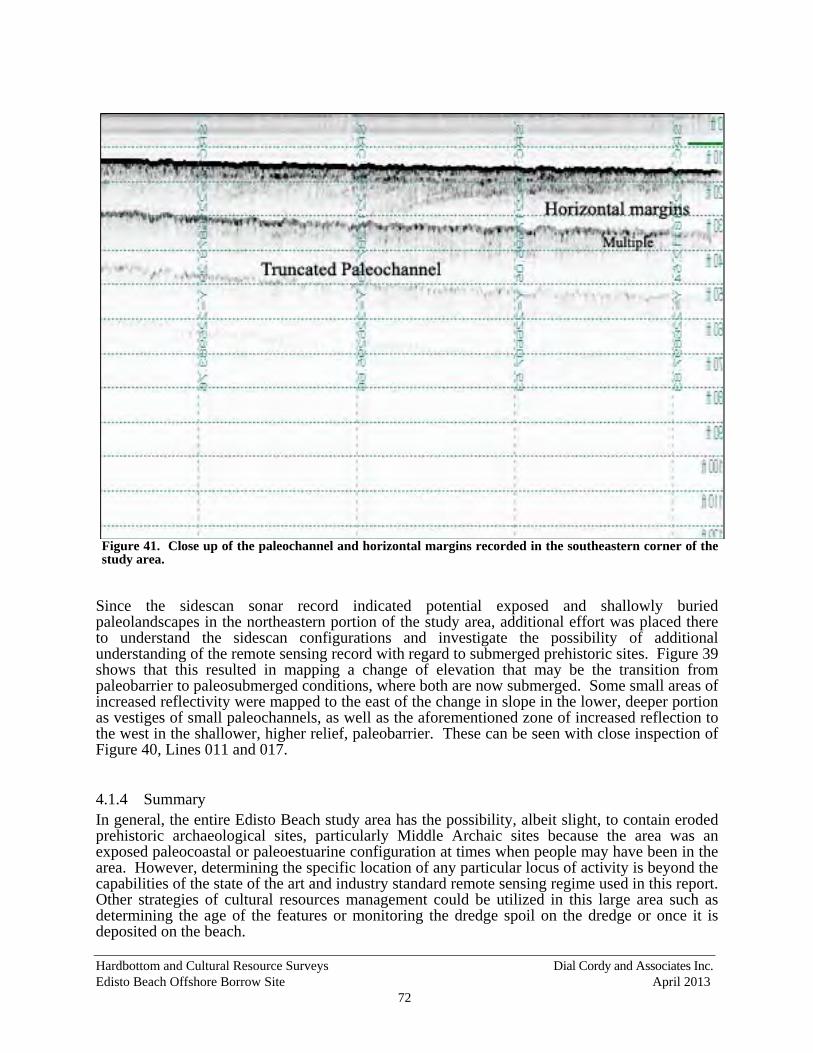
Hardbottom and Cultural Resource Surveys Dial Cordy and Associates Inc. Edisto Beach Offshore Borrow Site April 2013
72
Figure 41. Close up of the paleochannel and horizontal margins recorded in the southeastern corner of the study area.
Since the sidescan sonar record indicated potential exposed and shallowly buried paleolandscapes in the northeastern portion of the study area, additional effort was placed there to understand the sidescan configurations and investigate the possibility of additional understanding of the remote sensing record with regard to submerged prehistoric sites. Figure 39 shows that this resulted in mapping a change of elevation that may be the transition from paleobarrier to paleosubmerged conditions, where both are now submerged. Some small areas of increased reflectivity were mapped to the east of the change in slope in the lower, deeper portion as vestiges of small paleochannels, as well as the aforementioned zone of increased reflection to the west in the shallower, higher relief, paleobarrier. These can be seen with close inspection of Figure 40, Lines 011 and 017.
4.1.4 Summary In general, the entire Edisto Beach study area has the possibility, albeit slight, to contain eroded prehistoric archaeological sites, particularly Middle Archaic sites because the area was an exposed paleocoastal or paleoestuarine configuration at times when people may have been in the area. However, determining the specific location of any particular locus of activity is beyond the capabilities of the state of the art and industry standard remote sensing regime used in this report. Other strategies of cultural resources management could be utilized in this large area such as determining the age of the features or monitoring the dredge spoil on the dredge or once it is deposited on the beach.
Hardbottom and Cultural Resource Surveys Dial Cordy and Associates Inc. Edisto Beach Offshore Borrow Site April 2013
73
On the other hand, there are two areas of potential paleolandscape settings that should be avoided or studied in greater detail. One area includes an exposed paleolandscape with multiple logs (or stumps) that has one feature of possible upright posts indicating a possible shallowly buried structure (Crook 2007) in the northeastern quadrant of the study area, as indicated by the sidescan sonar data. Subbottom profiler data indicate that the exposed and shallowly buried landscape sediments may continue into the inferred paleobarrier sediments to the west, away from the exposed portions. Because this may contain potentially eligible pre-Contact cultural resources, it should be avoided by a distance of 1,500 feet around an arbitrary point at E2213373, N232446 (Figure 42). The second area, based on the subbottom record, is a buried paleochannel feature with horizontal margins within the study area at the far southeastern corner. Because the age of this feature is unknown, we recommend that it should be avoided by a radius of 1,500 feet around an arbitrary center point at E2218203, N227338, or studied in more detail (see Figure 42).
4.2 Hardbottom Resources Review of existing data sources for the Edisto borrow area survey included the South Carolina Department of Natural Resources, NOAA Digital Coast, and the U.S. Navy (Atlantic GIS data set). All data sources consisted of the same Southeast Area Monitoring and Assessment Program (SEAMAP) coverage, which was supplemented by U.S. Navy-Atlantic GIS artificial reef and shipwreck location data. The SEAMAP project began in 1985 and was finalized in 2001 with the goal of classifying the coastal ocean bottom along the Southeastern U.S. (North Carolina to Florida) out to a 200-meter depth. The SEAMAP data were structured into one-minute latitude by one-minute longitude grid cells, where each cell was ultimately determined to represent hardbottom, possible hardbottom, or not hardbottom habitat. Over 65,000 data records (scientific diver observations, video and still camera, dredge data, and sidescan data) were analyzed and integrated to develop the SEAMAP bottom mapping classifications (Van Dolah et al. 1994:46). Based on review of this information, there are no known documented hardbottom occurrences within the proximity of the survey area. All sidescan records were reviewed by our remote sensing analyst who is experienced in identifying hardbottom signatures. Based on the background research, sidescan survey performed, and interpretation of the survey records, no hardbottom habitat is likely to occur within the defined survey area. National Marine Fisheries Service (NMFS) review and concurrence on these findings is required for compliance with the Magnuson-Stevens Fisheries Conservation and Management Act. Since no hardbottom signatures were identified from sidescan records, the USACE has determined that implementation of Phase 2 of the SOW (towed video and habitat characterization) is not required.
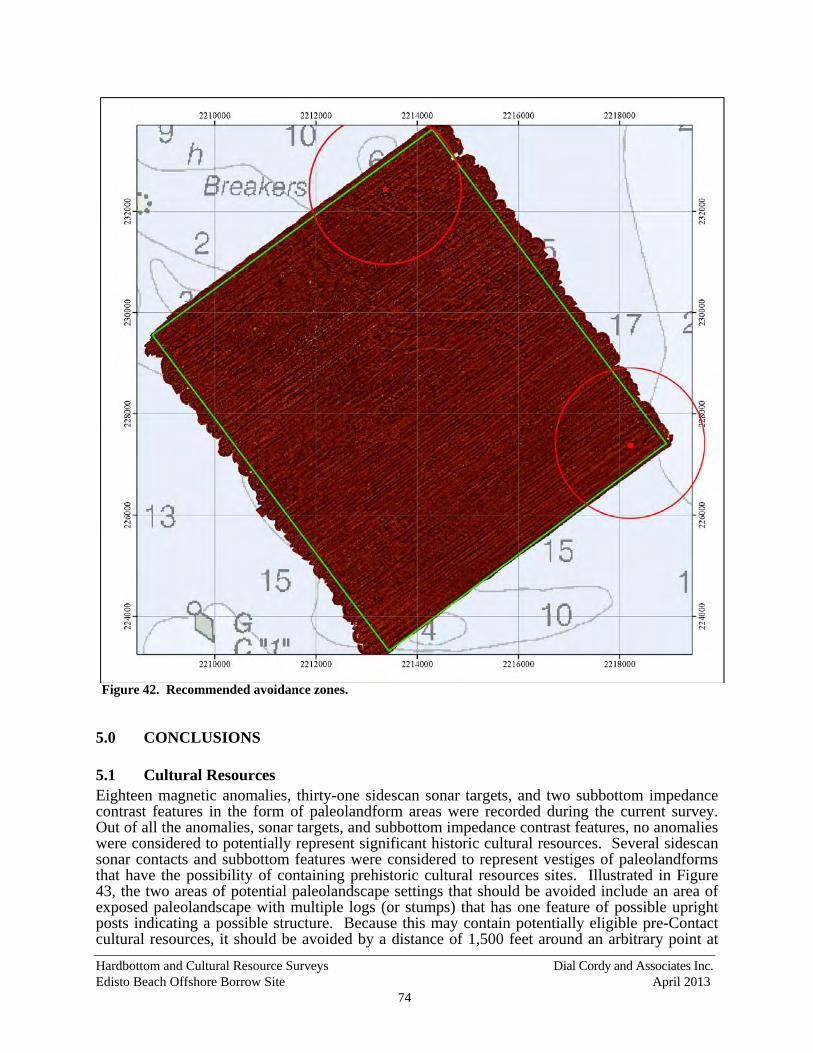
Hardbottom and Cultural Resource Surveys Dial Cordy and Associates Inc. Edisto Beach Offshore Borrow Site April 2013
74
Figure 42. Recommended avoidance zones.
5.0 CONCLUSIONS
5.1 Cultural Resources Eighteen magnetic anomalies, thirty-one sidescan sonar targets, and two subbottom impedance contrast features in the form of paleolandform areas were recorded during the current survey. Out of all the anomalies, sonar targets, and subbottom impedance contrast features, no anomalies were considered to potentially represent significant historic cultural resources. Several sidescan sonar contacts and subbottom features were considered to represent vestiges of paleolandforms that have the possibility of containing prehistoric cultural resources sites. Illustrated in Figure 43, the two areas of potential paleolandscape settings that should be avoided include an area of exposed paleolandscape with multiple logs (or stumps) that has one feature of possible upright posts indicating a possible structure. Because this may contain potentially eligible pre-Contact cultural resources, it should be avoided by a distance of 1,500 feet around an arbitrary point at
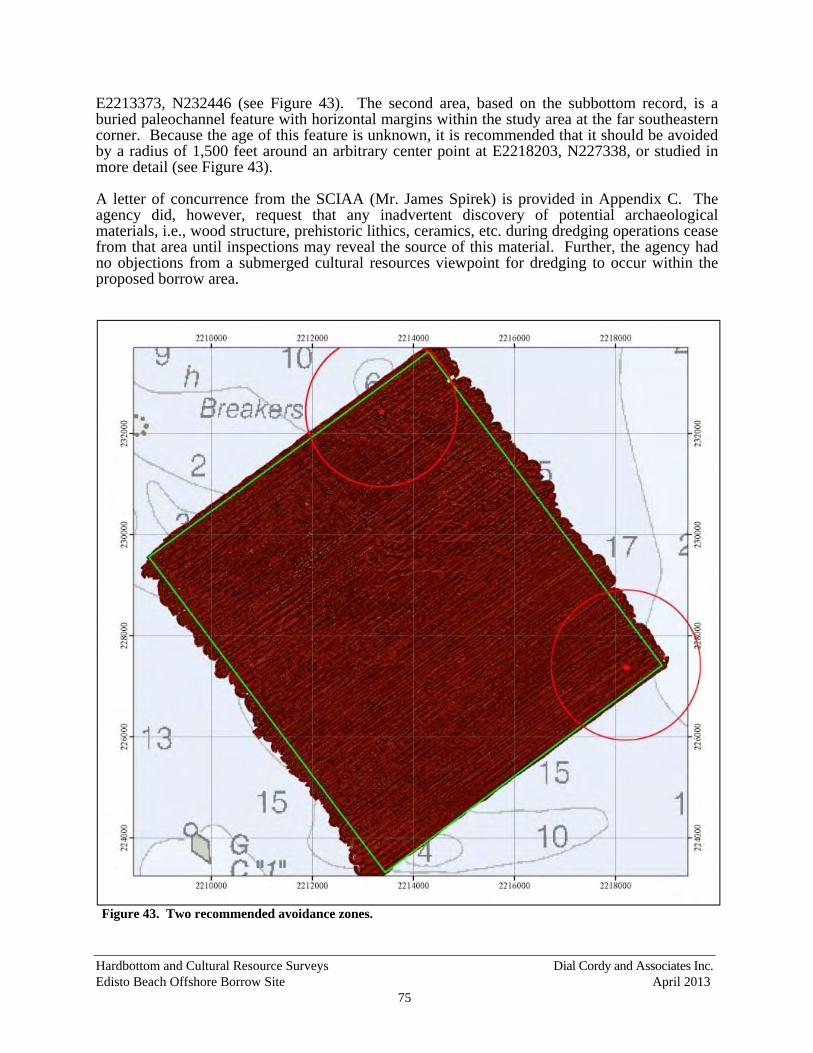
Hardbottom and Cultural Resource Surveys Dial Cordy and Associates Inc. Edisto Beach Offshore Borrow Site April 2013
75
E2213373, N232446 (see Figure 43). The second area, based on the subbottom record, is a buried paleochannel feature with horizontal margins within the study area at the far southeastern corner. Because the age of this feature is unknown, it is recommended that it should be avoided by a radius of 1,500 feet around an arbitrary center point at E2218203, N227338, or studied in more detail (see Figure 43). A letter of concurrence from the SCIAA (Mr. James Spirek) is provided in Appendix C. The agency did, however, request that any inadvertent discovery of potential archaeological materials, i.e., wood structure, prehistoric lithics, ceramics, etc. during dredging operations cease from that area until inspections may reveal the source of this material. Further, the agency had no objections from a submerged cultural resources viewpoint for dredging to occur within the proposed borrow area.
Figure 43. Two recommended avoidance zones.
Hardbottom and Cultural Resource Surveys Dial Cordy and Associates Inc. Edisto Beach Offshore Borrow Site April 2013
76
5.2 Hardbottom Resources
Based on review of available marine resource GIS data sources and review of the collected sidescan records, there is not likely to be any hardbottom habitat within the borrow site survey area. No further investigation is deemed necessary. Review and concurrence with the NMFS (Pace Wilber) is required to conclude consultation on this Essential Fish Habitat resource type.
6.0 REFERENCES
Anderson, David G., R. Jerald Ledbetter, and Lisa O’Steen 1990 Paleoindian Period Archaeology of Georgia. University of Georgia Laboratory of
Archaeology Series Report 28. Anderson, David G., Lisa D. O’Steen, and Kenneth E. Sassaman 1996 Environmental and Chronological Considerations. In The Paleoindian and Early
Archaic Southeast, edited by David G. Anderson and Kenneth E. Sassaman, pp. 3-15. The University of Alabama Press. Tuscaloosa.
Baldwin, Wayne E., Robert A Morton, Thomas R. Putney, Michael P. Katuna, M. Schott Harris,
Paul T. Gayes, Neal W. Driscoll, Jane F. Denny, and William C. Schwab 2006 Migration of the Pee Dee River System inferred from ancestral paleochannels
underlying the South Carolina Grand Strand and Long Bay inner shelf. Geological Society of America Bulletin 118(5-6):533-549.
Balsillie, James and J.F. Donoghue 2004 High Resolution Sea Level History for the Gulf of Mexico Since the Last Glacial
Maximum. Florida Geological Survey, Report of Investigations #103. Website available at http://www.dep.state.fl.us/geology/publications/ri/ri103.pdf.
Black, Robert C., III 1958 A History of Fort Wadsworth, New York Harbor. Cultural Resources Management
Study #7. Submitted to the Division of Cultural Resources, North Atlantic Regional Office, National Park Service, U.S. Department of the Interior.
Blanchon, Paul 2011 Meltwater Pulses. In Encyclopedia of Modern Coral Reefs: Structure, form and
process., edited by D. Hopley, pp. 683-690. vol. Earth Science Series. Springer-Verlag
Blanchon, Paul and John Shaw 1995 Reef drowning during the last deglaciation: Evidence for catastrophic sea-level rise
and ice-sheet collapse. Geology 23(1):4-8. Booth, Robert K. and Fredrick J. Rich 1999 Identification and Paleoecological Impliations of a Late Pleistocene Pteridophyte-
dominated Assemblage Preserved in Brown Peat from St. Catherines Island, Georgia. Castanea 64(2):120-129.
Braley, Chad O., Roy R. Doyon, and J. Mark Williams 1985 The Archaeological Confirmation of Fort Argyle (9Bry28), Bryan County, Georgia.
Southeastern Archaeological Services, Inc., Athens, Georgia.
Hardbottom and Cultural Resource Surveys Dial Cordy and Associates Inc. Edisto Beach Offshore Borrow Site April 2013
77
Breiner, S. 1973 Applications Manual to Portable Magnetometers. Geometrics, Inc. (available at
geometrics.com). Buchner, C. Andrew and Michael Krivor 2001 Cultural Resources Reconnaissance Study of the White River Navigation Project.
Prepared for the USACE, Memphis District by Panamerican Consultants, Inc. Butler, Carroll B. 1998 Treasures of the Long Leaf Pine: Naval Stores. Tarkel Publishing. Shalimar,
Florida. Chapman, Jefferson 1985 Archaeology and the Archaic Period in the Southern Ridge-and-Valley Province. In
Structure and Process in Southeastern Archaeology, edited by Roy S. Dickens, Jr. and H. Trawick Ward, pp. 137-153. The University of Alabama Press. Tuscaloosa.
Clifton, James M. 1978 Life and Labor on Argyle Island. The Beehive Press, Savannah. Coker, P.C., III 1987 Charleston’s Maritime Heritage 1670-1865. Coker Craft Press Charleston, South
Carolina. Coleman, Kenneth 1991 A History of Georgia. 2nd edition. University of Georgia Press. Athens. Colquhoun, D.J. and M.J. Brooks 1986 New Evidence from the Southeastern U.S. for Eustatic Components in the Late
Holocene Sea Levels. Geoarchaeology 1(3):275-291. Colquhoun, Donald J., Mark J. Brooks and Peter A. Stone 1995 Sea-Level Fluctuation: Emphasis on Temporal Correlations with Records from Areas
with Strong Hydrologic Influences in the Southeastern United States. Journal of Coastal Research (ArticleType: research-article / Issue Title: Special Issue No. 17. HOLOCENE CYCLES: CLIMATE, SEA LEVELS, AND SEDIMENTATION / Full publication date: 1995 / Copyright © 1995 Coastal Education & Research Foundation, Inc.):191-196.
Cordingly, David 1995 Under the Black Flag: The Romance and the Reality of Life Among the Pirates.
Random House, New York. Crook, Morgan R Jr. 2007 Prehistoric Pile Dwellers within an Emergent Ecosystem: An Archaeological Case of
Hunters and Gatherers at the Mouth of the Savannah River During the Mid-Holocene. Human Ecology 35:223-237.
DePratter, Chester B. and James D. Howard 1981 Evidence for a sea level lowstand between 4500 and 2400 years B.P. on the southeast
coast of the United States. Journal of Sedimentary Research 51(4):1287-1295.
Hardbottom and Cultural Resource Surveys Dial Cordy and Associates Inc. Edisto Beach Offshore Borrow Site April 2013
78
Divine, Robert A., T.H. Breen, George M. Fredrickson, and R. Hal Williams 1995 America Past and Present, Volume 1, 4th edition. HarperCollins Publishers. New
York. Duff, Jim A. 1996 Underwater Archaeological Investigation and Documentation of Three Anomaly
Clusters Within Three Segments of Proposed Preferred Corridor for Replacement of Bonner Bridge, Oregon Inlet, North Carolina. Panamerican Consultants, Inc.,
Memphis, Tennessee, under subcontract to Parsons, Brinckerhoff, Quade & Douglas,
Inc., Morrisville, North Carolina. Submitted to the Federal Highway Administration and the North Carolina Department of Transportation.
Dunbar, James S. 2006 Paleoindian Archaeology. In First Floridians and Last Mastodons: The Page-Ladson
Site in the Aucilla River, edited by David S. Webb, pp. 403-435. Springer, Dordrecht. Dunbar, James S. and S. David Webb 1996 Bone and Ivory Tools from Submerged Paleoindian Sites in Florida. In The
Paleoindian and Early Archaic Southeast, edited by David G. Anderson and Kenneth E. Sassaman, pp. 331-353. The University of Alabama Press. Tuscaloosa.
Edgar, Walter 1998 South Carolina: A History. University of South Carolina Press. Columbia, South
Carolina. Elliott, Daniel T. and Kenneth E. Sassaman 1995 Archaic Period Archaeology on the Georgia Coastal Plain and Coastal Zone.
University of Georgia, Laboratory of Archaeology Series Report 35. Athens. Emiliani, C., S. Gartner, B. Lidz, K. Eldridge, D.K. Elvey, P.C. Huang, J.J. Stipp and M.
Swanson 1975 Paleoclimatological analysis of late Quaternary cores from the northwestern Gulf of
Mexico. Science 189:1083-1088. Faught, Michael K., Ph.D. 1996 Clovis Origins and Underwater Prehistoric Archaeology in Northwestern Florida,
Ph.D. Dissertation University of Arizona, Tucson. 2002-04 Submerged Paleoindian and Archaic sites of the Big Bend, Florida. Journal of
Field Archaeology 29(3-4):273-290. Faught, M.K., and J.F. Donoghue 1997 Marine Inundated Archaeological Sites and Paleofluvial Systems: Examples From a
Karst-Controlled Continental Shelf Setting in Apalachee Bay. Geoarchaeology 12(5):417-458.
Fischer, Anders 1995 Man & Sea in the Mesolithic: Coastal Settlement Above and Below Present Sea Level
53. Oxbow Monograph.
Hardbottom and Cultural Resource Surveys Dial Cordy and Associates Inc. Edisto Beach Offshore Borrow Site April 2013
79
Gagliano, S.M., C.E. Pearson, R.A. Weinstein, D.E. Wiseman and C.M. McClendon 1982 Sedimentary Studies of Prehistoric Archaeological Sites: Criteria for the
Identification of Submerged Archaeological. Sites of the Northern GOM Continental Shelf, Prepared for the U.S. Department of the Interior National Park Service, Division of State Plans and Grants, Contract No. C35003(79).
Garrison, E., C.P. Giammona, F.J. Kelly, A.R. Trip, and G.A. Wolff 1989 Historic Shipwrecks and Magnetic Anomalies of the Northern Gulf of Mexico:
Reevaluation of Archaeological Resource Management Zone 1. Volume II: Technical Narrative. OCS Study/MMS 89-0024. U.S. Department of the Interior, Minerals Management Service, Gulf of Mexico OCS Regional Office, New Orleans.
Garrison, E.G., G. McFall and S. E. Noakes 2008 Shallow Marine Margin Sediments, Modern Marine Erosion and the Fate of Sequence
Boundaries–Georgia Bight (USA). Southeastern Geology 45:127–142. Garrison, Ervan G. and James S. Tribble 1981 A Reconnaissance Survey of the Atlantic Intracoastal Waterway, Georgia. Prepared
for the U.S. Army Corps of Engineers, Savannah District. Prepared by Texas A&M University.
Garrison, Ervin and Others 2012 Inventory and analysis of archaeological site occurrence on the Atlantic outer
continental shelf. U.S. Dept. of the Interior, Bureau of Ocean Energy, Gulf of Mexico OCS Region, New Orleans, LA. OCS Study BOEM 2012-008. Prepared by TRC Corporation.
Gayes, Paul T., David B. Scott, Eric S. Collins and Douglas D. Nelson 1992 A Late Holocene Sea-Level Fluctuation In South Carolina. In Quaternary Coasts of
the United States, edited by C.H. Fletcher and J.F. Wehmiller, pp. 155-160. vol. 48. Society for Sedimentary Geology.
Gearhart, R.L., and S.A. Hoyt 1990 Channel to Liberty: Underwater Archaeological Investigations, Liberty County,
Texas. Espey, Huston & Associates, Austin, Texas. Submitted to the U.S. Army Corps of Engineers, Galveston District.
Ginn, Edwin H. 1987 Recollections of Glynn. The Glover Printing Company, Brunswick, Georgia. Goodyear, Albert C., III, James L. Michie, and Tommy Charles 1989 The Earliest South Carolinians. In Studies in South Carolina Archaeology: Essays in
Honor of Robert L. Stephenson, edited by Albert C. Goodyear, III and Glen T. Hanson, pp. 19-52. Anthropological Studies 9, Occasional Papers of the South Carolina Institute of Archaeology and Anthropology, The University of South Carolina. Columbia.
Hall, Wes 2005 Archaeological Remote Sensing Survey of Folly Beach Offshore Borrow Areas, Folly
Beach, South Carolina. Prepared for the Department of the Army, Wilmington District, Corps of Engineers by Mid-Atlantic Technology and Environmental Research, Inc. Castle Hayne, North Carolina.
Hardbottom and Cultural Resource Surveys Dial Cordy and Associates Inc. Edisto Beach Offshore Borrow Site April 2013
80
2007 Archaeological Remote Sensing Survey of Pawleys Island Offshore Borrow Areas, Pawleys Island, South Carolina. Prepared for the Department of the Army, Wilmington District, Corps of Engineers by Mid-Atlantic Technology and Environmental Research, Inc. Castle Hayne, North Carolina.
Harris, M. Schott, Paul T. Gayes, Jack L. Kindinger, James G. Flocks, David E. Krantz, and
Patricia Donovan 2005 Quaternary Geomorphology and Modern Coastal Development in Response to an
Inherent Geologic Framework: An Example from Charleston, South Carolina. Journal of Coastal Research 21(1):49-64.
Haunton, R.H. 1968 Savannah in the 1850s. Ph.D. dissertation. University Microfilms, Ann Arbor,
Michigan. Hedrick, David Layne 1998 “The Investigation Of The Caney Creek Shipwreck Archaeological Site 41MG32.”
Unpublished Master’s Thesis, Department of Anthropology, Texas A&M University. On file at Panamerican Maritime, L.L.C., Memphis, Tennessee.
Hoyt, Steven D. 1990 National Register Assessment of the SS Mary, Port Aransas, Nueces County, Texas.
Espey, Huston & Associates, Austin, Texas. Submitted to the U.S. Army Corps of Engineers, Galveston District.
Irion, J.B., and C.L. Bond 1984 Identification and Evaluation of Submerged Anomalies, Mobile Harbor, Alabama.
Espey, Huston & Associates, Austin, Texas. Submitted to the U.S. Army Corps of Engineers, Mobile District.
James, Jr., Stephen R., Michael K. Faught, and Andrew D.W. Lydecker 2012 Remote Sensing Survey and Diver Investigations Atlantic Intracoastal Waterway
Chatham, Bryan, Liberty, McIntosh, Glynn, and Camden Counties, Georgia, and Portions of Beaufort County, South Carolina. Draft prepared for U.S. Army Corps of Engineers, Savannah District under contract to DCA/GEC A Joint Venture, LLC, Jacksonville Beach, Florida. Draft submitted by Panamerican Consultants, Inc., Memphis, Tennessee.
James, Stephen R., Jr., Michael C. Krivor, Alan Whitehead, Kristen Zoelmer and Michael C.
Tuttle 2002 National Register of Historic Places Eligibility Evaluations of Targets 3B-2-2 and
3B-2-6 Located Within Item 3B-2 of the Upper Yazoo Projects and Limited Survey and National Register of Historic Places Eligibility Evaluations of All Bridges, Structures, and Targets 4-6, 4-7, 4-11, 4-12, 4-15, and 4-16 Located Within Item 4B of the Upper Yazoo Projects, Leflore County, Mississippi. Submitted to the USACE, Vicksburg District by Panamerican Consultants, Inc., Memphis, Tennessee.
James, Stephen R., Jr., and Michael C. Krivor 2000 Submerged Cultural Resources Associated with the Battle of Johnsonville: The 2000
Season. Prepared for the Tennessee Historical Commission by Panamerican Consultants, Inc., Memphis, Tennessee.
Hardbottom and Cultural Resource Surveys Dial Cordy and Associates Inc. Edisto Beach Offshore Borrow Site April 2013
81
James, Stephen R., Jr., and Charles E. Pearson 1991 Magnetometer Survey and Ground Truthing Anomalies, Corpus Christi Ship
Channel, Aransas and Nueces Counties, Texas. Coastal Environments, Inc., Baton Rouge, Louisiana. Submitted to the U.S. Army Corps of Engineers, Galveston District.
1993 Submerged Cultural Resources Investigations of the Steamboat J.D. Hinde (41LB85)
Channel to Liberty, Liberty County Texas. Prepared for the U. S. Army Corps of Engineers, Galveston District by Panamerican Consultants, Inc., Tuscaloosa, Alabama and Coastal Environments, Inc.
James, Stephen R., Jr., Charles E. Pearson, Kay Hudson, and Jack Hudson 1991 Archaeological and Historical Investigations of the Wreck of the General C.B.
Comstock, Brazoria County, Texas. Submitted to the Galveston District by Coastal Environments, Inc., Baton Rouge, Louisiana.
Kane, A.I., J.B. Pelletier, M. Williams, D.S. Robinson, and R. Saucier. 1998 A Cultural Resources Survey of Items 3B and 4 of the Upper Yazoo River Projects,
Leflore County, Mississippi. Prepared for the U.S. Army Corps of Engineers, Vicksburg District, by R. Christopher Goodwin & Associates, Inc., Frederick, Maryland.
Kimball, Larry R. 1996 Early Archaic Settlement and Technology: Lessons from Tellico. In The Paleoindian
and Early Archaic Southeast, edited by David G. Anderson and Kenneth E. Sassaman, pp. 149-186. University of Alabama Press, Tuscaloosa.
Kraft, J.C., D.F. Belknap and I. Kayan 1983 Potential of the Discovery of Human Occupation Sties on the Continental Shelves and
Nearshore Coastal Zone. In Quaternary Coastlines and Marine Archaeology, edited by P. M. Master and N. C. Flemming, pp. 87-120. Academic Press.
Krivor, Michael C. 2005 Remote Sensing Survey, Data Analysis, and Diver Investigations of Savannah
Harbor, Chatham County, Georgia, and Jasper County, South Carolina. Submitted to the U.S. Army Corps of Engineers, Savannah District by Panamerican Consultants, Inc., Memphis, Tennessee.
Krivor, Michael C., Stephen R. James, Jr., and Alan Whitehead 2002 National Register of Historic Places Eligibility Evaluations of 13 Potential
Watercraft Targets within the Upper Yazoo Projects Items 5 through 9 Quitman, Tallahatchie and Leflore Counties, Mississippi. Prepared for the U.S. Army Corps of Engineers, Vicksburg District. Panamerican Consultants, Inc., Memphis, TN.
Labaree, Benjamin W., William M. Fowler, Jr., John B. Hattendorf, Jeffrey J. Safford, Edward
W. Sloan, and Andrew W. German 1999 America and the Sea: A Maritime History. Mystic Seaport, Mystic, Connecticut. Ledbetter, R. Jerald, David G. Anderson, Lisa D. O’Steen, and Daniel T. Elliott 1996 Paleoindian and Early Archaic Research in Georgia. In The Paleoindian and Early
Archaic Southeast, edited by David G. Anderson and Kenneth E. Sassaman, pp. 270-287. The University of Alabama Press. Tuscaloosa
Hardbottom and Cultural Resource Surveys Dial Cordy and Associates Inc. Edisto Beach Offshore Borrow Site April 2013
82
Lowery, Darrin L., Michael A. O’Neal, John S. Wah, Daniel P. Wagner, and Dennis J. Stanford 2010 Late Pleistocene Upland Stratigraphy of the Western Delmarva Peninsula, USA.
Quaternary Science Reviews 29(11-12):1472-1480 Lowery, Darrin, Margaret Jodry and Dennis Stanford 2012 Clovis Coastal Zone Width Variation: A Possible Solution for Early Paleoindian
Population Disparity Along the Mid-Atlantic Coast, USA. The Journal of Island and Coastal Archaeology 7(1):53-63.
Lydecker, Andrew D.W. 2007 Historic Assessment and Diver Evaluations of Two Magnetic Anomalies Near Sand
Key, Pinellas County, Florida. Prepared for the U.S. Army Corps of Engineers, Jacksonville District, under subcontract to the U.S. Army Corps of Engineers, Memphis District. Panamerican Consultants, Inc., Memphis, TN.
Masters, P.M., and N.C. Flemming 1983 Quaternary Coastlines. Academic Press, New York. McKivergan, David and Mildred Fryman 1996 Culture History and Associated Sites. In Fort Stewart and Hunter Army Airfield
Historic Preservation Plan, Technical Synthesis Volume: Bryan, Chatham, Evans, Long, Liberty and Tattnall, Counties Georgia, edited by L. Janice Cambell, Mathilda Cox, and Prentice M. Thomas, Jr., pp. 44-169. Prentice Thomas and Associates, Inc., Report of Investigations, 261.
Morison, Samuel Elliot 1971 The European Discovery of America: The Northers Voyages A.D. 500-16,000. The
Oxford University Press, New York. Nordfjord, Sylvia 2006 Late Quaternary Geologic History of New Jersey Middle and Outer Continental Shelf
Marine Geology, PhD dissertation, University of Texas at Austin. O’Steen, Lisa D. 1996 Paleoindian and Early Archaic Settlement Along the Oconee Drainage. In The
Paleoindian and Early Archaic Southeast, edited by David G. Anderson and Kenneth E. Sassaman, pp. 92-106. The University of Alabama Press. Tuscaloosa.
Pearson, Charles E. 1991 Captain Charles Stevens and the Antebellum Georgia Coasting Trade. The Georgia
Historical Quarterly, Volume 75, Number 3. Savannah, Georgia. Pearson, Charles E., and Thomas C.C. Birchette 1999 The History And Archaeology Of Two Civil War Steamboats: The Ironclad Gunboat
USS Eastport and The Steamer Ed. F. Dix. Coastal Environments, Inc., Baton Rouge, Louisiana. Submitted to the U.S. Army Corps of Engineers, Vicksburg District.
Pearson, Charles E., Bryan L. Guevin, and Allen R. Saltus, Jr. 1991 Remote-Sensing Survey of the Lower Pearl and West Pearl Rivers, Louisiana and
Mississippi. Coastal Environments, Inc., Baton Rouge, Louisiana. Prepared for the U.S. Army Corps of Engineers, Vicksburg District.
Hardbottom and Cultural Resource Surveys Dial Cordy and Associates Inc. Edisto Beach Offshore Borrow Site April 2013
83
Pearson, C.E., and K.G. Hudson 1990 Magnetometer Survey of the Matagorda Ship Channel: Matagorda Peninsula to Point
Comfort, Calhoun and Matagorda Counties, Texas. Submitted to the U.S. Army Corps of Engineers, Galveston District by Coastal Environments, Inc., Baton Rouge, Louisiana.
Pearson, C.E., S.R. James, Jr., K.G. Hudson, and J. Duff 1993 Underwater Archaeology Along the Lower Navidad and Lavaca Rivers, Jackson
County, Texas. Coastal Environments, Inc., Baton Rouge, Louisiana. Submitted to the U.S. Army Corps of Engineers, Galveston District.
Pearson, C.E., and A.R. Saltus, Jr. 1990 Cultural Resources Investigation at Island 86, Mississippi River, Arkansas-
Mississippi. Coastal Environments, Inc., Baton Rouge, Louisiana. Submitted to the U.S. Army Corps of Engineers, Vicksburg District.
Pearson, C.E., and J.J. Simmons III 1995 Underwater Archaeology of the Wreck of the Steamship Mary (41NU252) and
Assessment of Seven Anomalies, Corpus Christi Entrance Channel, Nueces County, Texas. Submitted to U.S. Army Corps of Engineers, Galveston District by Coastal Environments, Inc., Baton Rouge, Louisiana.
Ray, Sargent Charles 1986 Ossabaw Sound Clovis Point. The Chesopiean 24(1):12-13. Rich, Fredrick J. and Robert K. Booth 2011 Quaternary Vegetation and Depositonal History of St. Catherines Island. In
Geoarchaeology of St. Catherines Island, edited by Gale A. Bishop, Harold B. Rollins and David Hurst Thomas, pp. 129-141. Anthropological Papers of the American Museum of Natural History, Number 94.
Ritchie, Robert C. 1986 Captain Kidd and the War Against the Pirates. Harvard University Press.
Cambridge, Massachusetts. Robinson, David S. 1998 Management Summary: Cultural Resources Survey of Items 3B-2 and 4 of the Upper
Yazoo River Projects, Mississippi. Contract DACW29-97-D-0018. R. Christopher Goodwin & Associates, Inc., Frederick, Maryland. Submitted to the U.S. Army Corps of Engineers, Vicksburg District.
Rogers, R., S.D. Hoyt, C.L. Bond, L. Voellinger, and S.R. James, Jr. 1990 Cultural Resources Investigations, Virginia Point, Galveston County, Texas. Espey,
Huston and Associates, Inc., Austin, Texas. Submitted to the U.S. Army Corps of Engineers, Galveston District.
Rowland, Lawrence S., Alexander Moore and George C. Rogers, Jr. 1996 The History of Beaufort County, South Carolina: Volume I, 1514-1861. University of
South Carolina Press, Columbia.
Hardbottom and Cultural Resource Surveys Dial Cordy and Associates Inc. Edisto Beach Offshore Borrow Site April 2013
84
Saltus, Allen R., Jr. 1993 Scow from Watercraft in Louisiana’s Inland Waters. Unpublished paper presented at
the 1993 Society for Historical Archaeology and Conference on Underwater Archaeology, Kansas City, Missouri. On file, Panamerican Maritime, L.L.C., Memphis, Tennessee.
Sassaman, Kenneth E. 2010 Getting from the Late Archaic to Early Woodland in Three Middle Valleys (those
being the Savannah, St. Johns, nd Tennessee. In Trend, Tradition, and Turmoil: What Happened to the Southeastern Archaic? edited by Davis Hurst Thomas and Matthew C. Sanger, pp. 229-235. Anthropological Papers of the American Museum of Natural History, Number 93.
Sassaman, Kenneth E. and David G. Anderson 1990 Typology and Chronology. In Native American Prehistory of the Middle Savannah
River Valley: A Synthesis of Archaeological Investigations on the Savannah River Site, Aiken and Barnwell Counties, South Carolina, by Kenneth E. Sassaman, Mark J. Brooks, Glen T. Hanson, and David G. Anderson, pp. 143-215. Occasional Papers of the Savannah River Archaeological Research Program, South Carolina Institute of Archaeology and Anthropology, University of South Carolina. Columbia.
1995 Middle and Late Archaic Archaeological Records of South Carolina: A Synthesis for
Research and Resource Management. Occasional Papers of the Savannah River Archaeological Research Program, South Carolina Institute of Archaeology and Anthropology, University of South Carolina. Columbia.
Savage, Henry 1956 Rivers of America, River of the Carolinas: The Santee. Rinehart & Company, New
York. Sexton, W.J., M.O. Hayes, and D.J. Colquhoun, 1992 Evolution of Quaternary shoal complexes of the south central South Carolina coast.
Quaternary Coasts of the United States: marine and Lacustrine Systems: SEPM Special Publication No. 48. SEPM Tulsa, OK, p. 160-172.
Sherwood, Sarah C., Boyce N Driskell, Asa Randall and Scott C. Meeks 2004 Chronology and Stratigraphy at Dust Cave, Alabama. American Antiquity 69(3):533-
554. Siddall, M., E.J. Rohling, A. Almogi-Labin, C. Hemleben, D. Meischner, I. Schmetzer, and D.A.
Smeed 2003 Sea-level fluctuations during the last glacial cycle. Nature 423:853-858. Spirek, James D. and Christopher F. Amer, editors 2004 A Management Plan for Known and Potential United States Navy Shipwrecks in
South Carolina. Prepared by the Maritime Research Division, South Carolina Institute of Archaeology and Anthropology, University of South Carolina, Columbia. Christopher F. Amer, Joseph Beatty III, Lynn B. Harris, Carleton Naylor, James D. Spirek, and Mark K. Ragan authors.
Hardbottom and Cultural Resource Surveys Dial Cordy and Associates Inc. Edisto Beach Offshore Borrow Site April 2013
85
Stevenson, I. R., C. McCann and P. B. Runciman 2002 An attenuation-based sediment classification technique using Chirp sub-bottom
profiler data and laboratory acoustic analysis. Marine Geophysical Research 23(4):277-298.
Thomas, David Hurst 2008 Native American Landscapes of St. Catherines Island, Georgia Anthropological
Papers of the American Museum of Natural History 88. Trimble Navigation Limited 1998 DSM12/212 Operation Manual. Trimble Navigation Limited, Sunnyvale, California. Turck, John A., Mark Williams and John F. Chamblee 2011 Examining Variation in the Human Settlement of Prehistoric Georgia. Early
Georgia 39(1):5-26. Van Dolah, B. and D. Bergquist 2006 SEAMAP and INTERMAR Bottom Mapping Projects and SCDNR Historical Data
Study on Beach Nourishment Projects. Wallace, David D. 1951 South Carolina: A Short History 1520-1948. University of South Carolina Press,
Columbia, South Carolina. Waring, Antonio J., Jr. 1968 The Archaic Hunting and Gathering Cultures: The Archaic and Some Shell Rings.
In The Waring Papers, edited by Stephen Williams, pp. 243-246. Harvard University, Papers of the Peabody Museum of Archaeology and Ethnology 58. Cambridge.
Waters, Michael 1992 Principles of Geoarchaeology: A North American Perspective. University of Arizona
Press, Tucson. Waters, Michael R., Steven L. Forman, Thomas A. Jennings, Lee C. Nordt, Steven G. Driese,
Joshua M. Feinberg, Joshua L. Keene, Jessi Halligan, Anna Lindquist, James Pierson, Charles T. Hallmark, Michael B. Collins and James E. Wiederhold
2011 The Buttermilk Creek Complex and the Origins of Clovis at the Debra L. Friedkin Site, Texas. Science 331(6024):1599-1603.
Watts, Gordon P. 1998 A Remote Sensing Survey of the Daufuskie Island Beach Nourishment Project Borrow
Areas, Beaufort County, South Carolina. Submitted to Applied Technology & Management, Inc. by by Tidewater Atlantic Research, Inc., Washington, North Carolina.
2000 Phase I Archaeological Remote Survey of the Virginia Beach and Fort Story
Hurricane Protection Borrow Areas, Virginia. Prepared for the U.S. Army Corps of Engineers, Wilmington District by Tidewater Atlantic Research, Washington, North Carolina.
Hardbottom and Cultural Resource Surveys Dial Cordy and Associates Inc. Edisto Beach Offshore Borrow Site April 2013
86
2005 Submerged Cultural Resources Survey of a Sand Borrow Area for Hunting Island Beach Restoration Project, Beaufort County, South Carolina. Conducted for the South Carolina Department of Parks, Recreation and Tourism by Tidewater Atlantic Research, Inc., Washington, North Carolina.
Webb, S. David, Jerald T. Milanich, Roger Alexon, and James S. Dunbar 1984 A Bison Antiquus Kill Site, Wacissa River, Jefferson County, Florida. American
Antiquity 49(2):384-392. Wright, Newell 1976 The Surside Springs Site: A Possible Association Between Early Man and Extinct
Fauna. South Carolina Antiquities 8(2):318-321.
APPENDIX A
SCOPE OF WORK HARDBOTTOM AND CULTURAL RESOURCE SURVEYS EDISTO BEACH OFFSHORE BORROW SITE,
EDISTO BEACH, SOUTH CAROLINA
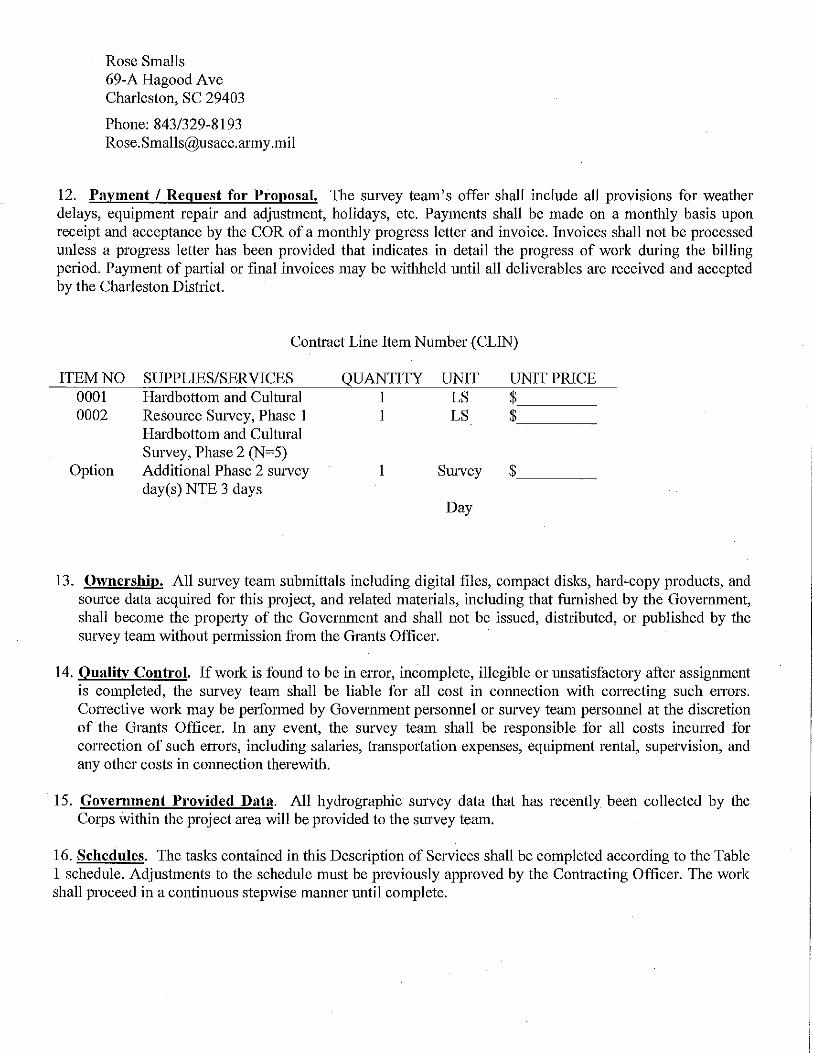
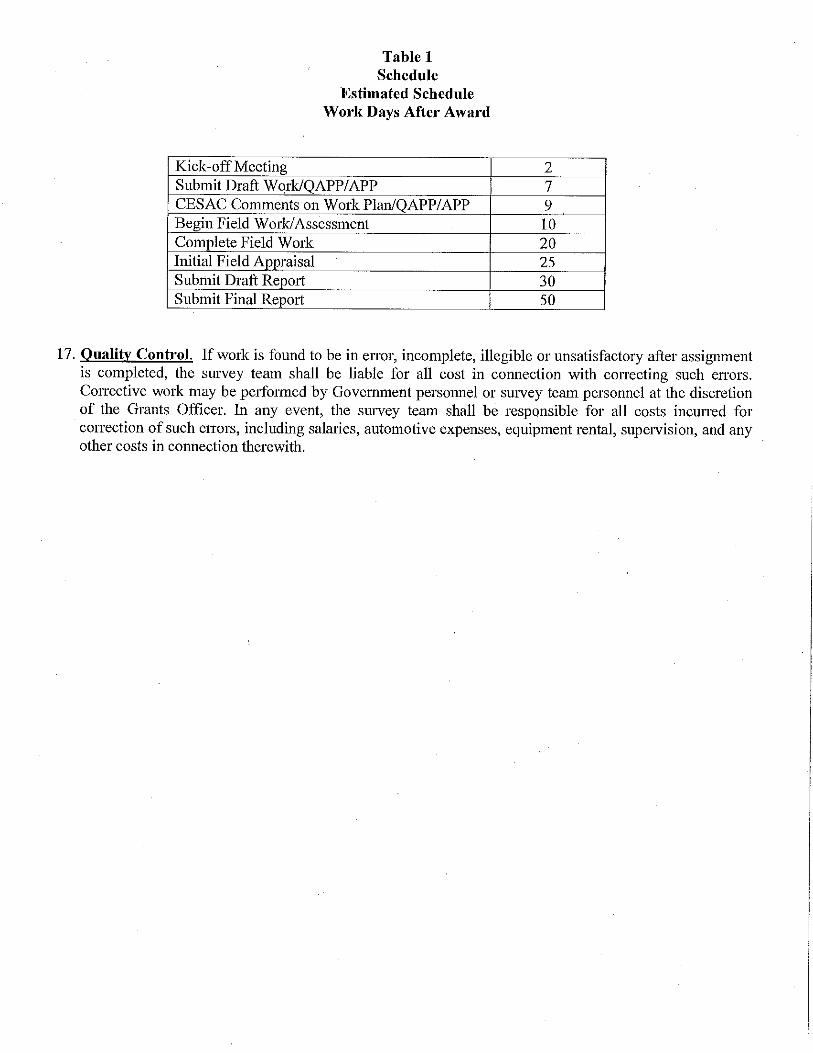
APPENDIX B
MAGNETIC ANOMALIES CONTOUR MAPS
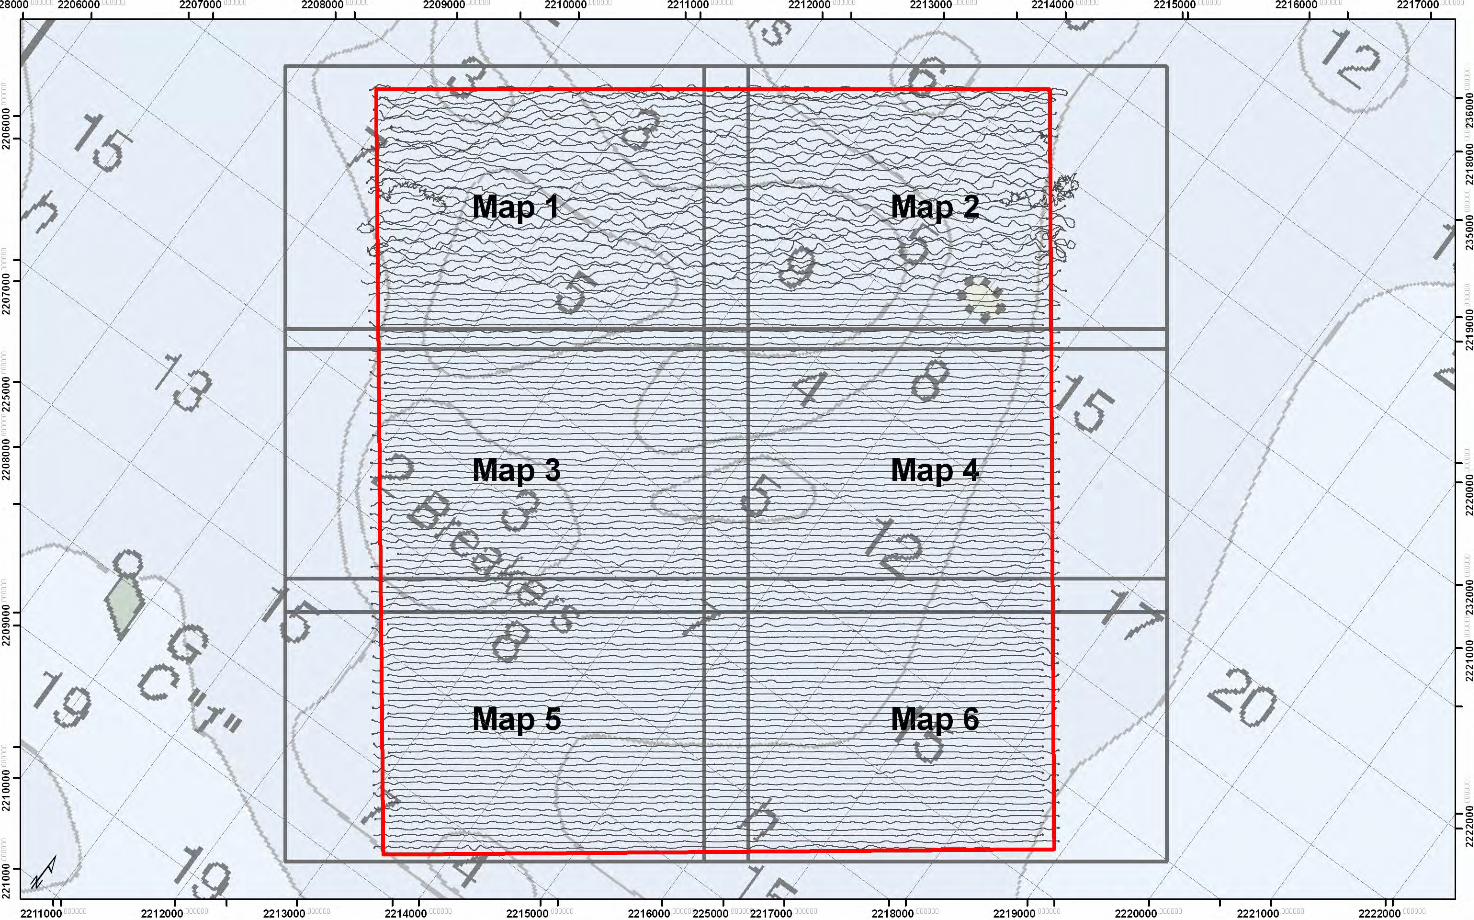
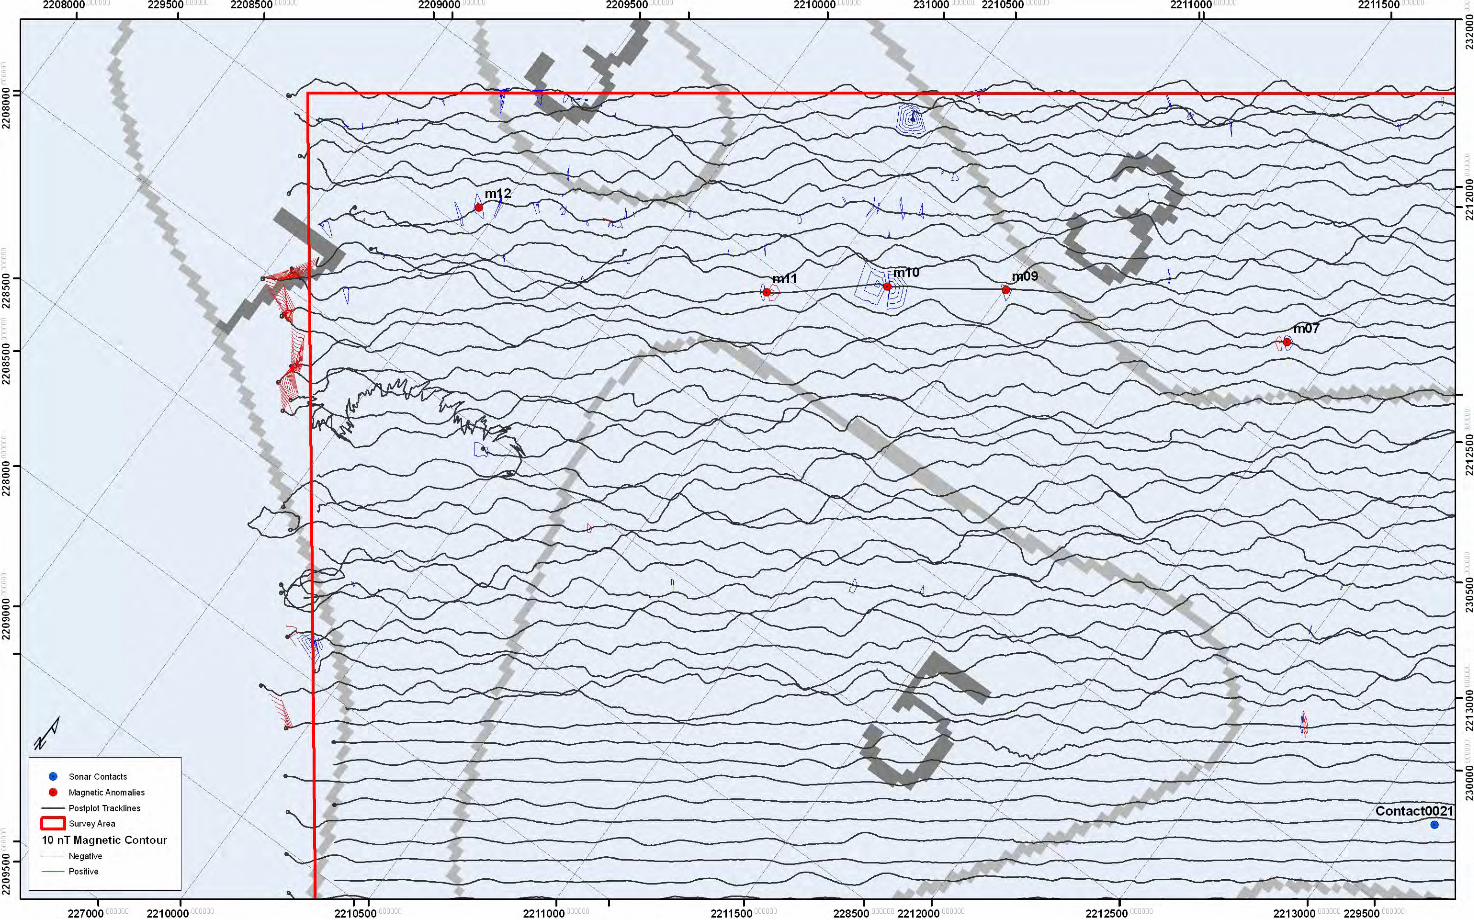
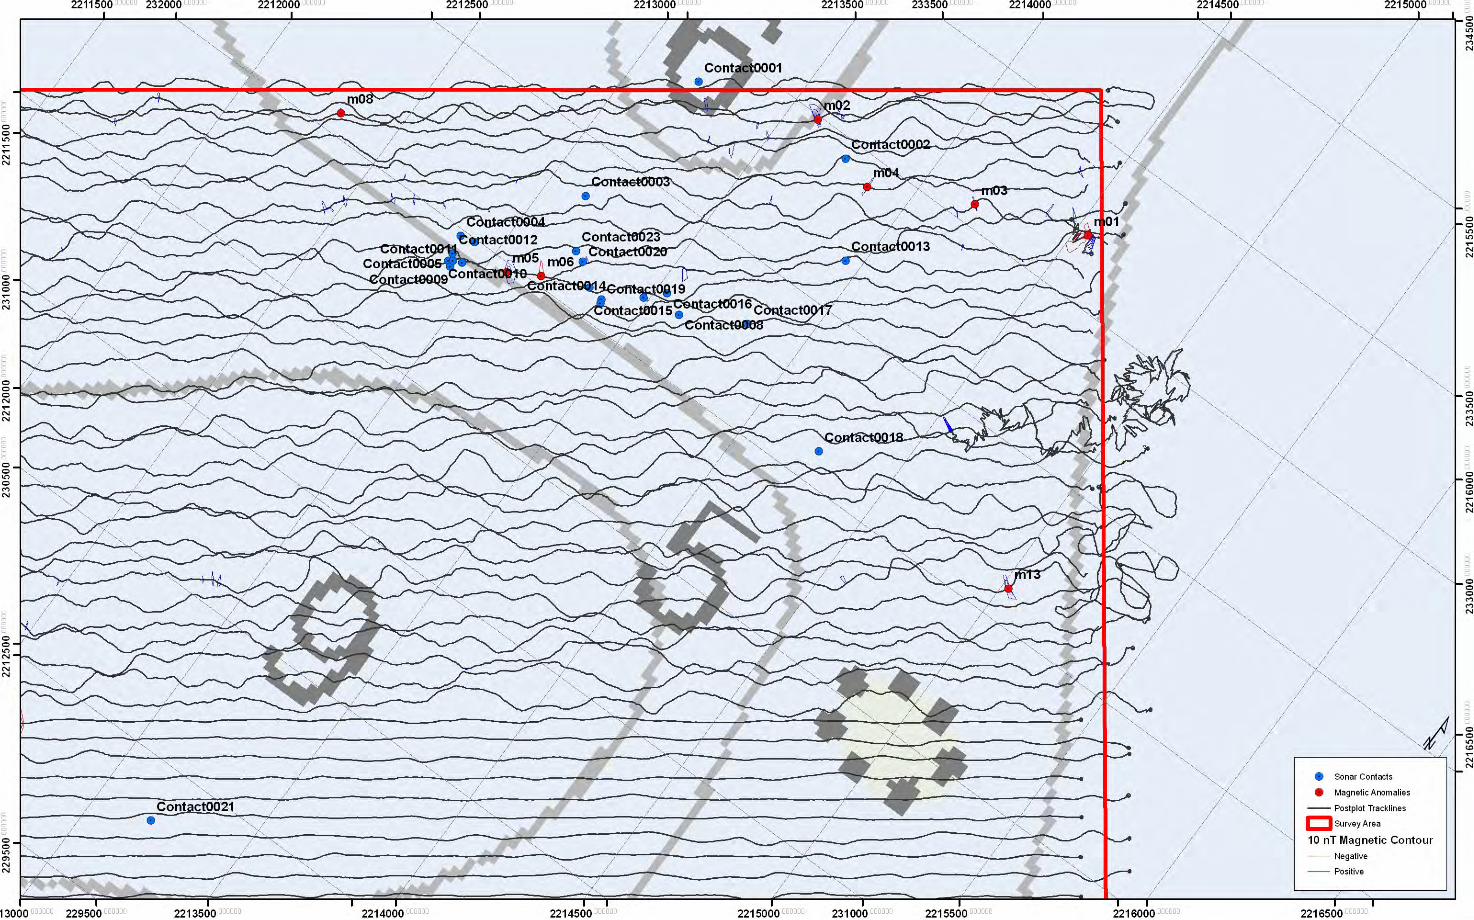
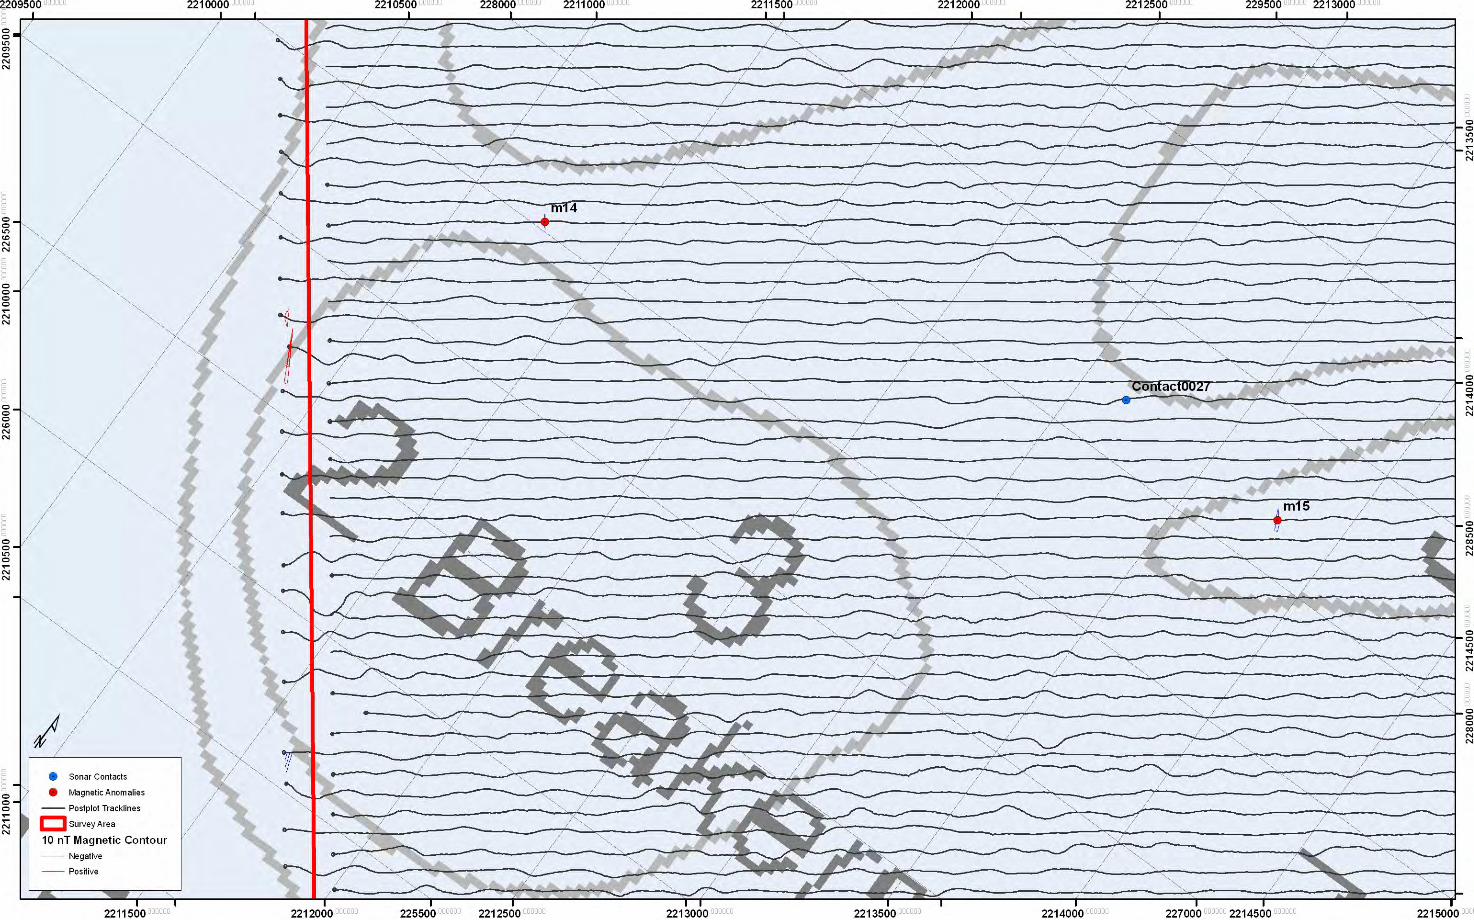
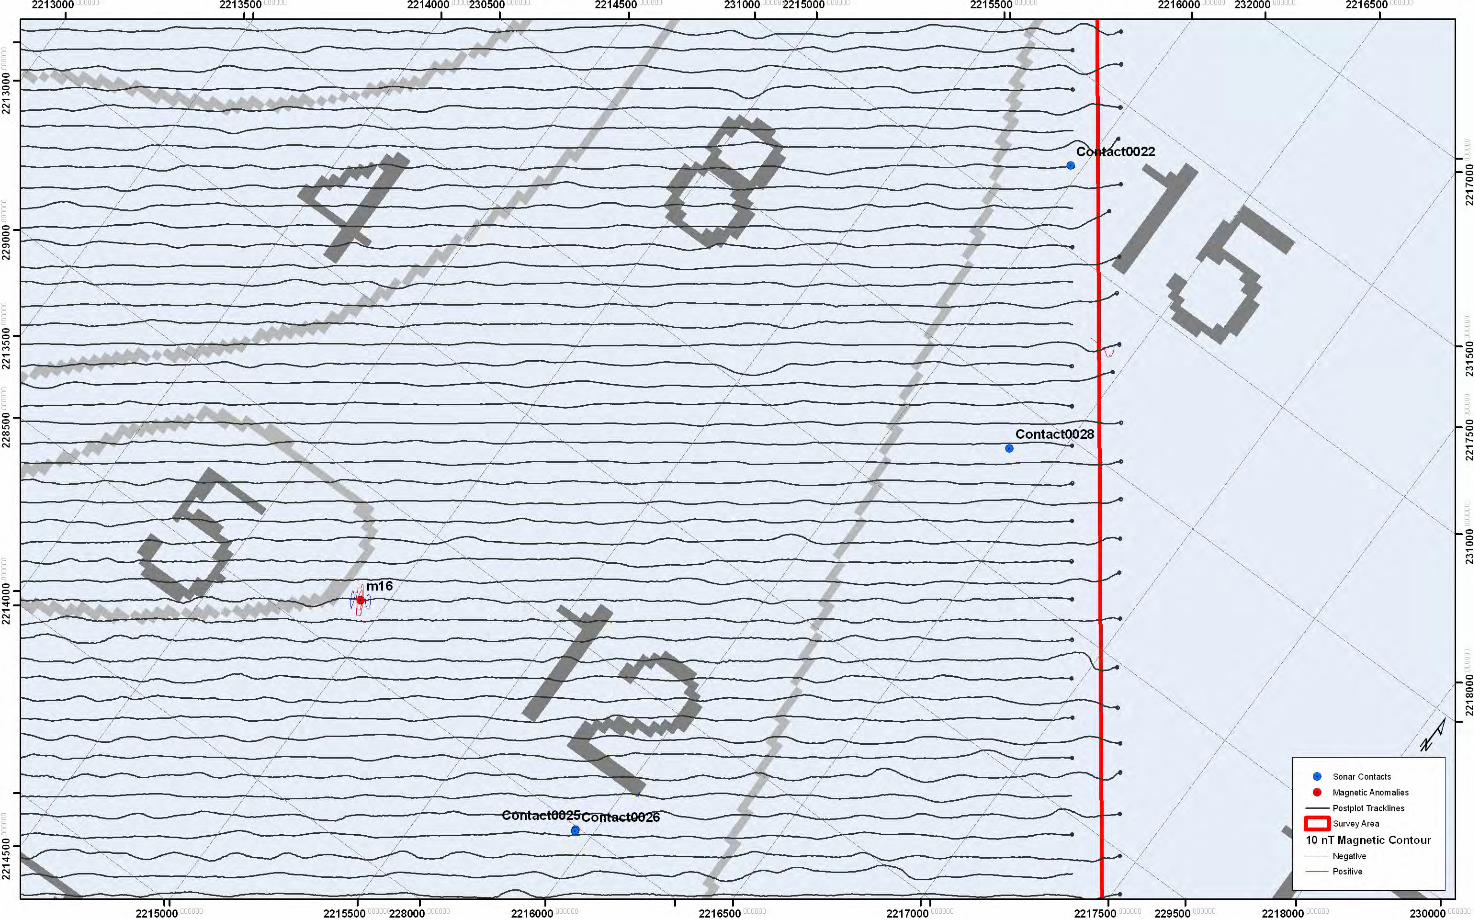
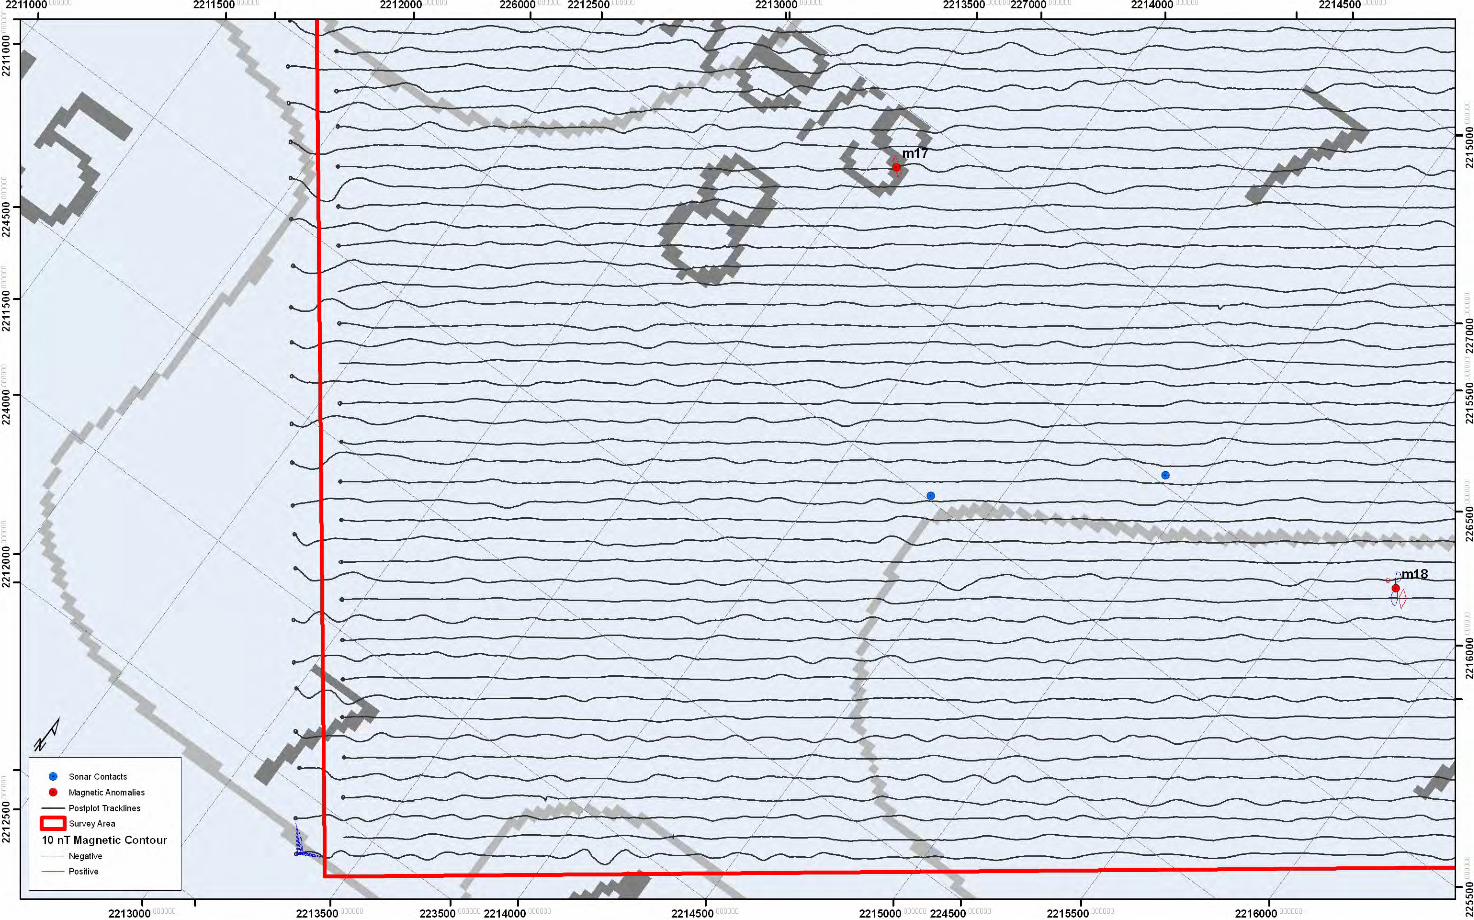
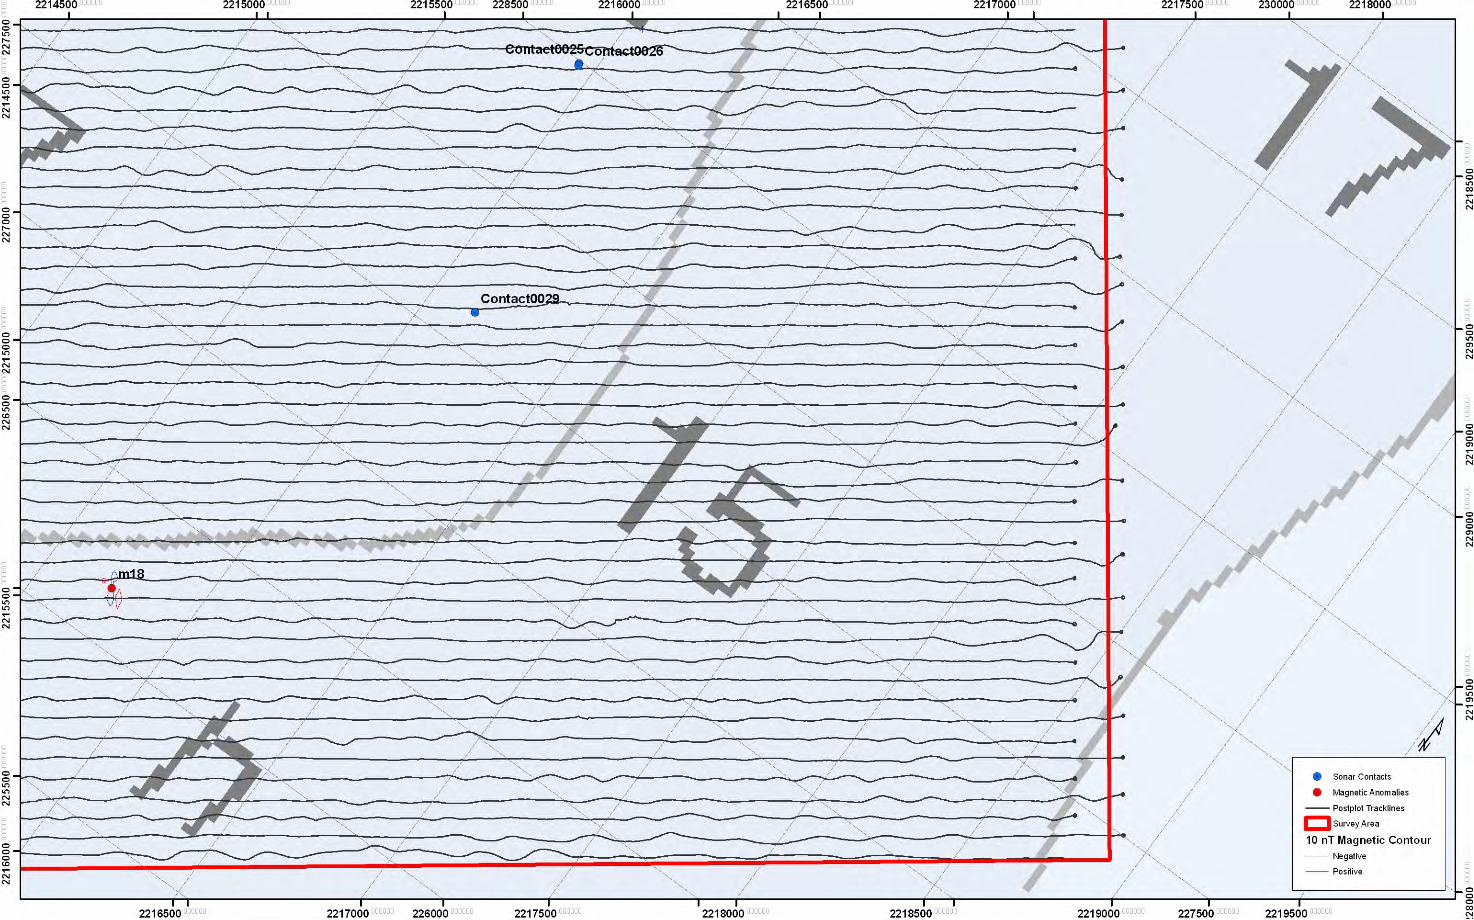
APPENDIX C
LETTER OF CONCURRENCE FROM THE SOUTH CAROLINA INSTITUTE OF ARCHAEOLOGY AND ANTHROPOLOGY
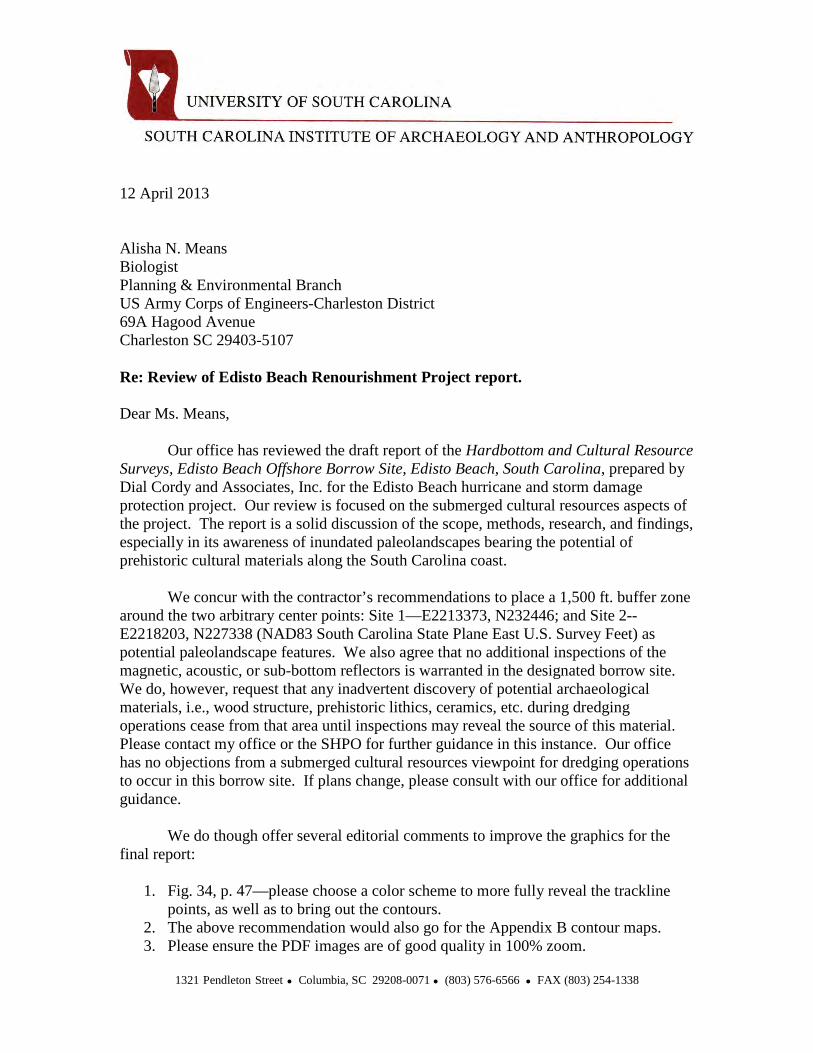
1321 Pendleton Street Columbia, SC 29208-0071 (803) 576-6566 FAX (803) 254-1338
12 April 2013 Alisha N. Means Biologist Planning & Environmental Branch US Army Corps of Engineers-Charleston District 69A Hagood Avenue Charleston SC 29403-5107 Re: Review of Edisto Beach Renourishment Project report. Dear Ms. Means, Our office has reviewed the draft report of the Hardbottom and Cultural Resource Surveys, Edisto Beach Offshore Borrow Site, Edisto Beach, South Carolina, prepared by Dial Cordy and Associates, Inc. for the Edisto Beach hurricane and storm damage protection project. Our review is focused on the submerged cultural resources aspects of the project. The report is a solid discussion of the scope, methods, research, and findings, especially in its awareness of inundated paleolandscapes bearing the potential of prehistoric cultural materials along the South Carolina coast. We concur with the contractor’s recommendations to place a 1,500 ft. buffer zone around the two arbitrary center points: Site 1—E2213373, N232446; and Site 2--E2218203, N227338 (NAD83 South Carolina State Plane East U.S. Survey Feet) as potential paleolandscape features. We also agree that no additional inspections of the magnetic, acoustic, or sub-bottom reflectors is warranted in the designated borrow site. We do, however, request that any inadvertent discovery of potential archaeological materials, i.e., wood structure, prehistoric lithics, ceramics, etc. during dredging operations cease from that area until inspections may reveal the source of this material. Please contact my office or the SHPO for further guidance in this instance. Our office has no objections from a submerged cultural resources viewpoint for dredging operations to occur in this borrow site. If plans change, please consult with our office for additional guidance. We do though offer several editorial comments to improve the graphics for the final report:
1. Fig. 34, p. 47—please choose a color scheme to more fully reveal the trackline points, as well as to bring out the contours.
2. The above recommendation would also go for the Appendix B contour maps. 3. Please ensure the PDF images are of good quality in 100% zoom.
Thank you for this opportunity to review the report and your support of preserving the submerged archeological legacy in South Carolina waters. If you have any questions, comments, etc. about this matter please contact me. Sincerely,
James D. Spirek State Underwater Archaeologist Maritime Research Division Cc: Rebekah Dobrasko, SC SHPO


![Army Corps Neg[1]](https://img.pdfslide.us/doc/110x75/577cde9a1a28ab9e78af7164/army-corps-neg1.jpg)