Embed Size (px)
Citation preview
APPENDIX II
TIER I CHECKLIST
Data Validation PRF - Tier I Page 1Version 3.0, January 9, 2006
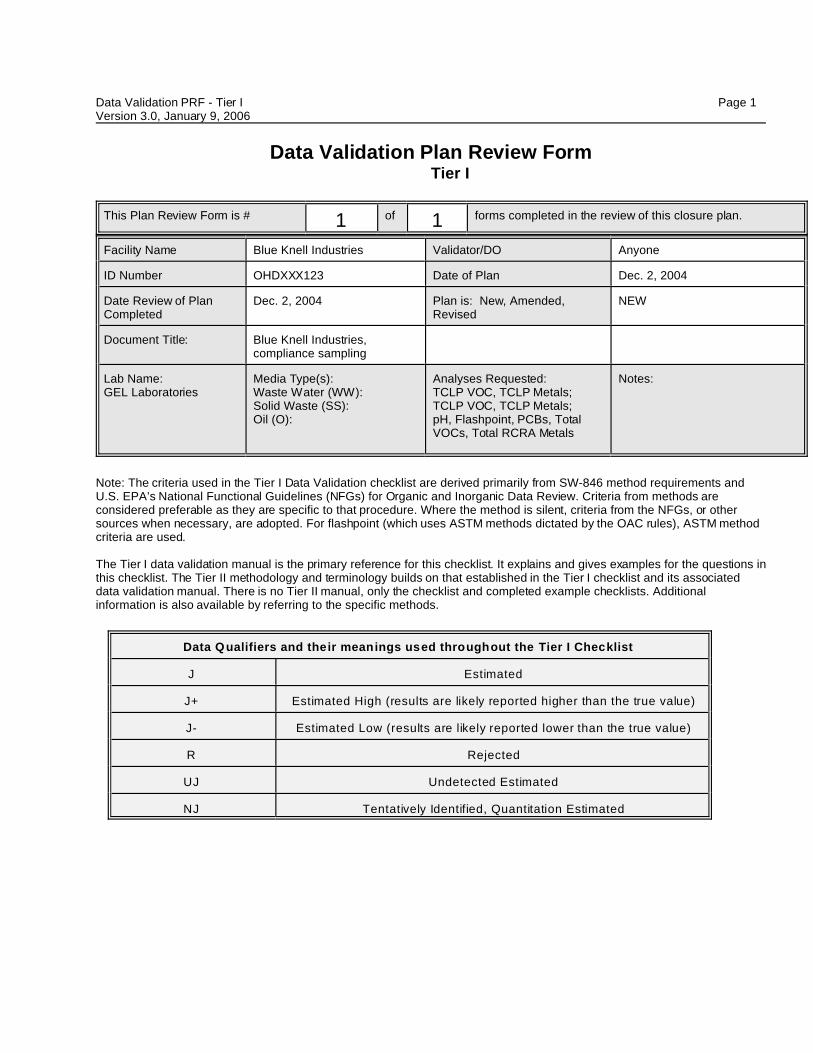
Data Validation Plan Review FormTier I
This Plan Review Form is # 1 of 1 forms completed in the review of this closure plan.
Facility Name Blue Knell Industries Validator/DO Anyone
ID Number OHDXXX123 Date of Plan Dec. 2, 2004
Date Review of PlanCompleted
Dec. 2, 2004 Plan is: New, Amended,Revised
NEW
Document Title: Blue Knell Industries,compliance sampling
Lab Name:GEL Laboratories
Media Type(s):Waste Water (WW):Solid Waste (SS):Oil (O):
Analyses Requested:TCLP VOC, TCLP Metals;TCLP VOC, TCLP Metals;pH, Flashpoint, PCBs, TotalVOCs, Total RCRA Metals
Notes:
Note: The criteria used in the Tier I Data Validation checklist are derived primarily from SW-846 method requirements andU.S. EPA’s National Functional Guidelines (NFGs) for Organic and Inorganic Data Review. Criteria from methods areconsidered preferable as they are specific to that procedure. Where the method is silent, criteria from the NFGs, or othersources when necessary, are adopted. For flashpoint (which uses ASTM methods dictated by the OAC rules), ASTM methodcriteria are used.
The Tier I data validation manual is the primary reference for this checklist. It explains and gives examples for the questions inthis checklist. The Tier II methodology and terminology builds on that established in the Tier I checklist and its associateddata validation manual. There is no Tier II manual, only the checklist and completed example checklists. Additionalinformation is also available by referring to the specific methods.
Data Qualifiers and their meanings used throughout the Tier I Checklist
J Estimated
J+ Estimated High (results are likely reported higher than the true value)
J- Estimated Low (results are likely reported lower than the true value)
R Rejected
UJ Undetected Estimated
NJ Tentatively Identified, Quantitation Estimated
Data Validation PRF - Tier I Page 2Version 3.0, January 9, 2006
Section 1.0Report Completeness and Technical Holding Times
Data Validation PRF - Tier I Page 3Version 3.0, January 9, 2006
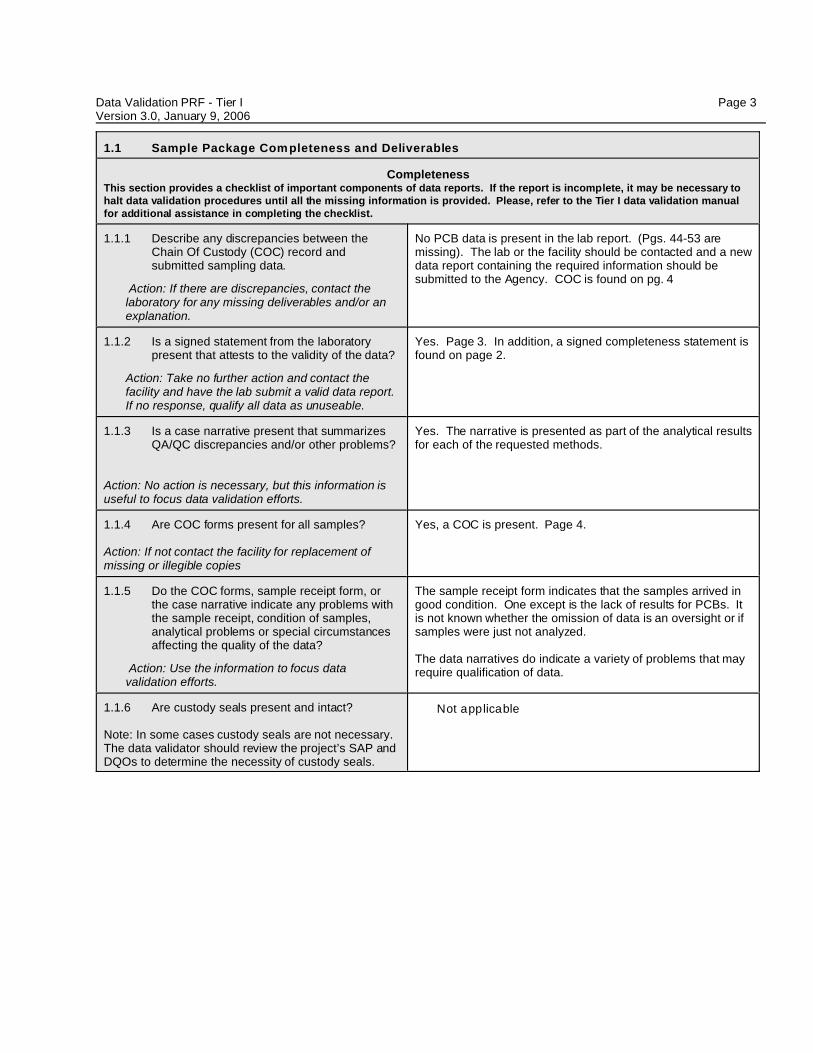
1.1 Sample Package Completeness and Deliverables
CompletenessThis section provides a checklist of important components of data reports. If the report is incomplete, it may be necessary tohalt data validation procedures until all the missing information is provided. Please, refer to the Tier I data validation manualfor additional assistance in completing the checklist.
1.1.1 Describe any discrepancies between theChain Of Custody (COC) record andsubmitted sampling data.
Action: If there are discrepancies, contact thelaboratory for any missing deliverables and/or anexplanation.
No PCB data is present in the lab report. (Pgs. 44-53 aremissing). The lab or the facility should be contacted and a newdata report containing the required information should besubmitted to the Agency. COC is found on pg. 4
1.1.2 Is a signed statement from the laboratorypresent that attests to the validity of the data?
Action: Take no further action and contact thefacility and have the lab submit a valid data report.If no response, qualify all data as unuseable.
Yes. Page 3. In addition, a signed completeness statement isfound on page 2.
1.1.3 Is a case narrative present that summarizesQA/QC discrepancies and/or other problems?
Action: No action is necessary, but this information isuseful to focus data validation efforts.
Yes. The narrative is presented as part of the analytical resultsfor each of the requested methods.
1.1.4 Are COC forms present for all samples?
Action: If not contact the facility for replacement ofmissing or illegible copies
Yes, a COC is present. Page 4.
1.1.5 Do the COC forms, sample receipt form, orthe case narrative indicate any problems withthe sample receipt, condition of samples,analytical problems or special circumstancesaffecting the quality of the data?
Action: Use the information to focus datavalidation efforts.
The sample receipt form indicates that the samples arrived ingood condition. One except is the lack of results for PCBs. Itis not known whether the omission of data is an oversight or ifsamples were just not analyzed.
The data narratives do indicate a variety of problems that mayrequire qualification of data.
1.1.6 Are custody seals present and intact?
Note: In some cases custody seals are not necessary. The data validator should review the project’s SAP andDQOs to determine the necessity of custody seals.
Not applicable
Data Validation PRF - Tier I Page 4Version 3.0, January 9, 2006
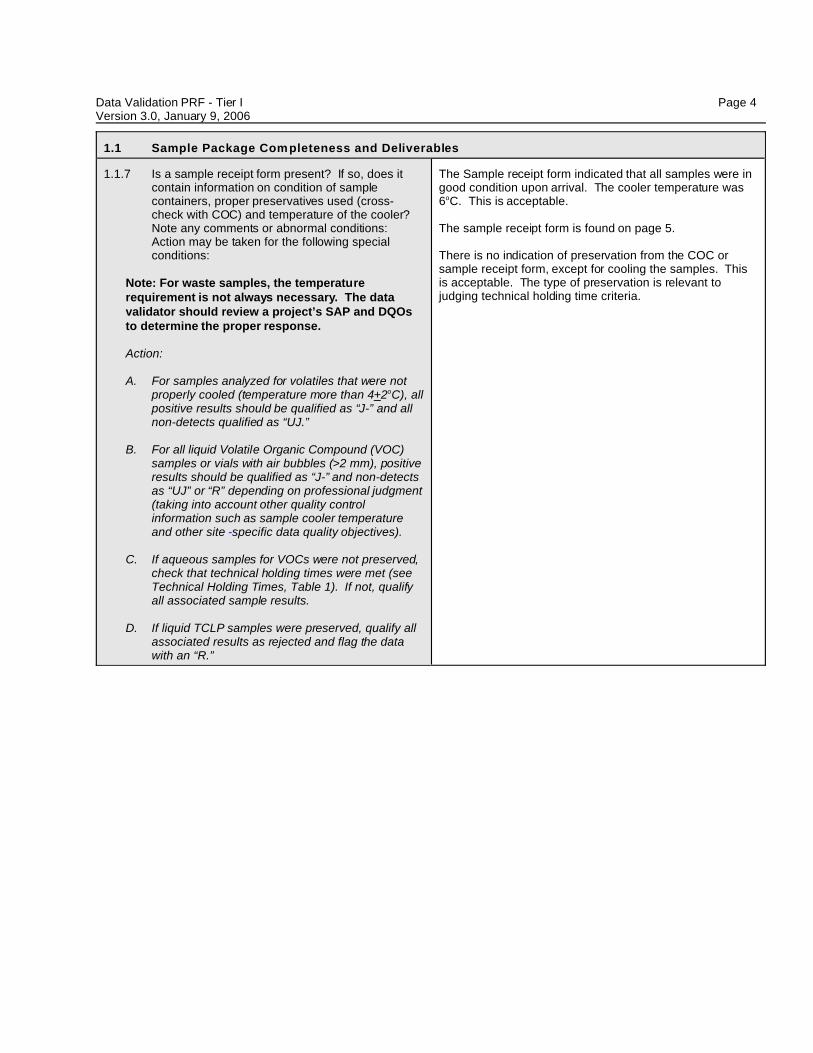
1.1 Sample Package Completeness and Deliverables
1.1.7 Is a sample receipt form present? If so, does itcontain information on condition of samplecontainers, proper preservatives used (cross-check with COC) and temperature of the cooler? Note any comments or abnormal conditions:Action may be taken for the following specialconditions:
Note: For waste samples, the temperaturerequirement is not always necessary. The datavalidator should review a project’s SAP and DQOsto determine the proper response.
Action:
A. For samples analyzed for volatiles that were notproperly cooled (temperature more than 4+2oC), allpositive results should be qualified as “J-” and allnon-detects qualified as “UJ.”
B. For all liquid Volatile Organic Compound (VOC)samples or vials with air bubbles (>2 mm), positiveresults should be qualified as “J-” and non-detectsas “UJ” or “R” depending on professional judgment(taking into account other quality controlinformation such as sample cooler temperatureand other site -specific data quality objectives).
C. If aqueous samples for VOCs were not preserved,check that technical holding times were met (seeTechnical Holding Times, Table 1). If not, qualifyall associated sample results.
D. If liquid TCLP samples were preserved, qualify allassociated results as rejected and flag the datawith an “R.”
The Sample receipt form indicated that all samples were ingood condition upon arrival. The cooler temperature was6oC. This is acceptable.
The sample receipt form is found on page 5.
There is no indication of preservation from the COC orsample receipt form, except for cooling the samples. Thisis acceptable. The type of preservation is relevant tojudging technical holding time criteria.
Data Validation PRF - Tier I Page 5Version 3.0, January 9, 2006
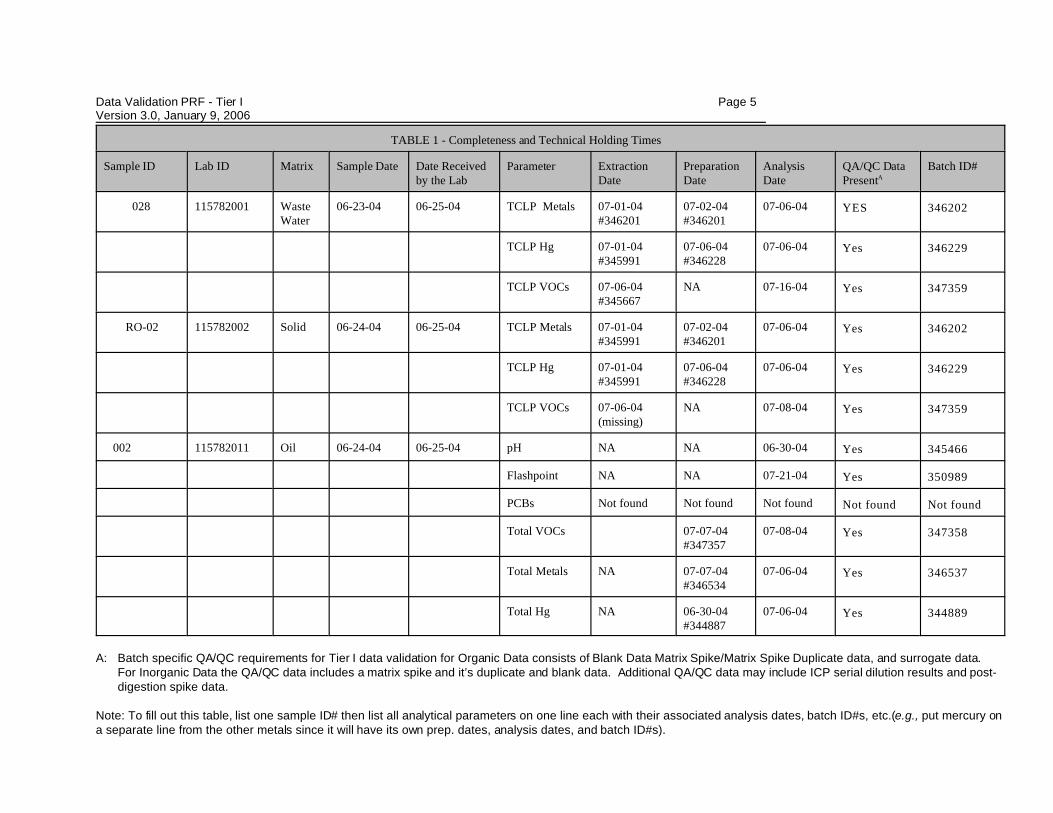
TABLE 1 - Completeness and Technical Holding Times
Sample ID Lab ID Matrix Sample Date Date Receivedby the Lab
Parameter ExtractionDate
PreparationDate
AnalysisDate
QA/QC DataPresentA
Batch ID#
028 115782001 WasteWater
06-23-04 06-25-04 TCLP Metals 07-01-04#346201
07-02-04#346201
07-06-04 YES 346202
TCLP Hg 07-01-04#345991
07-06-04#346228
07-06-04 Yes 346229
TCLP VOCs 07-06-04#345667
NA 07-16-04 Yes 347359
RO-02 115782002 Solid 06-24-04 06-25-04 TCLP Metals 07-01-04#345991
07-02-04#346201
07-06-04 Yes 346202
TCLP Hg 07-01-04#345991
07-06-04#346228
07-06-04 Yes 346229
TCLP VOCs 07-06-04(missing)
NA 07-08-04 Yes 347359
002 115782011 Oil 06-24-04 06-25-04 pH NA NA 06-30-04 Yes 345466
Flashpoint NA NA 07-21-04 Yes 350989
PCBs Not found Not found Not found Not found Not found
Total VOCs 07-07-04#347357
07-08-04 Yes 347358
Total Metals NA 07-07-04#346534
07-06-04 Yes 346537
Total Hg NA 06-30-04#344887
07-06-04 Yes 344889
A: Batch specific QA/QC requirements for Tier I data validation for Organic Data consists of Blank Data Matrix Spike/Matrix Spike Duplicate data, and surrogate data. For Inorganic Data the QA/QC data includes a matrix spike and it’s duplicate and blank data. Additional QA/QC data may include ICP serial dilution results and post-digestion spike data.
Note: To fill out this table, list one sample ID# then list all analytical parameters on one line each with their associated analysis dates, batch ID#s, etc.(e.g., put mercury ona separate line from the other metals since it will have its own prep. dates, analysis dates, and batch ID#s).
Data Validation PRF - Tier I Page 6Version 3.0, January 9, 2006
1.2 Technical Holding Times
Table 1
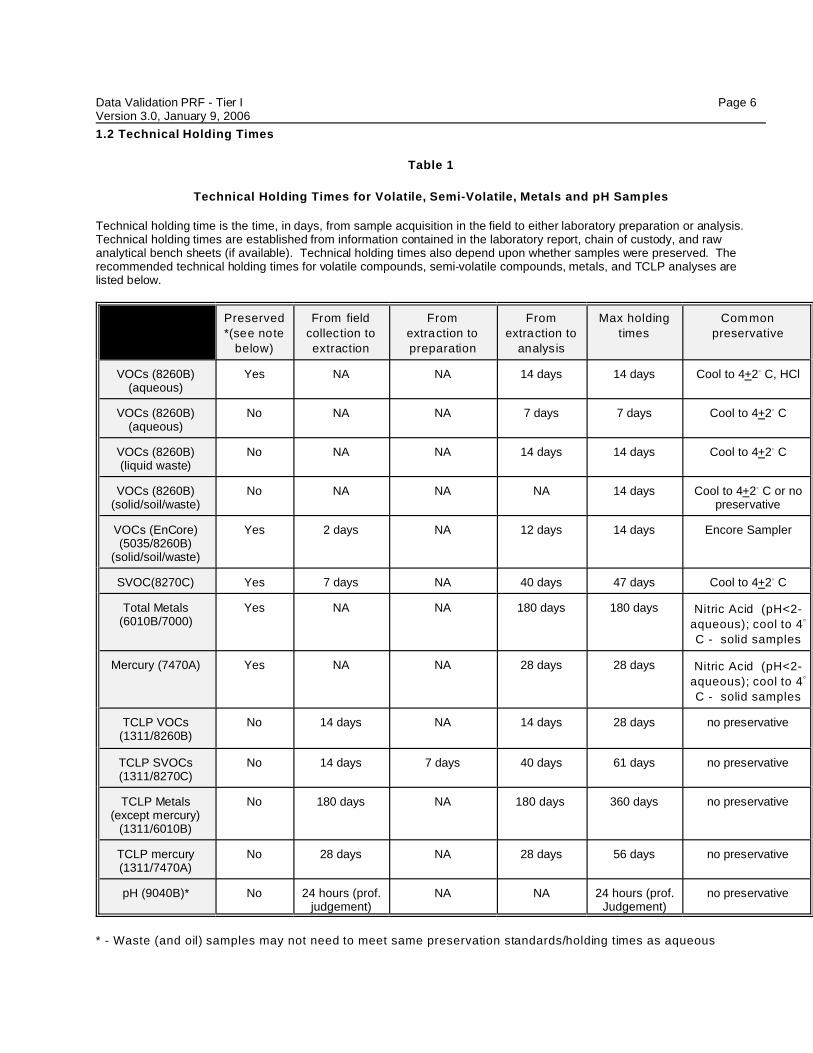
Technical Holding Times for Volatile, Semi-Volatile, Metals and pH Samples
Technical holding time is the time, in days, from sample acquisition in the field to either laboratory preparation or analysis.Technical holding times are established from information contained in the laboratory report, chain of custody, and rawanalytical bench sheets (if available). Technical holding times also depend upon whether samples were preserved. Therecommended technical holding times for volatile compounds, semi-volatile compounds, metals, and TCLP analyses arelisted below.
Preserved
*(see note
below)
From field
collection to
extraction
From
extraction to
preparation
From
extraction to
analysis
Max holding
times
Common
preservative
VOCs (8260B)(aqueous)
Yes NA NA 14 days 14 days Cool to 4+2B C, HCl
VOCs (8260B)(aqueous)
No NA NA 7 days 7 days Cool to 4+2B C
VOCs (8260B)(liquid waste)
No NA NA 14 days 14 days Cool to 4+2B C
VOCs (8260B)(solid/soil/waste)
No NA NA NA 14 days Cool to 4+2B C or nopreservative
VOCs (EnCore)(5035/8260B)
(solid/soil/waste)
Yes 2 days NA 12 days 14 days Encore Sampler
SVOC(8270C) Yes 7 days NA 40 days 47 days Cool to 4+2B C
Total Metals(6010B/7000)
Yes NA NA 180 days 180 days Nitric Acid (pH<2-
aqueous); cool to 4B
C - solid samples
Mercury (7470A) Yes NA NA 28 days 28 days Nitric Acid (pH<2-
aqueous); cool to 4B
C - solid samples
TCLP VOCs(1311/8260B)
No 14 days NA 14 days 28 days no preservative
TCLP SVOCs(1311/8270C)
No 14 days 7 days 40 days 61 days no preservative
TCLP Metals(except mercury)
(1311/6010B)
No 180 days NA 180 days 360 days no preservative
TCLP mercury(1311/7470A)
No 28 days NA 28 days 56 days no preservative
pH (9040B)* No 24 hours (prof.judgement)
NA NA 24 hours (prof.Judgement)
no preservative
* - Waste (and oil) samples may not need to meet same preservation standards/holding times as aqueous
Data Validation PRF - Tier I Page 7Version 3.0, January 9, 2006
samples.
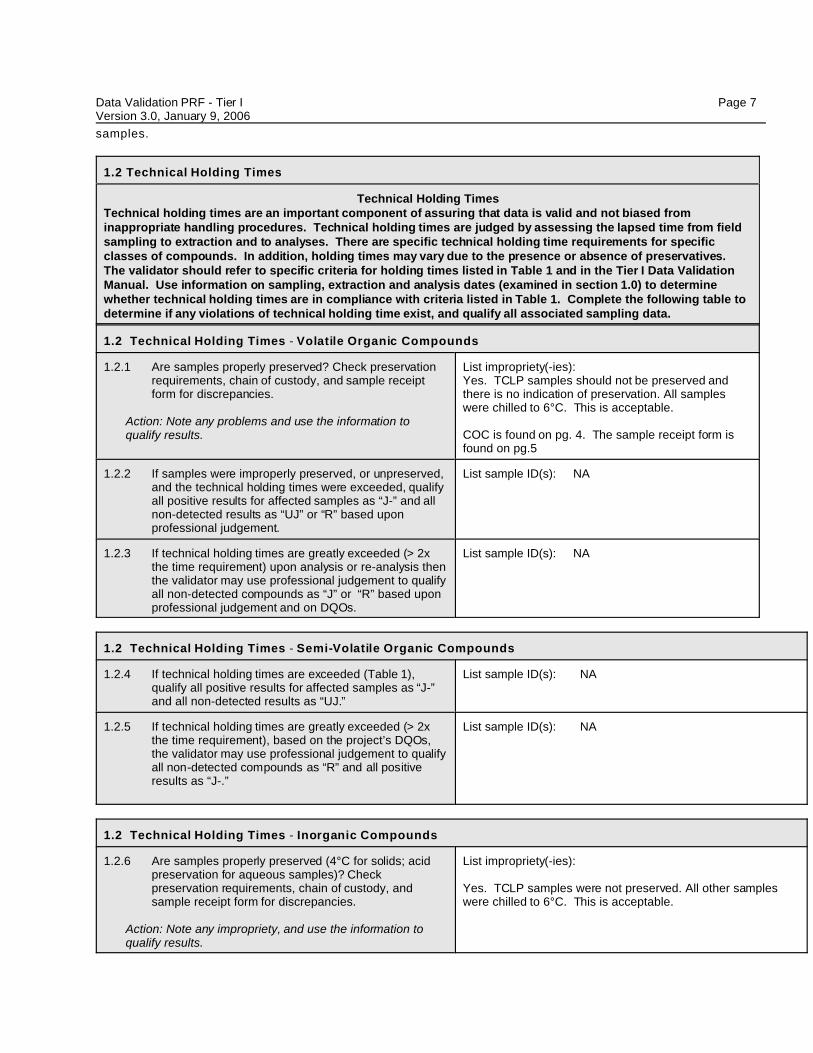
1.2 Technical Holding Times
Technical Holding TimesTechnical holding times are an important component of assuring that data is valid and not biased frominappropriate handling procedures. Technical holding times are judged by assessing the lapsed time from fieldsampling to extraction and to analyses. There are specific technical holding time requirements for specificclasses of compounds. In addition, holding times may vary due to the presence or absence of preservatives. The validator should refer to specific criteria for holding times listed in Table 1 and in the Tier I Data ValidationManual. Use information on sampling, extraction and analysis dates (examined in section 1.0) to determinewhether technical holding times are in compliance with criteria listed in Table 1. Complete the following table todetermine if any violations of technical holding time exist, and qualify all associated sampling data.
1.2 Technical Holding Times - Volatile Organic Compounds
1.2.1 Are samples properly preserved? Check preservationrequirements, chain of custody, and sample receiptform for discrepancies.
Action: Note any problems and use the information toqualify results.
List impropriety(-ies):Yes. TCLP samples should not be preserved andthere is no indication of preservation. All sampleswere chilled to 6°C. This is acceptable.
COC is found on pg. 4. The sample receipt form isfound on pg.5
1.2.2 If samples were improperly preserved, or unpreserved,and the technical holding times were exceeded, qualifyall positive results for affected samples as “J-” and allnon-detected results as “UJ” or “R” based uponprofessional judgement.
List sample ID(s): NA
1.2.3 If technical holding times are greatly exceeded (> 2xthe time requirement) upon analysis or re-analysis thenthe validator may use professional judgement to qualifyall non-detected compounds as “J” or “R” based uponprofessional judgement and on DQOs.
List sample ID(s): NA
1.2 Technical Holding Times - Semi-Volatile Organic Compounds
1.2.4 If technical holding times are exceeded (Table 1),qualify all positive results for affected samples as “J-”and all non-detected results as “UJ.”
List sample ID(s): NA
1.2.5 If technical holding times are greatly exceeded (> 2xthe time requirement), based on the project’s DQOs,the validator may use professional judgement to qualifyall non-detected compounds as “R” and all positiveresults as “J-.”
List sample ID(s): NA
1.2 Technical Holding Times - Inorganic Compounds
1.2.6 Are samples properly preserved (4°C for solids; acidpreservation for aqueous samples)? Checkpreservation requirements, chain of custody, andsample receipt form for discrepancies.
Action: Note any impropriety, and use the information toqualify results.
List impropriety(-ies):
Yes. TCLP samples were not preserved. All other sampleswere chilled to 6°C. This is acceptable.
Data Validation PRF - Tier I Page 8Version 3.0, January 9, 2006
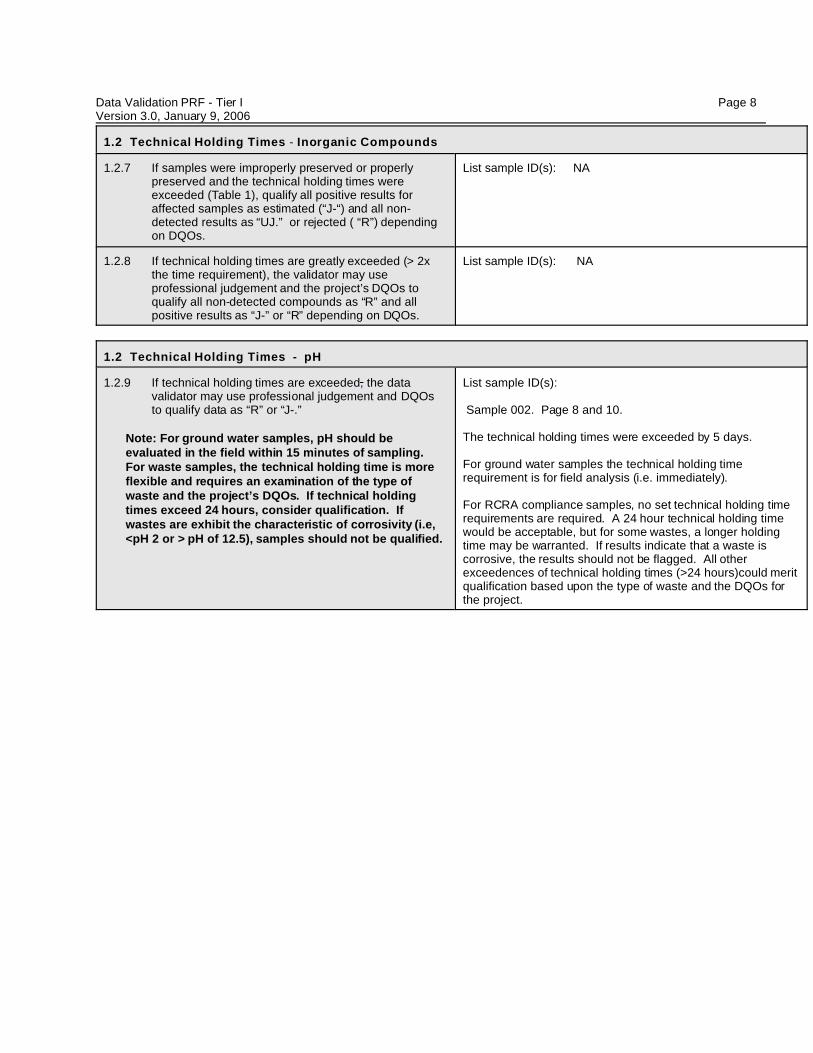
1.2 Technical Holding Times - Inorganic Compounds
1.2.7 If samples were improperly preserved or properlypreserved and the technical holding times wereexceeded (Table 1), qualify all positive results foraffected samples as estimated (“J-“) and all non-detected results as “UJ.” or rejected ( “R”) dependingon DQOs.
List sample ID(s): NA
1.2.8 If technical holding times are greatly exceeded (> 2xthe time requirement), the validator may useprofessional judgement and the project’s DQOs toqualify all non-detected compounds as “R” and allpositive results as “J-” or “R” depending on DQOs.
List sample ID(s): NA
1.2 Technical Holding Times - pH
1.2.9 If technical holding times are exceeded, the datavalidator may use professional judgement and DQOsto qualify data as “R” or “J-.”
Note: For ground water samples, pH should beevaluated in the field within 15 minutes of sampling. For waste samples, the technical holding time is moreflexible and requires an examination of the type ofwaste and the project’s DQOs. If technical holdingtimes exceed 24 hours, consider qualification. Ifwastes are exhibit the characteristic of corrosivity (i.e,<pH 2 or > pH of 12.5), samples should not be qualified.
List sample ID(s):
Sample 002. Page 8 and 10.
The technical holding times were exceeded by 5 days.
For ground water samples the technical holding timerequirement is for field analysis (i.e. immediately).
For RCRA compliance samples, no set technical holding timerequirements are required. A 24 hour technical holding timewould be acceptable, but for some wastes, a longer holdingtime may be warranted. If results indicate that a waste iscorrosive, the results should not be flagged. All otherexceedences of technical holding times (>24 hours)could meritqualification based upon the type of waste and the DQOs forthe project.
Data Validation PRF - Tier I Page 9Version 3.0, January 9, 2006
Section 2.0VOC Data Validation
Data Validation PRF - Tier I Page 10Version 3.0, January 9, 2006
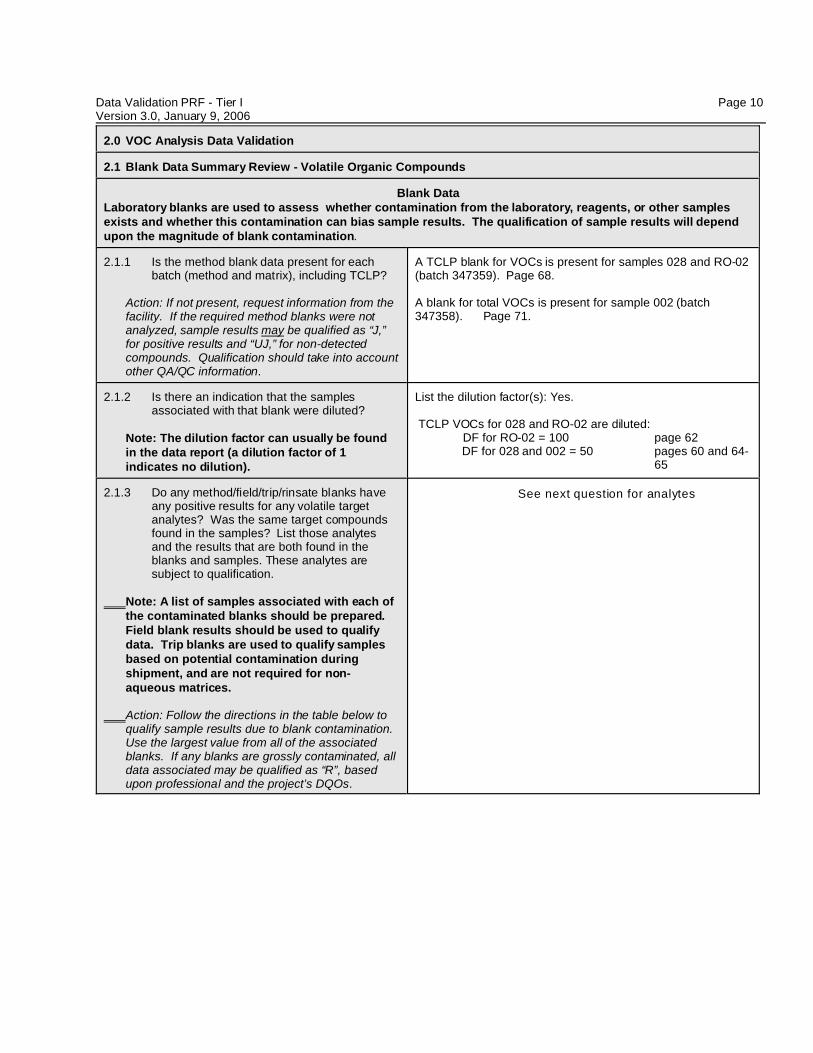
2.0 VOC Analysis Data Validation
2.1 Blank Data Summary Review - Volatile Organic Compounds
Blank DataLaboratory blanks are used to assess whether contamination from the laboratory, reagents, or other samplesexists and whether this contamination can bias sample results. The qualification of sample results will dependupon the magnitude of blank contamination.
2.1.1 Is the method blank data present for eachbatch (method and matrix), including TCLP?
Action: If not present, request information from thefacility. If the required method blanks were notanalyzed, sample results may be qualified as “J,”for positive results and “UJ,” for non-detectedcompounds. Qualification should take into accountother QA/QC information.
A TCLP blank for VOCs is present for samples 028 and RO-02(batch 347359). Page 68.
A blank for total VOCs is present for sample 002 (batch347358). Page 71.
2.1.2 Is there an indication that the samplesassociated with that blank were diluted?
Note: The dilution factor can usually be foundin the data report (a dilution factor of 1indicates no dilution).
List the dilution factor(s): Yes.
TCLP VOCs for 028 and RO-02 are diluted:DF for RO-02 = 100 page 62
DF for 028 and 002 = 50 pages 60 and 64-65
2.1.3 Do any method/field/trip/rinsate blanks haveany positive results for any volatile targetanalytes? Was the same target compoundsfound in the samples? List those analytesand the results that are both found in theblanks and samples. These analytes aresubject to qualification.
Note: A list of samples associated with each ofthe contaminated blanks should be prepared. Field blank results should be used to qualifydata. Trip blanks are used to qualify samplesbased on potential contamination duringshipment, and are not required for non-aqueous matrices.
Action: Follow the directions in the table below toqualify sample results due to blank contamination. Use the largest value from all of the associatedblanks. If any blanks are grossly contaminated, alldata associated may be qualified as “R”, basedupon professional and the project’s DQOs.
See next question for analytes
Data Validation PRF - Tier I Page 11Version 3.0, January 9, 2006
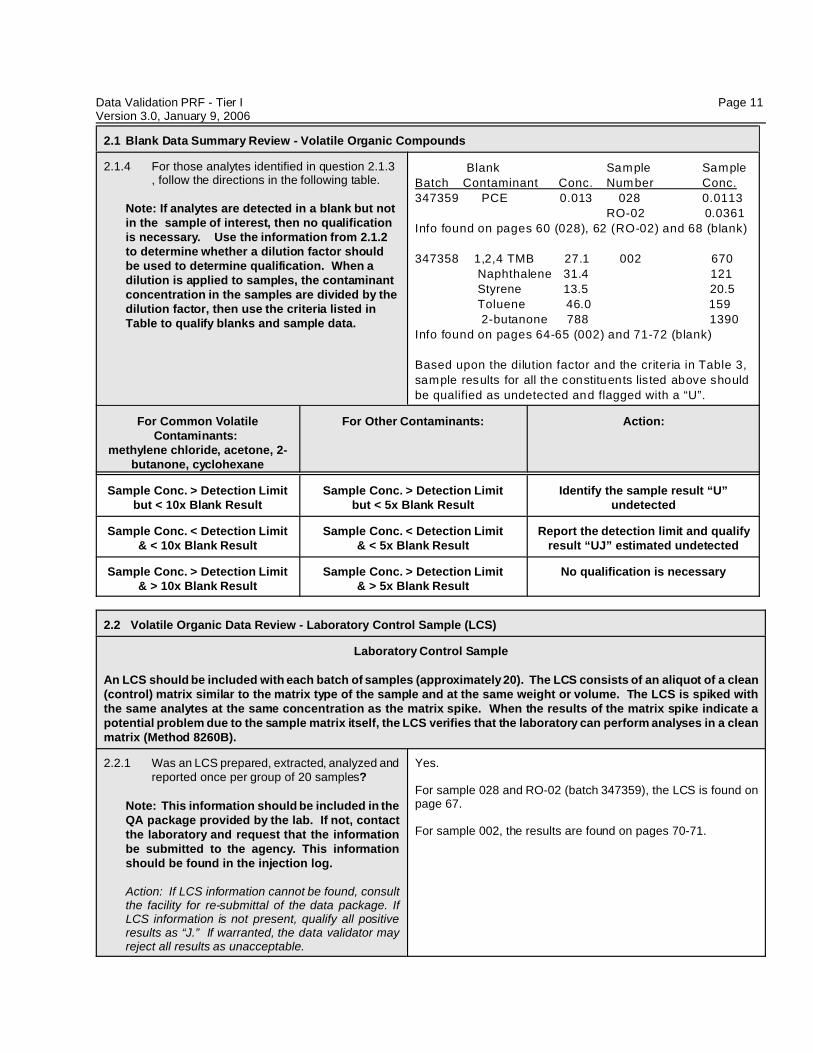
2.1 Blank Data Summary Review - Volatile Organic Compounds
2.1.4 For those analytes identified in question 2.1.3, follow the directions in the following table.
Note: If analytes are detected in a blank but notin the sample of interest, then no qualificationis necessary. Use the information from 2.1.2to determine whether a dilution factor shouldbe used to determine qualification. When adilution is applied to samples, the contaminantconcentration in the samples are divided by thedilution factor, then use the criteria listed inTable to qualify blanks and sample data.
Blank Sample Sample
Batch Contaminant Conc. Number Conc.
347359 PCE 0.013 028 0.0113
RO-02 0.0361
Info found on pages 60 (028), 62 (RO-02) and 68 (blank)
347358 1,2,4 TMB 27.1 002 670
Naphthalene 31.4 121
Styrene 13.5 20.5
Toluene 46.0 159
2-butanone 788 1390
Info found on pages 64-65 (002) and 71-72 (blank)
Based upon the dilution factor and the criteria in Table 3,
sample results for all the constituents lis ted above should
be qualified as undetected and flagged with a “U”.
For Common VolatileContaminants:
methylene chloride, acetone, 2-butanone, cyclohexane
For Other Contaminants: Action:
Sample Conc. > Detection Limitbut < 10x Blank Result
Sample Conc. > Detection Limitbut < 5x Blank Result
Identify the sample result “U”undetected
Sample Conc. < Detection Limit& < 10x Blank Result
Sample Conc. < Detection Limit& < 5x Blank Result
Report the detection limit and qualifyresult “UJ” estimated undetected
Sample Conc. > Detection Limit& > 10x Blank Result
Sample Conc. > Detection Limit& > 5x Blank Result
No qualification is necessary
2.2 Volatile Organic Data Review - Laboratory Control Sample (LCS)
Laboratory Control Sample
An LCS should be included with each batch of samples (approximately 20). The LCS consists of an aliquot of a clean(control) matrix similar to the matrix type of the sample and at the same weight or volume. The LCS is spiked withthe same analytes at the same concentration as the matrix spike. When the results of the matrix spike indicate apotential problem due to the sample matrix itself, the LCS verifies that the laboratory can perform analyses in a cleanmatrix (Method 8260B).
2.2.1 Was an LCS prepared, extracted, analyzed andreported once per group of 20 samples?
Note: This information should be included in theQA package provided by the lab. If not, contactthe laboratory and request that the informationbe submitted to the agency. This informationshould be found in the injection log.
Action: If LCS information cannot be found, consultthe facility for re-submittal of the data package. IfLCS information is not present, qualify all positiveresults as “J.” If warranted, the data validator mayreject all results as unacceptable.
Yes.
For sample 028 and RO-02 (batch 347359), the LCS is found onpage 67.
For sample 002, the results are found on pages 70-71.
Data Validation PRF - Tier I Page 12Version 3.0, January 9, 2006
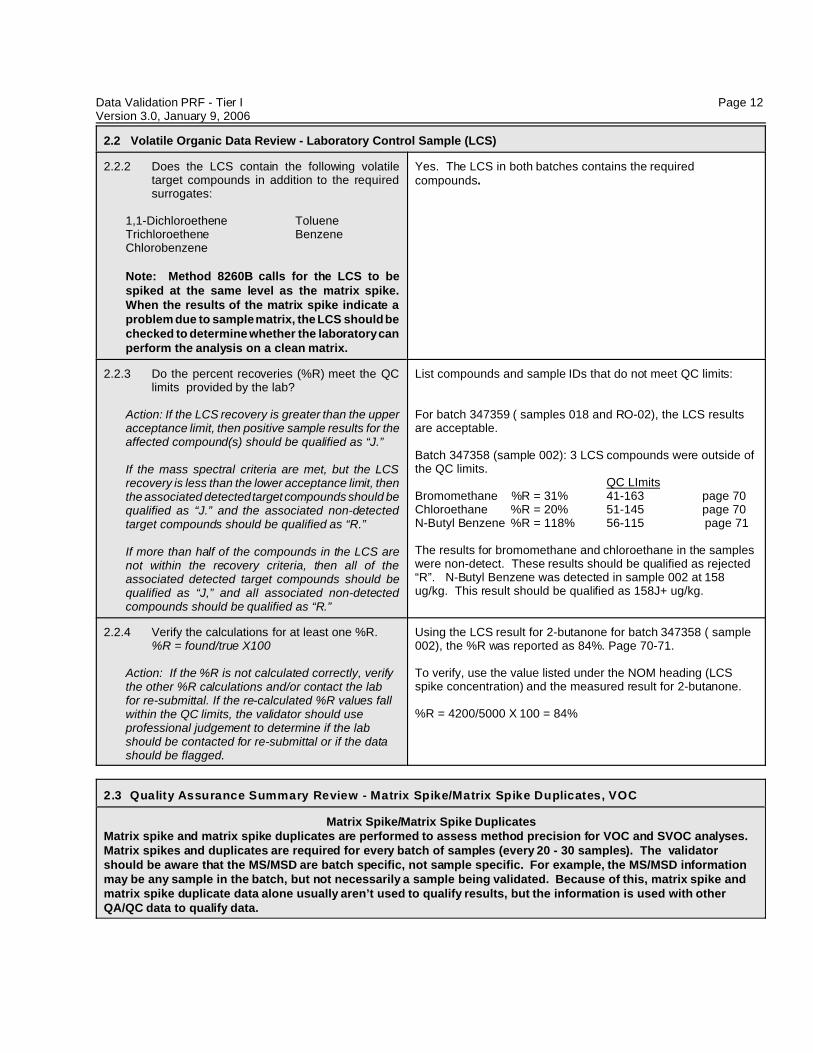
2.2 Volatile Organic Data Review - Laboratory Control Sample (LCS)
2.2.2 Does the LCS contain the following volatiletarget compounds in addition to the requiredsurrogates:
1,1-Dichloroethene TolueneTrichloroethene BenzeneChlorobenzene
Note: Method 8260B calls for the LCS to bespiked at the same level as the matrix spike.When the results of the matrix spike indicate aproblem due to sample matrix, the LCS should bechecked to determine whether the laboratory canperform the analysis on a clean matrix.
Yes. The LCS in both batches contains the requiredcompounds.
2.2.3 Do the percent recoveries (%R) meet the QClimits provided by the lab?
Action: If the LCS recovery is greater than the upperacceptance limit, then positive sample results for theaffected compound(s) should be qualified as “J.”
If the mass spectral criteria are met, but the LCSrecovery is less than the lower acceptance limit, thenthe associated detected target compounds should bequalified as “J.” and the associated non-detectedtarget compounds should be qualified as “R.”
If more than half of the compounds in the LCS arenot within the recovery criteria, then all of theassociated detected target compounds should bequalified as “J,” and all associated non-detectedcompounds should be qualified as “R.”
List compounds and sample IDs that do not meet QC limits:
For batch 347359 ( samples 018 and RO-02), the LCS resultsare acceptable.
Batch 347358 (sample 002): 3 LCS compounds were outside ofthe QC limits.
QC LImitsBromomethane %R = 31% 41-163 page 70Chloroethane %R = 20% 51-145 page 70N-Butyl Benzene %R = 118% 56-115 page 71
The results for bromomethane and chloroethane in the sampleswere non-detect. These results should be qualified as rejected“R”. N-Butyl Benzene was detected in sample 002 at 158ug/kg. This result should be qualified as 158J+ ug/kg.
2.2.4 Verify the calculations for at least one %R.%R = found/true X100
Action: If the %R is not calculated correctly, verifythe other %R calculations and/or contact the labfor re-submittal. If the re-calculated %R values fallwithin the QC limits, the validator should useprofessional judgement to determine if the labshould be contacted for re-submittal or if the datashould be flagged.
Using the LCS result for 2-butanone for batch 347358 ( sample002), the %R was reported as 84%. Page 70-71.
To verify, use the value listed under the NOM heading (LCSspike concentration) and the measured result for 2-butanone.
%R = 4200/5000 X 100 = 84%
2.3 Quality Assurance Summary Review - Matrix Spike/Matrix Spike Duplicates, VOC
Matrix Spike/Matrix Spike DuplicatesMatrix spike and matrix spike duplicates are performed to assess method precision for VOC and SVOC analyses. Matrix spikes and duplicates are required for every batch of samples (every 20 - 30 samples). The validatorshould be aware that the MS/MSD are batch specific, not sample specific. For example, the MS/MSD informationmay be any sample in the batch, but not necessarily a sample being validated. Because of this, matrix spike andmatrix spike duplicate data alone usually aren’t used to qualify results, but the information is used with otherQA/QC data to qualify data.
Data Validation PRF - Tier I Page 13Version 3.0, January 9, 2006
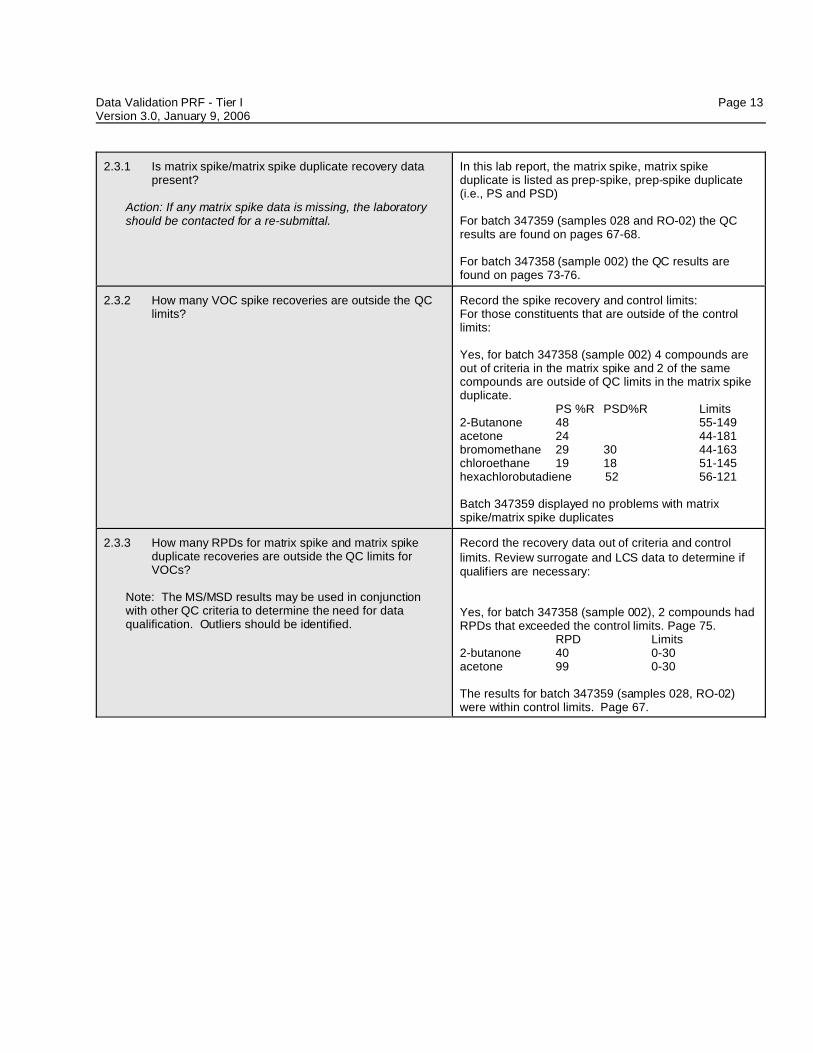
2.3.1 Is matrix spike/matrix spike duplicate recovery datapresent?
Action: If any matrix spike data is missing, the laboratoryshould be contacted for a re-submittal.
In this lab report, the matrix spike, matrix spikeduplicate is listed as prep-spike, prep-spike duplicate(i.e., PS and PSD)
For batch 347359 (samples 028 and RO-02) the QCresults are found on pages 67-68.
For batch 347358 (sample 002) the QC results arefound on pages 73-76.
2.3.2 How many VOC spike recoveries are outside the QClimits?
Record the spike recovery and control limits:For those constituents that are outside of the controllimits:
Yes, for batch 347358 (sample 002) 4 compounds areout of criteria in the matrix spike and 2 of the samecompounds are outside of QC limits in the matrix spikeduplicate.
PS %R PSD%R Limits2-Butanone 48 55-149acetone 24 44-181bromomethane 29 30 44-163chloroethane 19 18 51-145hexachlorobutadiene 52 56-121
Batch 347359 displayed no problems with matrixspike/matrix spike duplicates
2.3.3 How many RPDs for matrix spike and matrix spikeduplicate recoveries are outside the QC limits forVOCs?
Note: The MS/MSD results may be used in conjunctionwith other QC criteria to determine the need for dataqualification. Outliers should be identified.
Record the recovery data out of criteria and controllimits. Review surrogate and LCS data to determine ifqualifiers are necessary:
Yes, for batch 347358 (sample 002), 2 compounds hadRPDs that exceeded the control limits. Page 75.
RPD Limits2-butanone 40 0-30acetone 99 0-30
The results for batch 347359 (samples 028, RO-02)were within control limits. Page 67.
Data Validation PRF - Tier I Page 14Version 3.0, January 9, 2006
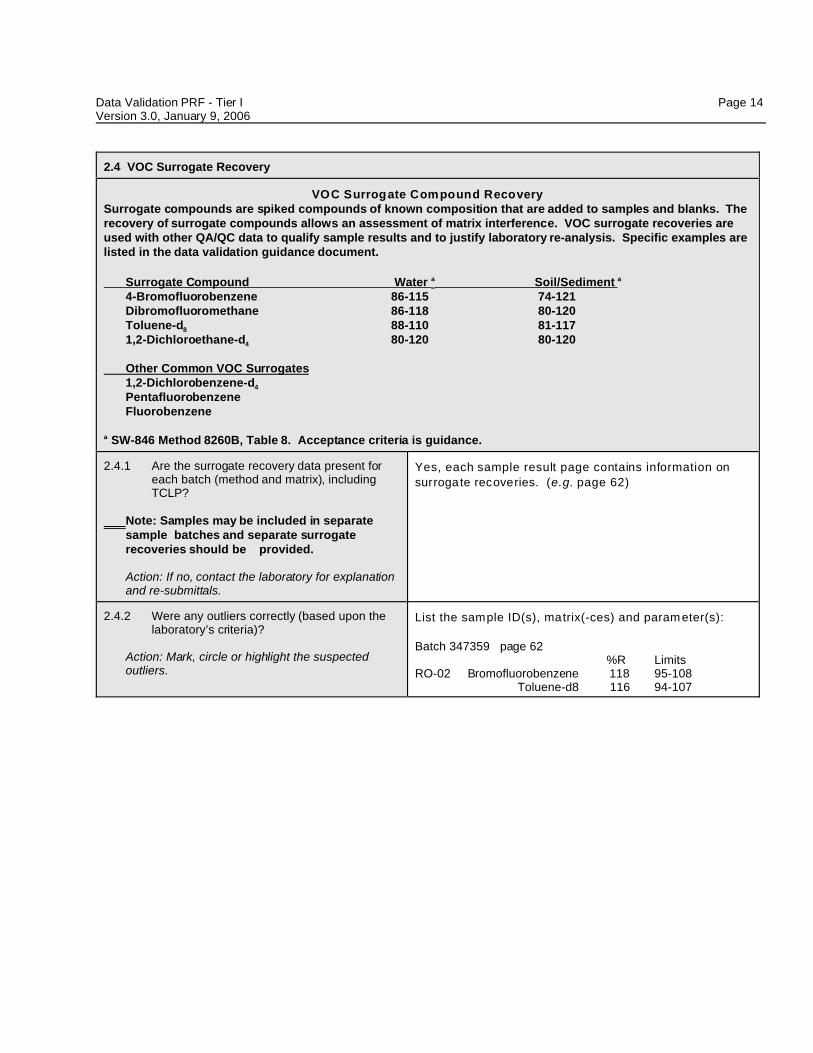
2.4 VOC Surrogate Recovery
VOC Surrogate Compound RecoverySurrogate compounds are spiked compounds of known composition that are added to samples and blanks. Therecovery of surrogate compounds allows an assessment of matrix interference. VOC surrogate recoveries areused with other QA/QC data to qualify sample results and to justify laboratory re-analysis. Specific examples arelisted in the data validation guidance document.
Surrogate Compound Water a Soil/Sediment a
4-Bromofluorobenzene 86-115 74-121 Dibromofluoromethane 86-118 80-120 Toluene-d8 88-110 81-117 1,2-Dichloroethane-d4 80-120 80-120
Other Common VOC Surrogates1,2-Dichlorobenzene-d4
Pentafluorobenzene Fluorobenzene
a SW-846 Method 8260B, Table 8. Acceptance criteria is guidance.
2.4.1 Are the surrogate recovery data present foreach batch (method and matrix), includingTCLP?
Note: Samples may be included in separatesample batches and separate surrogaterecoveries should be provided.
Action: If no, contact the laboratory for explanationand re-submittals.
Yes, each sample result page contains information on
surrogate recoveries. (e.g. page 62)
2.4.2 Were any outliers correctly (based upon thelaboratory’s criteria)?
Action: Mark, circle or highlight the suspectedoutliers.
List the sample ID(s), matrix(-ces) and param eter(s):
Batch 347359 page 62%R Limits
RO-02 Bromofluorobenzene 118 95-108 Toluene-d8 116 94-107
Data Validation PRF - Tier I Page 15Version 3.0, January 9, 2006
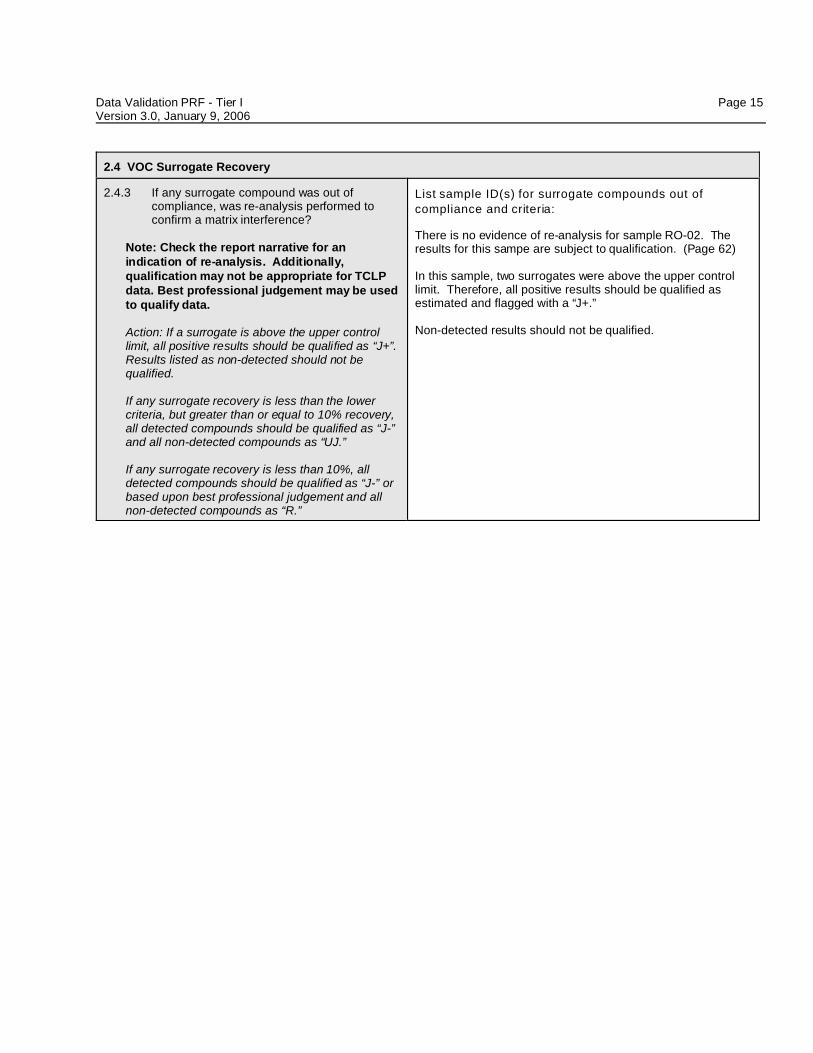
2.4 VOC Surrogate Recovery
2.4.3 If any surrogate compound was out ofcompliance, was re-analysis performed toconfirm a matrix interference?
Note: Check the report narrative for anindication of re-analysis. Additionally,qualification may not be appropriate for TCLPdata. Best professional judgement may be usedto qualify data.
Action: If a surrogate is above the upper controllimit, all positive results should be qualified as “J+”.Results listed as non-detected should not bequalified.
If any surrogate recovery is less than the lowercriteria, but greater than or equal to 10% recovery,all detected compounds should be qualified as “J-”and all non-detected compounds as “UJ.”
If any surrogate recovery is less than 10%, alldetected compounds should be qualified as “J-” orbased upon best professional judgement and allnon-detected compounds as “R.”
List sample ID(s) for surrogate compounds out of
compliance and criteria:
There is no evidence of re-analysis for sample RO-02. Theresults for this sampe are subject to qualification. (Page 62)
In this sample, two surrogates were above the upper controllimit. Therefore, all positive results should be qualified asestimated and flagged with a “J+.”
Non-detected results should not be qualified.
Data Validation PRF - Tier I Page 16Version 3.0, January 9, 2006
Section 4.0Metals Data Validation
Data Validation PRF - Tier I Page 17Version 3.0, January 9, 2006
4.0 Metals Analysis Data Validation
4.1 Blank Data Summary Review - Metals Data
Blank Data Laboratory blanks are used to assess whether contamination from the laboratory, reagents, or other samplesexists and whether this contamination can bias sample results. The qualification of sample results will dependupon the magnitude of blank contamination.
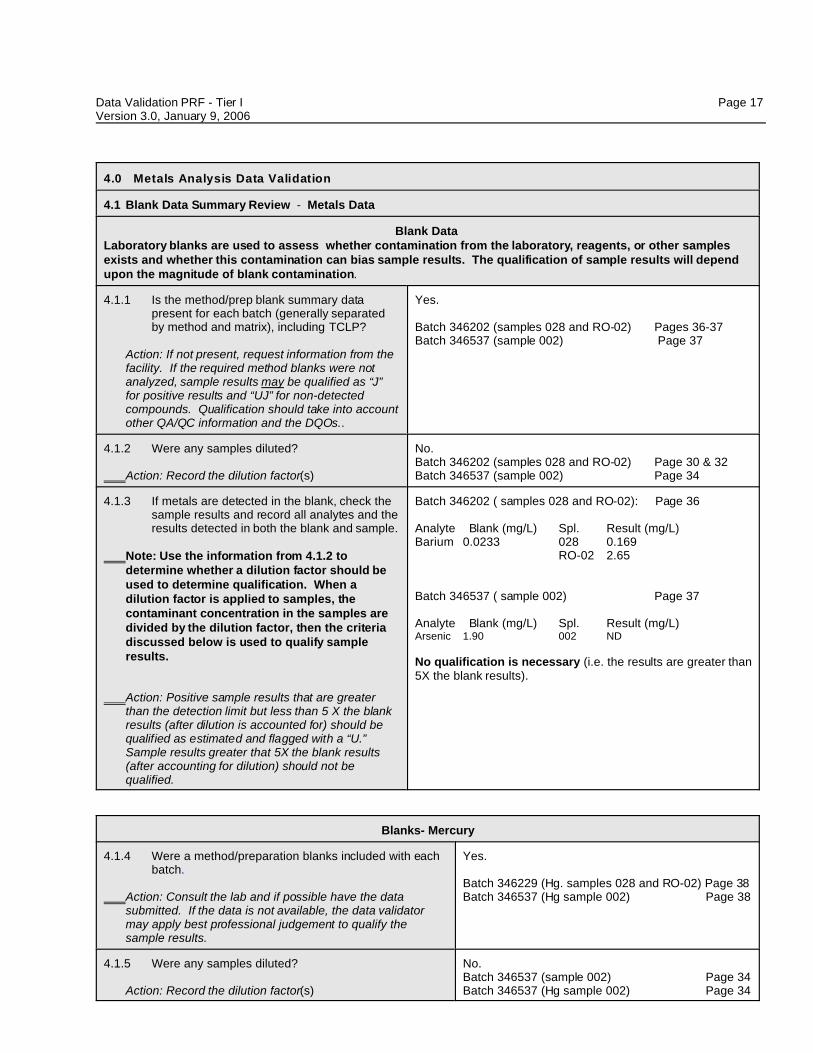
4.1.1 Is the method/prep blank summary datapresent for each batch (generally separatedby method and matrix), including TCLP?
Action: If not present, request information from thefacility. If the required method blanks were notanalyzed, sample results may be qualified as “J”for positive results and “UJ” for non-detectedcompounds. Qualification should take into accountother QA/QC information and the DQOs..
Yes.
Batch 346202 (samples 028 and RO-02) Pages 36-37Batch 346537 (sample 002) Page 37
4.1.2 Were any samples diluted?
Action: Record the dilution factor(s)
No.Batch 346202 (samples 028 and RO-02) Page 30 & 32 Batch 346537 (sample 002) Page 34
4.1.3 If metals are detected in the blank, check thesample results and record all analytes and theresults detected in both the blank and sample.
Note: Use the information from 4.1.2 todetermine whether a dilution factor should beused to determine qualification. When adilution factor is applied to samples, thecontaminant concentration in the samples aredivided by the dilution factor, then the criteriadiscussed below is used to qualify sampleresults.
Action: Positive sample results that are greaterthan the detection limit but less than 5 X the blankresults (after dilution is accounted for) should bequalified as estimated and flagged with a “U.” Sample results greater that 5X the blank results(after accounting for dilution) should not bequalified.
Batch 346202 ( samples 028 and RO-02): Page 36
Analyte Blank (mg/L) Spl. Result (mg/L)Barium 0.0233 028 0.169
RO-02 2.65
Batch 346537 ( sample 002) Page 37
Analyte Blank (mg/L) Spl. Result (mg/L)Arsenic 1.90 002 ND
No qualification is necessary (i.e. the results are greater than5X the blank results).
Blanks- Mercury
4.1.4 Were a method/preparation blanks included with eachbatch.
Action: Consult the lab and if possible have the datasubmitted. If the data is not available, the data validatormay apply best professional judgement to qualify thesample results.
Yes.
Batch 346229 (Hg. samples 028 and RO-02) Page 38Batch 346537 (Hg sample 002) Page 38
4.1.5 Were any samples diluted?
Action: Record the dilution factor(s)
No.Batch 346537 (sample 002) Page 34Batch 346537 (Hg sample 002) Page 34
Data Validation PRF - Tier I Page 18Version 3.0, January 9, 2006
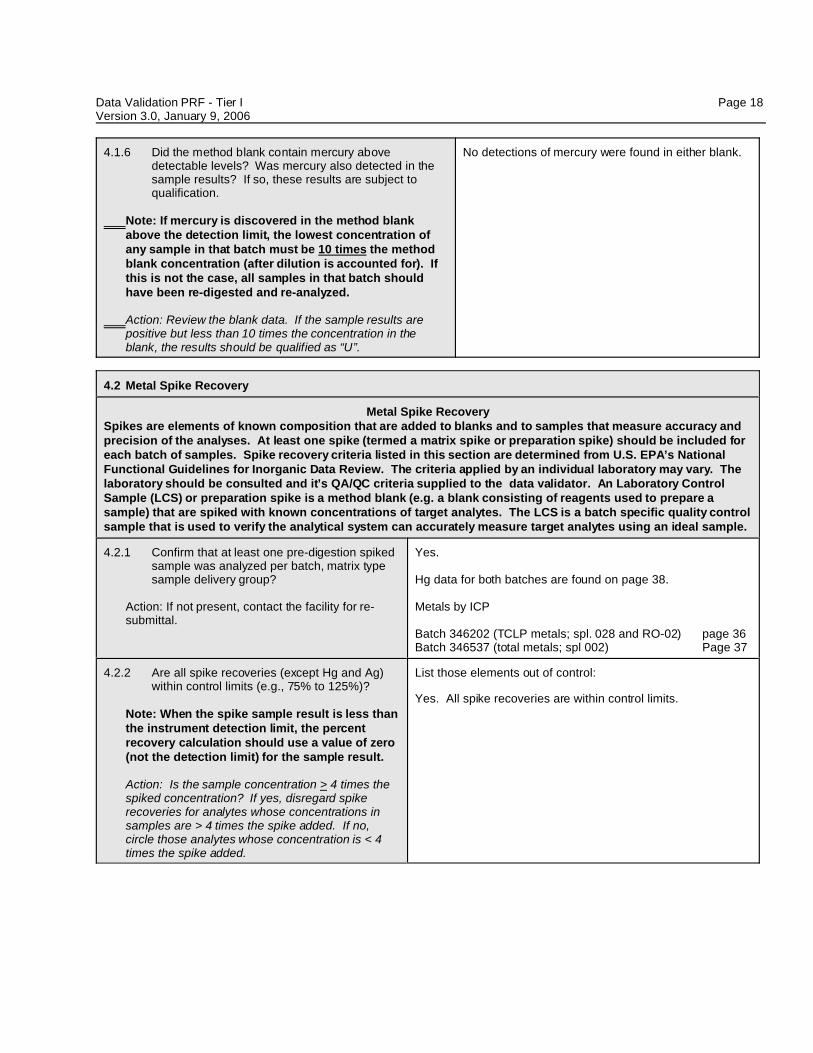
4.1.6 Did the method blank contain mercury abovedetectable levels? Was mercury also detected in thesample results? If so, these results are subject toqualification.
Note: If mercury is discovered in the method blankabove the detection limit, the lowest concentration ofany sample in that batch must be 10 times the methodblank concentration (after dilution is accounted for). Ifthis is not the case, all samples in that batch shouldhave been re-digested and re-analyzed.
Action: Review the blank data. If the sample results arepositive but less than 10 times the concentration in theblank, the results should be qualified as “U”.
No detections of mercury were found in either blank.
4.2 Metal Spike Recovery
Metal Spike RecoverySpikes are elements of known composition that are added to blanks and to samples that measure accuracy andprecision of the analyses. At least one spike (termed a matrix spike or preparation spike) should be included foreach batch of samples. Spike recovery criteria listed in this section are determined from U.S. EPA’s NationalFunctional Guidelines for Inorganic Data Review. The criteria applied by an individual laboratory may vary. Thelaboratory should be consulted and it’s QA/QC criteria supplied to the data validator. An Laboratory ControlSample (LCS) or preparation spike is a method blank (e.g. a blank consisting of reagents used to prepare asample) that are spiked with known concentrations of target analytes. The LCS is a batch specific quality controlsample that is used to verify the analytical system can accurately measure target analytes using an ideal sample.
4.2.1 Confirm that at least one pre-digestion spiked sample was analyzed per batch, matrix typesample delivery group?
Action: If not present, contact the facility for re-submittal.
Yes.
Hg data for both batches are found on page 38.
Metals by ICP
Batch 346202 (TCLP metals; spl. 028 and RO-02) page 36Batch 346537 (total metals; spl 002) Page 37
4.2.2 Are all spike recoveries (except Hg and Ag)within control limits (e.g., 75% to 125%)?
Note: When the spike sample result is less thanthe instrument detection limit, the percentrecovery calculation should use a value of zero(not the detection limit) for the sample result.
Action: Is the sample concentration > 4 times thespiked concentration? If yes, disregard spikerecoveries for analytes whose concentrations insamples are > 4 times the spike added. If no,circle those analytes whose concentration is < 4times the spike added.
List those elements out of control:
Yes. All spike recoveries are within control limits.
Data Validation PRF - Tier I Page 19Version 3.0, January 9, 2006
4.2 Metal Spike Recovery
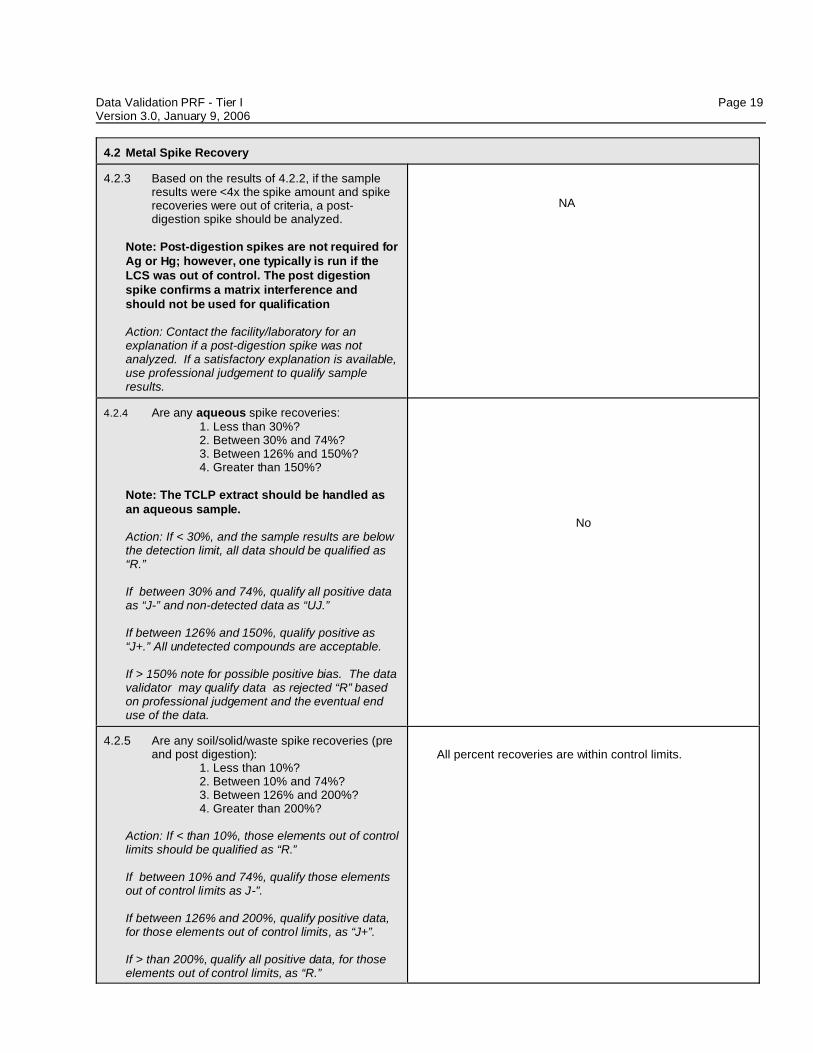
4.2.3 Based on the results of 4.2.2, if the sampleresults were <4x the spike amount and spikerecoveries were out of criteria, a post-digestion spike should be analyzed.
Note: Post-digestion spikes are not required forAg or Hg; however, one typically is run if theLCS was out of control. The post digestionspike confirms a matrix interference andshould not be used for qualification
Action: Contact the facility/laboratory for anexplanation if a post-digestion spike was notanalyzed. If a satisfactory explanation is available,use professional judgement to qualify sampleresults.
NA
4.2.4 Are any aqueous spike recoveries:1. Less than 30%?2. Between 30% and 74%?3. Between 126% and 150%?4. Greater than 150%?
Note: The TCLP extract should be handled asan aqueous sample.
Action: If < 30%, and the sample results are belowthe detection limit, all data should be qualified as“R.”
If between 30% and 74%, qualify all positive dataas “J-” and non-detected data as “UJ.”
If between 126% and 150%, qualify positive as“J+.” All undetected compounds are acceptable.
If > 150% note for possible positive bias. The datavalidator may qualify data as rejected “R” basedon professional judgement and the eventual enduse of the data.
No
4.2.5 Are any soil/solid/waste spike recoveries (preand post digestion):
1. Less than 10%?2. Between 10% and 74%?3. Between 126% and 200%?4. Greater than 200%?
Action: If < than 10%, those elements out of controllimits should be qualified as “R.”
If between 10% and 74%, qualify those elementsout of control limits as J-”.
If between 126% and 200%, qualify positive data,for those elements out of control limits, as “J+”.
If > than 200%, qualify all positive data, for thoseelements out of control limits, as “R.”
All percent recoveries are within control limits.
Data Validation PRF - Tier I Page 20Version 3.0, January 9, 2006
4.2 Metal Spike Recovery
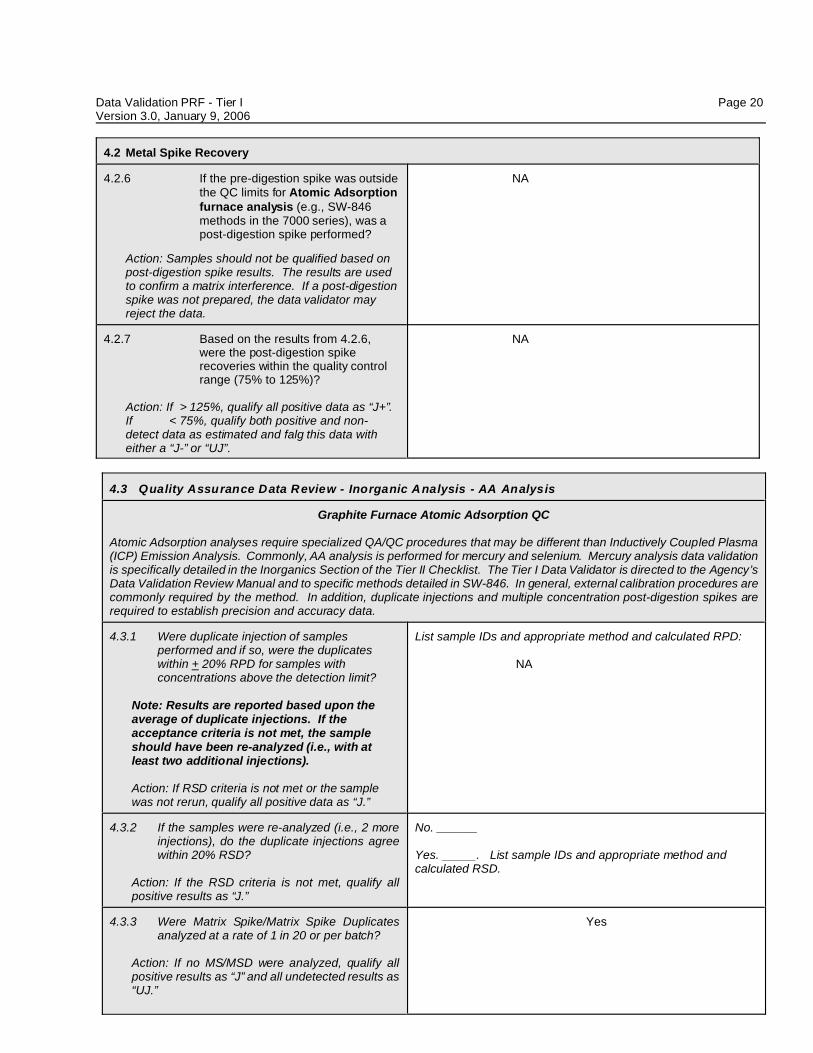
4.2.6 If the pre-digestion spike was outsidethe QC limits for Atomic Adsorptionfurnace analysis (e.g., SW-846methods in the 7000 series), was apost-digestion spike performed?
Action: Samples should not be qualified based onpost-digestion spike results. The results are usedto confirm a matrix interference. If a post-digestionspike was not prepared, the data validator mayreject the data.
NA
4.2.7 Based on the results from 4.2.6,were the post-digestion spikerecoveries within the quality controlrange (75% to 125%)?
Action: If > 125%, qualify all positive data as “J+”. If < 75%, qualify both positive and non-detect data as estimated and falg this data witheither a “J-” or “UJ”.
NA
4.3 Quality Assurance Data Review - Inorganic Analysis - AA Analysis
Graphite Furnace Atomic Adsorption QC
Atomic Adsorption analyses require specialized QA/QC procedures that may be different than Inductively Coupled Plasma(ICP) Emission Analysis. Commonly, AA analysis is performed for mercury and selenium. Mercury analysis data validationis specifically detailed in the Inorganics Section of the Tier II Checklist. The Tier I Data Validator is directed to the Agency’sData Validation Review Manual and to specific methods detailed in SW-846. In general, external calibration procedures arecommonly required by the method. In addition, duplicate injections and multiple concentration post-digestion spikes arerequired to establish precision and accuracy data.
4.3.1 Were duplicate injection of samplesperformed and if so, were the duplicateswithin + 20% RPD for samples withconcentrations above the detection limit?
Note: Results are reported based upon theaverage of duplicate injections. If theacceptance criteria is not met, the sampleshould have been re-analyzed (i.e., with atleast two additional injections).
Action: If RSD criteria is not met or the samplewas not rerun, qualify all positive data as “J.”
List sample IDs and appropriate method and calculated RPD:
NA
4.3.2 If the samples were re-analyzed (i.e., 2 moreinjections), do the duplicate injections agreewithin 20% RSD?
Action: If the RSD criteria is not met, qualify allpositive results as “J.”
No. ______
Yes. _____. List sample IDs and appropriate method andcalculated RSD.
4.3.3 Were Matrix Spike/Matrix Spike Duplicatesanalyzed at a rate of 1 in 20 or per batch?
Action: If no MS/MSD were analyzed, qualify allpositive results as “J” and all undetected results as“UJ.”
Yes
Data Validation PRF - Tier I Page 21Version 3.0, January 9, 2006
Section 5.0Characteristic Tests
Data Validation PRF - Tier I Page 22Version 3.0, January 9, 2006
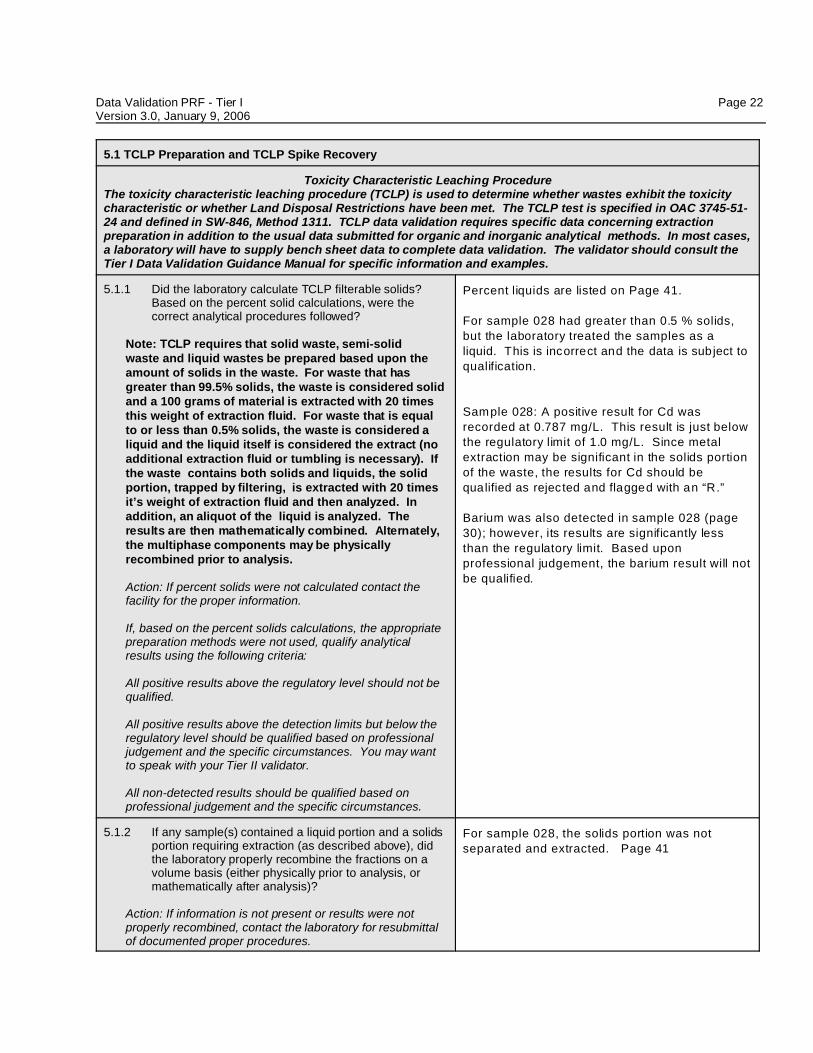
5.1 TCLP Preparation and TCLP Spike Recovery
Toxicity Characteristic Leaching ProcedureThe toxicity characteristic leaching procedure (TCLP) is used to determine whether wastes exhibit the toxicitycharacteristic or whether Land Disposal Restrictions have been met. The TCLP test is specified in OAC 3745-51-24 and defined in SW-846, Method 1311. TCLP data validation requires specific data concerning extractionpreparation in addition to the usual data submitted for organic and inorganic analytical methods. In most cases,a laboratory will have to supply bench sheet data to complete data validation. The validator should consult theTier I Data Validation Guidance Manual for specific information and examples.
5.1.1 Did the laboratory calculate TCLP filterable solids? Based on the percent solid calculations, were thecorrect analytical procedures followed?
Note: TCLP requires that solid waste, semi-solidwaste and liquid wastes be prepared based upon theamount of solids in the waste. For waste that hasgreater than 99.5% solids, the waste is considered solidand a 100 grams of material is extracted with 20 timesthis weight of extraction fluid. For waste that is equalto or less than 0.5% solids, the waste is considered aliquid and the liquid itself is considered the extract (noadditional extraction fluid or tumbling is necessary). Ifthe waste contains both solids and liquids, the solidportion, trapped by filtering, is extracted with 20 timesit’s weight of extraction fluid and then analyzed. Inaddition, an aliquot of the liquid is analyzed. Theresults are then mathematically combined. Alternately,the multiphase components may be physicallyrecombined prior to analysis.
Action: If percent solids were not calculated contact thefacility for the proper information.
If, based on the percent solids calculations, the appropriatepreparation methods were not used, qualify analyticalresults using the following criteria:
All positive results above the regulatory level should not bequalified.
All positive results above the detection limits but below theregulatory level should be qualified based on professionaljudgement and the specific circumstances. You may wantto speak with your Tier II validator.
All non-detected results should be qualified based onprofessional judgement and the specific circumstances.
Percent liquids are listed on Page 41.
For sample 028 had greater than 0.5 % solids,
but the laboratory treated the samples as a
liquid. This is incorrect and the data is subject to
qualification.
Sample 028: A positive result for Cd was
recorded at 0.787 mg/L. This result is just below
the regulatory limit of 1.0 mg/L. Since metal
extraction may be significant in the solids portion
of the waste, the results for Cd should be
qualified as rejected and flagged with an “R.”
Barium was also detected in sample 028 (page
30); however, its results are significantly less
than the regulatory limit. Based upon
professional judgement, the barium result will not
be qualified.
5.1.2 If any sample(s) contained a liquid portion and a solidsportion requiring extraction (as described above), didthe laboratory properly recombine the fractions on avolume basis (either physically prior to analysis, ormathematically after analysis)?
Action: If information is not present or results were notproperly recombined, contact the laboratory for resubmittalof documented proper procedures.
For sample 028, the solids portion was not
separated and extracted. Page 41
Data Validation PRF - Tier I Page 23Version 3.0, January 9, 2006
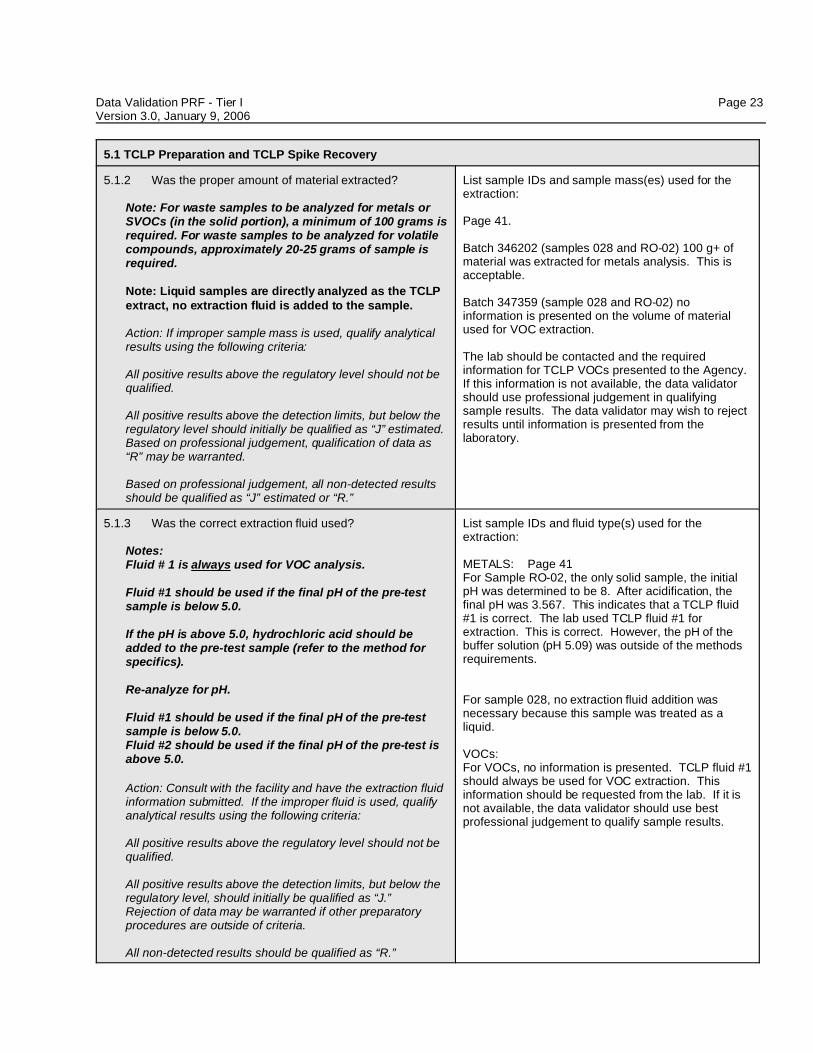
5.1 TCLP Preparation and TCLP Spike Recovery
5.1.2 Was the proper amount of material extracted?
Note: For waste samples to be analyzed for metals orSVOCs (in the solid portion), a minimum of 100 grams isrequired. For waste samples to be analyzed for volatilecompounds, approximately 20-25 grams of sample isrequired.
Note: Liquid samples are directly analyzed as the TCLPextract, no extraction fluid is added to the sample.
Action: If improper sample mass is used, qualify analyticalresults using the following criteria:
All positive results above the regulatory level should not bequalified.
All positive results above the detection limits, but below theregulatory level should initially be qualified as “J” estimated. Based on professional judgement, qualification of data as“R” may be warranted.
Based on professional judgement, all non-detected resultsshould be qualified as “J” estimated or “R.”
List sample IDs and sample mass(es) used for theextraction:
Page 41.
Batch 346202 (samples 028 and RO-02) 100 g+ ofmaterial was extracted for metals analysis. This isacceptable.
Batch 347359 (sample 028 and RO-02) noinformation is presented on the volume of materialused for VOC extraction.
The lab should be contacted and the requiredinformation for TCLP VOCs presented to the Agency. If this information is not available, the data validatorshould use professional judgement in qualifyingsample results. The data validator may wish to rejectresults until information is presented from thelaboratory.
5.1.3 Was the correct extraction fluid used?
Notes: Fluid # 1 is always used for VOC analysis.
Fluid #1 should be used if the final pH of the pre-testsample is below 5.0.
If the pH is above 5.0, hydrochloric acid should beadded to the pre-test sample (refer to the method forspecifics).
Re-analyze for pH.
Fluid #1 should be used if the final pH of the pre-testsample is below 5.0.Fluid #2 should be used if the final pH of the pre-test isabove 5.0.
Action: Consult with the facility and have the extraction fluidinformation submitted. If the improper fluid is used, qualifyanalytical results using the following criteria:
All positive results above the regulatory level should not bequalified.
All positive results above the detection limits, but below the regulatory level, should initially be qualified as “J.” Rejection of data may be warranted if other preparatoryprocedures are outside of criteria.
All non-detected results should be qualified as “R.”
List sample IDs and fluid type(s) used for theextraction:
METALS: Page 41For Sample RO-02, the only solid sample, the initialpH was determined to be 8. After acidification, thefinal pH was 3.567. This indicates that a TCLP fluid#1 is correct. The lab used TCLP fluid #1 forextraction. This is correct. However, the pH of thebuffer solution (pH 5.09) was outside of the methodsrequirements.
For sample 028, no extraction fluid addition wasnecessary because this sample was treated as aliquid.
VOCs: For VOCs, no information is presented. TCLP fluid #1should always be used for VOC extraction. Thisinformation should be requested from the lab. If it isnot available, the data validator should use bestprofessional judgement to qualify sample results.
Data Validation PRF - Tier I Page 24Version 3.0, January 9, 2006
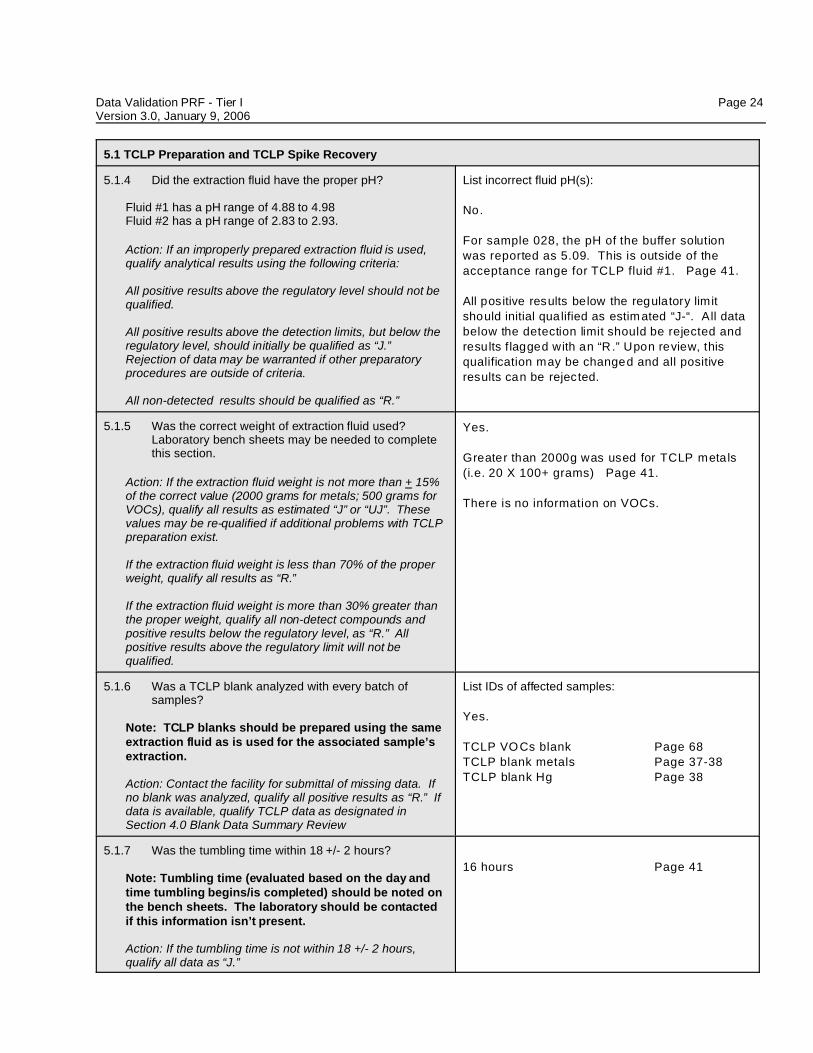
5.1 TCLP Preparation and TCLP Spike Recovery
5.1.4 Did the extraction fluid have the proper pH?
Fluid #1 has a pH range of 4.88 to 4.98Fluid #2 has a pH range of 2.83 to 2.93.
Action: If an improperly prepared extraction fluid is used,qualify analytical results using the following criteria:
All positive results above the regulatory level should not bequalified.
All positive results above the detection limits, but below the regulatory level, should initially be qualified as “J.” Rejection of data may be warranted if other preparatoryprocedures are outside of criteria.
All non-detected results should be qualified as “R.”
List incorrect fluid pH(s):
No.
For sample 028, the pH of the buffer solution
was reported as 5.09. This is outside of the
acceptance range for TCLP fluid #1. Page 41.
All positive results below the regulatory limit
should initial qualified as estim ated “J-“. All data
below the detection limit should be rejected and
results f lagged with an “R .” Upon review, this
qualification may be changed and all positive
results can be rejected.
5.1.5 Was the correct weight of extraction fluid used?Laboratory bench sheets may be needed to completethis section.
Action: If the extraction fluid weight is not more than + 15%of the correct value (2000 grams for metals; 500 grams forVOCs), qualify all results as estimated “J” or “UJ”. Thesevalues may be re-qualified if additional problems with TCLPpreparation exist.
If the extraction fluid weight is less than 70% of the proper weight, qualify all results as “R.”
If the extraction fluid weight is more than 30% greater thanthe proper weight, qualify all non-detect compounds andpositive results below the regulatory level, as “R.” Allpositive results above the regulatory limit will not bequalified.
Yes.
Greater than 2000g was used for TCLP metals
(i.e. 20 X 100+ grams) Page 41.
There is no information on VOCs.
5.1.6 Was a TCLP blank analyzed with every batch ofsamples?
Note: TCLP blanks should be prepared using the sameextraction fluid as is used for the associated sample’sextraction.
Action: Contact the facility for submittal of missing data. Ifno blank was analyzed, qualify all positive results as “R.” Ifdata is available, qualify TCLP data as designated inSection 4.0 Blank Data Summary Review
List IDs of affected samples:
Yes.
TCLP VOCs blank Page 68
TCLP blank metals Page 37-38
TCLP blank Hg Page 38
5.1.7 Was the tumbling time within 18 +/- 2 hours?
Note: Tumbling time (evaluated based on the day andtime tumbling begins/is completed) should be noted onthe bench sheets. The laboratory should be contactedif this information isn’t present.
Action: If the tumbling time is not within 18 +/- 2 hours,qualify all data as “J.”
16 hours Page 41
Data Validation PRF - Tier I Page 25Version 3.0, January 9, 2006
5.1 TCLP Preparation and TCLP Spike Recovery
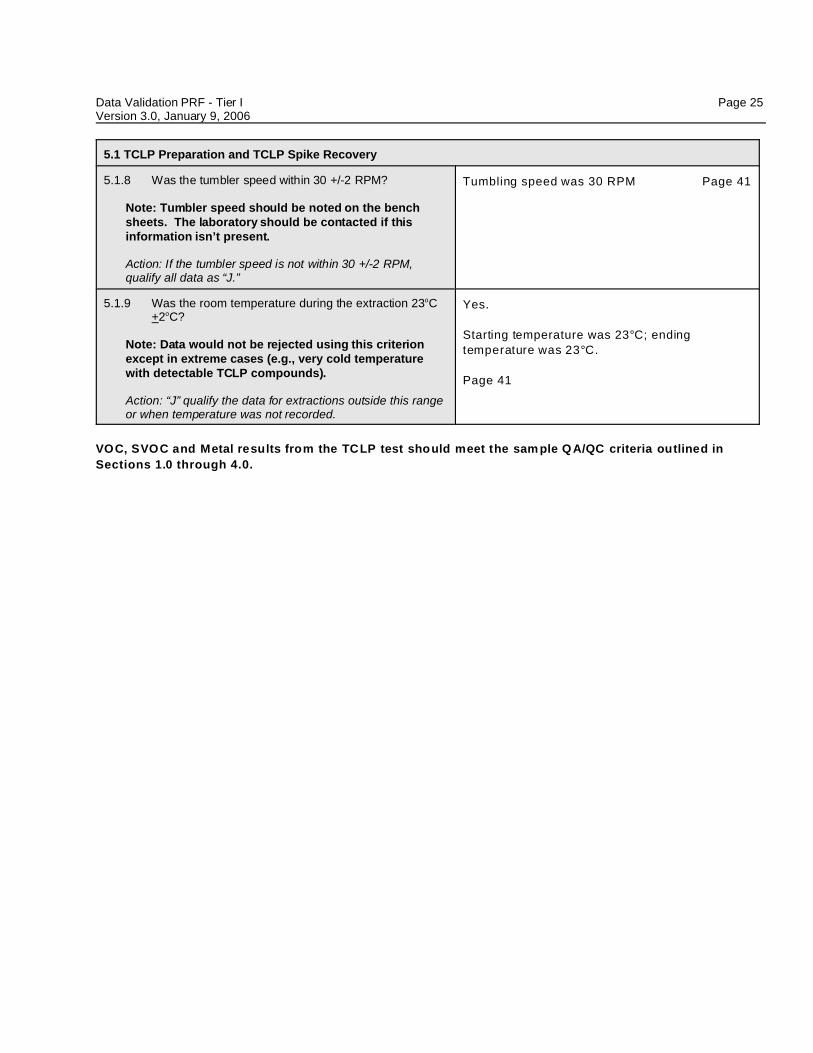
5.1.8 Was the tumbler speed within 30 +/-2 RPM?
Note: Tumbler speed should be noted on the benchsheets. The laboratory should be contacted if thisinformation isn’t present.
Action: If the tumbler speed is not within 30 +/-2 RPM,qualify all data as “J.”
Tumbling speed was 30 RPM Page 41
5.1.9 Was the room temperature during the extraction 23oC+2oC?
Note: Data would not be rejected using this criterionexcept in extreme cases (e.g., very cold temperaturewith detectable TCLP compounds).
Action: “J” qualify the data for extractions outside this rangeor when temperature was not recorded.
Yes.
Starting temperature was 23°C; ending
temperature was 23°C.
Page 41
VOC, SVOC and Metal results from the TCLP test should meet the sam ple QA/QC criteria outlined in
Sections 1.0 through 4.0.
Data Validation PRF - Tier I Page 26Version 3.0, January 9, 2006
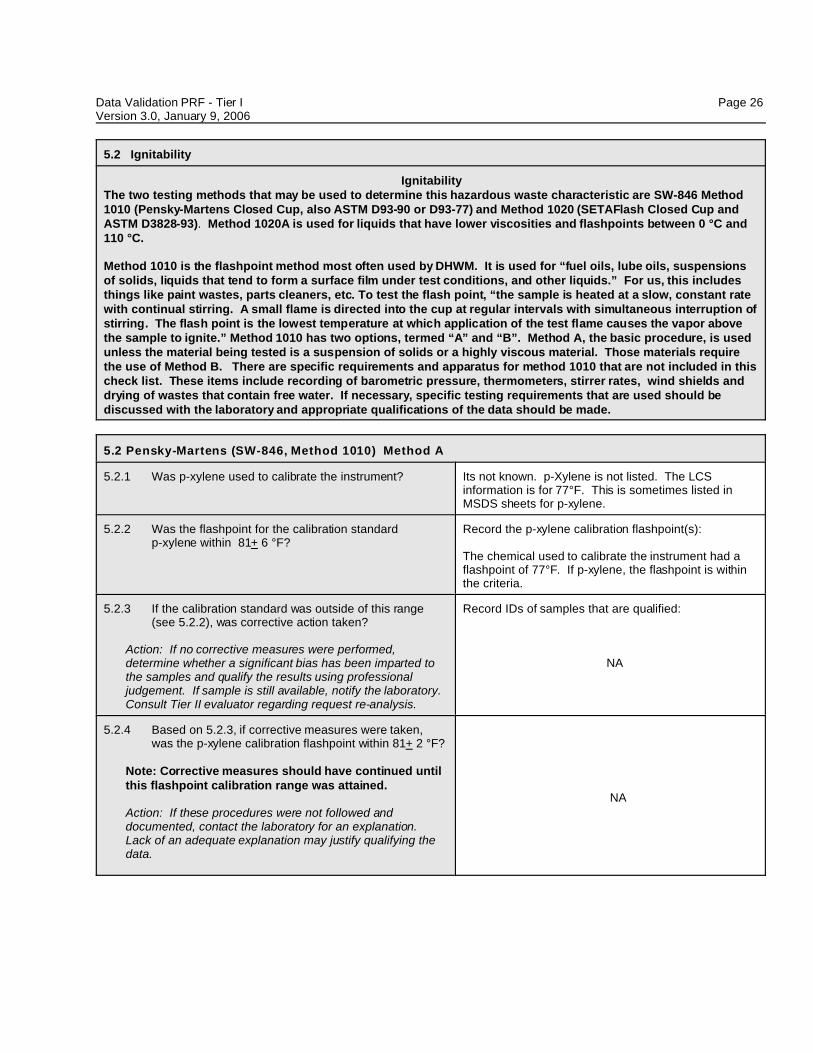
5.2 Ignitability
IgnitabilityThe two testing methods that may be used to determine this hazardous waste characteristic are SW-846 Method1010 (Pensky-Martens Closed Cup, also ASTM D93-90 or D93-77) and Method 1020 (SETAFlash Closed Cup andASTM D3828-93). Method 1020A is used for liquids that have lower viscosities and flashpoints between 0 °C and110 °C.
Method 1010 is the flashpoint method most often used by DHWM. It is used for “fuel oils, lube oils, suspensionsof solids, liquids that tend to form a surface film under test conditions, and other liquids.” For us, this includesthings like paint wastes, parts cleaners, etc. To test the flash point, “the sample is heated at a slow, constant ratewith continual stirring. A small flame is directed into the cup at regular intervals with simultaneous interruption ofstirring. The flash point is the lowest temperature at which application of the test flame causes the vapor abovethe sample to ignite.” Method 1010 has two options, termed “A” and “B”. Method A, the basic procedure, is usedunless the material being tested is a suspension of solids or a highly viscous material. Those materials requirethe use of Method B. There are specific requirements and apparatus for method 1010 that are not included in thischeck list. These items include recording of barometric pressure, thermometers, stirrer rates, wind shields anddrying of wastes that contain free water. If necessary, specific testing requirements that are used should bediscussed with the laboratory and appropriate qualifications of the data should be made.
5.2 Pensky-Martens (SW-846, Method 1010) Method A
5.2.1 Was p-xylene used to calibrate the instrument? Its not known. p-Xylene is not listed. The LCSinformation is for 77°F. This is sometimes listed inMSDS sheets for p-xylene.
5.2.2 Was the flashpoint for the calibration standardp-xylene within 81+ 6 °F?
Record the p-xylene calibration flashpoint(s):
The chemical used to calibrate the instrument had aflashpoint of 77°F. If p-xylene, the flashpoint is withinthe criteria.
5.2.3 If the calibration standard was outside of this range(see 5.2.2), was corrective action taken?
Action: If no corrective measures were performed, determine whether a significant bias has been imparted tothe samples and qualify the results using professionaljudgement. If sample is still available, notify the laboratory. Consult Tier II evaluator regarding request re-analysis.
Record IDs of samples that are qualified:
NA
5.2.4 Based on 5.2.3, if corrective measures were taken,was the p-xylene calibration flashpoint within 81+ 2 °F?
Note: Corrective measures should have continued untilthis flashpoint calibration range was attained.
Action: If these procedures were not followed anddocumented, contact the laboratory for an explanation. Lack of an adequate explanation may justify qualifying thedata.
NA
Data Validation PRF - Tier I Page 27Version 3.0, January 9, 2006
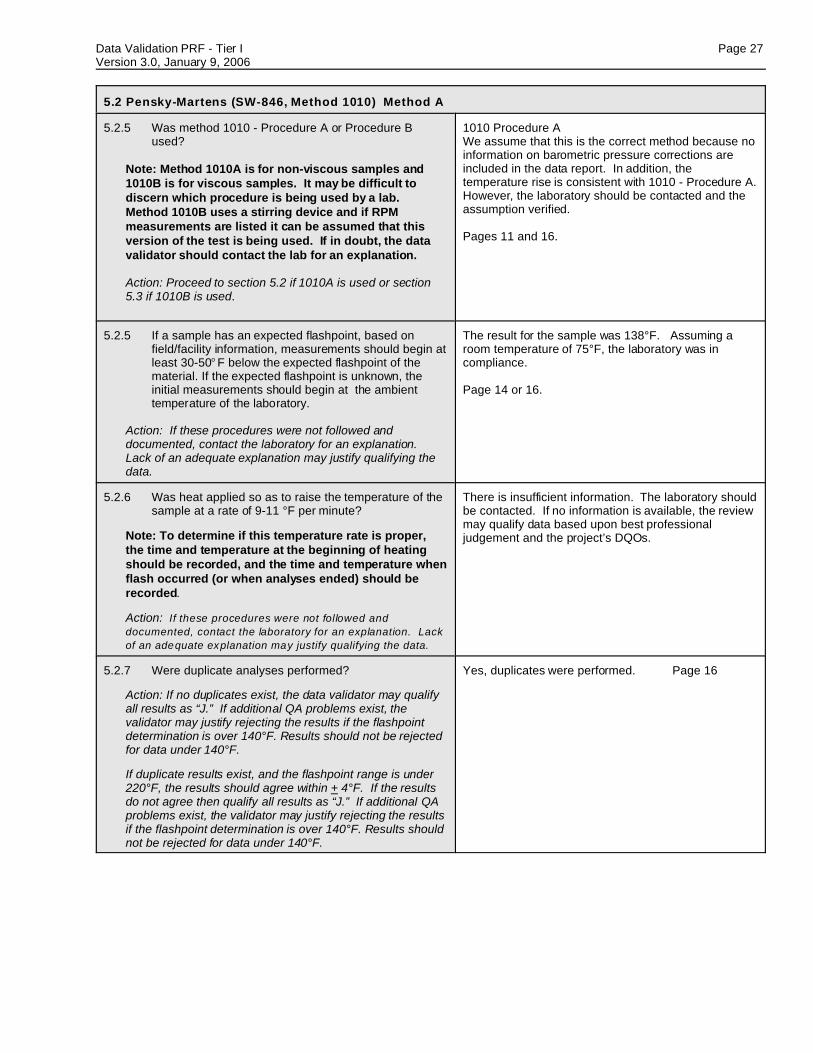
5.2 Pensky-Martens (SW-846, Method 1010) Method A
5.2.5 Was method 1010 - Procedure A or Procedure Bused?
Note: Method 1010A is for non-viscous samples and1010B is for viscous samples. It may be difficult todiscern which procedure is being used by a lab. Method 1010B uses a stirring device and if RPMmeasurements are listed it can be assumed that thisversion of the test is being used. If in doubt, the datavalidator should contact the lab for an explanation.
Action: Proceed to section 5.2 if 1010A is used or section5.3 if 1010B is used.
1010 Procedure AWe assume that this is the correct method because noinformation on barometric pressure corrections areincluded in the data report. In addition, thetemperature rise is consistent with 1010 - Procedure A. However, the laboratory should be contacted and theassumption verified.
Pages 11 and 16.
5.2.5 If a sample has an expected flashpoint, based onfield/facility information, measurements should begin atleast 30-50o F below the expected flashpoint of thematerial. If the expected flashpoint is unknown, theinitial measurements should begin at the ambienttemperature of the laboratory.
Action: If these procedures were not followed anddocumented, contact the laboratory for an explanation. Lack of an adequate explanation may justify qualifying thedata.
The result for the sample was 138°F. Assuming aroom temperature of 75°F, the laboratory was incompliance.
Page 14 or 16.
5.2.6 Was heat applied so as to raise the temperature of thesample at a rate of 9-11 °F per minute?
Note: To determine if this temperature rate is proper,the time and temperature at the beginning of heatingshould be recorded, and the time and temperature whenflash occurred (or when analyses ended) should berecorded.
Action: If these procedures were not followed and
documented, contact the laboratory for an explanation. Lack
of an adequate explanation may justify qualifying the data.
There is insufficient information. The laboratory shouldbe contacted. If no information is available, the reviewmay qualify data based upon best professionaljudgement and the project’s DQOs.
5.2.7 Were duplicate analyses performed?
Action: If no duplicates exist, the data validator may qualifyall results as “J.” If additional QA problems exist, thevalidator may justify rejecting the results if the flashpointdetermination is over 140°F. Results should not be rejectedfor data under 140°F.
If duplicate results exist, and the flashpoint range is under220°F, the results should agree within + 4°F. If the resultsdo not agree then qualify all results as “J.” If additional QAproblems exist, the validator may justify rejecting the resultsif the flashpoint determination is over 140°F. Results shouldnot be rejected for data under 140°F.
Yes, duplicates were performed. Page 16
Data Validation PRF - Tier I Page 28Version 3.0, January 9, 2006
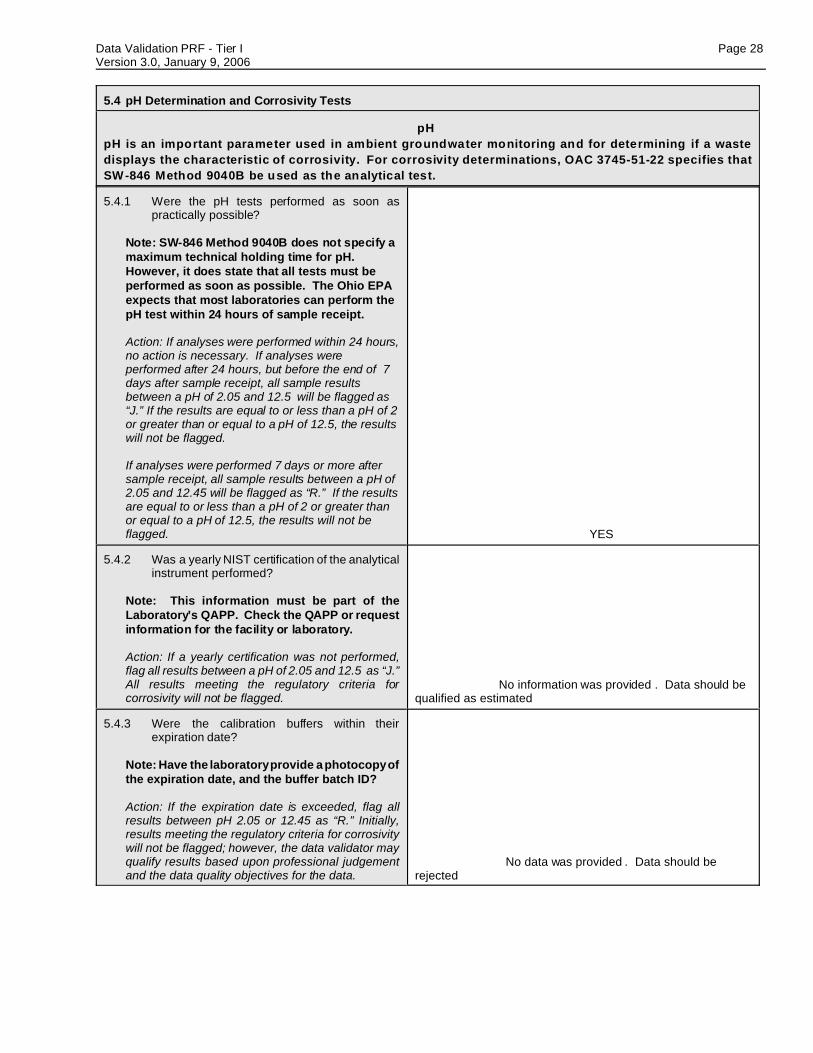
5.4 pH Determination and Corrosivity Tests
pH
pH is an important parameter used in ambient groundwater monitoring and for determining if a waste
displays the characteristic of corrosivity. For corrosivity determinations, OAC 3745-51-22 specifies that
SW -846 Method 9040B be used as the analytical test.
5.4.1 Were the pH tests performed as soon aspractically possible?
Note: SW-846 Method 9040B does not specify amaximum technical holding time for pH. However, it does state that all tests must beperformed as soon as possible. The Ohio EPAexpects that most laboratories can perform thepH test within 24 hours of sample receipt.
Action: If analyses were performed within 24 hours,no action is necessary. If analyses wereperformed after 24 hours, but before the end of 7days after sample receipt, all sample resultsbetween a pH of 2.05 and 12.5 will be flagged as“J.” If the results are equal to or less than a pH of 2or greater than or equal to a pH of 12.5, the resultswill not be flagged.
If analyses were performed 7 days or more aftersample receipt, all sample results between a pH of2.05 and 12.45 will be flagged as “R.” If the resultsare equal to or less than a pH of 2 or greater thanor equal to a pH of 12.5, the results will not beflagged. YES
5.4.2 Was a yearly NIST certification of the analyticalinstrument performed?
Note: This information must be part of theLaboratory’s QAPP. Check the QAPP or requestinformation for the facility or laboratory.
Action: If a yearly certification was not performed,flag all results between a pH of 2.05 and 12.5 as “J.”All results meeting the regulatory criteria forcorrosivity will not be flagged.
No information was provided . Data should bequalified as estimated
5.4.3 Were the calibration buffers within theirexpiration date?
Note: Have the laboratory provide a photocopy ofthe expiration date, and the buffer batch ID?
Action: If the expiration date is exceeded, flag allresults between pH 2.05 or 12.45 as “R.” Initially,results meeting the regulatory criteria for corrosivitywill not be flagged; however, the data validator mayqualify results based upon professional judgementand the data quality objectives for the data.
No data was provided . Data should berejected
Data Validation PRF - Tier I Page 29Version 3.0, January 9, 2006
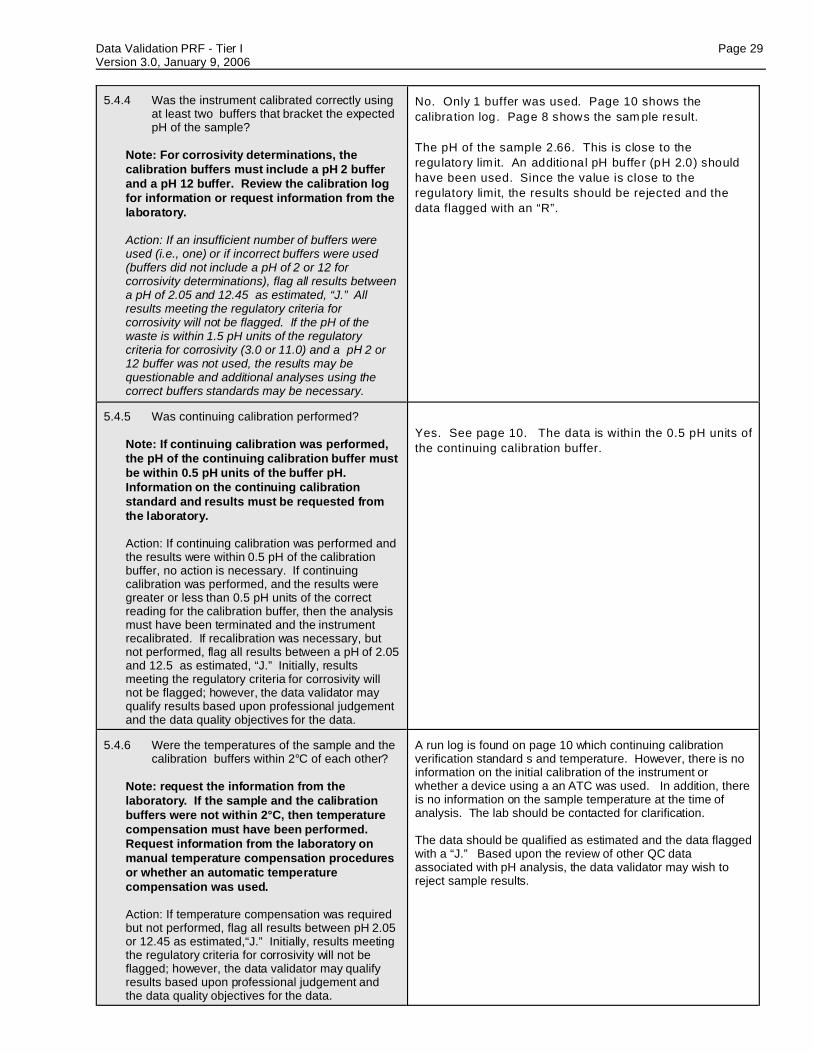
5.4.4 Was the instrument calibrated correctly usingat least two buffers that bracket the expectedpH of the sample?
Note: For corrosivity determinations, thecalibration buffers must include a pH 2 bufferand a pH 12 buffer. Review the calibration logfor information or request information from thelaboratory.
Action: If an insufficient number of buffers wereused (i.e., one) or if incorrect buffers were used(buffers did not include a pH of 2 or 12 forcorrosivity determinations), flag all results betweena pH of 2.05 and 12.45 as estimated, “J.” Allresults meeting the regulatory criteria forcorrosivity will not be flagged. If the pH of thewaste is within 1.5 pH units of the regulatorycriteria for corrosivity (3.0 or 11.0) and a pH 2 or12 buffer was not used, the results may bequestionable and additional analyses using thecorrect buffers standards may be necessary.
No. Only 1 buffer was used. Page 10 shows the
calibration log. Page 8 shows the sam ple result.
The pH of the sample 2.66. This is close to the
regulatory lim it. An additional pH buffer (pH 2.0) should
have been used. Since the value is close to the
regulatory limit, the results should be rejected and the
data flagged with an “R”.
5.4.5 Was continuing calibration performed?
Note: If continuing calibration was performed,the pH of the continuing calibration buffer mustbe within 0.5 pH units of the buffer pH. Information on the continuing calibrationstandard and results must be requested fromthe laboratory.
Action: If continuing calibration was performed andthe results were within 0.5 pH of the calibrationbuffer, no action is necessary. If continuingcalibration was performed, and the results weregreater or less than 0.5 pH units of the correctreading for the calibration buffer, then the analysismust have been terminated and the instrumentrecalibrated. If recalibration was necessary, butnot performed, flag all results between a pH of 2.05and 12.5 as estimated, “J.” Initially, resultsmeeting the regulatory criteria for corrosivity willnot be flagged; however, the data validator mayqualify results based upon professional judgementand the data quality objectives for the data.
Yes. See page 10. The data is within the 0.5 pH units of
the continuing calibration buffer.
5.4.6 Were the temperatures of the sample and thecalibration buffers within 2°C of each other?
Note: request the information from thelaboratory. If the sample and the calibrationbuffers were not within 2°C, then temperaturecompensation must have been performed. Request information from the laboratory onmanual temperature compensation proceduresor whether an automatic temperaturecompensation was used.
Action: If temperature compensation was requiredbut not performed, flag all results between pH 2.05or 12.45 as estimated,“J.” Initially, results meetingthe regulatory criteria for corrosivity will not beflagged; however, the data validator may qualifyresults based upon professional judgement andthe data quality objectives for the data.
A run log is found on page 10 which continuing calibrationverification standard s and temperature. However, there is noinformation on the initial calibration of the instrument orwhether a device using a an ATC was used. In addition, thereis no information on the sample temperature at the time ofanalysis. The lab should be contacted for clarification.
The data should be qualified as estimated and the data flaggedwith a “J.” Based upon the review of other QC dataassociated with pH analysis, the data validator may wish toreject sample results.
Data Validation PRF - Tier I Page 30Version 3.0, January 9, 2006
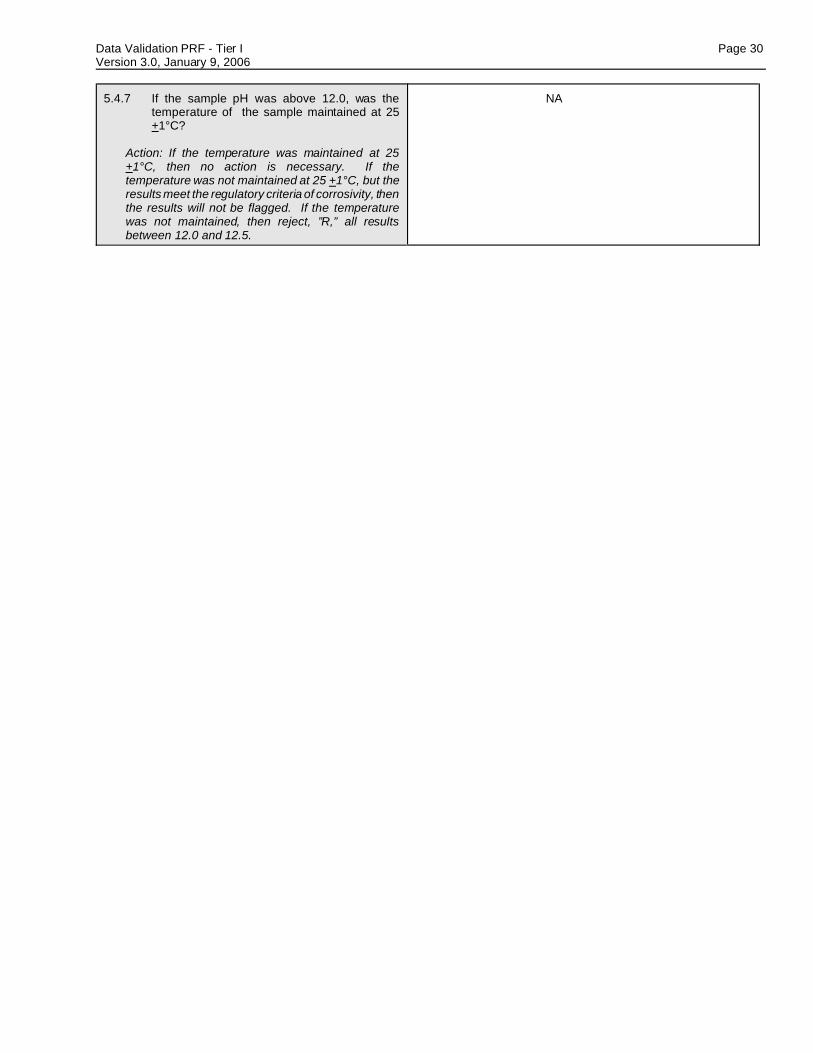
5.4.7 If the sample pH was above 12.0, was thetemperature of the sample maintained at 25+1°C?
Action: If the temperature was maintained at 25+1°C, then no action is necessary. If thetemperature was not maintained at 25 +1°C, but theresults meet the regulatory criteria of corrosivity, thenthe results will not be flagged. If the temperaturewas not maintained, then reject, ”R,” all resultsbetween 12.0 and 12.5.
NA