Embed Size (px)
Citation preview
Appendix I STATISTICAL ANALYSIS
Statistics has been defined as the scientific study of numerical data based on natural phenomena. The science of applying statistical methods to the solution of biological problems is called biometry. Statistical analysis yields an objective evaluation of the results of an experiment or field observation. Statistics deals with quantities of information and not with a single piece of information. The data must be quantifiable to be analyzed. For example, measurements and counts can be analyzed statistically, but verbal descriptions cannot, unless they are numerically coded in some manner.
Some basic definitions are in order before we can continue. The data in a biometric study are generally based on individual observations or measurements taken on the smallest· sampling unit. These smallest sampling units frequently, but not necessarily, are also individuals in the ordinary biological sense. If we measure weight in 100 rats, then the weight of each rat is an individual observation; the hundred rat weights together represent the sample of observations. However, if we had studied the weight in a single rat over a period of time, the sample of individual observations would be the weights recorded on one rat at successive times. The actual property measured by the individual observations is the character or variable. The sample observations are taken from a population. A population, in statistics, is defined as all of the observations that are made in a specific space and time about which inferences are to be made. A sample, then, is that part of the population that is actually measured. Most populations are too large to be measured completely. A representative sample is, therefore, used to draw conclusions about the entire population. This sample, however, must be random. That is, every individual in the population must have an equal chance of being selected.
Statistics give some indication of the validity of the differences seen in the results of a study. For example, if 10 out of 10 animals move toward a light source, one is fairly safe in saying that the species responds positively to light. But what if only 9 move toward the light, or 7 or 6? Is the movement in response to the light or is it merely random? Such data, taken from living systems, are affected by many (sometimes unidentifiable) causal factors, whose variation is uncontrollable. Statistical tests then give some indication of whether differences seen are true differences or whether they are merely random events.
A statistic is any quantity computed from raw data. Statistics tend to describe some general property of a data set, so that comparisons can be made with other data sets. Some of the more commonly used statistics and how they are calculated are give below:
- LY 1. Mean of the sample: Y = n
2.
where Y = mean of the sample Y = an individual observation
LY = sum of all the Yls n = sample size (number of observations)
2 Variance of the Sample (S ):
""? _ (LY) 2 S2 = Loy-
n - 1
143

3. Standard deviation of the sample (S):
S = .jS 2
To use statistics efficiently, the investigator must understand which statistical tests are most appropriate for each situation to be analyzed. Then experiments must be carefully designed to yield data in a form most amenable to the chosen analysis' 2 The three analyses to be used in this laboratory are the t test, the X test, and the Mann-Whitney U test. Each will be discussed separately.
A. t-test. This test can determine if a sample mean differs significantly from the population mean. (This difference could arise from some treatment applied to the sample.) The t statistic is determined as follows:
Y1 - Y t = 2
S 2 1
+ S 2 2
n
For this statistic, the degrees of freedom, df, = n-1.
To determine if the sample mean is significantly different from the mean of the entire population, determine the t statistic, above. Then decide on the level of significance (usually 0.05; results significant to this level would arise by chance alone 5% of the time). Find the value of the t statistic in the table for the degrees of freedom of the sample (df may be signified by
11-11 in the table). If the absolute value of the computed t statistic is greater than the t value in the table, your sample mean is different from the population mean at the 5% level of significance.
For example, suppose you have two sets of numbers from an experiment and you want to find out if the means are significantly different (n = 5 for each sample). Our hypothesis is that the means are equal.
Sam~le 1 Sam~le 2 9 5 7 3 6 1 5 2 8 4
2:Y1 = 35 2:Y 2 15
-Y1 = 7 Y2 = 3
2:y2 = 255 2:y2 = 55 1 2
First determine Y, the mean for each sample. Then compute the variance.
255 (35)2
55 -(15)2
S2 - -5-
S2 5 = = 1 4 2 4
S2 255 - 245 S2 55 - 45 = = 1 4 2 4
s2 = 2.5 s2 = 2.5 1 1
144

Now plug these values into the t equation.
t = 2 _ =--::7,.---_3=--:::-- = 4 4 4
2.5 + 2.5 5 = J1 = -1-5 5
t = 4.00 s Now look up the expected t value in the tables for df = 2(n-1) is 2(4) = 8, at (1 = .05. The table value is 2.306. Since the sample t is greater than the expected t, there is a significant difference betweens Y 1 and Y 2 at the 5% level. We reject our hypothesis that these means are equal.
s. Chi-square test. This test is more appropriate when biological variables are distributed into 2 or more classes (males/females; fed/pink/white; in the light/in the dark; etc.). We can use the X to test the goodness of fit of the observed frequency distribution to tn expected frequency distribution based on some hypothesis. The X statistic is calculated using this equation:
><z = L (Observed - Ex~ected f for each class Expected
EXAMPLE: Flip a coin 100 times
Observed Expected (0-e)2
(0-e)2 Class (0) (e) o-e e
Heads 37 50 -13 169 3.38
Tails 63 50 +13 169 3.38
Total 100 100 2 = 6.76 x 2 I n the example shown, X = 6.76. The df = number of classes - 1; thus,
df = 1. For an (1 of .05, the tabular critical value for the chi -square statistic is 3.84. Therefore, the distribution of heads and tails in this experiment differs significantly from that expected from the hypothesis that heads and tails come up at equal frequencies on a coin toss (50: 50) and, thus, we reject this hypothesis.
C. Mann-Whitney U test. This test is probably the easiest of the three, although it looks formidable. This test compares two samples from a population to determine if they have the same distribution (and thus would not be significantly different). This test is performed as follows:
The data are first put in order and then graphed. One sample is selected (usually the one with the smaller number of observations), and for each observation in this sample, the number of observations in the other sample which are less in value are tabulated (ties count as ~). The total count is designated as C.
For example, suppose you have the following data for the wall-seeking behavior experiments:
W 55 51 62 66 49 61
NW 50 55 48 49 52 53
where: walled samples = n1 = 6
non-walled samples = n2 = 6
145

These would be 'graphed' as follows:
W 49 51 55 61 62 66 NW 48 49 50 52 53 55
Counting for W, C = 1~ + 3 + 5~ + 6 + 6 + 6 = 28 and (n1n 2) - C = 37 - 28 = 8.
U must be either C or (n1n 2) - C, whichever is larger. larger, thus u = C = 28. Find u in the table.
I n this case C is
From the table, the two samples are not significantly different at = .05, but they are significant at the 10% level (i. e., for n1 = 6, n 2 = 6 at Ci. = .10) .
The Mann-Whitney U test is a NONPARAMETRIC TEST, unlike the t test and chi-square tests. Thus you can use this test validly when your data (or experimental design) would make it invalid to apply a parametric test. Thus, this test is extremely valuable for studies such as behavioral experiments because it is quick, easy, and you don't have to worry about any underlying theoretical assumptions which must be met before a parametric test can be used.
GENERAL READINGS
Conover, W. J. 1971. Practical Nonparametric Statistics. New York: John Wiley & Sons.
Rohlf, F.J. and Sokal, R.R. 1969. Statistical Tables. San Francisco: W.H. Freeman and Co.
Sokal, R.R. and Rohlf, F.J. 1969. Biometry. San Francisco: W.H. Freeman and Co.
146

CRITICAL VALUES OF THE T-TEST n a
0.05 0.02 0.01 0.001
1 12.71 31.82 63.66 636.62 2 4.30 6.97 9.93 31.60 3 3.18 4.54 5.84 12.92 4 2.78 3.75 4.60 8.61 5 2.57 3.37 4.03 6.87 6 2.45 3.14 3.71 5.96 7 2.37 3.00 3.50 5.41 8 2.31 2.90 3.36 5.01 9 2.26 2.82 3.25 4.78
10 2.23 2.76 3.17 4.59 11 2.20 2.72 3.11 4.44 12 2.18 2.68 3.06 4.32 13 2.16 2.65 3.01 4.22 14 2.15 2.62 2.98 4.14 15 2.13 2.60 2.95 4.07 16 2.12 2.58 2.92 4.02 17 2.11 2.57 2.90 3.97 18 2.10 2.55 2.88 3.92 19 2.09 2.54 2.86 3.88 20 2.08 2.53 2.85 3.85 21 2.08 2.52 2.83 3.82 22 2.07 2.51 2.82 3.79 23 2.07 2.50 2.81 3.77 24 2.06 2.50 2.80 3.75 25 2.06 2.49 2.79 3.73 26 2.06 2.48 2.78 3.71 27 2.05 2.47 2.77 3.69 28 2.05 2.47 2.76 3.67 29 2.05 2.46 2.76 3.66 30 2.04 2.46 2.75 3.65 40 2.02 2.42 2.70 3.55 60 2.00 2.39 2.66 3.46
120 1. 98 2.36 2.62 3.37 00 1. 96 2.33 2.58 3.29
147
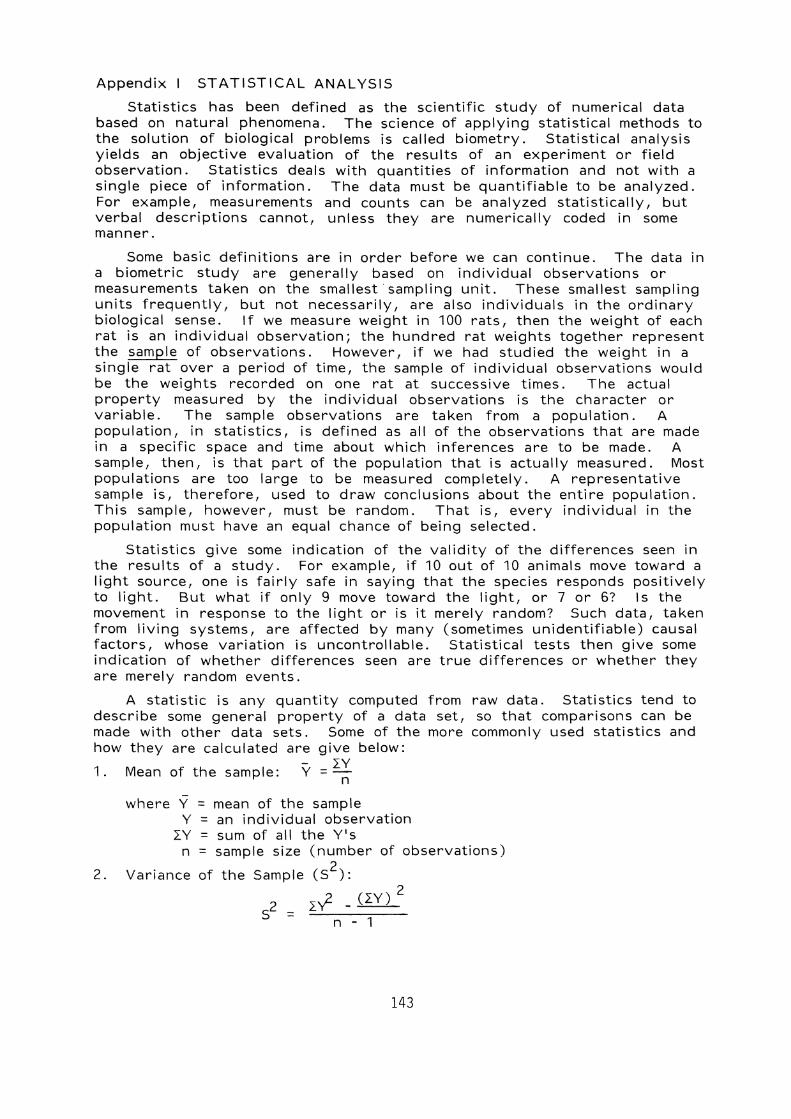
CRITICAL VALUES OF THE CHI-SQUARE DISTRIBUTION
0. df
0.1 0.05 0.25 0.01 0.005
1 2.706 3.841 5.024 6.635 7.879 2 4.605 5.991 7.378 9.210 10.597 3 6.251 7.815 9.348 11.345 12.838 4 7.779 9.488 11.143 13.277 14.860 5 9.236 11.070 12.832 15.086 16.750
6 10.645 12.592 14.449 16.812 18.548 7 12.017 14.067 16.013 18.475 20.278 8 13.362 15.507 17.535 20.090 21. 955 9 14.684 16.9l9 19.023 21.666 23.589
10 15.987 18.307 20.483 23.209 25.188
11 17.275 19.675 21.920 24.725 26.757 12 18.549 21.026 23.337 26.217 28.300 13 19.812 22.362 24.736 27.688 29.819 14 21.064 23.685 26.119 29.141 31.319 15 22.307 24.996 27.488 30.578 32.801
====================================================================
To use this table, compare your sample statistic with the value in the table with degrees of freedom equal to one less than the number of classes (df = n-1) when your hypothesis is external to your data, and at the chosen level of confidence. To obtain the 95% level of confidence, alpha must be 0.05. The null hypothesis that the observed and expected distributions are not significantly different is rejected when the sample statistic is greater than the tabled value. The alternate hypothesis states that the observed distribution is different in one direction than the expected.
148

CRITICAL VALUES OF THE MANN-WHITNEY STATISTIC
a
n1 n2 0.10 0.05 0.025 0.01 0.005 0.001
3 2 6 3 8 9
4 2 8 3 11 12 4 l3 15 16
5 2 9 10 3 l3 14 15 4 16 18 19 20 5 20 21 23 24 25
6 2 11 12 3 15 16 17 4 19 21 22 23 24 5 23 25 27 28 29 6 27 29 31 33 34
7 2 l3 14 3 17 19 20 21 4 22 24 25 27 28 5 27 29 30 32 34 6 31 34 36 38 39 42 7 36 38 41 43 45 48
8 2 14 15 16 3 19 21 22 24 4 25 27 28 30 31 5 30 32 34 36 38 40 6 35 38 40 42 44 47 7 40 43 46 49 50 54 8 45 49 51 55 57 60
9 1 9 2 16 17 18 3 22 23 25 26 27 4 27 30 32 33 35 5 33 36 38 40 42 44 6 39 42 44 47 49 52 7 45 48 51 54 56 60 8 50 54 57 61 63 67 9 56 60 64 67 70 74
:===========:==============================================================
To use this table, compare your sample statistic to the above values in this manner:
l. Locate your sample sizes in the left two columns.
149

10
11
12
1 2 3 4 5 6 7 8 9
10
1 2 3 4 5 6 7 8 9
10 11
1 2 3 4 5 6 7 8 9
10 11 12
0.10
10 17 24 30 37 43 46 56 62 68
11 19 26 33 40 47 54 61 68 74 81
12 20 28 36 43 51 58 66 73 81 88 95
0.05
19 26 33 39 46 53 60 66 73
21 28 36 43 50 58 65 72 79 87
22 31 39 47 55 63 70 78 86 94
102
0.025
20 27 35 42 49 56 63 70 77
22 30 38 46 53 61 69 76 84 91
23 32 41 49 58 66 74 82 91 99
107
a
0.01
29 37 44 52 59 67 74 81
32 40 48 57 65 73 81 88 96
34 42 52 61 70 79 87 96
104 113
0.005
30 38 46 54 61 69 77 84
33 42 50 59 67 75 83 92
100
35 45 54 63 72 81 90 99
108 117
0.001
40 49 57 65 74 82 90
44 53 62 71 80 89 98
106
48 58 68 77 87 96
106 115 124
===================================================================
2. Read down from your ~elected value of alpha. If you have chosen the 95% level of confidence, alpha is 0.05 (one-tailed test).
3. Find the indicated critical value of the statistic.
4. If your sample statistic is greater than the tabled value, the null hypothesis is rejected at the indicated level of confidence. The null hypothesis is that the two samples are not different (A = B). The alternate hypothesis stateE that one sample is more than the other. (A > B or B> A).
150
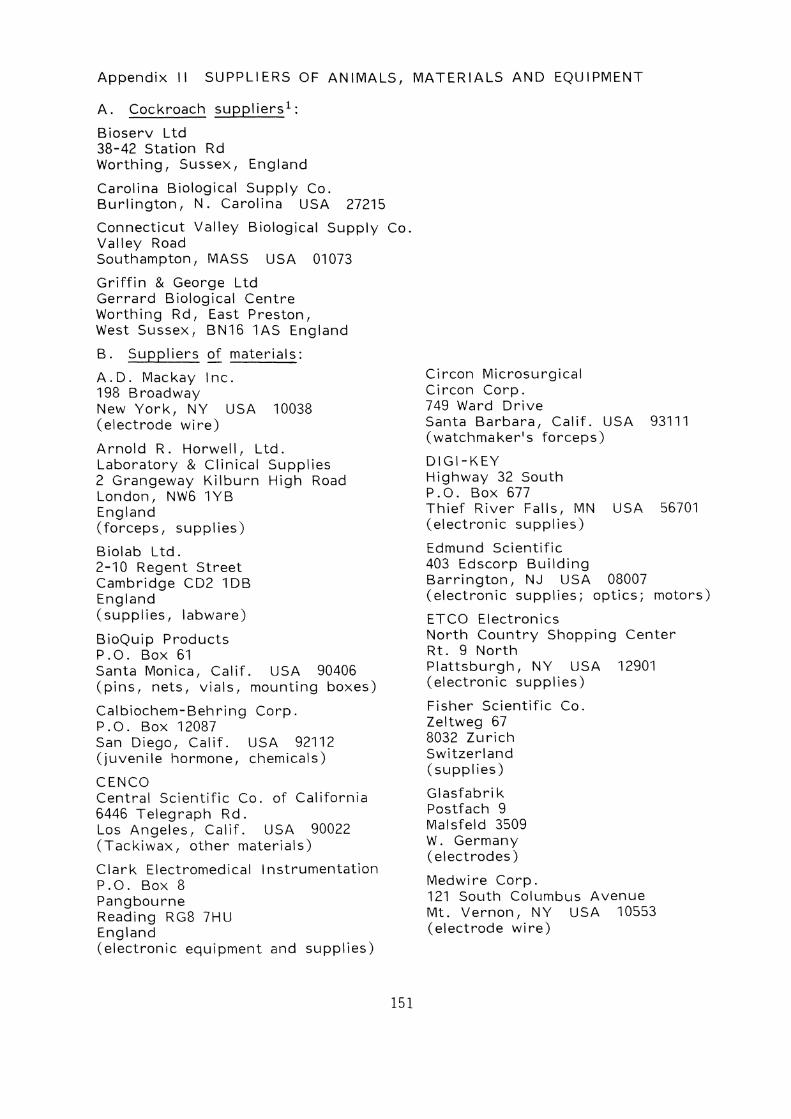
Appendix II SUPPLIERS OF ANIMALS, MATERIALS AND EQUIPMENT
A. Cockroach suppliersl:
Bioserv Ltd 38-42 Station Rd Worthing, Sussex, England
Carolina Biological Supply Co. Burlington, N. Carolina USA 27215
Connecticut Valley Biological Supply Co. Valley Road Southampton, MASS USA 01073
Griffin & George Ltd Gerrard Biological Centre Worthing Rd, East Preston, West Sussex, BN16 1AS England
B. Suppliers of materials:
A.D. Mackay Inc. 198 Broadway New York, NY USA 10038 (electrode wire)
Arnold R. Horwell, Ltd. Laboratory & Clinical Supplies 2 Grangeway Kilburn High Road London, NW6 1 YB England (forceps, supplies)
Biolab Ltd. 2-10 Regent Street Cambridge CD2 1 DB England (supplies, labware)
BioQuip Products P.O. Box 61 Santa Monica, Calif. USA 90406 (pins, nets, vials, mounting boxes)
Calbiochem-Behring Corp. P .0. Box 12087 San Diego, Calif. USA 92112 (juvenile hormone, chemicals)
CENCO Central Scientific Co. of California 6446 Telegraph Rd. Los Angeles, Calif. USA 90022 (Tackiwax, other materials)
Clark Electromedical Instrumentation P.O. Box 8 Pangbourne Reading RG8 7HU England (electronic equipment and supplies)
151
Circon Microsurgical Circon Corp. 749 Ward Drive Santa Barbara, Cal if. USA 93111 (watchmaker's forceps)
DIGI-KEY Highway 32 South P.O. Box 677 Thief River Falls, MN USA 56701 (electronic supplies)
Edmund Scientific 403 Edscorp Building Barrington, NJ USA 08007 (electronic supplies i optics i motors)
ETCO Electronics North Country Shopping Center Rt. 9 North Plattsburgh, NY USA 12901 (electronic supplies)
Fisher Scientific Co. Zeltweg 67 8032 Zurich Switzerland (supplies)
Glasfabri k Postfach 9 Malsfeld 3509 W. Germany (electrodes)
Medwi re Corp. 121 South Columbus Avenue Mt. Vernon, NY USA 10553 (electrode wire)
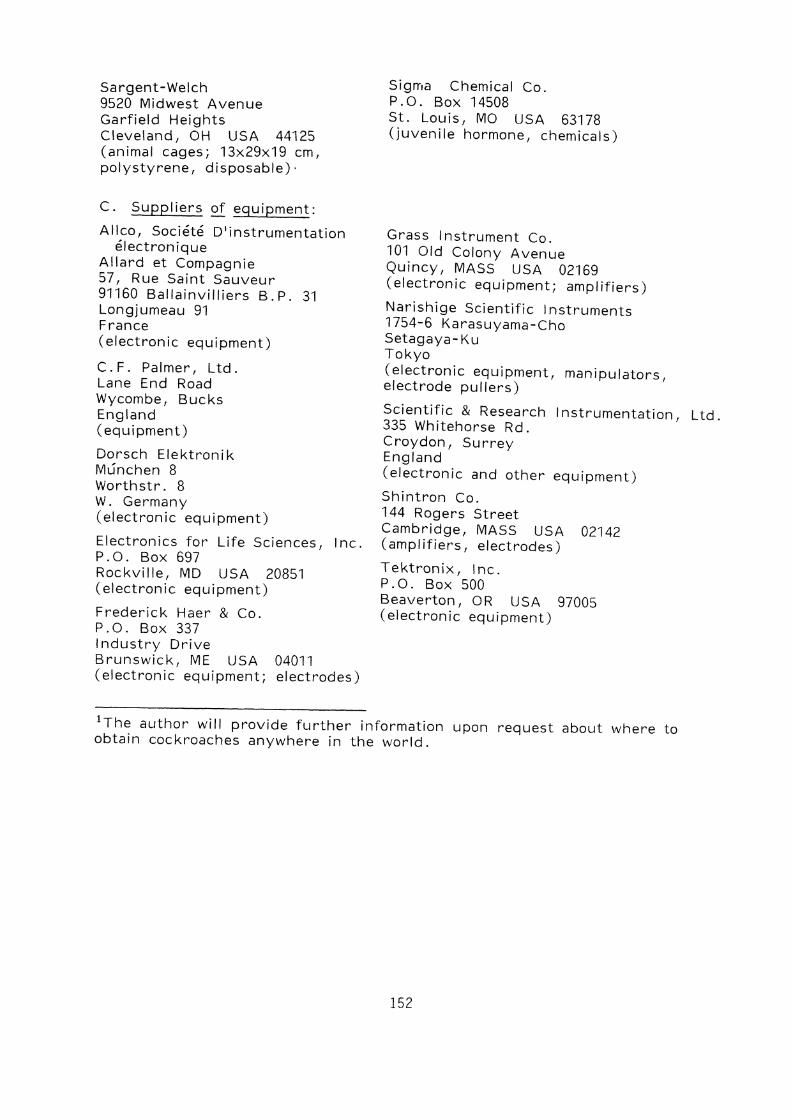
Sargent-Welch 9520 Midwest Avenue Garfield Heights Cleveland, OH USA 44125 (animal cages; 13x29x19 em, polystyrene, disposable)'
C. Suppliers of equipment:
Allco, Societe D'instrumentation electronique
Allard et Compagnie 57, Rue Saint Sauveur 91160 Ballainvilliers B. P. 31 Longjumeau 91 France (electronic equipment)
C.F. Palmer, Ltd. Lane End Road Wycombe, Bucks England (equipment)
Dorsch Elektronik Munchen 8 Worthstr. 8 W. Germany (electronic equipment)
Electronics for Life Sciences, Inc. P.O. Box 697 Rockville, MD USA 20851 (electronic equipment)
Frederick Haer & Co. P.O. Box 337 I ndustry Drive Brunswick, ME USA 04011 (electronic equipment; electrodes)
Sigma Chemical Co. P .0. Box 14508 st. Louis, MO USA 63178 (juvenile hormone, chemicals)
Grass I nstrument Co. 101 Old Colony Avenue Quincy, MASS USA 02169 (electronic equipment; amplifiers)
Narishige Scientific Instruments 1754-6 Karasuyama-Cho Setagaya- Ku Tokyo (electronic equipment, manipulators, electrode pullers)
Scientific & Research Instrumentation, Ltd. 335 Whitehorse Rd. Croydon, Surrey England (electronic and other equipment)
Shintron Co. 144 Rogers Street Cambridge, MASS USA 02142 (ampl ifiers, electrodes)
Tektronix, Inc. P.O. Box 500 Beaverton, OR USA 97005 (electronic equipment)
lThe author will provide further information upon request about where to obtain cockroaches anywhere in the world.
152

Appendix III JOURNAL ABBREVIATIONS SPELLED OUT
Adv. Insect Physiol. - Advances in I nsect Physiology Amer. Midi. Nat. - American Midland Naturalist Amer. Zool. - American Zoologist Anim. Behav. - Animal Behavior Anim. Learn. Behav. - Animal Learning and Behavior Annals Entomol. Sci. Amer. - Annals of the Entomological Society of America Annals Soc. Entomol. France - Annals of the Societe Entomologie de France Annu. Rev. Ecol. Syst. - Annual Review of Ecology and Systematics Annu. Rev. Entomol. - Annual Review of Entomology Annu. Rev. Physiol. - Annual Review of Physiology Appl. Ent. Zool. - Appled Entomology. and Zoology Behav. Bioi. - Behavioral Biology Behav. Processes - Behavioral Processes Bioi. Bull. - Biological Bulletin (Woods Hole) J. Cell Bioi. - Journal of Cell Biology J. Chem. Ecol. - Journal of Chemical Ecology J. comp. Physiol. - Journal of Comparative Physiology J. Embryol. Exp. Morphol. - Journal of Embryology and Experimental
Morphology J. exp. Bioi. - Journal of Experimental Biology J. exp. Zool. - Journal of Experimental Zoology J. gen. Physiol. - Journal of General Physiology J. Kans. Entomol. Soc. - Journal of the Kansas Entomological Society J. Insect Physiol. - Journal of I nsect Physiology J. Ultrast. Res. - Journal of Ultrastructural Research Physiol. & Behav. - Physiology and Behavior Physiol. Entomol. - Physiological Entomology Proc. R. Soc. Lond. - Proceedings of the Royal Society of London Quart. Micr. Sci. - Quarterly Journal of Microscopical Science Res. Methods Instrument. - Research Methods and Instrumentation Riv. Parasitol. - Rivista di Parasitologia Sci. Amer. - Scientific American Smithson. Misc. Collect. - Smithsonian Miscellaneous Collections Symp. R. Ent. Soc. - Symposium of the Royal Entomological Society Tiss. & Cell - Tissue and Cell Univ. Calif. Publ. Entomol. - University of California Publications in
Entomology z. Tierpsychol. - Zeitschrift fur Tierpsychologie
153
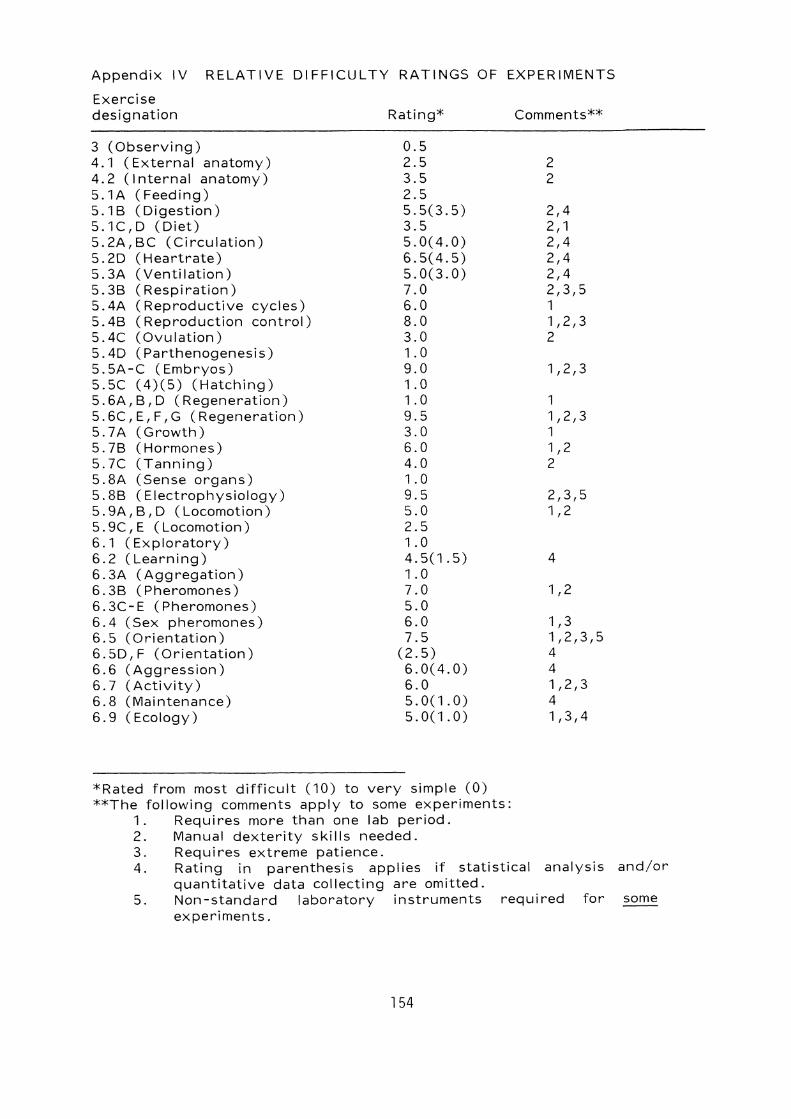
Appendix IV RELATIVE DIFFICULTY RATINGS OF EXPERIMENTS
Exercise designation
3 (Observing) 4.1 (External anatomy) 4.2 (I nternal anatomy) 5.1A (Feeding) 5.16 (Digestion) 5.1C,D (Diet) 5. 2A, 6C (Circulation) 5.2D (Heartrate) 5.3A (Ventilation) 5.36 (Respi ration) 5.4A (Reproductive cycles) 5.46 (Reproduction control) 5.4C (Ovulation) 5.4D (Parthenogenesis) 5.5A-C (Embryos) 5.5C (4)(5) (Hatching) 5. 6A, 6, D (Regeneration) 5. 6C , E, F, G (Regeneration) 5. 7 A (G rowth ) 5.76 (Hormones) 5.7C (Tanning) 5.8A (Sense organs) 5.86 (Electrophysiology) 5. 9A, 6 , D (Locomotion) 5. 9C, E (Locomotion) 6.1 (Exploratory) 6.2 (Learning) 6.3A (Aggregation) 6.36 (Pheromones) 6.3C-E (Pheromones) 6.4 (Sex pheromones) 6.5 (Orientation) 6.5D, F (Orientation) 6.6 (Aggression) 6.7 (Activity) 6.8 (Maintenance) 6.9 (Ecology)
Rating*
0.5 2.5 3.5 2.5 5.5(3.5) 3.5 5.0(4.0) 6.5(4.5) 5.0(3.0) 7.0 6.0 8.0 3.0 1.0 9.0 1.0 1.0 9.5 3.0 6.0 4.0 1.0 9.5 5.0 2.5 1.0 4.5(1.5) 1.0 7.0 5.0 6.0 7.5
(2.5) 6.0(4.0) 6.0 5.0(1.0) 5.0(1.0)
*Rated from most difficult (10) to very simple (0) **The following comments apply to some experiments:
1. Requires more than one lab period. 2. Manual dexterity skills needed. 3. Requires extreme patience.
Comments**
2 2
2,4 2,1 2,4 2,4 2,4 2,3,5 1 1,2,3 2
1,2,3
1 1,2,3 1 1,2 2
2,3,5 1,2
4
1,2
1,3 1,2,3,5 4 4 1,2,3 4 1,3,4
4. Rating in parenthesis applies if statistical analysis and/or quantitative data collecting are omitted.
5. Non-standard laboratory instruments required for some experiments.
154
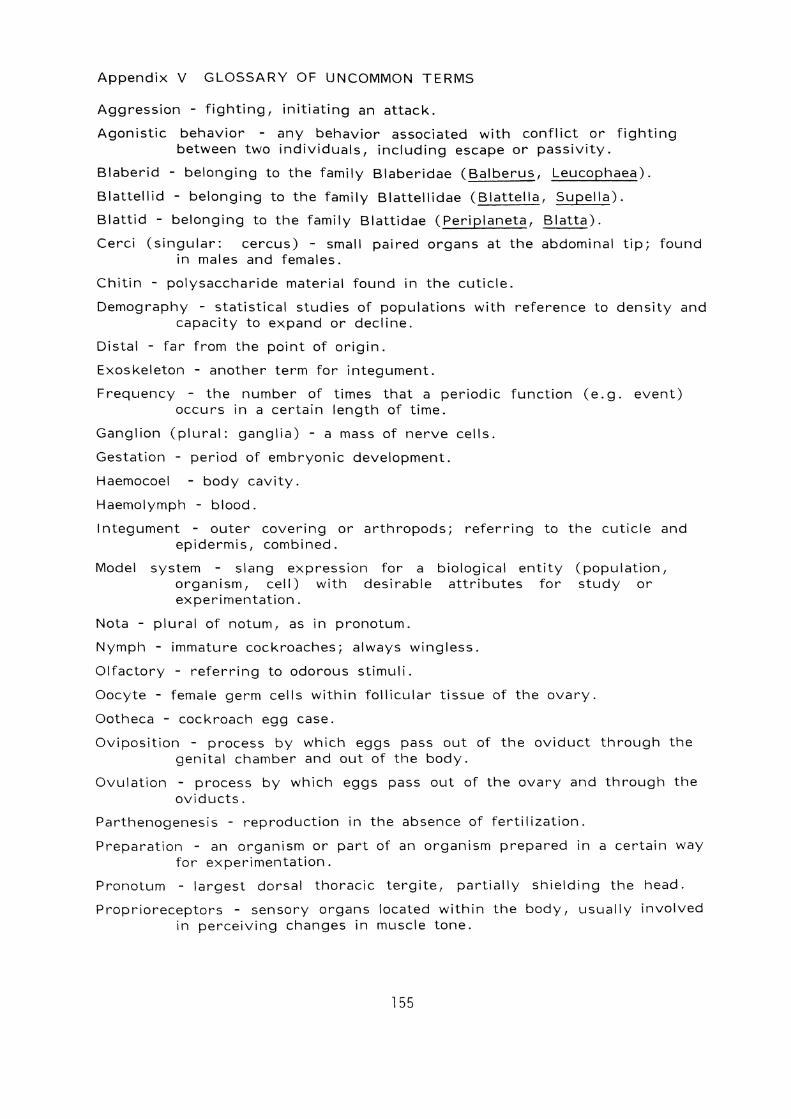
Appendix V GLOSSARY OF UNCOMMON TERMS
Aggression - fighting, initiating an attack.
Agonistic behavior - any behavior associated with conflict or fighting between two individuals, including escape or passivity.
Blaberid - belonging to the family Blaberidae (Balberus, Leucophaea).
Blattellid - belonging to the family Blattellidae (Blattella, Supella).
Blattid - belonging to the family Blattidae (Periplaneta, Blatta).
Cerci (singular: cercus) - small paired organs at the abdominal tip; found in males and females.
Chitin - polysaccharide material found in the cuticle.
Demography - statistical studies of populations with reference to density and capacity to expand or decline.
Distal - far from the point of origin.
Exoskeleton - another term for integument.
Frequency - the number of times that a periodic function (e. g. event) occurs in a certain length of time.
Ganglion (plural: ganglia) - a mass of nerve cells.
Gestation - period of embryonic development.
Haemocoel - body cavity.
Haemolymph - blood.
Integument - outer covering or arthropods; referring to the cuticle and epidermis, combined.
Model system slang expression for a biological entity (population, organism, cell) with desirable attributes for study or experimentation.
Nota - plural of notum, as in pronotum.
Nymph - immature cockroaches; always wingless.
Olfactory - referring to odorous stimuli.
Oocyte - female germ cells within follicular tissue of the ovary.
Ootheca - cockroach egg case.
Oviposition - process by which eggs pass out of the oviduct through the genital chamber and out of the body.
Ovulation - process by which eggs pass out of the ovary and through the oviducts.
Parthenogenesis - reproduction in the absence of fertilization.
Preparation - an organism or part of an organism prepared in a certain way for experimentation.
Pronotum - largest dorsal thoracic tergite, partially shielding the head.
Proprioreceptors - sensory organs located within the body, usually involved in perceiving changes in muscle tone.
155
Proximal - near to the point of origin.
Releaser (of behavior) - specific sensory stimulus (or stimuli) that stimulates a particular type of behavior.
Respiration - physical and chemcial processes by which cells and tissues are supplied oxygen and relieved of carbon dioxide.
Ritualized behavior communicative behavior that evolved from a noncommunicative behavior.
Roach - small, silvery freshwater fish (Rutilus rutilus)i also, a term often used incorrectly to refer to cockroaches.
Saline solution of salts equal in osmotic pressure to the blood of cockroaches.
Sci erotized - property of certain insect parts hardened and reinforced by an insoluble protein, sclerotin.
Shelter - any cardboard container or folded section of corrigated cardboard.
Sterna (singular: sternum) - ventral Iplates. 1
Styles - small paired organs at the abdominal tip of males (and nymphs of some species).
Tactile - referring to mechanical stimuli, e.g. wind, touch.
Tanning - chemical process by which integument hardens and darkens in color.
Tarsus (plural: tarsi) - most distal leg segment.
Tegmina (singular: tegmen) - forewings.
Terga (singular: tergum) - dorsal Iplates. 1
Tibia (plural: tibiae) - leg sigment between tarsus and femur.
Ventilation - process by which air is moved into and out of the body.
156
Sources of illustrations and other materials
Barth, R. H. 1970. The mating behavior of Periplaneta americana (Linnaeus) and Blatta orientalis Linnaeus (Blattaria, Balttinae), with notes on 3 additional species of Periplaneta and interspecification of female sex pheromones. ~. Tierpsychol. 27: 722-748. (Fig. 6.7, adapted from)
Bignell, D. E. 1981. Nutrition and digestion. In: The American Cockroach, Ed. by W. J. Bell and K. G. Adiyodi. London: Chapman & Hall. (Fig. 4.16; redrawn).
Camhi, J. M., Tom, W., and Volman, W. 1978. The escape behavior of the cockroach Periplaneta americana. II. Detection of natural predators by air displacement. ~. compo Physiol. 128: 203-212. (Fig. 6.8)
Camhi, J. M. 1980. The escape system of the cockroach. Sci. Amer. (Dec.) pp. 158-172. (drawing by Tom Prentiss) (Fig. 4.1)
Chen, D. H. 1968. Allatectomy of the American cockroach, Periplaneta americana (L.). In: Experiments in Physiology and Biochemistry, vol. 1, Ed by G. A. Kerkut, pp. 201-208. New York: Academic Press. (Fig. 5.1)
Cornwell, P. B. 1968. The Cockroach, vol. I. London: Hutchinson and Co. (Figs. 1.9, 1.10, 4.6 and keys for cockroaches)
Gautier, J.-Y. 1974. These, Docteur d'Etat, L'Universite de Rennes. (Fig. 6.17 and sketches of cockroaches fighting).
Guthrie, D. M. and Tindall, A. R. 1968. The Biology of the Cockroach. London: Arnold Press. (Fig. 4.4)
Haber, V. R. 1926. Blattella germanica (Fig. 4.8)
The tracheal system of the German cockroach, Linn. Bull. Brooklyn Entomol. Soc. 21:61-92.
Hughes, G. M. 1952. The co-ordination of insect movements. I. The walking movements of insects. ~. expo Bioi. 29: 267-284; Modified by Chapman, R. F. 1969. The Insects, Structure and Function. New York: American Elsevier Publ. Co. (Fig. 5.15).
Lefauvre, J.-C. 1969. These, Docteur es Sciences Naturelles, (Fig. 4.3).
Miall, L. C. and Denny, A. 1886. The Structure and Life-History of the Cockroach (Periplaneta orientalis~An I ntroductlOn to the Study of Insects. London: Lovell Reeve & Co. (Figs. 2.7, 4.9, 4.10, 4.13, 4.14,4.15; redrawn, sometimes modified).
Oakley, B. and Schafer, R. 1978. Laboratory Manual. Ann. Arbor: 5.14; redrawn).
Experimental Neurobiology, A Univer~ity of Michigan Press. -( Fig.
Roberts, S. K. 1962. Circadian activity rhythms in cockroaches. II. Entrainment and phase shifting. ~. cell comp. Physiol. 55: 99-110; Modified by Matthews, R. W. and Matthews, J. R. 1978. Insect Behavior. New York: John Wiley & Sons. (Fig.6.14A)
Roth, L. M. and Willis, E. R. 1954. The biology of the cockroach egg parasite, Tetrastichus hagenowii (Hymenoptera, Eulophidae). Trans. Amer. Entomol. Soc. 80:53-72 (Fig. 6.18).
157
Roth, L. M. and Willis, E. R. v'iviparity in the Blattidae. (Figs. 5.4, 5.9).
1958. An analysis of oviparity and Trans. Amer. Entomol. Soc. 83:221-238.
Roth, L. M. and Willis, E. R. 1960. Biotic associations of cockroaches. Smithson. Misc. Coil. 141:1-470. (Figs. 1.3, 1.4, 1.5, 1.6, 1.8)
Roth, L. M. and Stay, B. 1962. and Blattella vaga (Blatta ria). (Fig. 5.5; redrawn).
Oocyte development in Blattella germanica Ann. Entomol. Soc. Amer. 55: 633-642.
Seelinger, G. and Tobin, T. R. 1981. Sense organs. In: The American Cockroach, Ed. by W. J. Bell and K. G. Adiyodi. Londorl:Chapman & Hall. (Figs. 4.2, 4.5).
Tanaka, A. 1976. Stages in the embryonic development of the German cockroach, Blattella germanica Linn. (Blattaria, Blattellidae). Kontyu 44: 512-525. (Fig. 5.7; Table I).
Welsh, J. H. and Smith, R. I. 1960. Laboratory exercises in Physiology. Minneapolis: Burgess Publ. Co. (Figs. 5.2, 5.3 and the section on Gas Mixtures)
158
INDEX
abdomen 23
activity rhythm 130, 131
activity monitor 131-132
actograph 132-133
aggregation 105
agg regation, pheromone preparation
aggression 132-129
agonistic behavior 123
allatectomy 49
amplifier 83, 87
amylase 43
anatomy 21-38
anesthesia (Box #2) 37
105 105
with microscope, 53
antenna 23, 28, 83
arena 97,111,117
arena, construction 97, 117 photographing 118, 119
arsenomolybdate 43
behavior 95-142 of embryos, 73
blood cell 47
brain 35, 36
brain hormone 81
cerci 23, 83, 84, 115
chemo-orientation 111, 115
chorion 71
circulation 47
clock 131
cockroach books 3
cockroach, descriptions 1 morphology 23-38 natural history 8-9
cockroaches, habitats of 8-9 kinds of 1
collecting 139
159
corpus allatum 38, 49 removal 49-51
corpus cardiacum 38, 49 removal 49
correcting behavior 99
courtship 111, 112
culturing 15
cuticle, 23 patterns 77 tanning 81
development 69
diet 44
digestion 41
digestive organs 33, 41
dissecting tools 28
dissection 33
dominance 125
dye injection 47
ecdysone 81
ecoiogy 139-142
electroantennagram 85
electrodes, preparation 87
embryogenesis 69
endocrine glands 38
enzymes 41
escape behavior 115, 116
excretion 47
exoskeleton 23
exploratory behavior 97
fat body 33
feedback mechanism 67-68
feeding 41
fixed cockroach 91
fixed cockroach preparation 119
flight 135
food for cockroaches 17
gait 91

gas mixtures, preparation 57
giant axon 83, 84
graft 75
grid pattern 97-98
grooming 19, 135
growth 81
habituation 99
haemocyte 47
haemocoel 33
haemolymph 33
handling 17
hatching 72, 73
heart 35
heart rate 48
hormones 51, 63, 81
Hoyer's solution 23-25
identification 1
injecting methods (Box #3) 48
invertase 41-43
immobilization 135-136
impulse 83
joints 91-92
juvenile hormone 81
keys to cockroaches
killing jar 141
learning 99-103
ligatures 81, 5.4
locomotion 91
10
maintenance behavior 135
Malpighian tubules 47
marking methods (Box #4) 65
mark-recapture 139
mating 111, 112
maze 99-100
maze construction 101
metabolism 55
160
metamorphosis 81
molting 81
mouthparts 23, 29, 30
Nelson's reagent 43
nerve impulse 83
nervous system 35, 38
neurophysiology 83
nutrition 41-44
ocelli 23, 26
ootheca 63 formation 64, 67 key to 13
orientation spatial vertical
115-122 115
115
83 osci Iloscope
ostia 35
ovary 33, 36
oviparous 63
ovoviviparous 63
parasites 138
parthenogenesis 67
pH 41
pheromone
photocycle,
phototaxis
physiology
109
reversing
115-117
39-94
polyvinyl alcohol 25
populations 139
18
predators 46, 94, 138-140
pregnancy 63-67
protease 41
prothoracic glands 81
protraction, of leg 93
pseudoviviparous 63
red lightbulbs 127
reflex 135
regeneration 75
reinforcement, positive or negative 101
rhythm 131
righting behavior 136
reproduction 63
reproductive cycle 63
respiration 55
respirometers 57, 59-60
retraction, of leg 93
saline recipe 37
sense organs 83, 115
sex determi nation (Box #1) 24
sex pheromone 85, 109 extraction of 109-110
sexual behavior 109
social interactions 107
species of cockroaches 1
spectrophotometer 43-44
spiracles 23, 31
spiracular valves 55
statistical methods 143-150
stepping 91
sternum 23
stress 49
sugar 41-43
style 23
taenidia 33, 36
tanning 81-82
tarsal reflex 135
tergum 23
testi s 35
tethered preparation 91
thigmotaxis 116, 117
thorax 23
tracheae 35, 36
transcription 124
161
trapping 15, 139
ventilatory movement 55
ventral nerve cord 83, 84
vision 105
wall-seeking 97
V-maze 119
yol k 69-71