Embed Size (px)
Citation preview
NAS Whidbey Island Complex Growler DEIS, Volume 2 November 2016
F-1
Appendix F
Appendix F Environmental Justice Data, High-tempo FCLP Year
NAS Whidbey Island Complex Growler DEIS, Volume 2 November 2016
F-2
Appendix F
This page intentionally left blank.
F-3
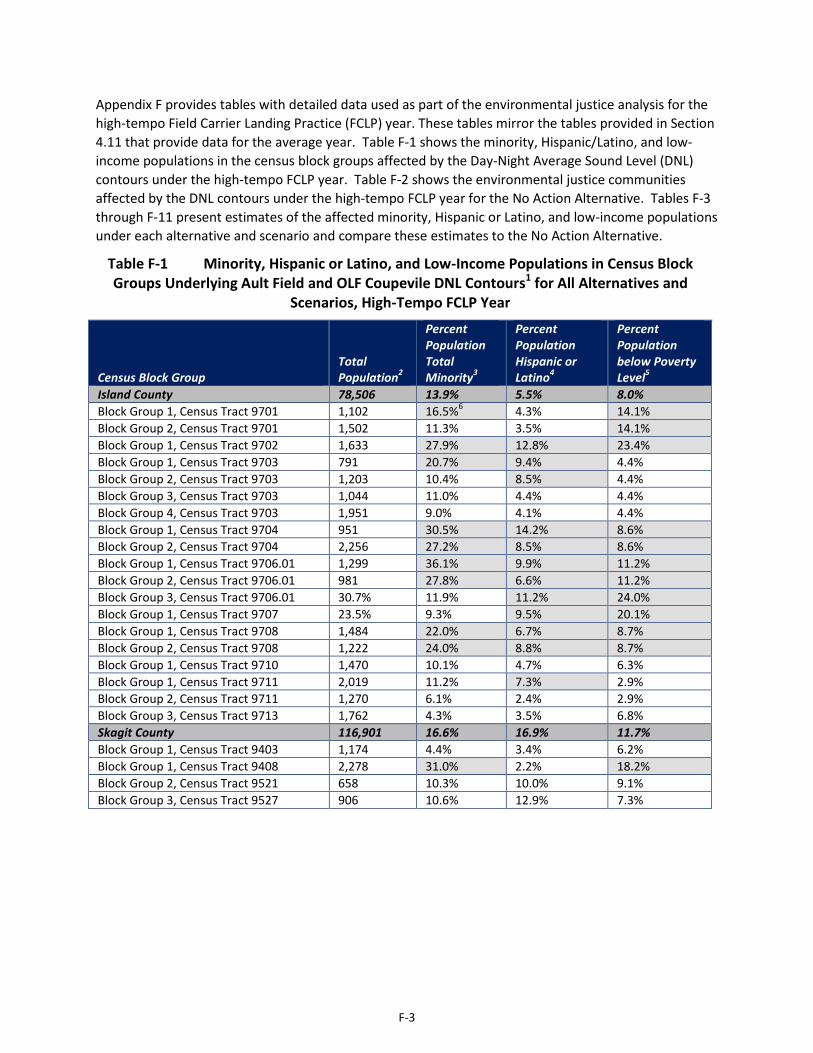
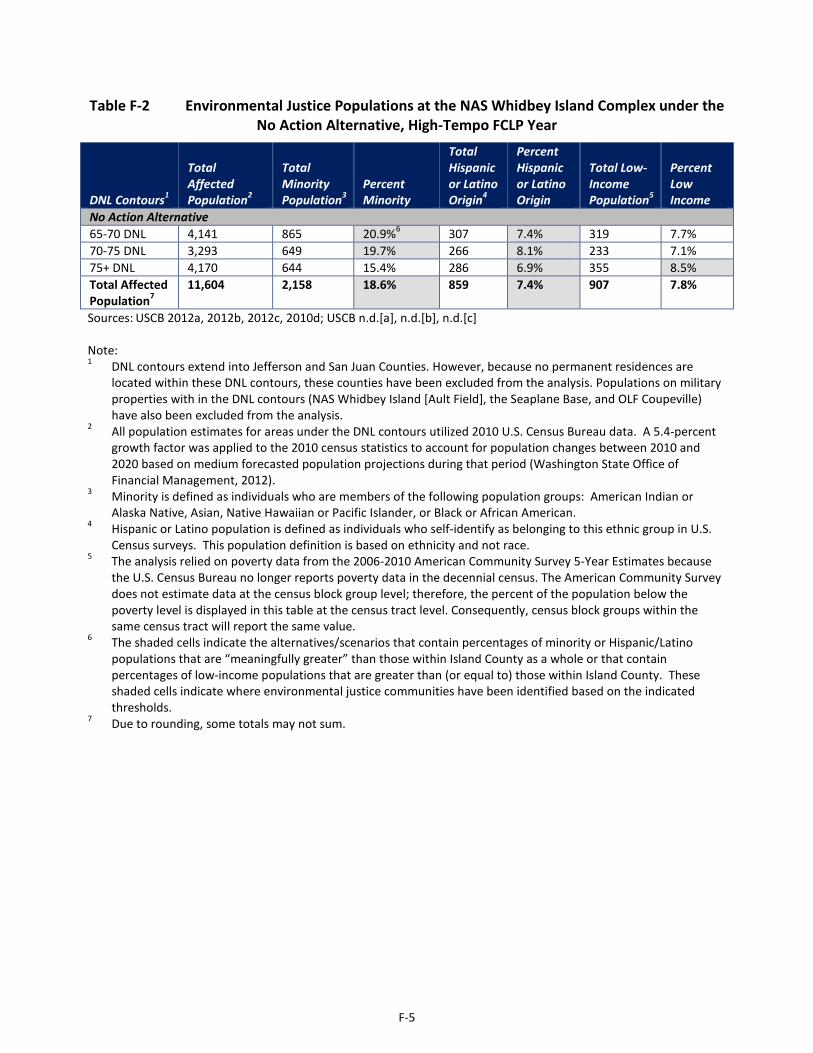
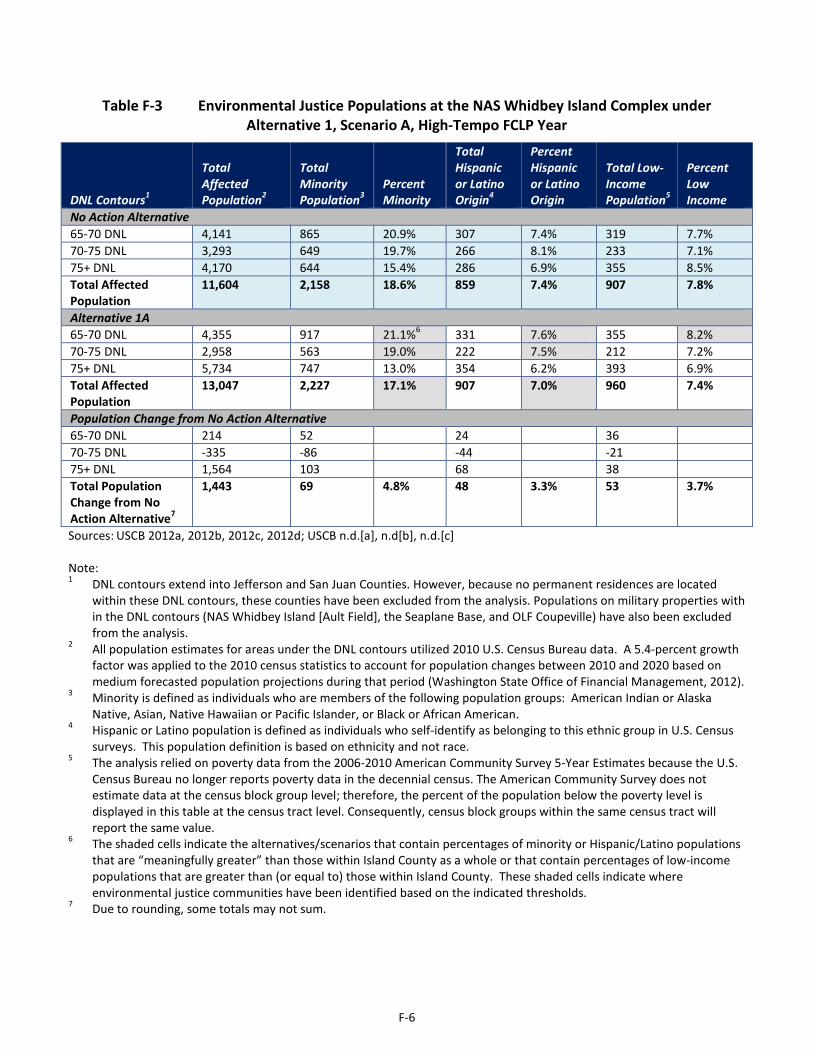
Appendix F provides tables with detailed data used as part of the environmental justice analysis for the high-tempo Field Carrier Landing Practice (FCLP) year. These tables mirror the tables provided in Section 4.11 that provide data for the average year. Table F-1 shows the minority, Hispanic/Latino, and low-income populations in the census block groups affected by the Day-Night Average Sound Level (DNL) contours under the high-tempo FCLP year. Table F-2 shows the environmental justice communities affected by the DNL contours under the high-tempo FCLP year for the No Action Alternative. Tables F-3 through F-11 present estimates of the affected minority, Hispanic or Latino, and low-income populations under each alternative and scenario and compare these estimates to the No Action Alternative.
Table F-1 Minority, Hispanic or Latino, and Low-Income Populations in Census Block Groups Underlying Ault Field and OLF Coupevile DNL Contours1 for All Alternatives and
Scenarios, High-Tempo FCLP Year
Census Block Group Total Population2
Percent Population Total Minority3
Percent Population Hispanic or Latino4
Percent Population below Poverty Level5
Island County 78,506 13.9% 5.5% 8.0% Block Group 1, Census Tract 9701 1,102 16.5%6 4.3% 14.1% Block Group 2, Census Tract 9701 1,502 11.3% 3.5% 14.1% Block Group 1, Census Tract 9702 1,633 27.9% 12.8% 23.4% Block Group 1, Census Tract 9703 791 20.7% 9.4% 4.4% Block Group 2, Census Tract 9703 1,203 10.4% 8.5% 4.4% Block Group 3, Census Tract 9703 1,044 11.0% 4.4% 4.4% Block Group 4, Census Tract 9703 1,951 9.0% 4.1% 4.4% Block Group 1, Census Tract 9704 951 30.5% 14.2% 8.6% Block Group 2, Census Tract 9704 2,256 27.2% 8.5% 8.6% Block Group 1, Census Tract 9706.01 1,299 36.1% 9.9% 11.2% Block Group 2, Census Tract 9706.01 981 27.8% 6.6% 11.2% Block Group 3, Census Tract 9706.01 30.7% 11.9% 11.2% 24.0% Block Group 1, Census Tract 9707 23.5% 9.3% 9.5% 20.1% Block Group 1, Census Tract 9708 1,484 22.0% 6.7% 8.7% Block Group 2, Census Tract 9708 1,222 24.0% 8.8% 8.7% Block Group 1, Census Tract 9710 1,470 10.1% 4.7% 6.3% Block Group 1, Census Tract 9711 2,019 11.2% 7.3% 2.9% Block Group 2, Census Tract 9711 1,270 6.1% 2.4% 2.9% Block Group 3, Census Tract 9713 1,762 4.3% 3.5% 6.8% Skagit County 116,901 16.6% 16.9% 11.7% Block Group 1, Census Tract 9403 1,174 4.4% 3.4% 6.2% Block Group 1, Census Tract 9408 2,278 31.0% 2.2% 18.2% Block Group 2, Census Tract 9521 658 10.3% 10.0% 9.1% Block Group 3, Census Tract 9527 906 10.6% 12.9% 7.3%
F-4
Table F-1 Minority, Hispanic or Latino, and Low-Income Populations in Census Block Groups Underlying Ault Field and OLF Coupevile DNL Contours1 for All Alternatives and
Scenarios, High-Tempo FCLP Year
Census Block Group Total Population2
Percent Population Total Minority3
Percent Population Hispanic or Latino4
Percent Population below Poverty Level5
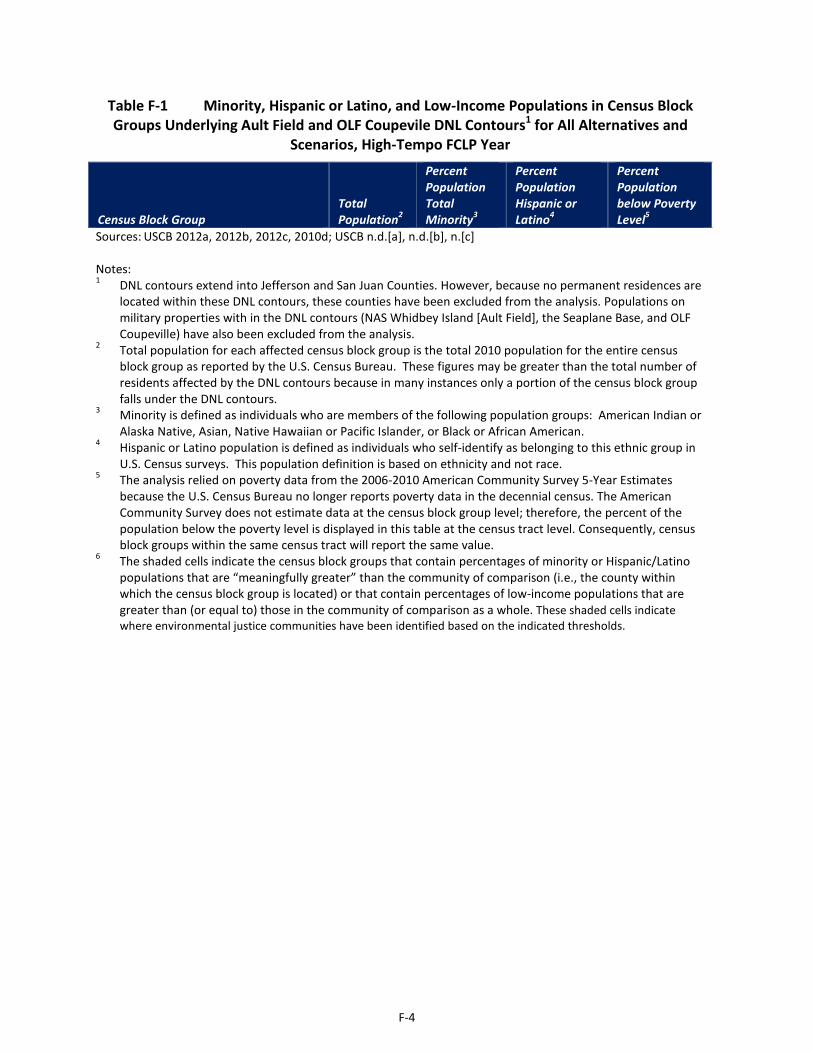
Sources: USCB 2012a, 2012b, 2012c, 2010d; USCB n.d.[a], n.d.[b], n.[c] Notes: 1 DNL contours extend into Jefferson and San Juan Counties. However, because no permanent residences are
located within these DNL contours, these counties have been excluded from the analysis. Populations on military properties with in the DNL contours (NAS Whidbey Island [Ault Field], the Seaplane Base, and OLF Coupeville) have also been excluded from the analysis.
2 Total population for each affected census block group is the total 2010 population for the entire census block group as reported by the U.S. Census Bureau. These figures may be greater than the total number of residents affected by the DNL contours because in many instances only a portion of the census block group falls under the DNL contours.
3 Minority is defined as individuals who are members of the following population groups: American Indian or Alaska Native, Asian, Native Hawaiian or Pacific Islander, or Black or African American.
4 Hispanic or Latino population is defined as individuals who self-identify as belonging to this ethnic group in U.S. Census surveys. This population definition is based on ethnicity and not race.
5 The analysis relied on poverty data from the 2006-2010 American Community Survey 5-Year Estimates because the U.S. Census Bureau no longer reports poverty data in the decennial census. The American Community Survey does not estimate data at the census block group level; therefore, the percent of the population below the poverty level is displayed in this table at the census tract level. Consequently, census block groups within the same census tract will report the same value.
6 The shaded cells indicate the census block groups that contain percentages of minority or Hispanic/Latino populations that are “meaningfully greater” than the community of comparison (i.e., the county within which the census block group is located) or that contain percentages of low-income populations that are greater than (or equal to) those in the community of comparison as a whole. These shaded cells indicate where environmental justice communities have been identified based on the indicated thresholds.
F-5
Table F-2 Environmental Justice Populations at the NAS Whidbey Island Complex under the No Action Alternative, High-Tempo FCLP Year
DNL Contours1
Total Affected Population2
Total Minority Population3
Percent Minority
Total Hispanic or Latino Origin4
Percent Hispanic or Latino Origin
Total Low- Income Population5
Percent Low Income
No Action Alternative 65-70 DNL 4,141 865 20.9%6 307 7.4% 319 7.7% 70-75 DNL 3,293 649 19.7% 266 8.1% 233 7.1% 75+ DNL 4,170 644 15.4% 286 6.9% 355 8.5% Total Affected Population7
11,604 2,158 18.6% 859 7.4% 907 7.8%
Sources: USCB 2012a, 2012b, 2012c, 2010d; USCB n.d.[a], n.d.[b], n.d.[c] Note: 1 DNL contours extend into Jefferson and San Juan Counties. However, because no permanent residences are
located within these DNL contours, these counties have been excluded from the analysis. Populations on military properties with in the DNL contours (NAS Whidbey Island [Ault Field], the Seaplane Base, and OLF Coupeville) have also been excluded from the analysis.
2 All population estimates for areas under the DNL contours utilized 2010 U.S. Census Bureau data. A 5.4-percent growth factor was applied to the 2010 census statistics to account for population changes between 2010 and 2020 based on medium forecasted population projections during that period (Washington State Office of Financial Management, 2012).
3 Minority is defined as individuals who are members of the following population groups: American Indian or Alaska Native, Asian, Native Hawaiian or Pacific Islander, or Black or African American.
4 Hispanic or Latino population is defined as individuals who self-identify as belonging to this ethnic group in U.S. Census surveys. This population definition is based on ethnicity and not race.
5 The analysis relied on poverty data from the 2006-2010 American Community Survey 5-Year Estimates because the U.S. Census Bureau no longer reports poverty data in the decennial census. The American Community Survey does not estimate data at the census block group level; therefore, the percent of the population below the poverty level is displayed in this table at the census tract level. Consequently, census block groups within the same census tract will report the same value.
6 The shaded cells indicate the alternatives/scenarios that contain percentages of minority or Hispanic/Latino populations that are “meaningfully greater” than those within Island County as a whole or that contain percentages of low-income populations that are greater than (or equal to) those within Island County. These shaded cells indicate where environmental justice communities have been identified based on the indicated thresholds.
7 Due to rounding, some totals may not sum.
F-6
Table F-3 Environmental Justice Populations at the NAS Whidbey Island Complex under Alternative 1, Scenario A, High-Tempo FCLP Year
DNL Contours1
Total Affected Population2
Total Minority Population3
Percent Minority
Total Hispanic or Latino Origin4
Percent Hispanic or Latino Origin
Total Low-Income Population5
Percent Low Income
No Action Alternative 65-70 DNL 4,141 865 20.9% 307 7.4% 319 7.7% 70-75 DNL 3,293 649 19.7% 266 8.1% 233 7.1% 75+ DNL 4,170 644 15.4% 286 6.9% 355 8.5% Total Affected Population
11,604 2,158 18.6% 859 7.4% 907 7.8%
Alternative 1A 65-70 DNL 4,355 917 21.1%6 331 7.6% 355 8.2% 70-75 DNL 2,958 563 19.0% 222 7.5% 212 7.2% 75+ DNL 5,734 747 13.0% 354 6.2% 393 6.9% Total Affected Population
13,047 2,227 17.1% 907 7.0% 960 7.4%
Population Change from No Action Alternative 65-70 DNL 214 52 24 36 70-75 DNL -335 -86 -44 -21 75+ DNL 1,564 103 68 38 Total Population Change from No Action Alternative7
1,443 69 4.8% 48 3.3% 53 3.7%
Sources: USCB 2012a, 2012b, 2012c, 2012d; USCB n.d.[a], n.d[b], n.d.[c] Note: 1 DNL contours extend into Jefferson and San Juan Counties. However, because no permanent residences are located
within these DNL contours, these counties have been excluded from the analysis. Populations on military properties with in the DNL contours (NAS Whidbey Island [Ault Field], the Seaplane Base, and OLF Coupeville) have also been excluded from the analysis.
2 All population estimates for areas under the DNL contours utilized 2010 U.S. Census Bureau data. A 5.4-percent growth factor was applied to the 2010 census statistics to account for population changes between 2010 and 2020 based on medium forecasted population projections during that period (Washington State Office of Financial Management, 2012).
3 Minority is defined as individuals who are members of the following population groups: American Indian or Alaska Native, Asian, Native Hawaiian or Pacific Islander, or Black or African American.
4 Hispanic or Latino population is defined as individuals who self-identify as belonging to this ethnic group in U.S. Census surveys. This population definition is based on ethnicity and not race.
5 The analysis relied on poverty data from the 2006-2010 American Community Survey 5-Year Estimates because the U.S. Census Bureau no longer reports poverty data in the decennial census. The American Community Survey does not estimate data at the census block group level; therefore, the percent of the population below the poverty level is displayed in this table at the census tract level. Consequently, census block groups within the same census tract will report the same value.
6 The shaded cells indicate the alternatives/scenarios that contain percentages of minority or Hispanic/Latino populations that are “meaningfully greater” than those within Island County as a whole or that contain percentages of low-income populations that are greater than (or equal to) those within Island County. These shaded cells indicate where environmental justice communities have been identified based on the indicated thresholds.
7 Due to rounding, some totals may not sum.
F-7
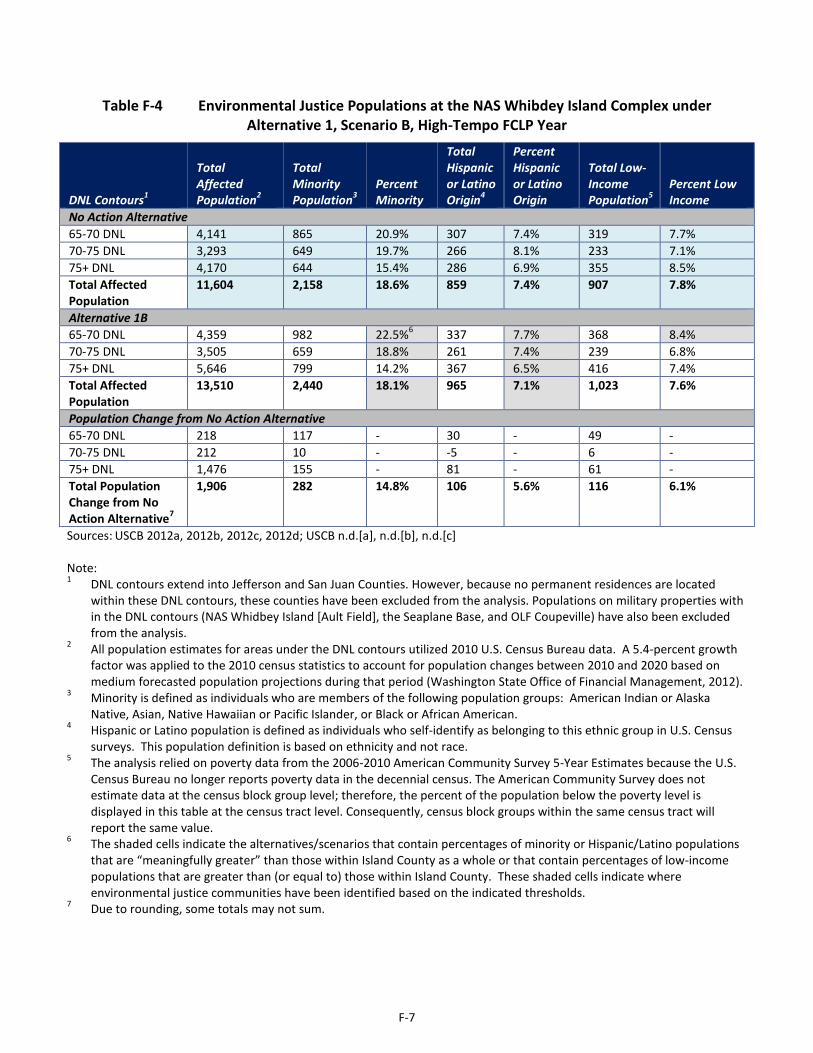
Table F-4 Environmental Justice Populations at the NAS Whibdey Island Complex under Alternative 1, Scenario B, High-Tempo FCLP Year
DNL Contours1
Total Affected Population2
Total Minority Population3
Percent Minority
Total Hispanic or Latino Origin4
Percent Hispanic or Latino Origin
Total Low- Income Population5
Percent Low Income
No Action Alternative 65-70 DNL 4,141 865 20.9% 307 7.4% 319 7.7% 70-75 DNL 3,293 649 19.7% 266 8.1% 233 7.1% 75+ DNL 4,170 644 15.4% 286 6.9% 355 8.5% Total Affected Population
11,604 2,158 18.6% 859 7.4% 907 7.8%
Alternative 1B 65-70 DNL 4,359 982 22.5%6 337 7.7% 368 8.4% 70-75 DNL 3,505 659 18.8% 261 7.4% 239 6.8% 75+ DNL 5,646 799 14.2% 367 6.5% 416 7.4% Total Affected Population
13,510 2,440 18.1% 965 7.1% 1,023 7.6%
Population Change from No Action Alternative 65-70 DNL 218 117 - 30 - 49 - 70-75 DNL 212 10 - -5 - 6 - 75+ DNL 1,476 155 - 81 - 61 - Total Population Change from No Action Alternative7
1,906 282 14.8% 106 5.6% 116 6.1%
Sources: USCB 2012a, 2012b, 2012c, 2012d; USCB n.d.[a], n.d.[b], n.d.[c] Note: 1 DNL contours extend into Jefferson and San Juan Counties. However, because no permanent residences are located
within these DNL contours, these counties have been excluded from the analysis. Populations on military properties with in the DNL contours (NAS Whidbey Island [Ault Field], the Seaplane Base, and OLF Coupeville) have also been excluded from the analysis.
2 All population estimates for areas under the DNL contours utilized 2010 U.S. Census Bureau data. A 5.4-percent growth factor was applied to the 2010 census statistics to account for population changes between 2010 and 2020 based on medium forecasted population projections during that period (Washington State Office of Financial Management, 2012).
3 Minority is defined as individuals who are members of the following population groups: American Indian or Alaska Native, Asian, Native Hawaiian or Pacific Islander, or Black or African American.
4 Hispanic or Latino population is defined as individuals who self-identify as belonging to this ethnic group in U.S. Census surveys. This population definition is based on ethnicity and not race.
5 The analysis relied on poverty data from the 2006-2010 American Community Survey 5-Year Estimates because the U.S. Census Bureau no longer reports poverty data in the decennial census. The American Community Survey does not estimate data at the census block group level; therefore, the percent of the population below the poverty level is displayed in this table at the census tract level. Consequently, census block groups within the same census tract will report the same value.
6 The shaded cells indicate the alternatives/scenarios that contain percentages of minority or Hispanic/Latino populations that are “meaningfully greater” than those within Island County as a whole or that contain percentages of low-income populations that are greater than (or equal to) those within Island County. These shaded cells indicate where environmental justice communities have been identified based on the indicated thresholds.
7 Due to rounding, some totals may not sum.
F-8
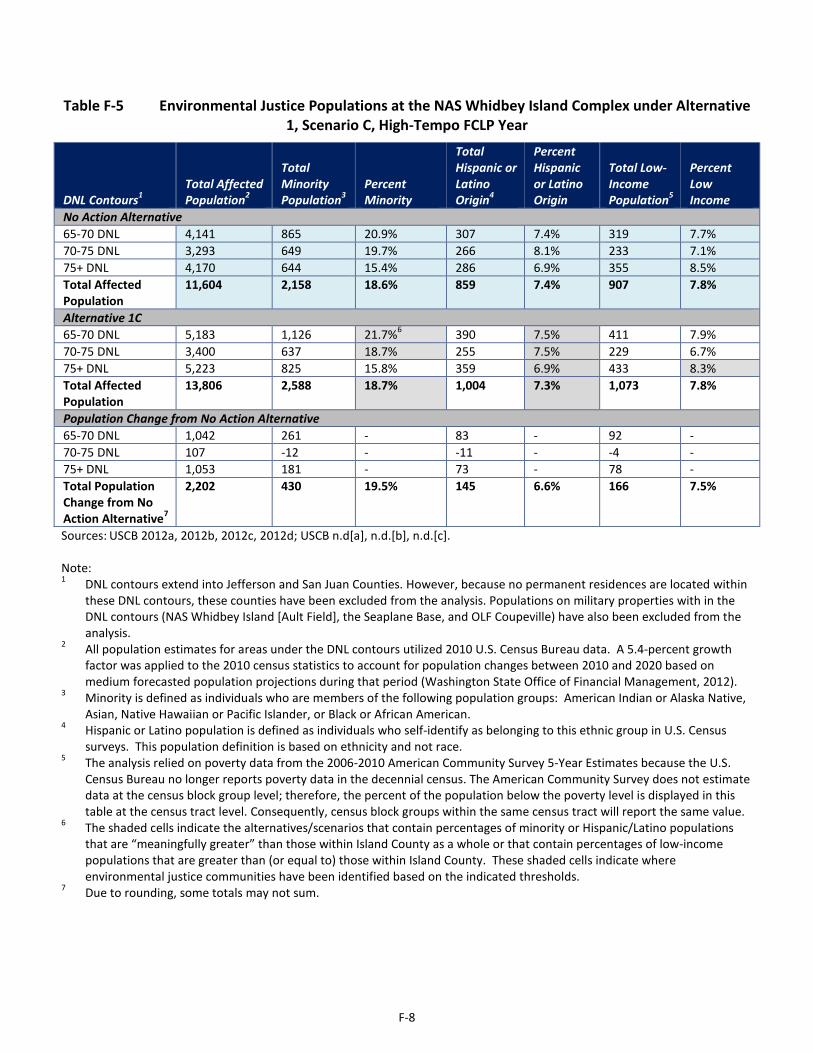
Table F-5 Environmental Justice Populations at the NAS Whidbey Island Complex under Alternative 1, Scenario C, High-Tempo FCLP Year
DNL Contours1 Total Affected Population2
Total Minority Population3
Percent Minority
Total Hispanic or Latino Origin4
Percent Hispanic or Latino Origin
Total Low- Income Population5
Percent Low Income
No Action Alternative 65-70 DNL 4,141 865 20.9% 307 7.4% 319 7.7% 70-75 DNL 3,293 649 19.7% 266 8.1% 233 7.1% 75+ DNL 4,170 644 15.4% 286 6.9% 355 8.5% Total Affected Population
11,604 2,158 18.6% 859 7.4% 907 7.8%
Alternative 1C 65-70 DNL 5,183 1,126 21.7%6 390 7.5% 411 7.9% 70-75 DNL 3,400 637 18.7% 255 7.5% 229 6.7% 75+ DNL 5,223 825 15.8% 359 6.9% 433 8.3% Total Affected Population
13,806 2,588 18.7% 1,004 7.3% 1,073 7.8%
Population Change from No Action Alternative 65-70 DNL 1,042 261 - 83 - 92 - 70-75 DNL 107 -12 - -11 - -4 - 75+ DNL 1,053 181 - 73 - 78 - Total Population Change from No Action Alternative7
2,202 430 19.5% 145 6.6% 166 7.5%
Sources: USCB 2012a, 2012b, 2012c, 2012d; USCB n.d[a], n.d.[b], n.d.[c]. Note: 1 DNL contours extend into Jefferson and San Juan Counties. However, because no permanent residences are located within
these DNL contours, these counties have been excluded from the analysis. Populations on military properties with in the DNL contours (NAS Whidbey Island [Ault Field], the Seaplane Base, and OLF Coupeville) have also been excluded from the analysis.
2 All population estimates for areas under the DNL contours utilized 2010 U.S. Census Bureau data. A 5.4-percent growth factor was applied to the 2010 census statistics to account for population changes between 2010 and 2020 based on medium forecasted population projections during that period (Washington State Office of Financial Management, 2012).
3 Minority is defined as individuals who are members of the following population groups: American Indian or Alaska Native, Asian, Native Hawaiian or Pacific Islander, or Black or African American.
4 Hispanic or Latino population is defined as individuals who self-identify as belonging to this ethnic group in U.S. Census surveys. This population definition is based on ethnicity and not race.
5 The analysis relied on poverty data from the 2006-2010 American Community Survey 5-Year Estimates because the U.S. Census Bureau no longer reports poverty data in the decennial census. The American Community Survey does not estimate data at the census block group level; therefore, the percent of the population below the poverty level is displayed in this table at the census tract level. Consequently, census block groups within the same census tract will report the same value.
6 The shaded cells indicate the alternatives/scenarios that contain percentages of minority or Hispanic/Latino populations that are “meaningfully greater” than those within Island County as a whole or that contain percentages of low-income populations that are greater than (or equal to) those within Island County. These shaded cells indicate where environmental justice communities have been identified based on the indicated thresholds.
7 Due to rounding, some totals may not sum.
F-9
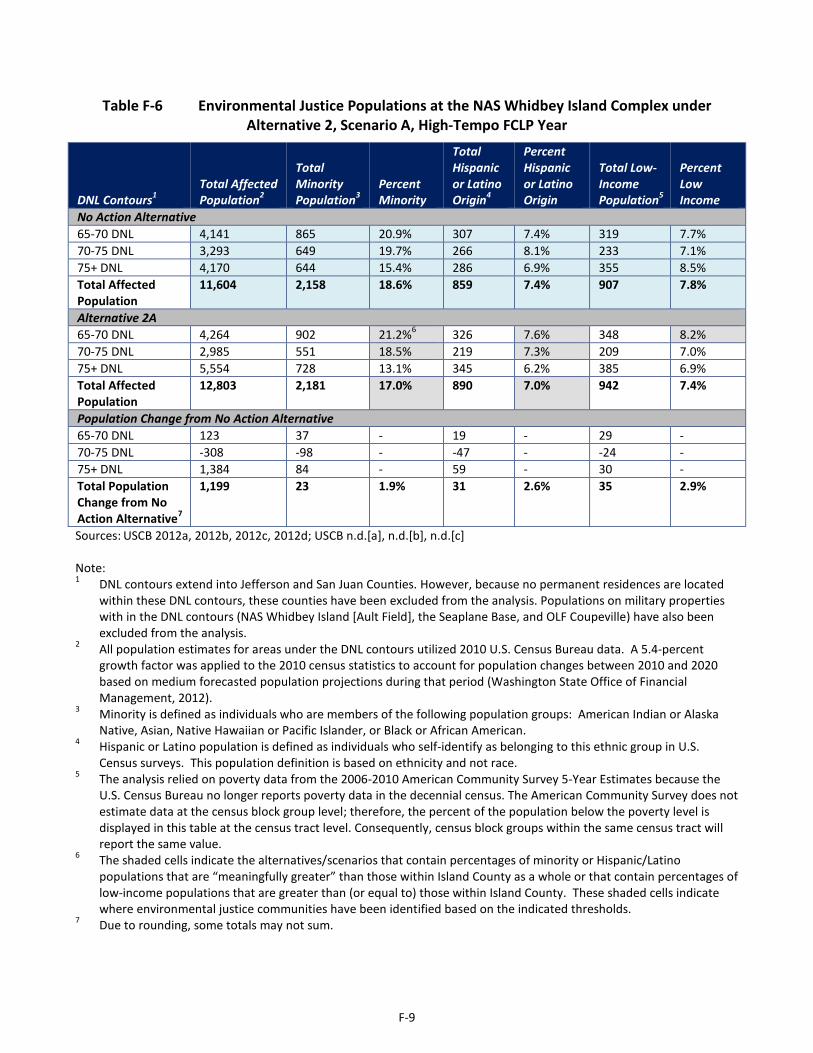
Table F-6 Environmental Justice Populations at the NAS Whidbey Island Complex under Alternative 2, Scenario A, High-Tempo FCLP Year
DNL Contours1 Total Affected Population2
Total Minority Population3
Percent Minority
Total Hispanic or Latino Origin4
Percent Hispanic or Latino Origin
Total Low-Income Population5
Percent Low Income
No Action Alternative 65-70 DNL 4,141 865 20.9% 307 7.4% 319 7.7% 70-75 DNL 3,293 649 19.7% 266 8.1% 233 7.1% 75+ DNL 4,170 644 15.4% 286 6.9% 355 8.5% Total Affected Population
11,604 2,158 18.6% 859 7.4% 907 7.8%
Alternative 2A 65-70 DNL 4,264 902 21.2%6 326 7.6% 348 8.2% 70-75 DNL 2,985 551 18.5% 219 7.3% 209 7.0% 75+ DNL 5,554 728 13.1% 345 6.2% 385 6.9% Total Affected Population
12,803 2,181 17.0% 890 7.0% 942 7.4%
Population Change from No Action Alternative 65-70 DNL 123 37 - 19 - 29 - 70-75 DNL -308 -98 - -47 - -24 - 75+ DNL 1,384 84 - 59 - 30 - Total Population Change from No Action Alternative7
1,199 23 1.9% 31 2.6% 35 2.9%
Sources: USCB 2012a, 2012b, 2012c, 2012d; USCB n.d.[a], n.d.[b], n.d.[c] Note: 1 DNL contours extend into Jefferson and San Juan Counties. However, because no permanent residences are located
within these DNL contours, these counties have been excluded from the analysis. Populations on military properties with in the DNL contours (NAS Whidbey Island [Ault Field], the Seaplane Base, and OLF Coupeville) have also been excluded from the analysis.
2 All population estimates for areas under the DNL contours utilized 2010 U.S. Census Bureau data. A 5.4-percent growth factor was applied to the 2010 census statistics to account for population changes between 2010 and 2020 based on medium forecasted population projections during that period (Washington State Office of Financial Management, 2012).
3 Minority is defined as individuals who are members of the following population groups: American Indian or Alaska Native, Asian, Native Hawaiian or Pacific Islander, or Black or African American.
4 Hispanic or Latino population is defined as individuals who self-identify as belonging to this ethnic group in U.S. Census surveys. This population definition is based on ethnicity and not race.
5 The analysis relied on poverty data from the 2006-2010 American Community Survey 5-Year Estimates because the U.S. Census Bureau no longer reports poverty data in the decennial census. The American Community Survey does not estimate data at the census block group level; therefore, the percent of the population below the poverty level is displayed in this table at the census tract level. Consequently, census block groups within the same census tract will report the same value.
6 The shaded cells indicate the alternatives/scenarios that contain percentages of minority or Hispanic/Latino populations that are “meaningfully greater” than those within Island County as a whole or that contain percentages of low-income populations that are greater than (or equal to) those within Island County. These shaded cells indicate where environmental justice communities have been identified based on the indicated thresholds.
7 Due to rounding, some totals may not sum.
F-10
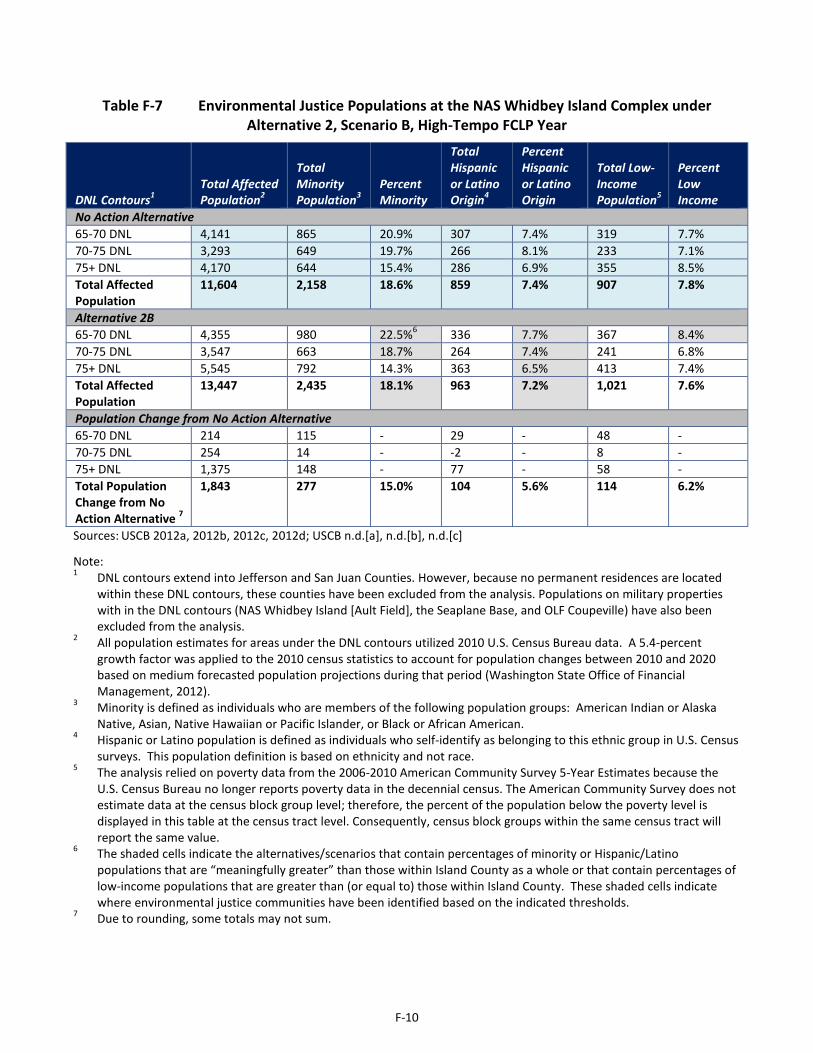
Table F-7 Environmental Justice Populations at the NAS Whidbey Island Complex under Alternative 2, Scenario B, High-Tempo FCLP Year
DNL Contours1 Total Affected Population2
Total Minority Population3
Percent Minority
Total Hispanic or Latino Origin4
Percent Hispanic or Latino Origin
Total Low-Income Population5
Percent Low Income
No Action Alternative 65-70 DNL 4,141 865 20.9% 307 7.4% 319 7.7% 70-75 DNL 3,293 649 19.7% 266 8.1% 233 7.1% 75+ DNL 4,170 644 15.4% 286 6.9% 355 8.5% Total Affected Population
11,604 2,158 18.6% 859 7.4% 907 7.8%
Alternative 2B 65-70 DNL 4,355 980 22.5%6 336 7.7% 367 8.4% 70-75 DNL 3,547 663 18.7% 264 7.4% 241 6.8% 75+ DNL 5,545 792 14.3% 363 6.5% 413 7.4% Total Affected Population
13,447 2,435 18.1% 963 7.2% 1,021 7.6%
Population Change from No Action Alternative 65-70 DNL 214 115 - 29 - 48 - 70-75 DNL 254 14 - -2 - 8 - 75+ DNL 1,375 148 - 77 - 58 - Total Population Change from No Action Alternative 7
1,843 277 15.0% 104 5.6% 114 6.2%
Sources: USCB 2012a, 2012b, 2012c, 2012d; USCB n.d.[a], n.d.[b], n.d.[c]
Note: 1 DNL contours extend into Jefferson and San Juan Counties. However, because no permanent residences are located
within these DNL contours, these counties have been excluded from the analysis. Populations on military properties with in the DNL contours (NAS Whidbey Island [Ault Field], the Seaplane Base, and OLF Coupeville) have also been excluded from the analysis.
2 All population estimates for areas under the DNL contours utilized 2010 U.S. Census Bureau data. A 5.4-percent growth factor was applied to the 2010 census statistics to account for population changes between 2010 and 2020 based on medium forecasted population projections during that period (Washington State Office of Financial Management, 2012).
3 Minority is defined as individuals who are members of the following population groups: American Indian or Alaska Native, Asian, Native Hawaiian or Pacific Islander, or Black or African American.
4 Hispanic or Latino population is defined as individuals who self-identify as belonging to this ethnic group in U.S. Census surveys. This population definition is based on ethnicity and not race.
5 The analysis relied on poverty data from the 2006-2010 American Community Survey 5-Year Estimates because the U.S. Census Bureau no longer reports poverty data in the decennial census. The American Community Survey does not estimate data at the census block group level; therefore, the percent of the population below the poverty level is displayed in this table at the census tract level. Consequently, census block groups within the same census tract will report the same value.
6 The shaded cells indicate the alternatives/scenarios that contain percentages of minority or Hispanic/Latino populations that are “meaningfully greater” than those within Island County as a whole or that contain percentages of low-income populations that are greater than (or equal to) those within Island County. These shaded cells indicate where environmental justice communities have been identified based on the indicated thresholds.
7 Due to rounding, some totals may not sum.

F-11
Table F-8 Environmental Justice Populations at the NAS Whidbey Island Complex under Alternative 2, Scenario C, High-Tempo FCLP Year
DNL Contours1 Total Affected Population2
Total Minority Population3
Percent Minority
Total Hispanic or Latino Origin4
Percent Hispanic or Latino Origin
Total Low-Income Population5
Percent Low Income
No Action Alternative 65-70 DNL 4,141 865 20.9% 307 7.4% 319 7.7% 70-75 DNL 3,293 649 19.7% 266 8.1% 233 7.1% 75+ DNL 4,170 644 15.4% 286 6.9% 355 8.5% Total Affected Population
11,604 2,158 18.6% 859 7.4% 907 7.8%
Alternative 2C 65-70 DNL 5,055 1,088 21.5%6 380 7.5% 398 7.9% 70-75 DNL 3,454 650 18.8% 260 7.5% 234 6.8% 75+ DNL 5,056 779 15.4% 343 6.8% 416 8.2% Total Affected Population
13,565 2,517 18.6% 983 7.2% 1,048 7.7%
Population Change from No Action Alternative 65-70 DNL 914 223 - 73 - 79 - 70-75 DNL 161 1 - -6 - 1 - 75+ DNL 886 135 - 57 - 61 - Total Population Change from No Action Alternative7
1,961 359 18.3% 124 6.3% 141 7.2%
Sources: USCB 2012a, 2012b, 2012c, 2012d; USCB n.d.[a], n.d.[b], n.d.[c]
Note: 1 DNL contours extend into Jefferson and San Juan Counties. However, because no permanent residences are located
within these DNL contours, these counties have been excluded from the analysis. Populations on military properties with in the DNL contours (NAS Whidbey Island [Ault Field], the Seaplane Base, and OLF Coupeville) have also been excluded from the analysis.
2 All population estimates for areas under the DNL contours utilized 2010 U.S. Census Bureau data. A 5.4-percent growth factor was applied to the 2010 census statistics to account for population changes between 2010 and 2020 based on medium forecasted population projections during that period (Washington State Office of Financial Management, 2012).
3 Minority is defined as individuals who are members of the following population groups: American Indian or Alaska Native, Asian, Native Hawaiian or Pacific Islander, or Black or African American.
4 Hispanic or Latino population is defined as individuals who self-identify as belonging to this ethnic group in U.S. Census surveys. This population definition is based on ethnicity and not race.
5 The analysis relied on poverty data from the 2006-2010 American Community Survey 5-Year Estimates because the U.S. Census Bureau no longer reports poverty data in the decennial census. The American Community Survey does not estimate data at the census block group level; therefore, the percent of the population below the poverty level is displayed in this table at the census tract level. Consequently, census block groups within the same census tract will report the same value.
6 The shaded cells indicate the alternatives/scenarios that contain percentages of minority or Hispanic/Latino populations that are “meaningfully greater” than those within Island County as a whole or that contain percentages of low-income populations that are greater than (or equal to) those within Island County. These shaded cells indicate where environmental justice communities have been identified based on the indicated thresholds.
7 Due to rounding, some totals may not sum.

F-12
Table F-9 Environmental Justice Populations at the NAS Whidbey Island Complex under Alternative 3, Scenario A, High-Tempo FCLP Year
DNL Contours1 Total Affected Population2
Total Minority Population3
Percent Minority
Total Hispanic or Latino Origin4
Percent Hispanic or Latino Origin
Total Low-Income Population5
Percent Low Income
No Action Alternative 65-70 DNL 4,141 865 20.9% 307 7.4% 319 7.7% 70-75 DNL 3,293 649 19.7% 266 8.1% 233 7.1% 75+ DNL 4,170 644 15.4% 286 6.9% 355 8.5% Total Affected Population
11,604 2,158 18.6% 859 7.4% 907 7.8%
Alternative 3A 65-70 DNL 4,348 917 21.1%6 331 7.6% 355 8.2% 70-75 DNL 2,970 560 18.9% 221 7.4% 212 7.1% 75+ DNL 5,675 740 13.0% 351 6.2% 390 6.9% Total Affected Population
12,993 2,217 17.1% 903 6.9% 957 7.4%
Population Change from No Action Alternative 65-70 DNL 207 52 - 24 - 36 - 70-75 DNL -323 -89 - -45 - -21 - 75+ DNL 1,505 96 - 65 - 35 - Population Change from No Action Alternative7
1,389 59 4.2% 44 3.2% 50 3.6%
Sources: USCB 2012a, 2012b, 2012c, 2012d; USCB n.d.[a], n.d.[b], n.d.[c] Note: 1 DNL contours extend into Jefferson and San Juan Counties. However, because no permanent residences are located
within these DNL contours, these counties have been excluded from the analysis. Populations on military properties with in the DNL contours (NAS Whidbey Island [Ault Field], the Seaplane Base, and OLF Coupeville) have also been excluded from the analysis.
2 All population estimates for areas under the DNL contours utilized 2010 U.S. Census Bureau data. A 5.4-percent growth factor was applied to the 2010 census statistics to account for population changes between 2010 and 2020 based on medium forecasted population projections during that period (Washington State Office of Financial Management, 2012).
3 Minority is defined as individuals who are members of the following population groups: American Indian or Alaska Native, Asian, Native Hawaiian or Pacific Islander, or Black or African American.
4 Hispanic or Latino population is defined as individuals who self-identify as belonging to this ethnic group in U.S. Census surveys. This population definition is based on ethnicity and not race.
5 The analysis relied on poverty data from the 2006-2010 American Community Survey 5-Year Estimates because the U.S. Census Bureau no longer reports poverty data in the decennial census. The American Community Survey does not estimate data at the census block group level; therefore, the percent of the population below the poverty level is displayed in this table at the census tract level. Consequently, census block groups within the same census tract will report the same value.
6 The shaded cells indicate the alternatives/scenarios that contain percentages of minority or Hispanic/Latino populations that are “meaningfully greater” than those within Island County as a whole or that contain percentages of low-income populations that are greater than (or equal to) those within Island County. These shaded cells indicate where environmental justice communities have been identified based on the indicated thresholds.
7 Due to rounding, some totals may not sum.

F-13
Table F-10 Environmental Justice Populations at the NAS Whidbey Island Complex under Alternative 3, Scenario B, High-Tempo FCLP Year
DNL Contours1 Total Affected Population2
Total Minority Population3
Percent Minority
Total Hispanic or Latino Origin4
Percent Hispanic or Latino Origin
Total Low- Income Population5
Percent Low Income
No Action Alternative 65-70 DNL 4,141 865 20.9% 307 7.4% 319 7.7% 70-75 DNL 3,293 649 19.7% 266 8.1% 233 7.1% 75+ DNL 4,170 644 15.4% 286 6.9% 355 8.5% Total Affected Population
11,604 2,158 18.6% 859 7.4% 907 7.8%
Alternative 3B 65-70 DNL 4,363 979 22.4%6 337 7.7% 367 8.4% 70-75 DNL 3,505 660 18.8% 261 7.4% 240 6.8% 75+ DNL 5,633 793 14.1% 365 6.5% 414 7.3% Total Affected Population
13,501 2,432 18.0% 963 7.1% 1,021 7.6%
Net Change from No Action Alternative 65-70 DNL 222 114 - 30 - 48 - 70-75 DNL 212 11 - -5 - 7 - 75+ DNL 1,463 149 - 79 - 59 - Total Population Change from No Action Alternative7
1,897 274 14.4% 104 5.5% 114 6.0%
Sources: USCB 2012a, 2012b, 2012c, 2012d; USCB n.d.[a], n.d.[b], n.d.[c]
Note: 1 DNL contours extend into Jefferson and San Juan Counties. However, because no permanent residences are located
within these DNL contours, these counties have been excluded from the analysis. Populations on military properties with in the DNL contours (NAS Whidbey Island [Ault Field], the Seaplane Base, and OLF Coupeville) have also been excluded from the analysis.
2 All population estimates for areas under the DNL contours utilized 2010 U.S. Census Bureau data. A 5.4-percent growth factor was applied to the 2010 census statistics to account for population changes between 2010 and 2020 based on medium forecasted population projections during that period (Washington State Office of Financial Management, 2012).
3 Minority is defined as individuals who are members of the following population groups: American Indian or Alaska Native, Asian, Native Hawaiian or Pacific Islander, or Black or African American.
4 Hispanic or Latino population is defined as individuals who self-identify as belonging to this ethnic group in U.S. Census surveys. This population definition is based on ethnicity and not race.
5 The analysis relied on poverty data from the 2006-2010 American Community Survey 5-Year Estimates because the U.S. Census Bureau no longer reports poverty data in the decennial census. The American Community Survey does not estimate data at the census block group level; therefore, the percent of the population below the poverty level is displayed in this table at the census tract level. Consequently, census block groups within the same census tract will report the same value.
6 The shaded cells indicate the alternatives/scenarios that contain percentages of minority or Hispanic/Latino populations that are “meaningfully greater” than those within Island County as a whole or that contain percentages of low-income populations that are greater than (or equal to) those within Island County. These shaded cells indicate where environmental justice communities have been identified based on the indicated thresholds.
7 Due to rounding, some totals may not sum. .
F-14
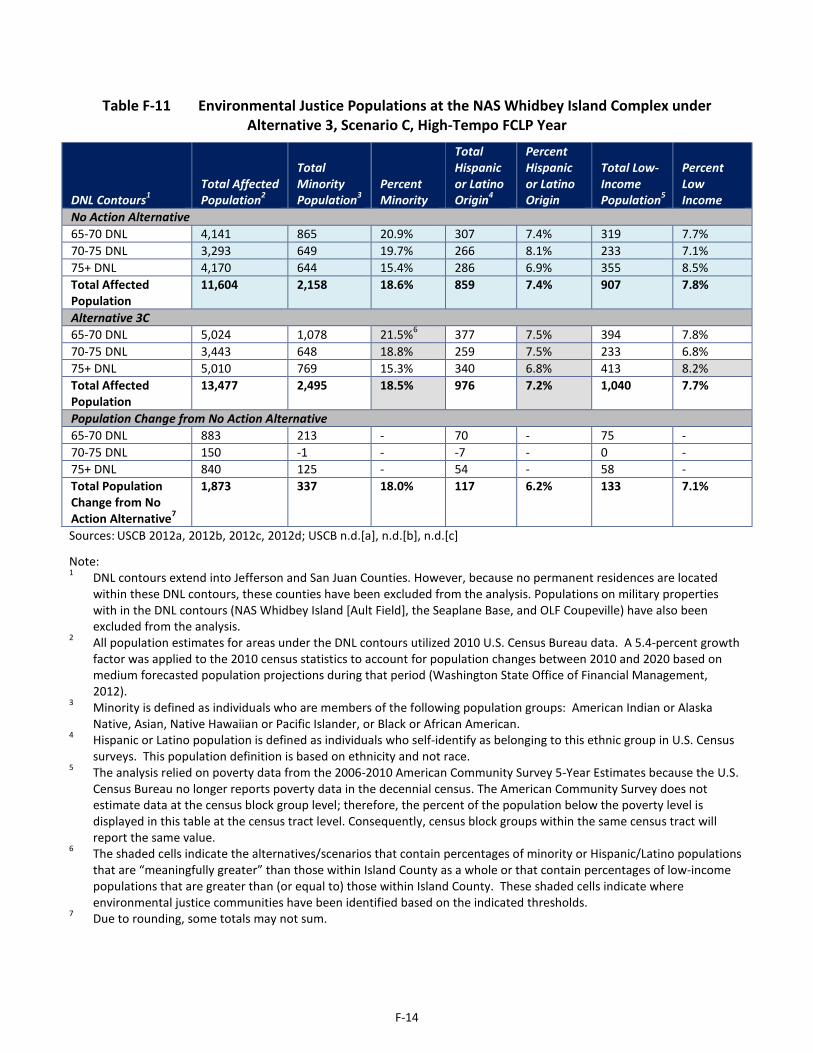
Table F-11 Environmental Justice Populations at the NAS Whidbey Island Complex under Alternative 3, Scenario C, High-Tempo FCLP Year
DNL Contours1 Total Affected Population2
Total Minority Population3
Percent Minority
Total Hispanic or Latino Origin4
Percent Hispanic or Latino Origin
Total Low- Income Population5
Percent Low Income
No Action Alternative 65-70 DNL 4,141 865 20.9% 307 7.4% 319 7.7% 70-75 DNL 3,293 649 19.7% 266 8.1% 233 7.1% 75+ DNL 4,170 644 15.4% 286 6.9% 355 8.5% Total Affected Population
11,604 2,158 18.6% 859 7.4% 907 7.8%
Alternative 3C 65-70 DNL 5,024 1,078 21.5%6 377 7.5% 394 7.8% 70-75 DNL 3,443 648 18.8% 259 7.5% 233 6.8% 75+ DNL 5,010 769 15.3% 340 6.8% 413 8.2% Total Affected Population
13,477 2,495 18.5% 976 7.2% 1,040 7.7%
Population Change from No Action Alternative 65-70 DNL 883 213 - 70 - 75 - 70-75 DNL 150 -1 - -7 - 0 - 75+ DNL 840 125 - 54 - 58 - Total Population Change from No Action Alternative7
1,873 337 18.0% 117 6.2% 133 7.1%
Sources: USCB 2012a, 2012b, 2012c, 2012d; USCB n.d.[a], n.d.[b], n.d.[c]
Note: 1 DNL contours extend into Jefferson and San Juan Counties. However, because no permanent residences are located
within these DNL contours, these counties have been excluded from the analysis. Populations on military properties with in the DNL contours (NAS Whidbey Island [Ault Field], the Seaplane Base, and OLF Coupeville) have also been excluded from the analysis.
2 All population estimates for areas under the DNL contours utilized 2010 U.S. Census Bureau data. A 5.4-percent growth factor was applied to the 2010 census statistics to account for population changes between 2010 and 2020 based on medium forecasted population projections during that period (Washington State Office of Financial Management, 2012).
3 Minority is defined as individuals who are members of the following population groups: American Indian or Alaska Native, Asian, Native Hawaiian or Pacific Islander, or Black or African American.
4 Hispanic or Latino population is defined as individuals who self-identify as belonging to this ethnic group in U.S. Census surveys. This population definition is based on ethnicity and not race.
5 The analysis relied on poverty data from the 2006-2010 American Community Survey 5-Year Estimates because the U.S. Census Bureau no longer reports poverty data in the decennial census. The American Community Survey does not estimate data at the census block group level; therefore, the percent of the population below the poverty level is displayed in this table at the census tract level. Consequently, census block groups within the same census tract will report the same value.
6 The shaded cells indicate the alternatives/scenarios that contain percentages of minority or Hispanic/Latino populations that are “meaningfully greater” than those within Island County as a whole or that contain percentages of low-income populations that are greater than (or equal to) those within Island County. These shaded cells indicate where environmental justice communities have been identified based on the indicated thresholds.
7 Due to rounding, some totals may not sum.