Embed Size (px)
Citation preview
APPENDIX E: RIDERSHIP MODELLING AND TRAFFIC
APPENDIX E-3: VISSIM MODELLING REPORT
PART 1/1
City of Hamilton and Metrolinx
Hamilton Light Rail Transit (LRT)
Environmental Project Report (EPR) Addendum

Hamilton LRT Corridor Modelling Report
City of Hamilton
Report January 2017
Our ref: 22879302

Hamilton LRT Corridor Modelling Report
City of Hamilton
Report January 2017
Our ref: 22879302
Prepared by:
Prepared for:
Steer Davies Gleave 1500-330 Bay St Toronto, ON, M5H 2S8 Canada
City of Hamilton
+1 (647) 260 4861 na.steerdaviesgleave.com
Contents
Executive Summary ............................................................................................................................. i
Overview ...............................................................................................................................................i
Modelling Assumptions ........................................................................................................................i
Corridor Operation .............................................................................................................................. ii
2 Overall Modelling Process ............................................................................................................ 3
Modelling Suite ................................................................................................................................... 3
EMME ................................................................................................................................................. 4
VISUM ................................................................................................................................................. 5
VISSIM ................................................................................................................................................. 5
4 VISSIM Base Model ...................................................................................................................... 6
VISSIM Base Model Calibration ........................................................................................................ 16
VISSIM Base Travel Time Outputs .................................................................................................... 18
5 2031 BAU Model Coding ............................................................................................................ 24
Overview ........................................................................................................................................... 24
Business As Usual (BAU) Outputs ..................................................................................................... 24
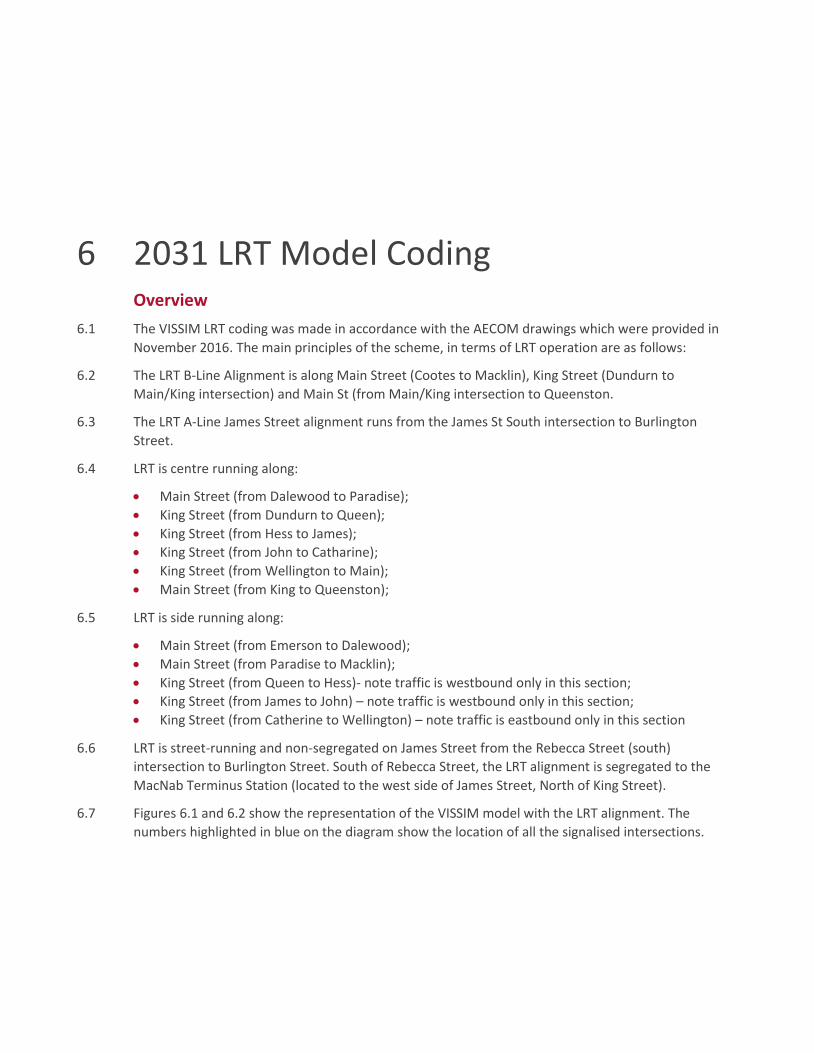
6 2031 LRT Model Coding .............................................................................................................. 30
Overview ........................................................................................................................................... 30
Signal Operation ............................................................................................................................... 31
Other Assumptions ........................................................................................................................... 36
7 LRT Corridor Operation .............................................................................................................. 37
Overview ........................................................................................................................................... 37
Corridor Operation ........................................................................................................................... 37
Auto Travel Times in the LRT Corridor .............................................................................................. 38
LRT Travel Time and Travel Time Reliability ..................................................................................... 45
Conclusions ....................................................................................................................................... 46
Figures
Figure 2.1: Modelling Geographic Overview ...................................................................................... 3
Figure 2.2: Model Structure ................................................................................................................ 4
Figure 4.1: VISSIM Model – Base Network Coverage ......................................................................... 7
Figure 4.2: Example of VISSIM Traffic Signal Controller showing Intersection Timing Data ............ 12
Figure 4.3: Signalised Intersections in VISSIM (west half of network) ............................................. 13
Figure 4.4: Signalised Intersections in VISSIM (east half of network) .............................................. 14
Figure 4.5: Cordoned VISUM Model ................................................................................................. 15
Figure 4.6: Turning Movement Count (TMC) Coverage ................................................................... 17
Figure 4.7: AM Peak Travel Time Comparison – King Street Westbound (from Reid Ave to Cootes Dr) ..................................................................................................................................................... 19
Figure 4.8: AM Peak Travel Time Comparison – Main Street Eastbound (from King St to Cootes Dr) .......................................................................................................................................................... 19
Figure 4.9: AM Peak Travel Time Comparison – James Street Southbound (from Burlington St to Main St) ............................................................................................................................................. 20
Figure 4.10: AM Peak Travel Time Comparison – James Street Southbound (from Main St to Burlington St) .................................................................................................................................... 20
Figure 4.11: PM Peak Travel Time Comparison – King Street Westbound (from Reid Ave to Cootes Dr) ..................................................................................................................................................... 21
Figure 4.12: PM Peak Travel Time Comparison – Main Street Eastbound (from King St to Cootes Dr) .......................................................................................................................................................... 21
Figure 4.13: PM Peak Travel Time Comparison – James Street Southbound (from Burlington St to Main St) ............................................................................................................................................. 22
Figure 4.14: PM Peak Travel Time Comparison – James Street Southbound (from Main St to Burlington St) .................................................................................................................................... 22
Figure 5.1: AM Peak BAU Car Travel Times - King Street WB (Reid to Cootes) ................................ 25
Figure 5.2: AM Peak BAU Car Travel Times - Main Street EB (King to Reid) .................................... 26
Figure 5.3: AM Peak BAU Car Travel Times - James St SB (Burlington to Main) .............................. 26
Figure 5.4: AM Peak BAU Car Travel Times - James St NB (Burlington to Main) .............................. 27
Figure 5.5: PM Peak BAU Car Travel Times - King Street WB (Reid to Cootes) ................................ 27
Figure 5.6: PM Peak BAU Car Travel Times - Main Street EB (King to Reid) ..................................... 28
Figure 5.7 PM Peak BAU Car Travel Times - James St SB (Burlington to Main) ................................ 28
Figure 5.8: PM Peak BAU Car Travel Times - James St NB (Burlington to Main) .............................. 29
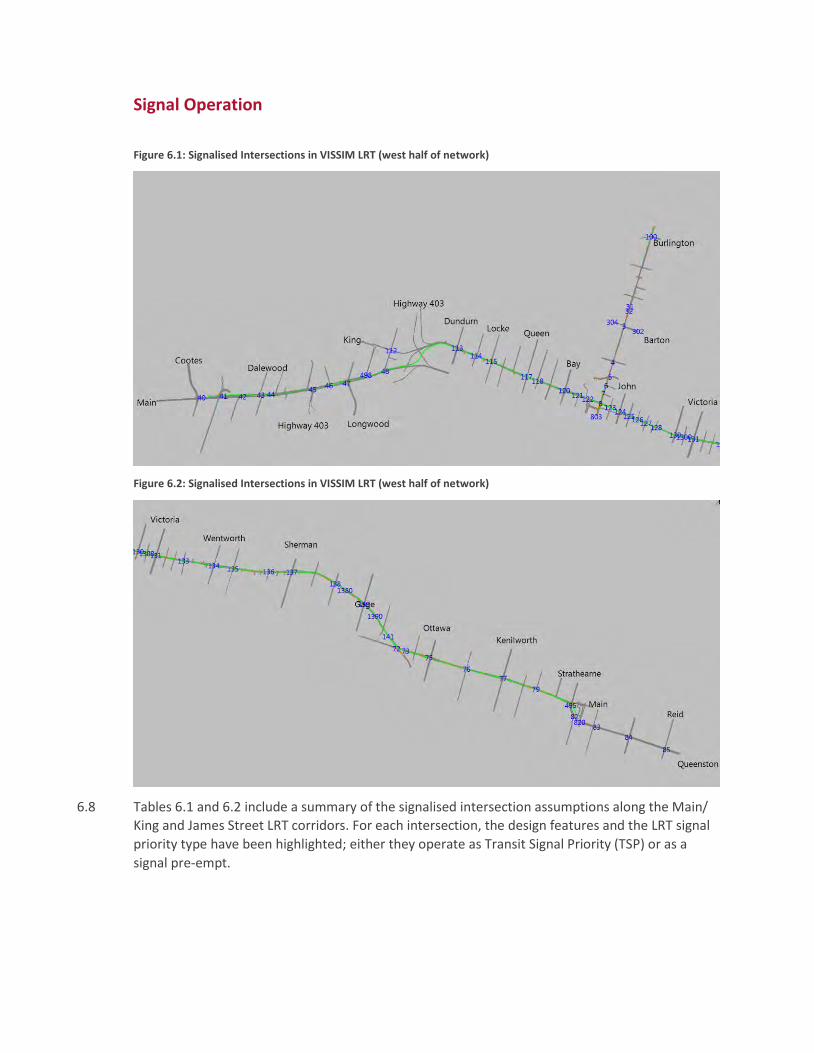
Figure 6.1: Signalised Intersections in VISSIM LRT (west half of network) ....................................... 31
Figure 6.2: Signalised Intersections in VISSIM LRT (west half of network) ....................................... 31
Figure 6.3: VISSIM RBC Controller Module ....................................................................................... 35
Figure 7.1: AM Peak BAU and LRT Car Travel Times - King Street Section 1 WB (Reid to Wellington) .......................................................................................................................................................... 40
Figure 7.2: AM Peak BAU and LRT Car Travel Times - King Street Section 2 WB (Catharine to Cootes) .............................................................................................................................................. 40
Figure 7.3: AM Peak BAU and LRT Car Travel Times - Main Street EB (King to Reid) ....................... 41
Figure 7.4: AM Peak BAU and LRT Car Travel Times - James St SB (Burlington to Main) ................. 41
Figure 7.5: AM Peak BAU and LRT Car Travel Times - James St NB (Main to Burlington) ................ 42
Figure 7.6: PM Peak BAU and LRT Car Travel Times - King Street Section 1 WB (Reid to Wellington) .......................................................................................................................................................... 42
Figure 7.7: PM Peak BAU and LRT Car Travel Times - King Street Section 2 WB (Catharine to Cootes) .............................................................................................................................................. 43
Figure 7.8: PM Peak BAU and LRT Car Travel Times - Main Street EB (King to Reid) ....................... 43
Figure 7.9 PM Peak BAU and LRT Car Travel Times - James St SB (Burlington to Main) .................. 44
Figure 7.10: PM Peak BAU and LRT Car Travel Times - James St NB (Burlington to Main) .............. 44
Figure 7.11: LRT Travel Times in the AM peak ................................................................................. 45
Figure 7.12: LRT travel time in the PM peak..................................................................................... 46
Tables
Table 4.1: Bus Services in VISSIM Base Model ................................................................................. 11
Table 4.2: VISSIM Cordon Area Matrix Totals................................................................................... 15
Table 4.3: Global Profiles (in 15 minute intervals) ........................................................................... 16
Table 4.4: VISSIM AM Peak Link and Turn Calibration ..................................................................... 18
Table 4.5: VISSIM PM Peak Link and Turn Calibration ...................................................................... 18
Table 4.6: Travel Time Statistics AM Peak ........................................................................................ 23
Table 4.7: Travel Time Statistics PM Peak ........................................................................................ 23
Table 5.1: Comparison of AM Car Travel Times on the LRT corridor ............................................... 24
Table 5.2: Comparison of PM Car Travel Times on the LRT corridor ................................................ 25
Table 6.1: B-Line Traffic Signal Assumptions and Design Features .................................................. 32
Table 6.2: A-Line Traffic Signal Assumptions and Design Features .................................................. 34

Table 7.1: Comparison of AM Car Travel Times on the LRT corridor .............................................. 38
Table 7.2: Comparison of PM Car Travel Times on the LRT corridor ................................................ 39
Executive Summary
Overview
In May 2015 $1 billion funding was announced for the Hamilton LRT project. The project that had previously received TPAP approval has been reconfigured with its eastern terminus now being at Queenston Traffic Circle (replacing Eastgate Square), and with a new section of alignment on James Street linking West Harbour GO Station and the Waterfront.
Over the last 12 months the design of the LRT alignment along these revised routes, and their stop locations have been the subject of a detailed review. This has resulted in a re-configured alignment with twin LRT tracks running in the centre of the road. Many LRT stops have also been redesigned, with platforms staggered either side of main intersections. Known as ‘far-side’ stops- the platforms are placed at the far-side of intersections- they maximize passenger catchments, and allow left-turning and u-turning traffic movements to also be accommodated.
The updates to the LRT route(s) and alignment have also created changes to the surrounding road network- some minor intersections have had turning movement restrictions introduced- to improve priority for the LRT and realize journey time and service reliability benefits. Along much of the LRT route on King Street single lane, two-way traffic movements and access have been introduced, and the LRT has also been complemented by a review of local transit (bus) services, removing duplicate services and amending services to feed into new transfer facilities at McMaster University, MacNab, and Queenston.
All of these changes result in the need to update the TPAP approval for the LRT project. This includes long term ridership forecasting, and an assessment of traffic impacts, along with consideration of other environmental factors.
Common with other modern urban style LRT projects, and following the approach used for the original Hamilton LRT TPAP- the assessment of ridership and traffic uses a set of computer models to understand the benefits and impacts of the proposed LRT project. The results go through a process of testing, modification, iteration and refinement to achieve a balance of competitive LRT performance and efficient traffic operation.
Modelling Assumptions
This document focuses on the work undertaken in VISSIM to understand the operation of both auto and LRT on the alignment once the LRT is operational. Two models were developed for each scenario year for the AM and PM peak hours – a ‘Without LRT’ Business as Usual (BAU) scenario and a ‘With-LRT’ scenario. The BAU and LRT network coding is consistent with the coding included in the VISUM Wider Area Model, which is the source of the traffic demands for the VISSIM model.
Within the EMME and VISUM, a number of updates were required due to changes implemented between the 2011 Base Model and the current 2015/2016 situation, as well as committed improvements between the present day and the forecast years. There were a significant number of changes within the BAU network relating to two-way conversions and the implementation of bike lanes proposed by the City as part of the TMP. Limited information was available on intersection layouts and traffic signal operation; so appropriate assumptions have been made.
The key changes made between the 2011 and 2031 models were as follows: -
Wentworth 2-way from Delaware to Barton Hughson 2-way from Barton to Wilson Victoria 2-way from Burlington to Sawyer Cannon – 1 lane reduction York – 1 lane reduction from Dundurn to Queen MacNab – bus only lane from King to Main
Forecast Demand
Traffic demand was generated within the 2031 EMME model and the increment of demand between the 2011 and 2031 EMME was added to the calibrated 2011 VISUM base matrix. Traffic is forecast to grow significantly between 2011 and the 2031 forecast year and initial work indicated that the Business as Usual network was over capacity.
A peak spreading factor was assumed as it has been shown that as networks become more congested, some trips move the time of their trip to avoid the time of peak congestion. This approach allowed all demand to be included within the network and for the network to be optimized to understand the key locations that required further work. Matrices for the VISSIM model were cordoned directly from VISUM.
Network Evaluation Process
Once the demand for each of the scenarios had been established, traffic was assigned into the different scenarios within VISUM. Intersections with high delays and queuing were examined in detail and adjustments made in order to reduce the queuing and delays and improve network operation. This process was iterative with flows being assigned and changes made and then flows being assigned again. Quite often reducing delays in one location caused traffic re-routing and impacted on other intersections which then required mitigation.
Initial work was undertaken in the VISUM ‘without LRT’ BAU scenario and those changes were implemented within the VISUM ‘With LRT’ scenario before the optimisation was undertaken in that scenario. In each instance, a range of different interventions were considered and these are set out below. Some are minor changes, while some intersections require more significant measures in order to operate at an acceptable level.
Traffic signal operations Timing allocation Staging changes Dedicated turn phases Signal cycle times
Intersection layout Turning lane reallocation Addition of turning lanes Addition of a dedicated slip lane Turn movement bans
Once the VISUM network had been established and the mitigations implemented, traffic demand was cordoned to provide the demands for VISSIM.
The network coding for the VISSIM models had been undertaken in parallel, along with developing the potential signal priority to ensure the best level of priority for the LRT.
Corridor Operation
An initial signals strategy had been developed for implementation in VISUM. Due to the implementation of the LRT design, there were a few locations where the minimum green required for each of the movements was approaching the assumed cycle times. This limited the flexibility within the models for the LRT stage timings to be extended, and in turn reduced the flexibility to provide the LRT with full priority. A key contributor to this was the minimum green times required for the pedestrian crossings.
Two options were considered – increasing the cycle times along the corridor (and ultimately within the wider network), or considering the use of staggered pedestrian crossings. It was decided to implement the latter option and this resulted in changes being required at the following locations:
Main and Emerson; Main and Longwood; Main and Ottawa; Main and Kenilworth; King and Dundurn; King and Queen; King and Wellington; King and Wentworth; King and Sherman; and King and Melrose.
In all the cases stated above, there is an LRT platform that can form this island and in the case of Emerson this crossing is currently staggered on-street so it is actually more in keeping with the existing situation to have the staggered layout.
Both the design that went to the Public Information Centres in September 2016 as well as the final December 2016 design including amendments from the PIC’s were modelled. This report focuses on the results from the final design run.
Overview of VISSIM model results
The key output from the corridor VISSIM models is average travel times for auto and LRT. As VISSIM is a micro-simulation model, the outputs for each run are slightly different. Multiple runs were undertaken using random ‘seed’ values and the output times from these runs are average to be included within the reporting.
Overall auto travel times along the corridor are not significantly impacted as the major traffic movements run with LRT. Movements turning onto and off the corridor are restricted, but the traffic diversion is captured as part of the wider area reporting.
The LRT travel time developed independently of VISSIM in a Runtime model was 20:20 excluding dwells and 24:05 including dwells. This compares with the travel times (including dwells) being output from VISSIM, which range from 24:45 to 27:09 in the AM Peak hour with an average time of 25:44. In the PM peak hour LRT travel times range from 24:10 to 27:00 with an average time of 25:47. In both the AM and PM peak VISSIM models, LRT run times are on average 7% longer than
the runtime calculated independent of traffic. The main reason why VISSIM modelled runtimes are slightly slower than the independent results is due to the level of priority assumed. In the Runtime model, full priority is assumed at certain intersections (with just a slowing down across the actual intersection), whereas in the VISSIM model, where Transit Signal Priority (TSP) has been coded, there is still a probability the LRT vehicle will get stopped at a red light, hence the slightly longer travel times.
The modelling work undertaken for the EA/TPAP amendment process has shown that the LRT can be accommodated within the Hamilton network and that solutions have been developed to mitigate the identified traffic impacts and potential delays to LRT. As the design continues to be refined through the PSOS, City/Metrolinx and consulting team staff will continue to review the design and implementation requirements.
Introduction Project Background
1.1 In May 2015 $1 billion funding was announced for the Hamilton LRT project. The project that had previously received TPAP approval has been reconfigured with its eastern terminus now being at Queenston Traffic Circle (replacing Eastgate Square), and with a new section of alignment on James Street linking West Harbour GO Station or the Waterfront.
1.2 Over the last 12 months the design of the LRT alignment along these revised routes, and their stop locations have been the subject of a detailed review. This has resulted in a re-configured alignment with twin LRT tracks running in the centre of the road. Many LRT stops have also been redesigned, with platforms staggered either side of main intersections. Known as ‘far-side’ stops- the platforms are placed at the far-side of intersections- they maximize passenger catchments, and allow left-turning and u-turning traffic movements to also be accommodated.
1.3 The updates to the LRT route(s) and alignment have also created changes to the surrounding road network- some minor intersections have had turning movement restrictions introduced- to improve priority for the LRT and realize journey time and service reliability benefits. Along much of the LRT route on King Street single lane, two-way traffic movements and access have been introduced, and the LRT has also been complemented by a review of local transit (bus) services, removing duplicate services and amending services to feed into new transfer facilities at McMaster University, MacNab, and Queenston.
1.4 All of these changes result in the need to update the TPAP approval for the LRT project. This includes long term ridership forecasting, and an assessment of traffic impacts, along with consideration of other environmental factors. This report documents the work undertaken to develop the VISSIM model to analyse the impacts on auto and LRT travel times on the corridor.
1.5 Common with other modern urban style LRT projects, and following the approach used for the original Hamilton LRT TPAP- the assessment of ridership and traffic uses a set of computer models to understand the benefits and impacts of the proposed LRT project. The results go through a process of testing, modification, iteration and refinement to achieve a balance of competitive LRT performance and efficient traffic operation. This process is on-going as part of the updated TPAP process and is due to be completed in early 2017, alongside the development of project details for the Reference Concept Design (RCD) and procurement documentation (Project Specific Output Specification- PSOS).
Report Structure
1.6 Following this introductory section, the report is structured as follows: -
Chapter 2: Overall Modelling Process Chapter 3: Corridor Modelling Process Chapter 4: 2011 Base Model Chapter 5: 2031 BAU Model Coding Chapter 6: 2031 LRT Model Coding Chapter 6: LRT Corridor Operation
2 Overall Modelling Process
Modelling Suite
2.1 A series of models have been built in EMME, VISUM and VISSIM to provide tools to examine LRT ridership, and traffic impacts. These help inform the design and operation of the LRT system and the wider highway and local transit network. This section of the report provides an overview of each of those models and their specific purpose within the modelling suite.
2.2 The methodology builds on the approach developed to support the business case and traffic impact assessment for the previous B-Line project that received TPAP approval. The updated approach makes best use of available models and data, providing consistency with wider Transportation Master Plan (TMP) activities, and also uses updated versions of software packages to examine area-wide and local traffic impacts.
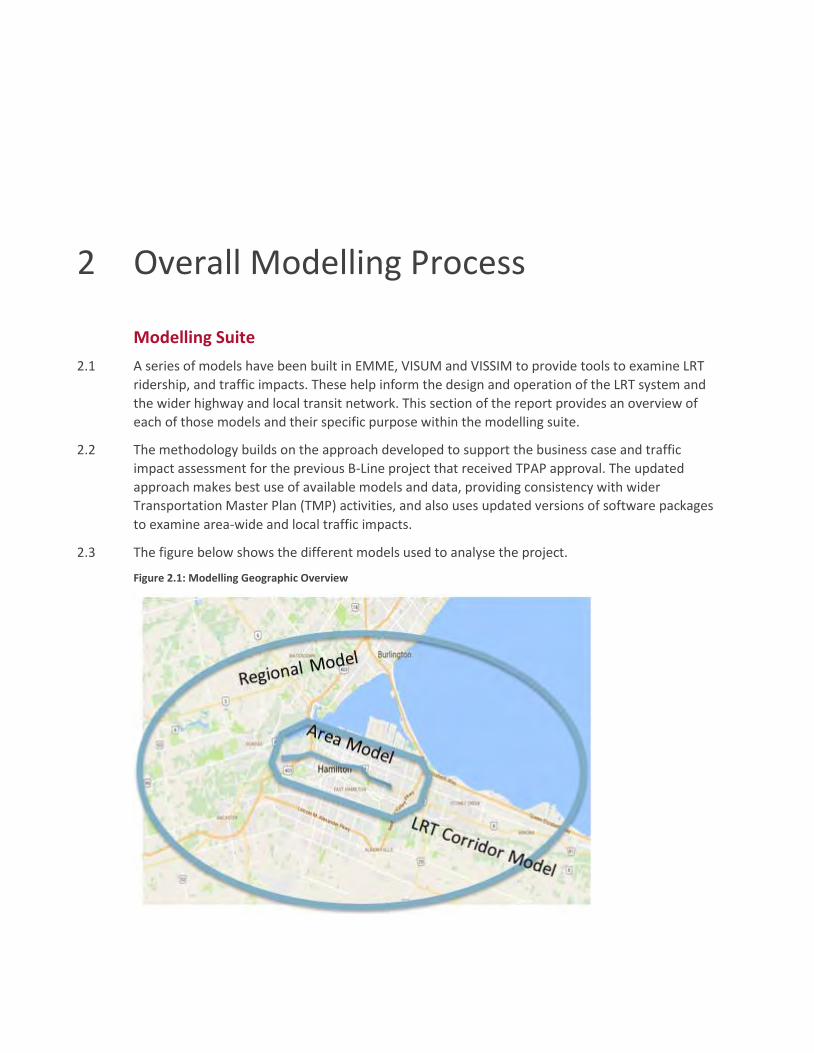
2.3 The figure below shows the different models used to analyse the project.
Figure 2.1: Modelling Geographic Overview
Regional level modelling – EMME Covers the geographic area of Hamilton and beyond Consistent with the models used for the Hamilton Transportation Masterplan (TMP) Includes information on both Transit and Highways Source of LRT Ridership forecasts Provides Information on traffic patterns for more detailed modelling (inputs to VISUM
model) Hamilton Area model - VISUM
Traffic demand based on regional information (EMME model outputs) and local context Able to look at the changes in traffic network flows in the Hamilton area Identify issues, develop measures to limit the impacts and test these measures
Incorporates detailed signal timing and road capacity information
LRT Corridor model - VISSIM Models how the LRT and traffic will interact on the corridor Used to understand the measures required for LRT priority Provides more detailed information on LRT runtimes
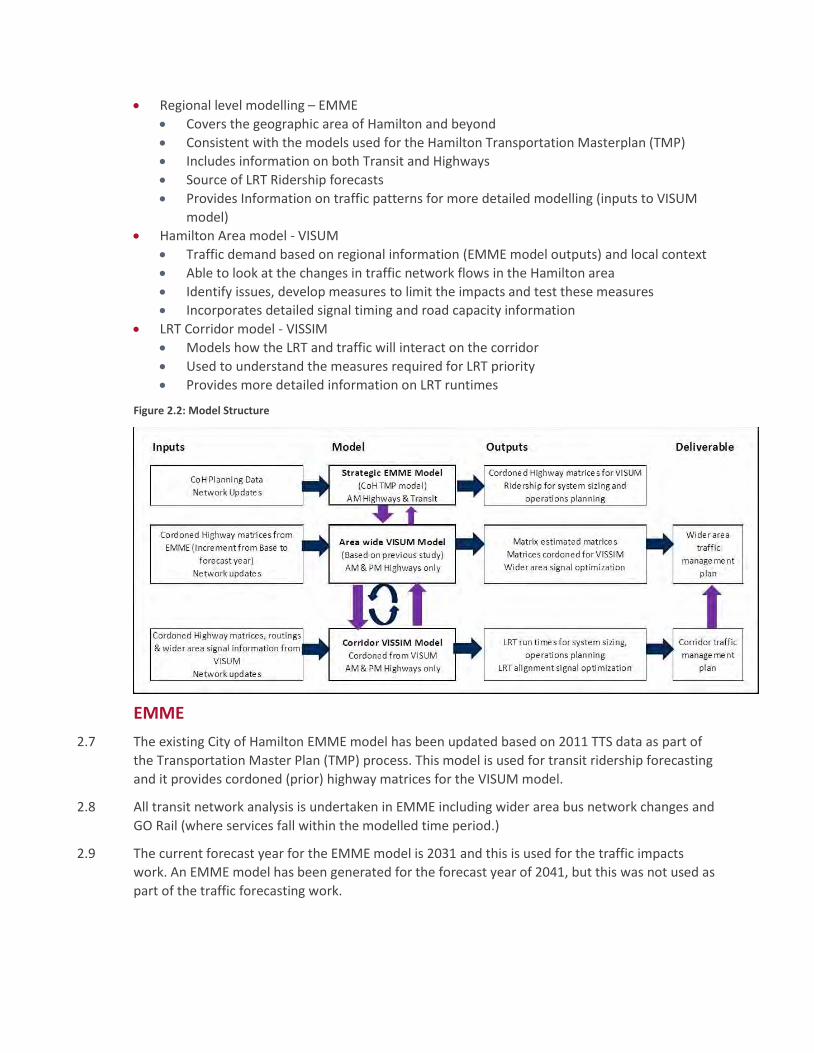
Figure 2.2: Model Structure
EMME
2.7 The existing City of Hamilton EMME model has been updated based on 2011 TTS data as part of the Transportation Master Plan (TMP) process. This model is used for transit ridership forecasting and it provides cordoned (prior) highway matrices for the VISUM model.
2.8 All transit network analysis is undertaken in EMME including wider area bus network changes and GO Rail (where services fall within the modelled time period.)
2.9 The current forecast year for the EMME model is 2031 and this is used for the traffic impacts work. An EMME model has been generated for the forecast year of 2041, but this was not used as part of the traffic forecasting work.
VISUM
2.10 The VISUM model development is documented in the VISUM Base Model report. 2011 was selected as the base year for the model, as that is the latest version of the EMME model held by the client, which provided the cordoned highway matrices for the VISUM model. It is also the most recent year for TTS data which is a primary source of information for EMME model calibration.
2.11 A separate report documents the development of the VISUM future year models and the evaluation and mitigation of the Wider Area Impacts. The future year matrices have been derived by applying the cordoned EMME incremental change between 2011 and 2031. This model will be used to provide traffic information to VISSIM (cordoned demand).
2.12 The PM VISUM model covers the same geographic scope as the AM model. The matrices are based on transposed matrices from the AM period with appropriate adjustments, based on the available PM traffic data.
VISSIM
2.13 The model is a cordoned version of the VISUM model and the geographic scope covers the LRT alignment only. It includes the AM and PM peak hours as well as 30-minute shoulder periods either side of the peak hour. The time periods of the AM models are 7:30-09:30 (8:00-9:00 peak hour) and the PM models are from 16:00-18:00 (16:30-17:30 peak hour) The traffic assignment for this is obtained directly from the VISUM model.
2.14 This model is used to understand in more detail the impacts of the LRT on traffic flow, to allow the calculation of LRT runtimes and the production of video clips showing LRT/intersection operation. For the ‘with LRT’ scenario, information is fed back to VISUM on the corridor operation. The VISSIM model includes Transit Signal Priority (TSP) and/or pre-emption priority on the LRT alignment and subsequently provides detailed analysis of intersection operation and LRT run times.
2.15 The PM VISSIM Model is identical to the AM model, except with PM traffic signal data, PM bus data, PM pedestrian volumes and assignment from the PM VISUM model.
2.16 VISSIM is a micro-simulation model and aims to capture a variety of different responses and so each run produces slightly different travel times – the graphs provide the minimum, maximum and average numbers for the travel times. Note that the observed travel times were captured using a travel time capture tool from Google and are 2016 values.
2.17 The following traffic models for base and future years (2031) have been developed:
Regional AM EMME model for transit and highways (using the TMP study model as the basis); Area wide AM and PM VISUM models for highways; and Corridor AM and PM VISSIM models.
2.18 This combination of models allows the development of ridership forecasts, provides an understanding of the traffic impacts along the LRT corridor and gives the ability to produce VISSIM videos showing traffic and LRT operation on the LRT corridor, and the basis for developing an area traffic management plan.
4 VISSIM Base Model Network Area
4.1 VISSIM base year traffic models have been created for the AM (07:30-09:30) and PM (16:00-18:00) peak periods with 08:00-09:00 and 16:30-17:30 representing the peak hours. Each model is split into eight, 15-minute time intervals with each interval taking a different traffic profile which will be discussed later in this section.
4.2 The area modelled within VISSIM is annotated in Figure 4.1. Main Street and King Street have been modelled to cover the full B-Line LRT alignment from McMaster University in the west to Queenston Road in the east; a length of approximately 10.4km. The full length of the A-Line has also been modelled in the base, which extends from MacNab at the southern end of James Street to Burlington Street in the north; a length of approximately 2.5km. All of the major north/south routes are included within the VISSIM model as follows:
Cootes Drive/ Leland Street; University Avenue/ Emerson Street; Dalewood Avenue; Longwood Road; Dundurn Street; Locke Street; Queen Street; Hess Street; Bay Street; James Street; Hughson Street; John Street; Catharine Street; Wellington Street; Victoria Street; Wentworth Street; Sanford Avenue; Sherman Avenue; Gage Avenue; Ottawa Street; and Kenilworth Avenue;
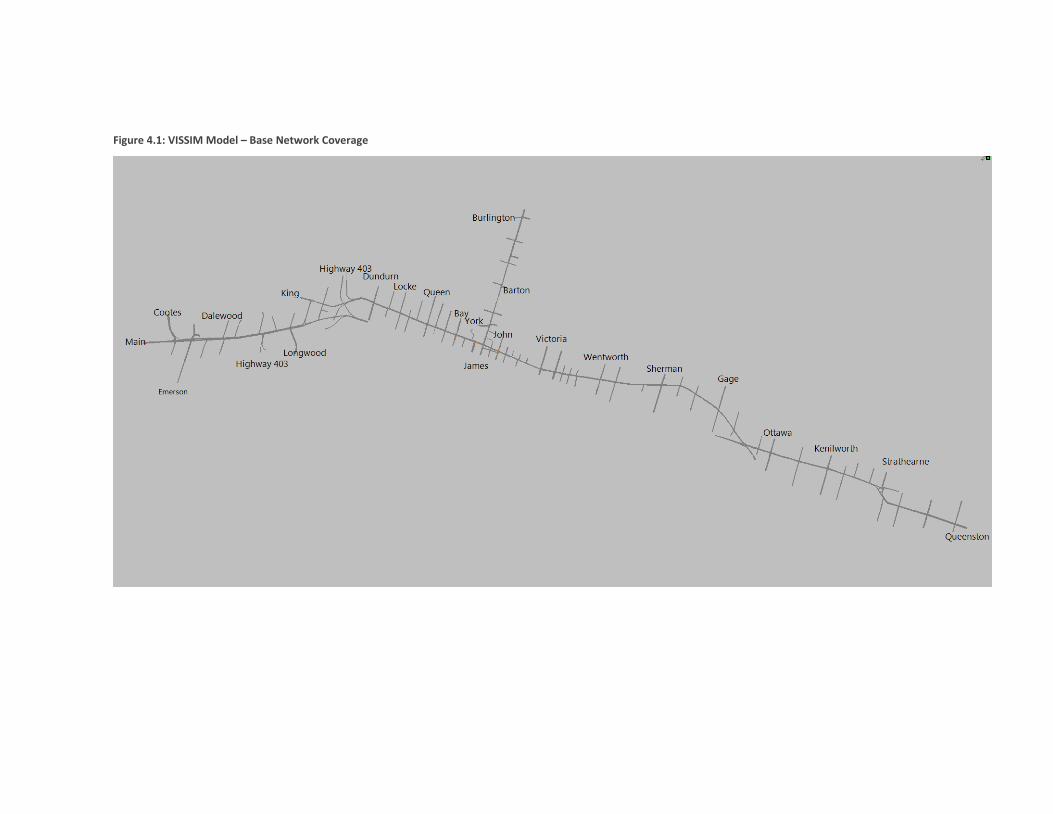
Figure 4.1: VISSIM Model – Base Network Coverage
4.3 Note, the traffic assignment for the wider area was undertaken in VISUM; the VISSIM modelled area contains only a single east/west corridor (King St/Main St) and north/south corridor (James Street) which means there is no route choice available within the VISSIM model.
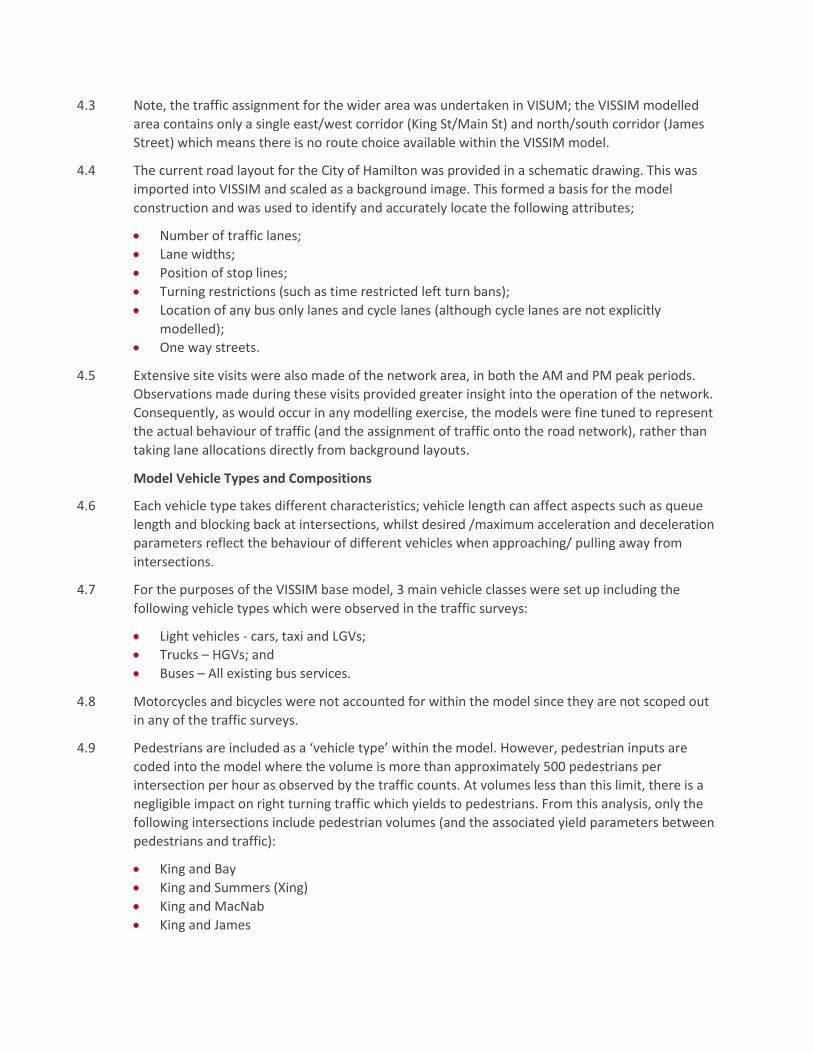
4.4 The current road layout for the City of Hamilton was provided in a schematic drawing. This was imported into VISSIM and scaled as a background image. This formed a basis for the model construction and was used to identify and accurately locate the following attributes;
Number of traffic lanes; Lane widths; Position of stop lines; Turning restrictions (such as time restricted left turn bans); Location of any bus only lanes and cycle lanes (although cycle lanes are not explicitly
modelled); One way streets.
4.5 Extensive site visits were also made of the network area, in both the AM and PM peak periods. Observations made during these visits provided greater insight into the operation of the network. Consequently, as would occur in any modelling exercise, the models were fine tuned to represent the actual behaviour of traffic (and the assignment of traffic onto the road network), rather than taking lane allocations directly from background layouts.
Model Vehicle Types and Compositions
4.6 Each vehicle type takes different characteristics; vehicle length can affect aspects such as queue length and blocking back at intersections, whilst desired /maximum acceleration and deceleration parameters reflect the behaviour of different vehicles when approaching/ pulling away from intersections.
4.7 For the purposes of the VISSIM base model, 3 main vehicle classes were set up including the following vehicle types which were observed in the traffic surveys:
Light vehicles - cars, taxi and LGVs; Trucks – HGVs; and Buses – All existing bus services.
4.8 Motorcycles and bicycles were not accounted for within the model since they are not scoped out in any of the traffic surveys.
4.9 Pedestrians are included as a ‘vehicle type’ within the model. However, pedestrian inputs are coded into the model where the volume is more than approximately 500 pedestrians per intersection per hour as observed by the traffic counts. At volumes less than this limit, there is a negligible impact on right turning traffic which yields to pedestrians. From this analysis, only the following intersections include pedestrian volumes (and the associated yield parameters between pedestrians and traffic):
King and Bay King and Summers (Xing) King and MacNab King and James
King and Hughson King and John Main and Bay Main and Summers (Xing) Main and MacNab Main and James
4.10 A series of vehicle compositions were defined within the VISSIM model. Each vehicle composition contains a vehicle ‘target’ speed which is reached in free flow traffic conditions. Each speed contains a distribution which states by how much it can vary (i.e. from one driver to the next, a free flow vehicle speed will be slightly different). These distributions allow different vehicle types to enter the network at range of speeds, depending on the road type. Essentially, these compositions control the entry speed of vehicles once they enter the model, distributed between a minimum and maximum value;
Cars on Major Streets (48.0, 58.0); Cars on Minor Streets (30.0,35.0); Trucks on Main Streets (40.0, 45.0); Trucks on Minor Streets (30.0,35.0); and
4.11 In terms of speed limits within the network, the first distribution above (48.0, 58.0), is generally applied to represent the existing 50kmph speed limit on the majority of the network. The distribution is slightly higher than the posted speed limit, but this behaviour was widely observed throughout the network.
4.12 In addition, in VISSIM, two types of reduced speed were also applied for traffic turning left or right at all intersections. These are applied globally to take account of general lower vehicular speeds whilst turning, but also as “an adjustment” to take account of pedestrian movements at intersections where pedestrians are not discretely modelled (as outlined above). The two distributions (minimum and maximum value) are:
All vehicles (12.0,15.0); All vehicles (25.0, 30.0).
4.13 The first distribution is generally used for all right turn movements, and left movements that are either split phased or permitted only – this represents the “adjustment” in speed made for the presence of pedestrians. The second is generally used for left turn movements receiving a protected signal or a “pm+pt” signal (but not left turn on a split phased approach), which would not be yielding to pedestrians for at least some portion of the green time.
VISSIM Model Building
4.14 The VISSIM model was created by drawing links and connectors over the background map of the area. These characteristics were verified by utilising overhead images of the area and through an on-site visit. There are effectively two types of links within the model; motorised links and pedestrian links.
4.15 The number of modelled traffic lanes on a particular link sometimes differs from the actual number of lanes. On-street parking can effectively rule out ‘running’ traffic for a particular lane.
Such instances were noted during the site visits but parking restrictions within the peak hours limit these occurrences.
4.16 There are a few instances within the boundaries of the model, usually within the inner city area where there are turn bans during a particular time period. For instance, a left turn may be permitted at all hours in the day except for during the peak hours. These restrictions were observed from the site visit and subsequently coded within the models.
4.17 Priority rules (or yield markers) and conflict areas are coded wherever turning traffic yields to oncoming traffic. These vehicles must look for a minimum gap time of 4 seconds. If this parameter is not met, then the vehicle remains behind the effective ‘stop line’. These markers typically occur in the following instances:
Traffic originating from a minor arm at a priority intersection - Right turners yield to one stream of traffic and left turners to two streams of traffic (except in the case of a one-way road);
At signalised intersections, right turn on red is generally permitted unless signed otherwise; Left turning traffic from a major road into a minor; To keep intersections clear when blocking back of traffic occurs; and Right turning traffic yielding to pedestrians crossing the road.
4.18 Stop signs are coded wherever observed within the model area. All vehicles are assumed to come to a complete stop and check for oncoming traffic before making a turning manoeuvre. Stop lines occur on minor arms.
4.19 Parking lots represent the zone connectors or “feeding points” where traffic is loaded onto and removed from the network. There are instances where more than one parking lot is attributed to the same zone. In these cases, the traffic flow will be distributed evenly over all parking lots. More detail on demand, and assignment of traffic, is provided in the next chapter.
Transit Data
4.20 All the existing bus services are coded into the VISSIM model as fixed routes. Table 4.1 gives a list of each route and the number of services per hour in both the AM and PM time periods. Each transit route takes a timetabled start time and then applies the frequency as specified in Table 4.1.
4.21 Transit stops are coded at all applicable points within the network. The exact location of these stops is taken from the background image. A particular bus service will only serve a certain stop if it is activated for that particular route and if it is a scheduled stop as defined by the timetable.
4.22 Each transit stop in the model has an associated dwell time distribution which states the length of time a bus will stop at a passenger pick up area. Each dwell time distribution takes two values, the first being the mean time (in seconds) with the next value as the standard deviation of the dwell time (in seconds). After the dwell time has passed, the bus continues on its fixed route journey in VISSIM. The dwell time distributions assumed and used within the VISSIM models take one of the following two types:
Dwell time Distribution 1 - (5.0, 1.0) – used at intermediate stops Dwell time Distribution 2 - (100.0, 20.0) – used at terminating/layover stops
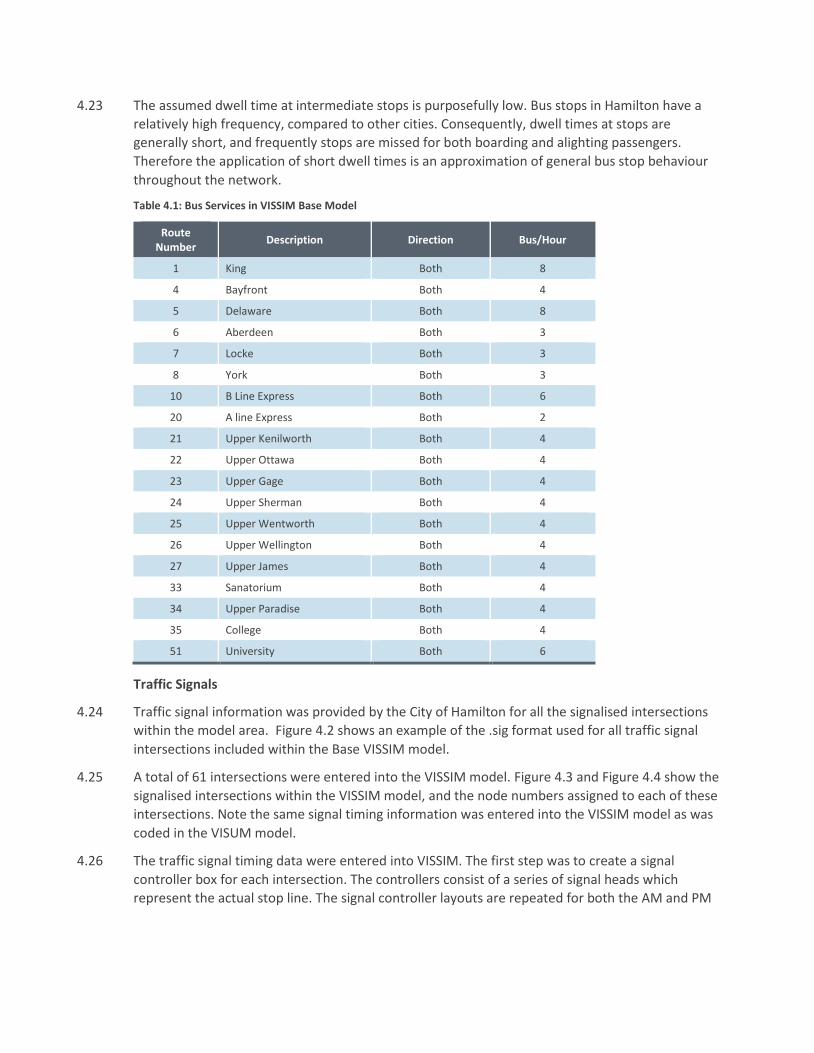
4.23 The assumed dwell time at intermediate stops is purposefully low. Bus stops in Hamilton have a relatively high frequency, compared to other cities. Consequently, dwell times at stops are generally short, and frequently stops are missed for both boarding and alighting passengers. Therefore the application of short dwell times is an approximation of general bus stop behaviour throughout the network.
Table 4.1: Bus Services in VISSIM Base Model
Route Number
Description Direction Bus/Hour
1 King Both 8
4 Bayfront Both 4
5 Delaware Both 8
6 Aberdeen Both 3
7 Locke Both 3
8 York Both 3
10 B Line Express Both 6
20 A line Express Both 2
21 Upper Kenilworth Both 4
22 Upper Ottawa Both 4
23 Upper Gage Both 4
24 Upper Sherman Both 4
25 Upper Wentworth Both 4
26 Upper Wellington Both 4
27 Upper James Both 4
33 Sanatorium Both 4
34 Upper Paradise Both 4
35 College Both 4
51 University Both 6
Traffic Signals
4.24 Traffic signal information was provided by the City of Hamilton for all the signalised intersections within the model area. Figure 4.2 shows an example of the .sig format used for all traffic signal intersections included within the Base VISSIM model.
4.25 A total of 61 intersections were entered into the VISSIM model. Figure 4.3 and Figure 4.4 show the signalised intersections within the VISSIM model, and the node numbers assigned to each of these intersections. Note the same signal timing information was entered into the VISSIM model as was coded in the VISUM model.
4.26 The traffic signal timing data were entered into VISSIM. The first step was to create a signal controller box for each intersection. The controllers consist of a series of signal heads which represent the actual stop line. The signal controller layouts are repeated for both the AM and PM
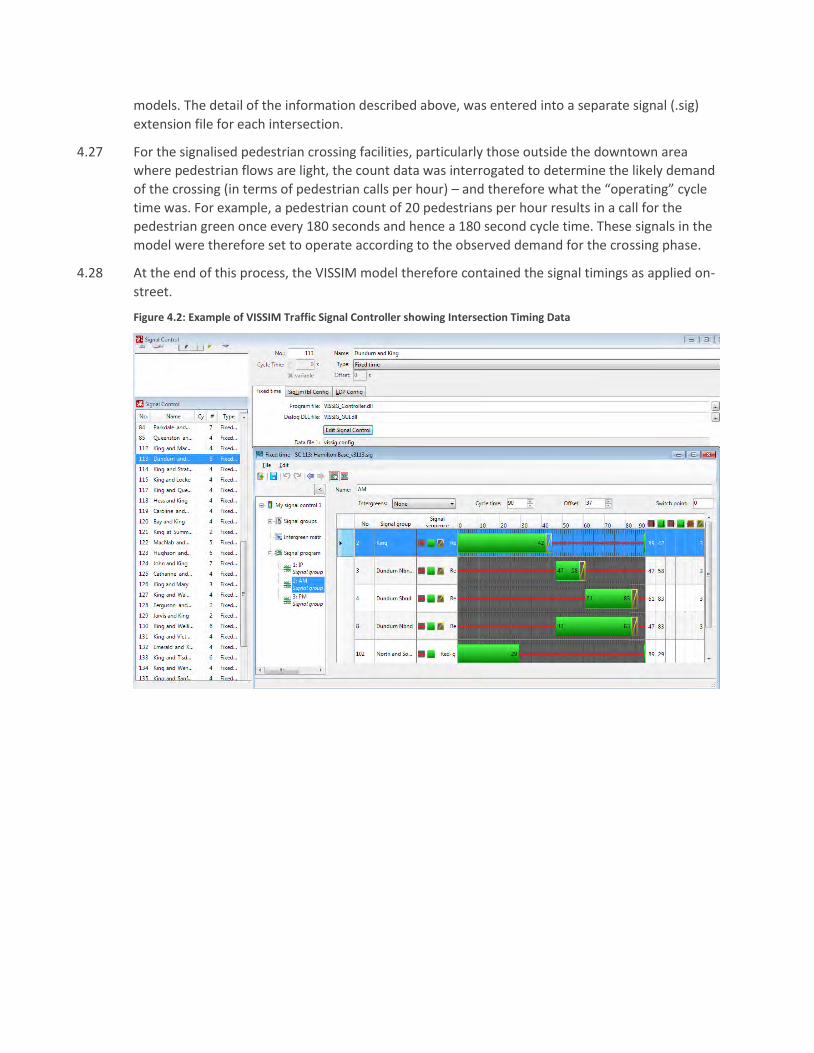
models. The detail of the information described above, was entered into a separate signal (.sig) extension file for each intersection.
4.27 For the signalised pedestrian crossing facilities, particularly those outside the downtown area where pedestrian flows are light, the count data was interrogated to determine the likely demand of the crossing (in terms of pedestrian calls per hour) – and therefore what the “operating” cycle time was. For example, a pedestrian count of 20 pedestrians per hour results in a call for the pedestrian green once every 180 seconds and hence a 180 second cycle time. These signals in the model were therefore set to operate according to the observed demand for the crossing phase.
4.28 At the end of this process, the VISSIM model therefore contained the signal timings as applied on-street.
Figure 4.2: Example of VISSIM Traffic Signal Controller showing Intersection Timing Data
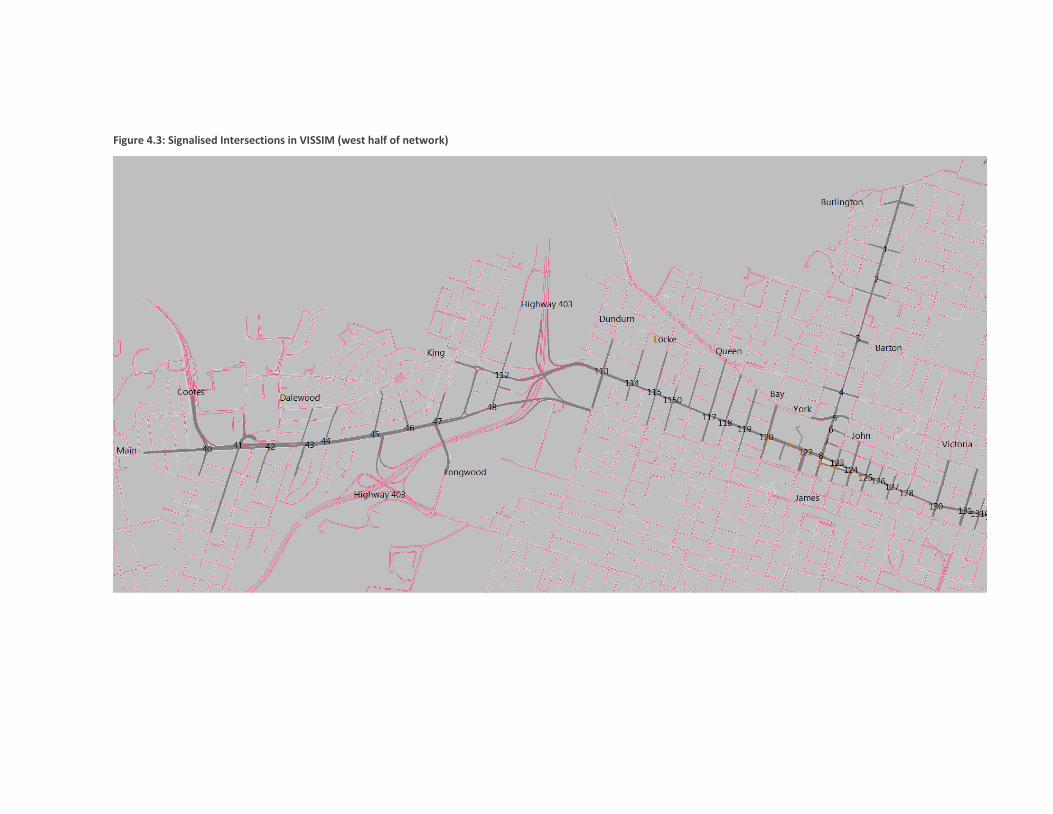
Figure 4.3: Signalised Intersections in VISSIM (west half of network)
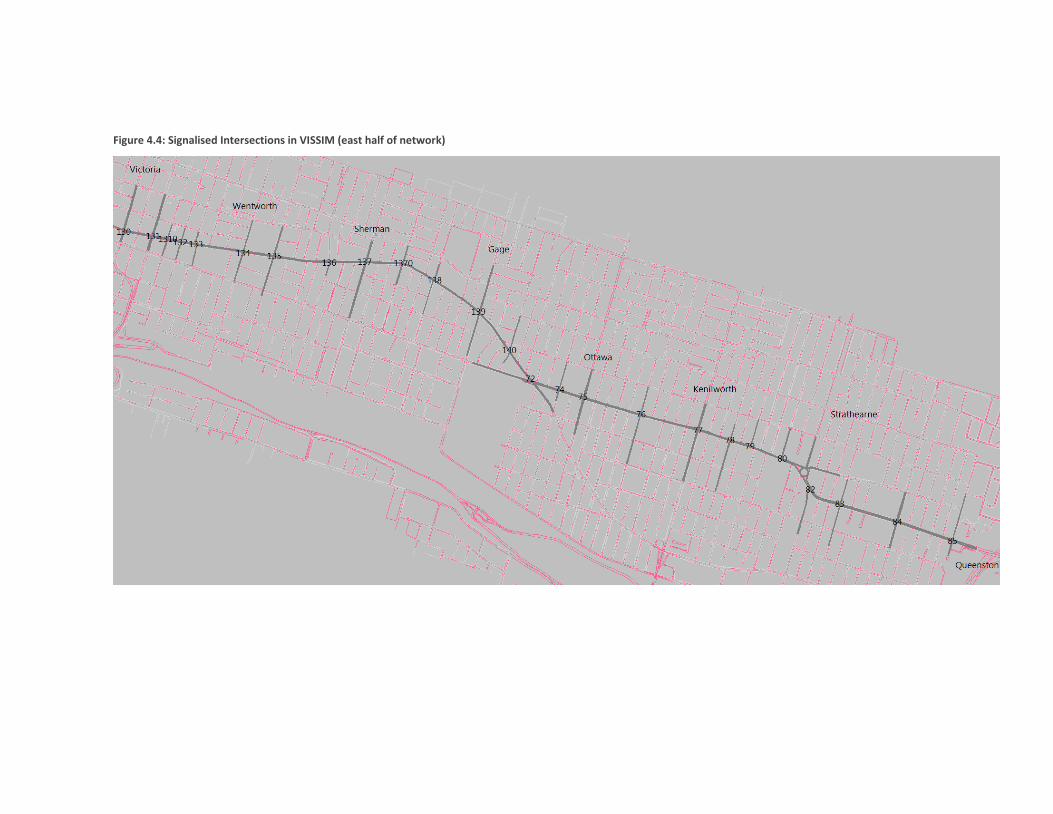
Figure 4.4: Signalised Intersections in VISSIM (east half of network)
VISSIM Base Model Demand
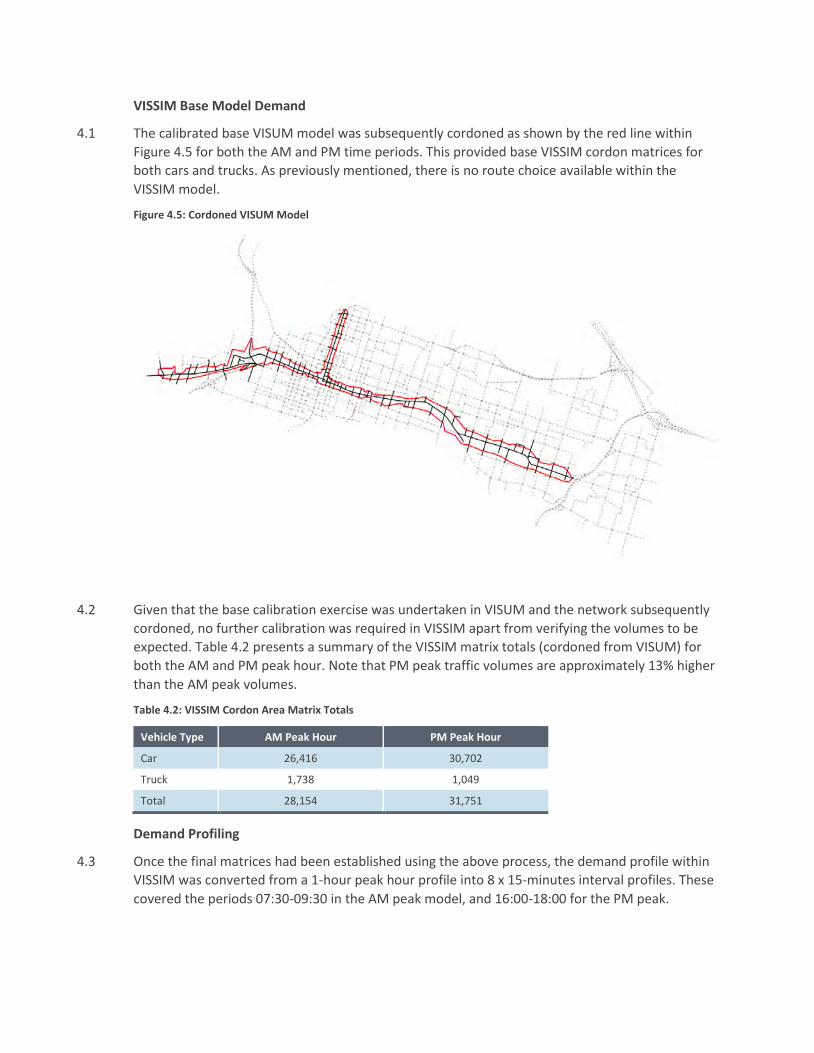
4.1 The calibrated base VISUM model was subsequently cordoned as shown by the red line within Figure 4.5 for both the AM and PM time periods. This provided base VISSIM cordon matrices for both cars and trucks. As previously mentioned, there is no route choice available within the VISSIM model.
Figure 4.5: Cordoned VISUM Model
4.2 Given that the base calibration exercise was undertaken in VISUM and the network subsequently cordoned, no further calibration was required in VISSIM apart from verifying the volumes to be expected. Table 4.2 presents a summary of the VISSIM matrix totals (cordoned from VISUM) for both the AM and PM peak hour. Note that PM peak traffic volumes are approximately 13% higher than the AM peak volumes.
Table 4.2: VISSIM Cordon Area Matrix Totals
Vehicle Type AM Peak Hour PM Peak Hour
Car 26,416 30,702
Truck 1,738 1,049
Total 28,154 31,751
Demand Profiling
4.3 Once the final matrices had been established using the above process, the demand profile within VISSIM was converted from a 1-hour peak hour profile into 8 x 15-minutes interval profiles. These covered the periods 07:30-09:30 in the AM peak model, and 16:00-18:00 for the PM peak.

4.4 The profiling was carried out using factors derived directly from the traffic count data. Where count data was not available for certain external points and internal zones, a global average of the profile within the network was applied to these zone feeds. Table 4.3 shows the global profiles determined from the traffic counts. Note that periods 3-6 represent the peak hour; that is 8:00-09:00 for the AM peak hour and 16:30-17:30 for the PM peak hour. The shoulder hour (half an hour either side of the peak hour) contains around 84% of the AM peak hour volume and 97% of the PM peak hour volume.
Table 4.3: Global Profiles (in 15 minute intervals)
VISSIM Model Period AM Peak Cars AM Peak Trucks PM Peak Cars PM Peak Trucks
Period 1 17.1% 21.4% 24.3% 27.7%
Period 2 21.7% 19.8% 24.8% 36.9%
Period 3 20.9% 24.3% 25.4% 28.7%
Period 4 25.1% 26.8% 24.4% 18.4%
Period 5 27.5% 25.3% 24.7% 28.3%
Period 6 26.5% 23.6% 25.4% 24.6%
Period 7 24.2% 21.2% 24.2% 19.3%
Period 8 20.3% 24.5% 24.0% 26.5%
Period 3-6 Total (peak Hour) 100% 100% 100% 100%
4.5 The profiles in Table 4.3 show that the PM peak profile is flatter than the corresponding AM peak. This therefore accentuates the impact of the larger PM peak hour matrix, as the shoulders of the central hour are higher than the corresponding AM shoulders. Thus, the difference between the AM and PM peak 2-hour total traffic volumes will be proportionally greater than the comparison of the AM and PM peak hour matrices.
4.6 The application of profiling allows the VISSIM model to accurately represent the shoulders of both peak periods, as the network builds up to the busiest point, before traffic dissipates near the end of the two-hour model period.
VISSIM Base Model Calibration
4.7 As described in the previous chapters, the principal base model calibration was undertaken within the VISUM model. Following this exercise, cordon VISSIM matrices for both car and truck were subsequently created which result in an accurate representation of traffic levels within the Hamilton cordon area.
4.8 However, as part of this process, analysis was carried out to ensure that the final traffic assignment in VISSIM were accurate against the observed traffic count data.
4.9 The commonly used GEH statistic as shown below has been utilized to assess the accuracy of the models against the observed, in addition to more simplified percentage difference calculations.
M = Model flow, C = Observed flow
4.10 The GEH value is useful, as it illustrates a weighted level of accuracy, based on the overall value of the flow – in this way the GEH statistic provides a better indication of model fit, than just looking at percentage differences.
Link and Turning Count Validation
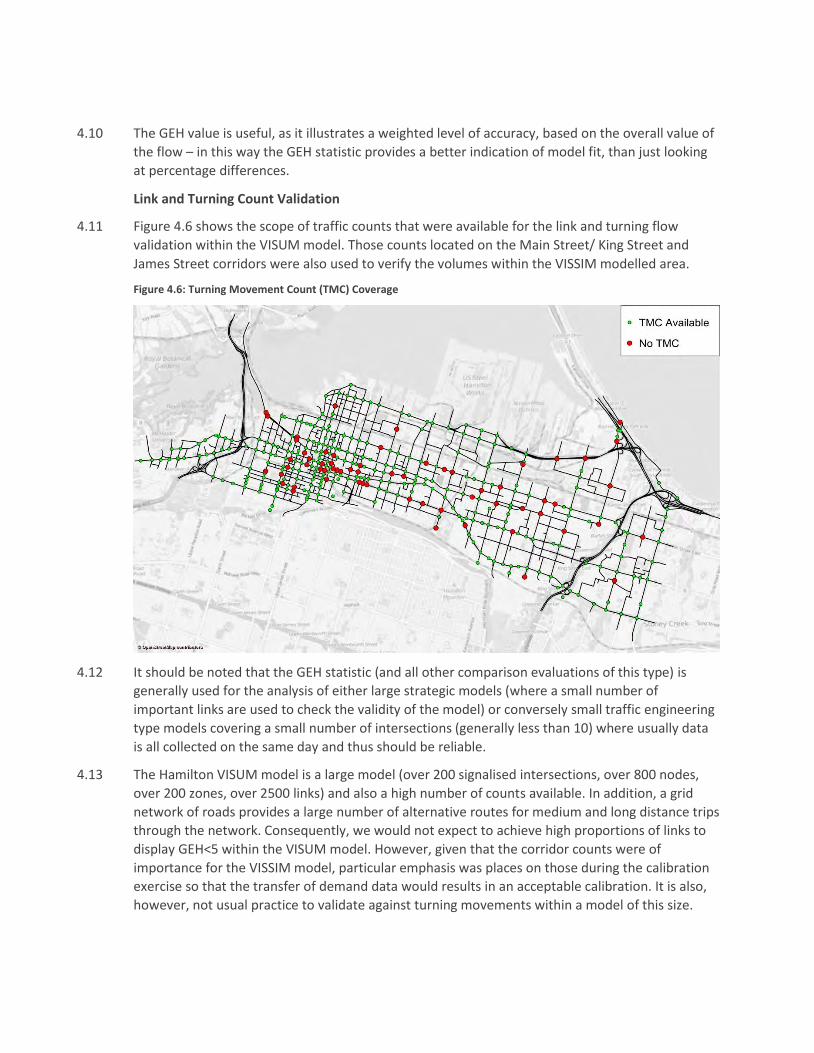
4.11 Figure 4.6 shows the scope of traffic counts that were available for the link and turning flow validation within the VISUM model. Those counts located on the Main Street/ King Street and James Street corridors were also used to verify the volumes within the VISSIM modelled area.
Figure 4.6: Turning Movement Count (TMC) Coverage
4.12 It should be noted that the GEH statistic (and all other comparison evaluations of this type) is generally used for the analysis of either large strategic models (where a small number of important links are used to check the validity of the model) or conversely small traffic engineering type models covering a small number of intersections (generally less than 10) where usually data is all collected on the same day and thus should be reliable.
4.13 The Hamilton VISUM model is a large model (over 200 signalised intersections, over 800 nodes, over 200 zones, over 2500 links) and also a high number of counts available. In addition, a grid network of roads provides a large number of alternative routes for medium and long distance trips through the network. Consequently, we would not expect to achieve high proportions of links to display GEH<5 within the VISUM model. However, given that the corridor counts were of importance for the VISSIM model, particular emphasis was places on those during the calibration exercise so that the transfer of demand data would results in an acceptable calibration. It is also, however, not usual practice to validate against turning movements within a model of this size.
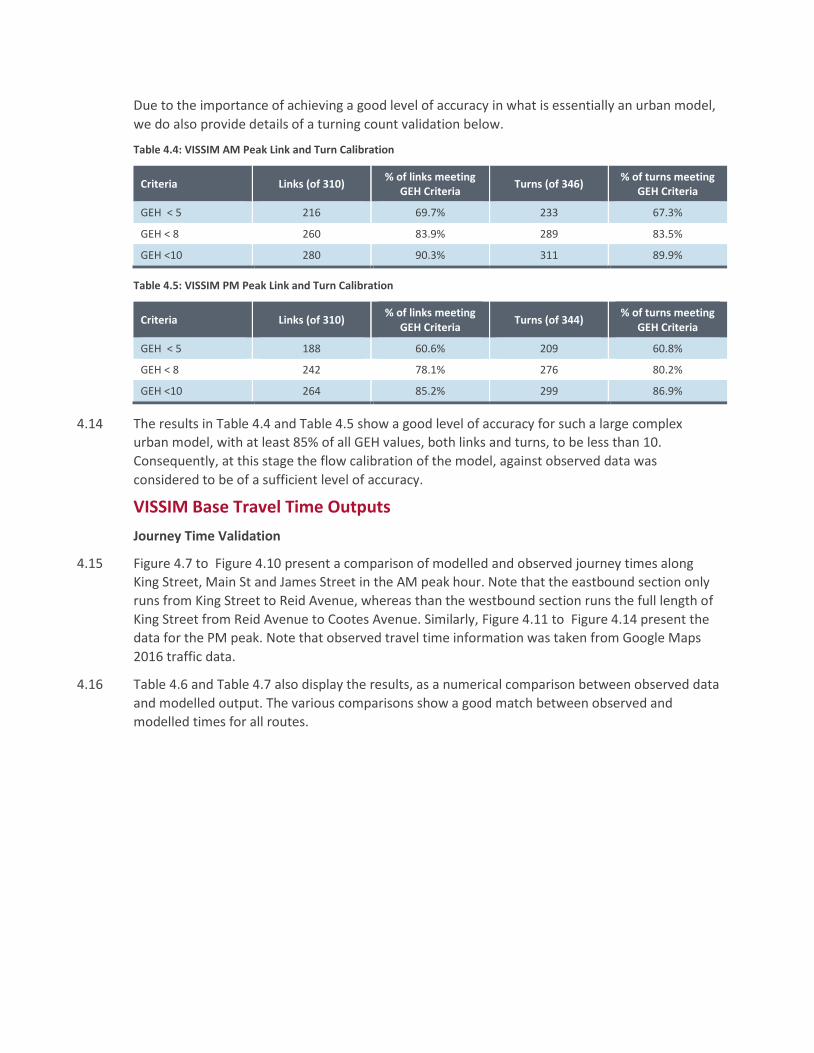
Due to the importance of achieving a good level of accuracy in what is essentially an urban model, we do also provide details of a turning count validation below.
Table 4.4: VISSIM AM Peak Link and Turn Calibration
Criteria Links (of 310) % of links meeting
GEH Criteria Turns (of 346)
% of turns meeting GEH Criteria
GEH < 5 216 69.7% 233 67.3%
GEH < 8 260 83.9% 289 83.5%
GEH <10 280 90.3% 311 89.9%
Table 4.5: VISSIM PM Peak Link and Turn Calibration
Criteria Links (of 310) % of links meeting
GEH Criteria Turns (of 344)
% of turns meeting GEH Criteria
GEH < 5 188 60.6% 209 60.8%
GEH < 8 242 78.1% 276 80.2%
GEH <10 264 85.2% 299 86.9%
4.14 The results in Table 4.4 and Table 4.5 show a good level of accuracy for such a large complex urban model, with at least 85% of all GEH values, both links and turns, to be less than 10. Consequently, at this stage the flow calibration of the model, against observed data was considered to be of a sufficient level of accuracy.
VISSIM Base Travel Time Outputs
Journey Time Validation
4.15 Figure 4.7 to Figure 4.10 present a comparison of modelled and observed journey times along King Street, Main St and James Street in the AM peak hour. Note that the eastbound section only runs from King Street to Reid Avenue, whereas than the westbound section runs the full length of King Street from Reid Avenue to Cootes Avenue. Similarly, Figure 4.11 to Figure 4.14 present the data for the PM peak. Note that observed travel time information was taken from Google Maps 2016 traffic data.
4.16 Table 4.6 and Table 4.7 also display the results, as a numerical comparison between observed data and modelled output. The various comparisons show a good match between observed and modelled times for all routes.
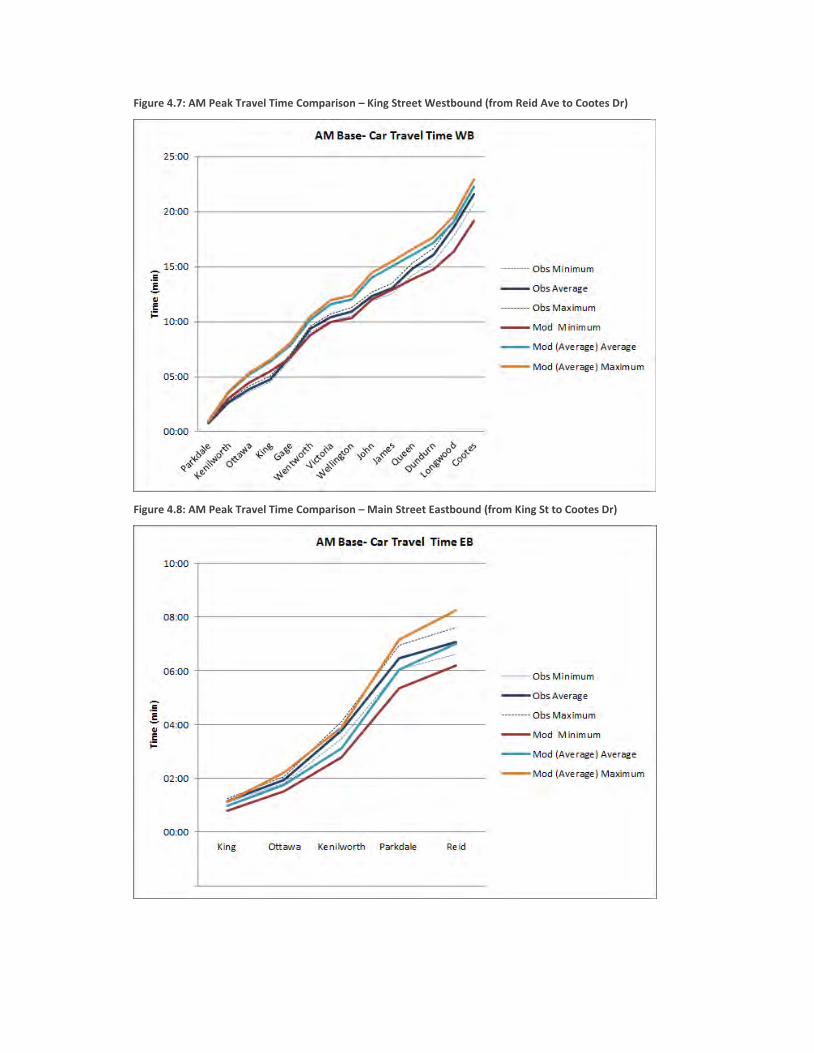
Figure 4.7: AM Peak Travel Time Comparison – King Street Westbound (from Reid Ave to Cootes Dr)
Figure 4.8: AM Peak Travel Time Comparison – Main Street Eastbound (from King St to Cootes Dr)
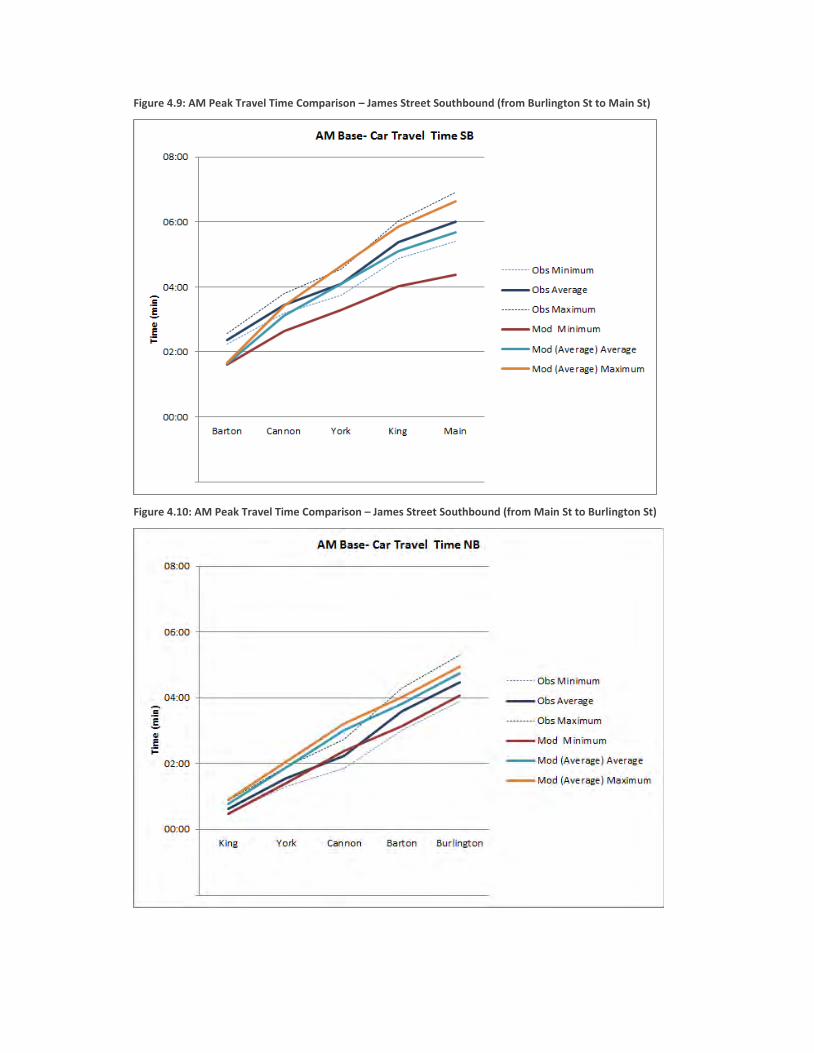
Figure 4.9: AM Peak Travel Time Comparison – James Street Southbound (from Burlington St to Main St)
Figure 4.10: AM Peak Travel Time Comparison – James Street Southbound (from Main St to Burlington St)
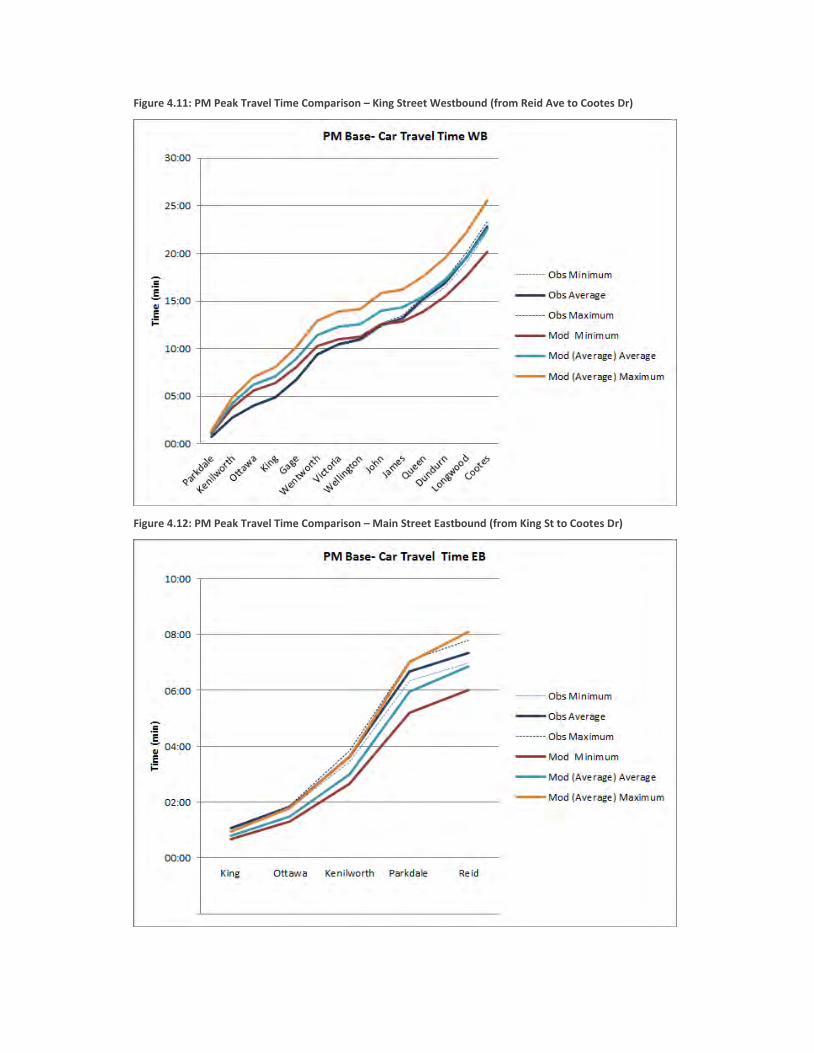
Figure 4.11: PM Peak Travel Time Comparison – King Street Westbound (from Reid Ave to Cootes Dr)
Figure 4.12: PM Peak Travel Time Comparison – Main Street Eastbound (from King St to Cootes Dr)
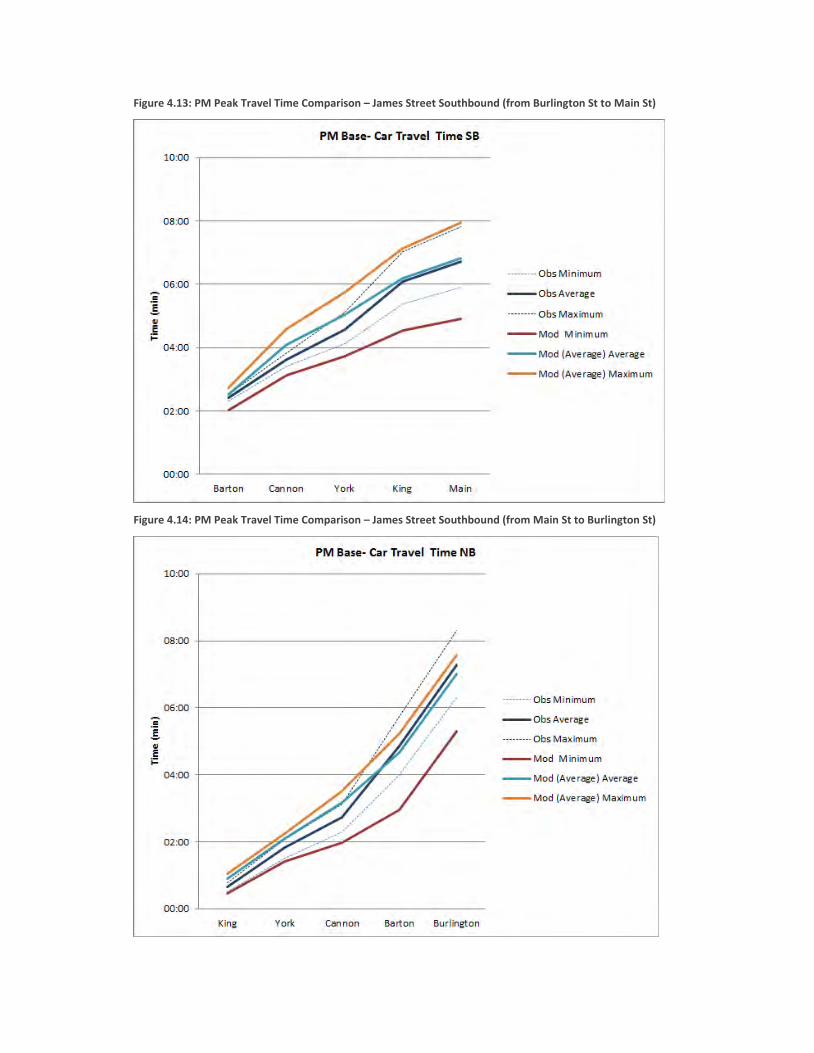
Figure 4.13: PM Peak Travel Time Comparison – James Street Southbound (from Burlington St to Main St)
Figure 4.14: PM Peak Travel Time Comparison – James Street Southbound (from Main St to Burlington St)
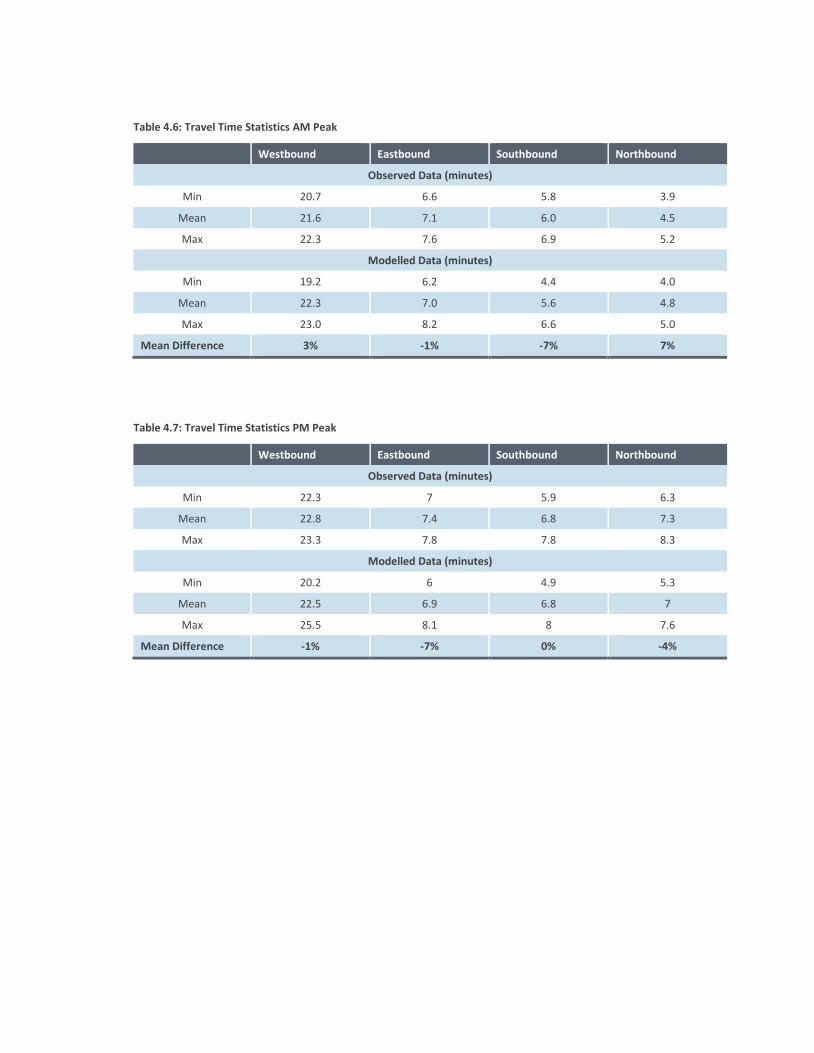
Table 4.6: Travel Time Statistics AM Peak
Westbound Eastbound Southbound Northbound
Observed Data (minutes)
Min 20.7 6.6 5.8 3.9
Mean 21.6 7.1 6.0 4.5
Max 22.3 7.6 6.9 5.2
Modelled Data (minutes)
Min 19.2 6.2 4.4 4.0
Mean 22.3 7.0 5.6 4.8
Max 23.0 8.2 6.6 5.0
Mean Difference 3% -1% -7% 7%
Table 4.7: Travel Time Statistics PM Peak
Westbound Eastbound Southbound Northbound
Observed Data (minutes)
Min 22.3 7 5.9 6.3
Mean 22.8 7.4 6.8 7.3
Max 23.3 7.8 7.8 8.3
Modelled Data (minutes)
Min 20.2 6 4.9 5.3
Mean 22.5 6.9 6.8 7
Max 25.5 8.1 8 7.6
Mean Difference -1% -7% 0% -4%
5 2031 BAU Model Coding Overview
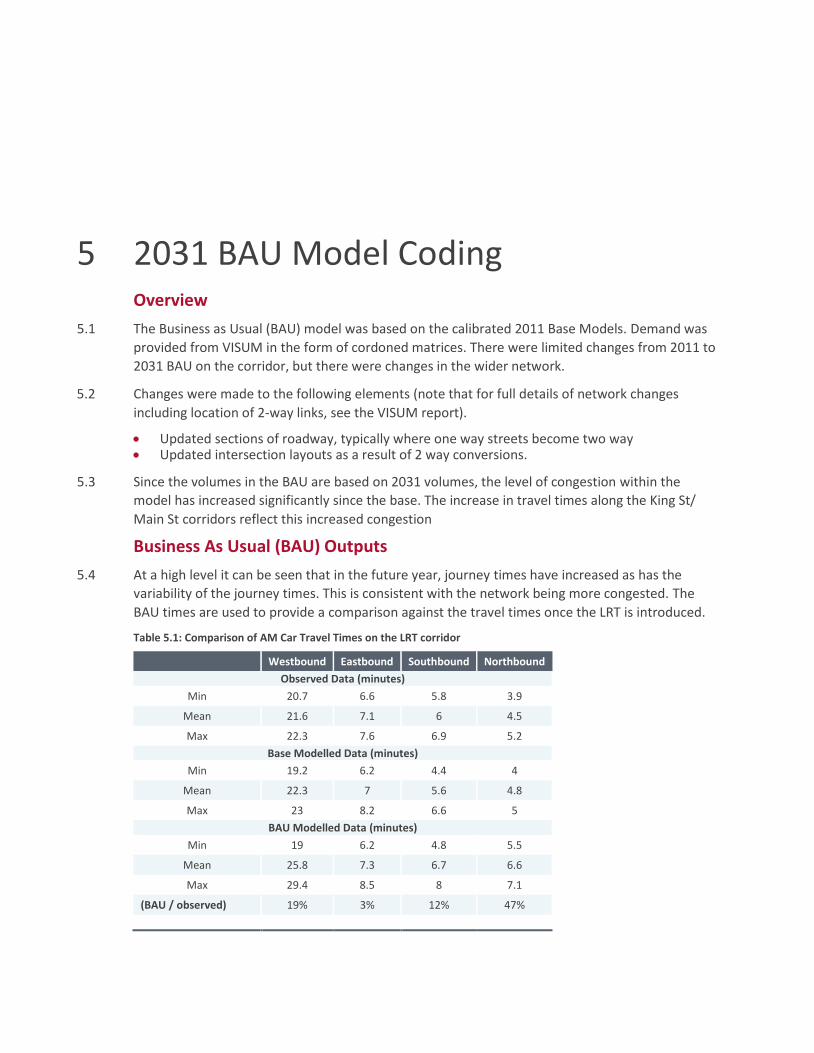
5.1 The Business as Usual (BAU) model was based on the calibrated 2011 Base Models. Demand was provided from VISUM in the form of cordoned matrices. There were limited changes from 2011 to 2031 BAU on the corridor, but there were changes in the wider network.
5.2 Changes were made to the following elements (note that for full details of network changes including location of 2-way links, see the VISUM report).
Updated sections of roadway, typically where one way streets become two way Updated intersection layouts as a result of 2 way conversions.
5.3 Since the volumes in the BAU are based on 2031 volumes, the level of congestion within the model has increased significantly since the base. The increase in travel times along the King St/ Main St corridors reflect this increased congestion
Business As Usual (BAU) Outputs
5.4 At a high level it can be seen that in the future year, journey times have increased as has the variability of the journey times. This is consistent with the network being more congested. The BAU times are used to provide a comparison against the travel times once the LRT is introduced.
Table 5.1: Comparison of AM Car Travel Times on the LRT corridor
Westbound Eastbound Southbound Northbound
Observed Data (minutes)
Min 20.7 6.6 5.8 3.9
Mean 21.6 7.1 6 4.5
Max 22.3 7.6 6.9 5.2 Base Modelled Data (minutes)
Min 19.2 6.2 4.4 4
Mean 22.3 7 5.6 4.8
Max 23 8.2 6.6 5 BAU Modelled Data (minutes)
Min 19 6.2 4.8 5.5
Mean 25.8 7.3 6.7 6.6
Max 29.4 8.5 8 7.1
(BAU / observed) 19% 3% 12% 47%
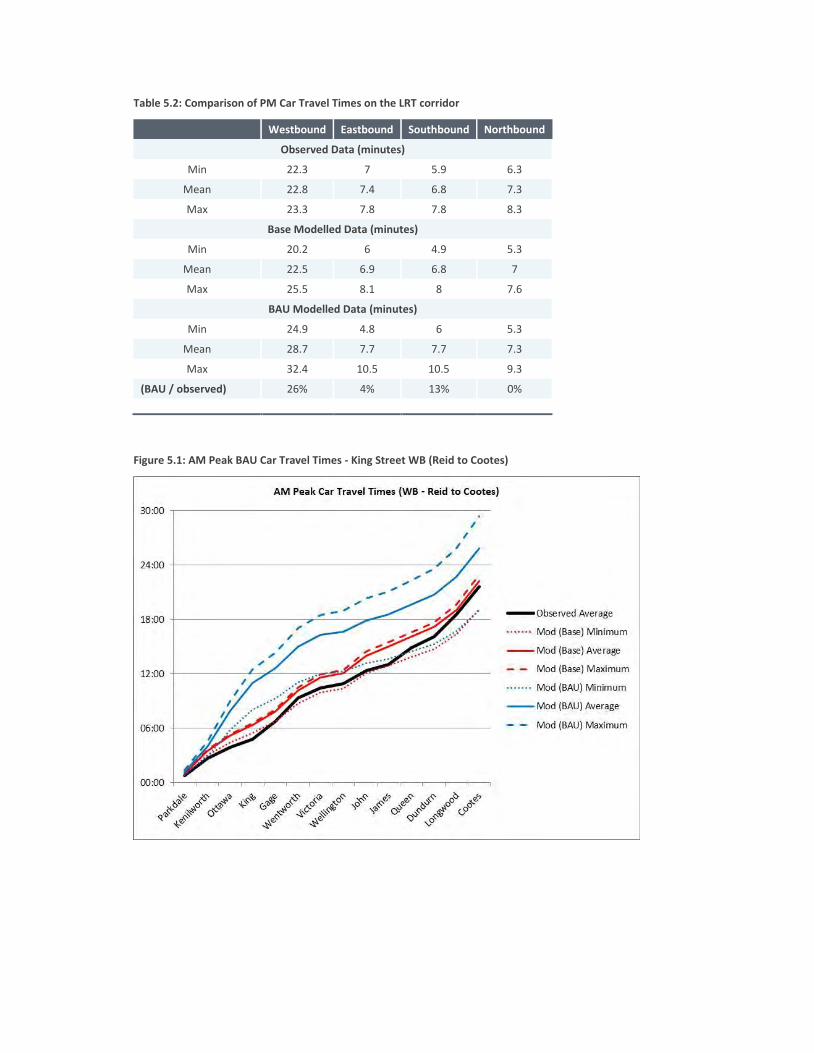
Table 5.2: Comparison of PM Car Travel Times on the LRT corridor
Westbound Eastbound Southbound Northbound
Observed Data (minutes)
Min 22.3 7 5.9 6.3
Mean 22.8 7.4 6.8 7.3
Max 23.3 7.8 7.8 8.3
Base Modelled Data (minutes)
Min 20.2 6 4.9 5.3
Mean 22.5 6.9 6.8 7
Max 25.5 8.1 8 7.6
BAU Modelled Data (minutes)
Min 24.9 4.8 6 5.3
Mean 28.7 7.7 7.7 7.3
Max 32.4 10.5 10.5 9.3
(BAU / observed) 26% 4% 13% 0%
Figure 5.1: AM Peak BAU Car Travel Times - King Street WB (Reid to Cootes)
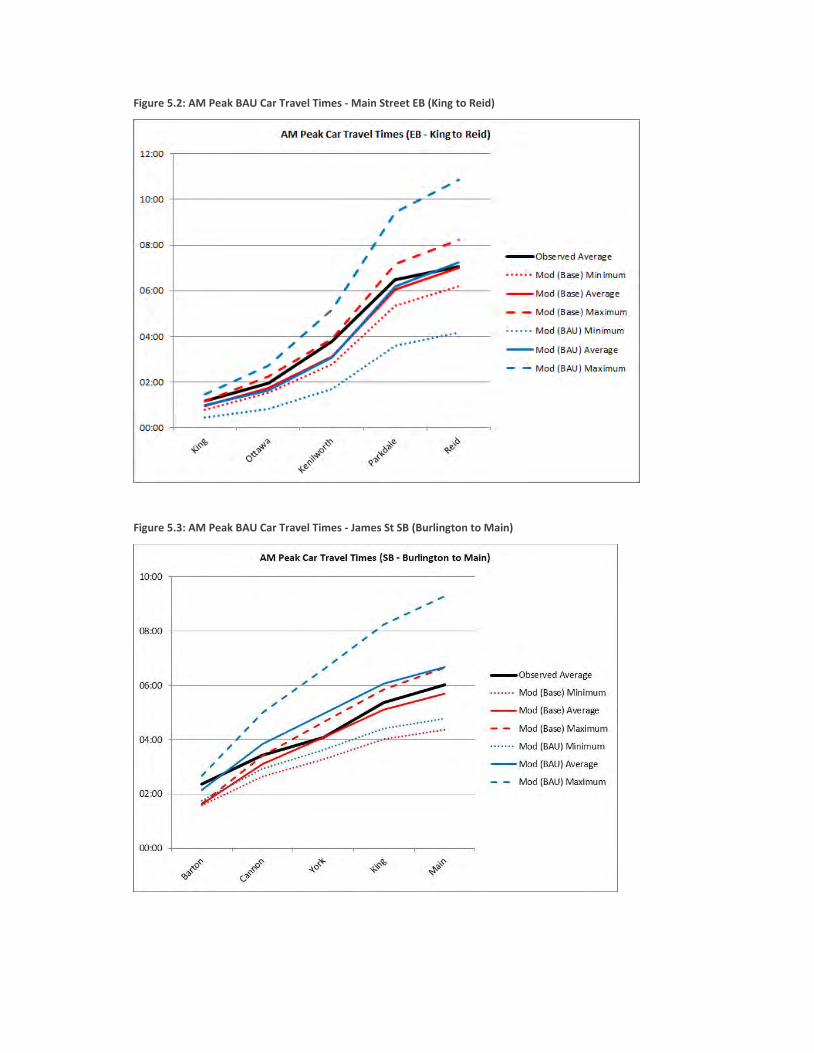
Figure 5.2: AM Peak BAU Car Travel Times - Main Street EB (King to Reid)
Figure 5.3: AM Peak BAU Car Travel Times - James St SB (Burlington to Main)
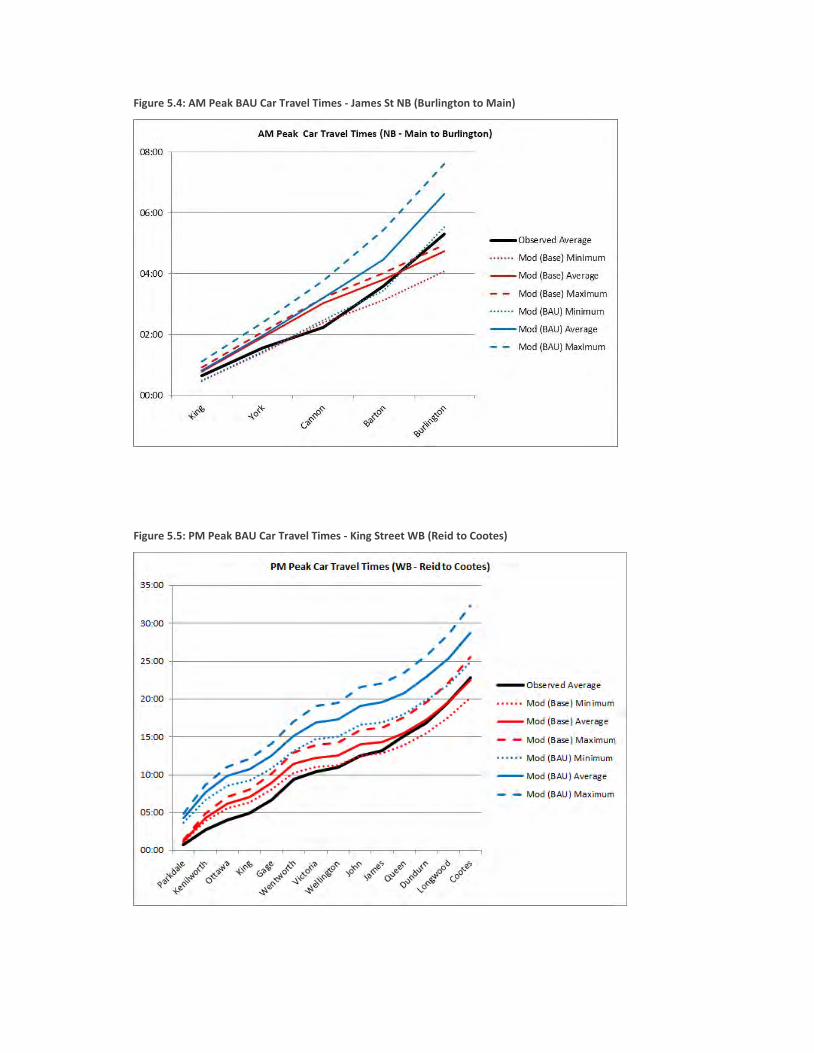
Figure 5.4: AM Peak BAU Car Travel Times - James St NB (Burlington to Main)
Figure 5.5: PM Peak BAU Car Travel Times - King Street WB (Reid to Cootes)
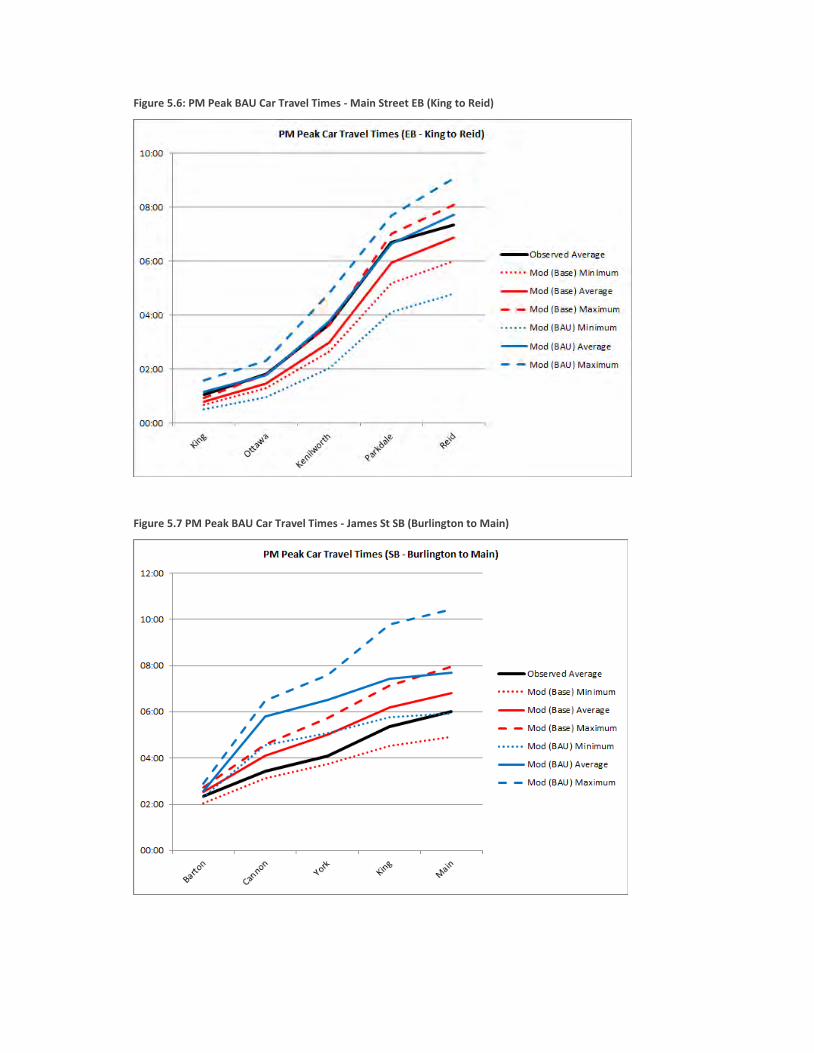
Figure 5.6: PM Peak BAU Car Travel Times - Main Street EB (King to Reid)
Figure 5.7 PM Peak BAU Car Travel Times - James St SB (Burlington to Main)
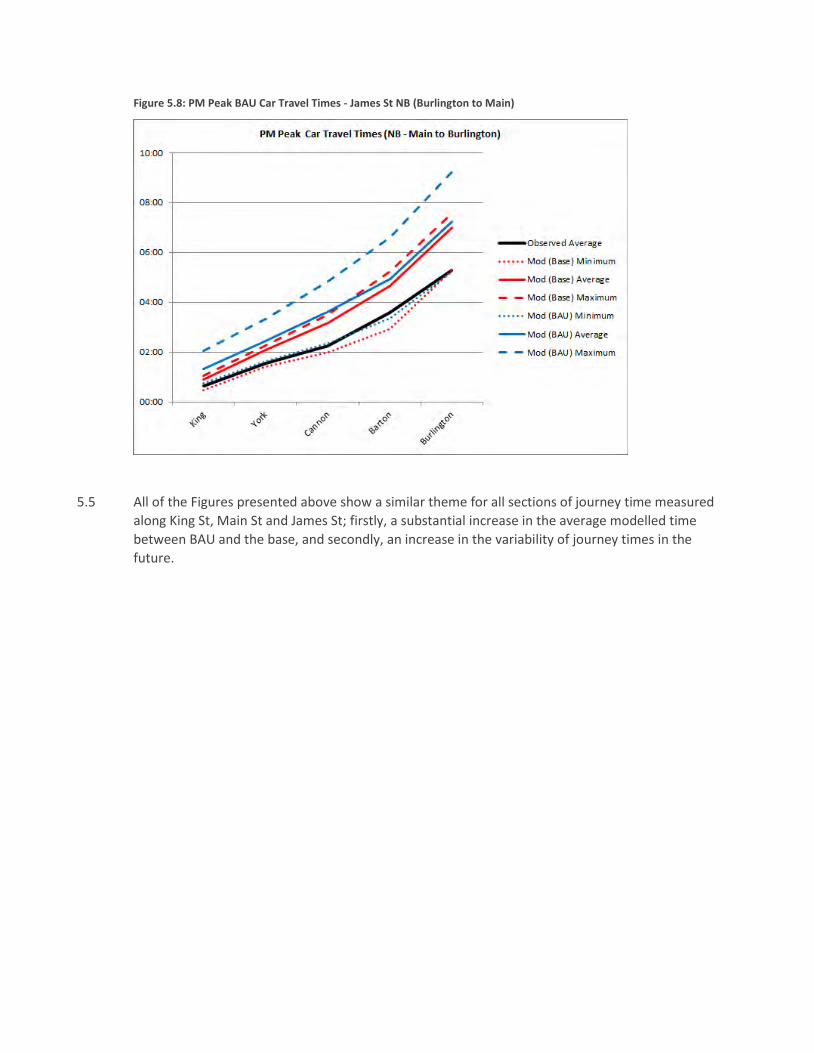
Figure 5.8: PM Peak BAU Car Travel Times - James St NB (Burlington to Main)
5.5 All of the Figures presented above show a similar theme for all sections of journey time measured along King St, Main St and James St; firstly, a substantial increase in the average modelled time between BAU and the base, and secondly, an increase in the variability of journey times in the future.
6 2031 LRT Model Coding Overview
6.1 The VISSIM LRT coding was made in accordance with the AECOM drawings which were provided in November 2016. The main principles of the scheme, in terms of LRT operation are as follows:
6.2 The LRT B-Line Alignment is along Main Street (Cootes to Macklin), King Street (Dundurn to Main/King intersection) and Main St (from Main/King intersection to Queenston.
6.3 The LRT A-Line James Street alignment runs from the James St South intersection to Burlington Street.
6.4 LRT is centre running along:
Main Street (from Dalewood to Paradise); King Street (from Dundurn to Queen); King Street (from Hess to James); King Street (from John to Catharine); King Street (from Wellington to Main); Main Street (from King to Queenston);
6.5 LRT is side running along:
Main Street (from Emerson to Dalewood); Main Street (from Paradise to Macklin); King Street (from Queen to Hess)- note traffic is westbound only in this section; King Street (from James to John) – note traffic is westbound only in this section; King Street (from Catherine to Wellington) – note traffic is eastbound only in this section
6.6 LRT is street-running and non-segregated on James Street from the Rebecca Street (south) intersection to Burlington Street. South of Rebecca Street, the LRT alignment is segregated to the MacNab Terminus Station (located to the west side of James Street, North of King Street).
6.7 Figures 6.1 and 6.2 show the representation of the VISSIM model with the LRT alignment. The numbers highlighted in blue on the diagram show the location of all the signalised intersections.
Signal Operation
Figure 6.1: Signalised Intersections in VISSIM LRT (west half of network)
Figure 6.2: Signalised Intersections in VISSIM LRT (west half of network)
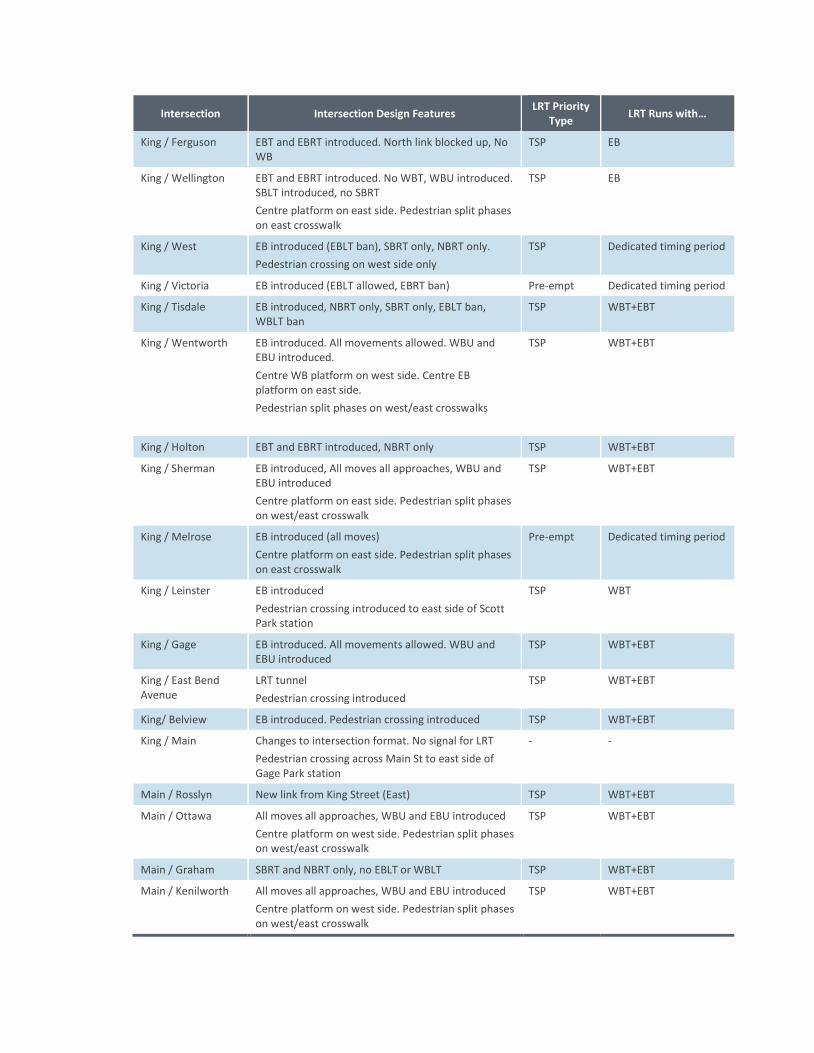
6.8 Tables 6.1 and 6.2 include a summary of the signalised intersection assumptions along the Main/ King and James Street LRT corridors. For each intersection, the design features and the LRT signal priority type have been highlighted; either they operate as Transit Signal Priority (TSP) or as a signal pre-empt.
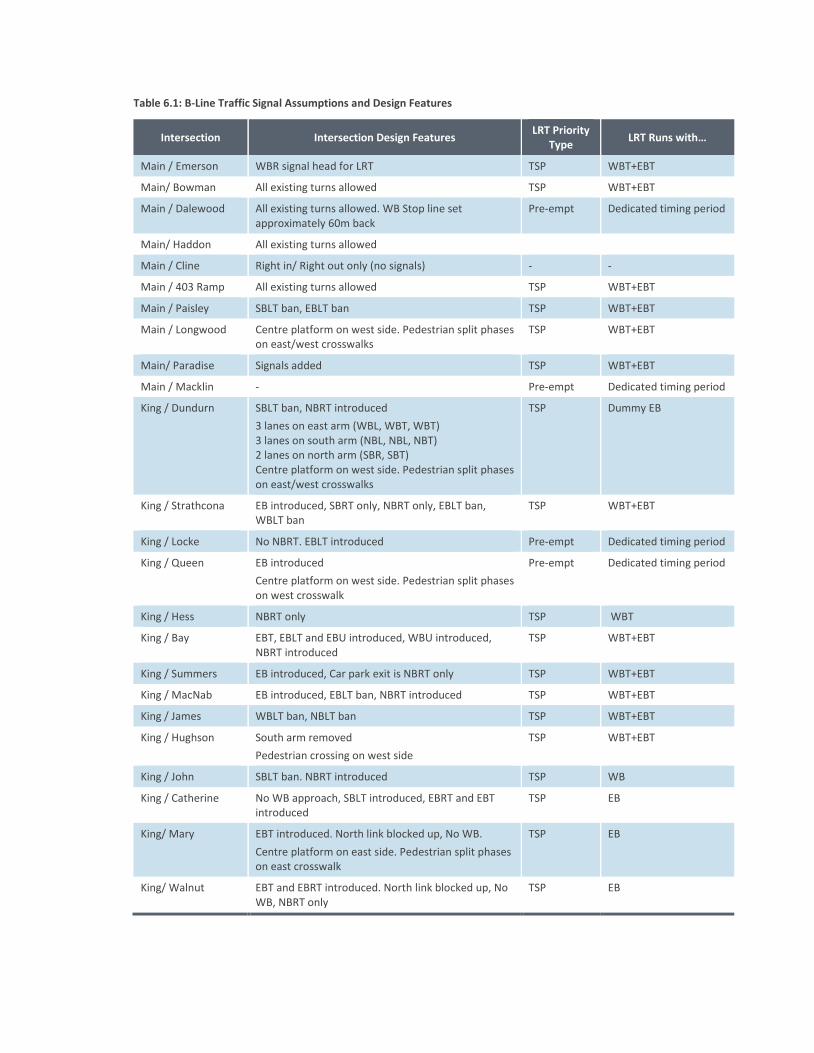
Table 6.1: B-Line Traffic Signal Assumptions and Design Features
Intersection Intersection Design Features LRT Priority
Type LRT Runs with…
Main / Emerson WBR signal head for LRT TSP WBT+EBT
Main/ Bowman All existing turns allowed TSP WBT+EBT
Main / Dalewood All existing turns allowed. WB Stop line set approximately 60m back
Pre-empt Dedicated timing period
Main/ Haddon All existing turns allowed
Main / Cline Right in/ Right out only (no signals) - -
Main / 403 Ramp All existing turns allowed TSP WBT+EBT
Main / Paisley SBLT ban, EBLT ban TSP WBT+EBT
Main / Longwood Centre platform on west side. Pedestrian split phases on east/west crosswalks
TSP WBT+EBT
Main/ Paradise Signals added TSP WBT+EBT
Main / Macklin - Pre-empt Dedicated timing period
King / Dundurn SBLT ban, NBRT introduced 3 lanes on east arm (WBL, WBT, WBT) 3 lanes on south arm (NBL, NBL, NBT) 2 lanes on north arm (SBR, SBT) Centre platform on west side. Pedestrian split phases
on east/west crosswalks
TSP Dummy EB
King / Strathcona EB introduced, SBRT only, NBRT only, EBLT ban, WBLT ban
TSP WBT+EBT
King / Locke No NBRT. EBLT introduced Pre-empt Dedicated timing period
King / Queen EB introduced Centre platform on west side. Pedestrian split phases on west crosswalk
Pre-empt Dedicated timing period
King / Hess NBRT only TSP WBT
King / Bay EBT, EBLT and EBU introduced, WBU introduced, NBRT introduced
TSP WBT+EBT
King / Summers EB introduced, Car park exit is NBRT only TSP WBT+EBT
King / MacNab EB introduced, EBLT ban, NBRT introduced TSP WBT+EBT
King / James WBLT ban, NBLT ban TSP WBT+EBT
King / Hughson South arm removed Pedestrian crossing on west side
TSP WBT+EBT
King / John SBLT ban. NBRT introduced TSP WB
King / Catherine No WB approach, SBLT introduced, EBRT and EBT introduced
TSP EB
King/ Mary EBT introduced. North link blocked up, No WB. Centre platform on east side. Pedestrian split phases on east crosswalk
TSP EB
King/ Walnut EBT and EBRT introduced. North link blocked up, No WB, NBRT only
TSP EB
Intersection Intersection Design Features LRT Priority
Type LRT Runs with…
King / Ferguson EBT and EBRT introduced. North link blocked up, No WB
TSP EB
King / Wellington EBT and EBRT introduced. No WBT, WBU introduced. SBLT introduced, no SBRT Centre platform on east side. Pedestrian split phases on east crosswalk
TSP EB
King / West EB introduced (EBLT ban), SBRT only, NBRT only. Pedestrian crossing on west side only
TSP Dedicated timing period
King / Victoria EB introduced (EBLT allowed, EBRT ban) Pre-empt Dedicated timing period
King / Tisdale EB introduced, NBRT only, SBRT only, EBLT ban, WBLT ban
TSP WBT+EBT
King / Wentworth EB introduced. All movements allowed. WBU and EBU introduced. Centre WB platform on west side. Centre EB platform on east side. Pedestrian split phases on west/east crosswalks
TSP WBT+EBT
King / Holton EBT and EBRT introduced, NBRT only TSP WBT+EBT
King / Sherman EB introduced, All moves all approaches, WBU and EBU introduced Centre platform on east side. Pedestrian split phases on west/east crosswalk
TSP WBT+EBT
King / Melrose EB introduced (all moves) Centre platform on east side. Pedestrian split phases on east crosswalk
Pre-empt Dedicated timing period
King / Leinster EB introduced Pedestrian crossing introduced to east side of Scott Park station
TSP WBT
King / Gage EB introduced. All movements allowed. WBU and EBU introduced
TSP WBT+EBT
King / East Bend Avenue
LRT tunnel Pedestrian crossing introduced
TSP WBT+EBT
King/ Belview EB introduced. Pedestrian crossing introduced TSP WBT+EBT
King / Main Changes to intersection format. No signal for LRT Pedestrian crossing across Main St to east side of Gage Park station
- -
Main / Rosslyn New link from King Street (East) TSP WBT+EBT
Main / Ottawa All moves all approaches, WBU and EBU introduced Centre platform on west side. Pedestrian split phases on west/east crosswalk
TSP WBT+EBT
Main / Graham SBRT and NBRT only, no EBLT or WBLT TSP WBT+EBT
Main / Kenilworth All moves all approaches, WBU and EBU introduced Centre platform on west side. Pedestrian split phases on west/east crosswalk
TSP WBT+EBT
Intersection Intersection Design Features LRT Priority
Type LRT Runs with…
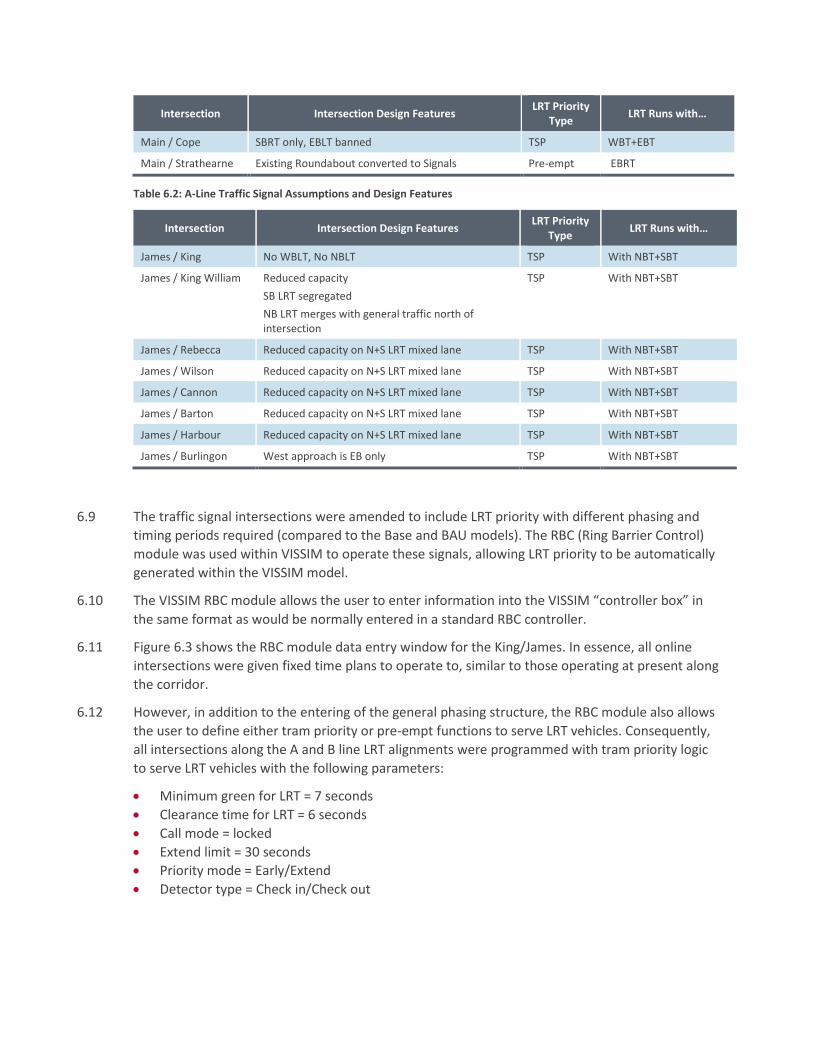
Main / Cope SBRT only, EBLT banned TSP WBT+EBT
Main / Strathearne Existing Roundabout converted to Signals Pre-empt EBRT
Table 6.2: A-Line Traffic Signal Assumptions and Design Features
Intersection Intersection Design Features LRT Priority
Type LRT Runs with…
James / King No WBLT, No NBLT TSP With NBT+SBT
James / King William Reduced capacity SB LRT segregated NB LRT merges with general traffic north of intersection
TSP With NBT+SBT
James / Rebecca Reduced capacity on N+S LRT mixed lane TSP With NBT+SBT
James / Wilson Reduced capacity on N+S LRT mixed lane TSP With NBT+SBT
James / Cannon Reduced capacity on N+S LRT mixed lane TSP With NBT+SBT
James / Barton Reduced capacity on N+S LRT mixed lane TSP With NBT+SBT
James / Harbour Reduced capacity on N+S LRT mixed lane TSP With NBT+SBT
James / Burlingon West approach is EB only TSP With NBT+SBT
6.9 The traffic signal intersections were amended to include LRT priority with different phasing and timing periods required (compared to the Base and BAU models). The RBC (Ring Barrier Control) module was used within VISSIM to operate these signals, allowing LRT priority to be automatically generated within the VISSIM model.
6.10 The VISSIM RBC module allows the user to enter information into the VISSIM “controller box” in the same format as would be normally entered in a standard RBC controller.
6.11 Figure 6.3 shows the RBC module data entry window for the King/James. In essence, all online intersections were given fixed time plans to operate to, similar to those operating at present along the corridor.
6.12 However, in addition to the entering of the general phasing structure, the RBC module also allows the user to define either tram priority or pre-empt functions to serve LRT vehicles. Consequently, all intersections along the A and B line LRT alignments were programmed with tram priority logic to serve LRT vehicles with the following parameters:
Minimum green for LRT = 7 seconds Clearance time for LRT = 6 seconds Call mode = locked Extend limit = 30 seconds Priority mode = Early/Extend Detector type = Check in/Check out
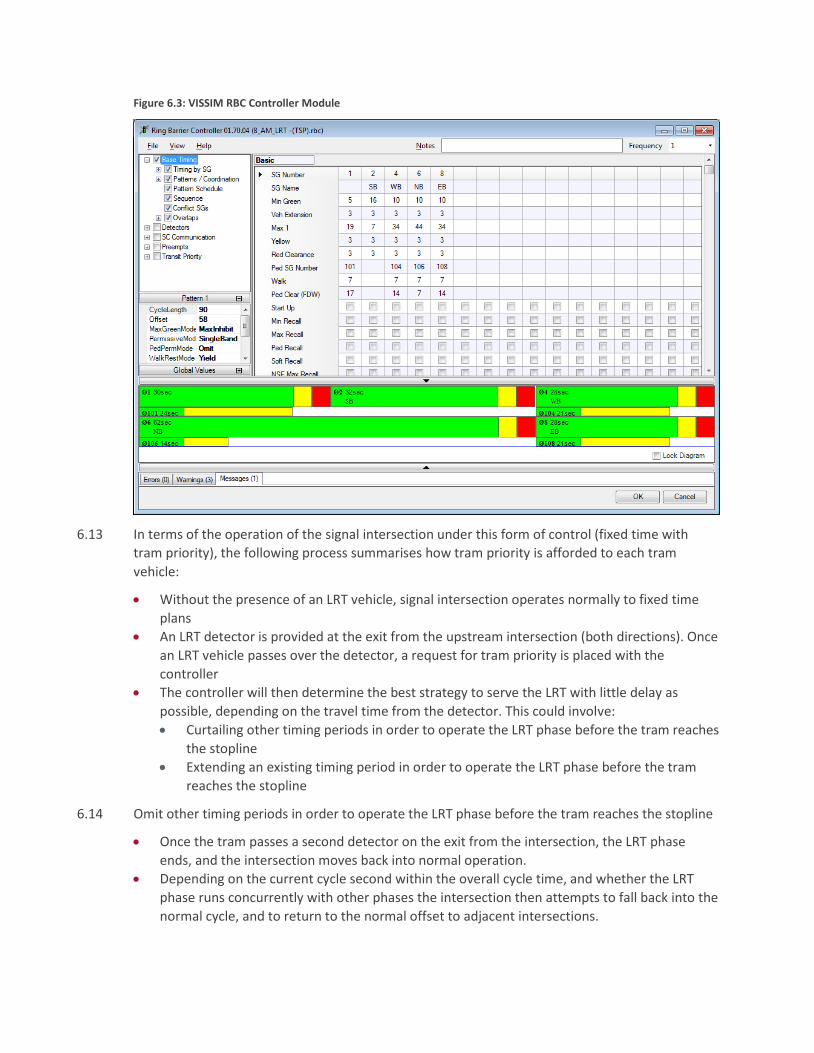
Figure 6.3: VISSIM RBC Controller Module
6.13 In terms of the operation of the signal intersection under this form of control (fixed time with tram priority), the following process summarises how tram priority is afforded to each tram vehicle:
Without the presence of an LRT vehicle, signal intersection operates normally to fixed time plans
An LRT detector is provided at the exit from the upstream intersection (both directions). Once an LRT vehicle passes over the detector, a request for tram priority is placed with the controller
The controller will then determine the best strategy to serve the LRT with little delay as possible, depending on the travel time from the detector. This could involve: Curtailing other timing periods in order to operate the LRT phase before the tram reaches
the stopline Extending an existing timing period in order to operate the LRT phase before the tram
reaches the stopline
6.14 Omit other timing periods in order to operate the LRT phase before the tram reaches the stopline
Once the tram passes a second detector on the exit from the intersection, the LRT phase ends, and the intersection moves back into normal operation.
Depending on the current cycle second within the overall cycle time, and whether the LRT phase runs concurrently with other phases the intersection then attempts to fall back into the normal cycle, and to return to the normal offset to adjacent intersections.
6.15 In terms of the Hamilton model, a number of other considerations were applied to the model:
No phases are omitted from any signal intersections, including the protected period of pm+pt left turn phases. On the LRT route, there are few locations where pm+pt phases are in operation, except on the north-south movements.
Minimum green time periods are always run for all phases, including the pedestrian green and clearance times for all phases.
6.16 This level of LRT priority is considered “moderate”, and is used commonly on other systems throughout the world. It results in a general network operation that offers LRT priority whilst maintaining other general traffic operation, and retaining the timing period structure at all intersections.
6.17 Note, that we have used the traffic signal pre-empt facility at a few locations. These were generally coded where there are shared lanes (typically through and left) and therefore LRT cannot run with eastbound/westbound traffic. The pre-empt function gives advance notice to the signal controller of the LRT’s arrival and closes down all conflicting traffic phases. This typically results in a higher level of tram priority than by using the TSP function
6.18 Once the RBC controllers had been set up for all the intersections, the “normal” (i.e. no LRT present) timings were fixed within the VISSIM model. This process was undertaken manually, but generally the timings were set to be similar to the Base and BAU timings for each intersection.
6.19 Clearly, at some intersections, both the physical form and the required phase structure were significantly different from the existing operation. However, in these cases, it was often found that due to pedestrian requirements, the timing periods required for each phase were reasonably fixed. It is also important to note that along the LRT corridor:
The existing cycle time of 90 seconds was retained at almost all locations Pedestrian clearance periods were re-measured at all locations on a 1.0m/s basis, to ensure
that all minimum green time and clearance periods were appropriate.
Other Assumptions
6.20 In terms of the LRT operation, the model includes a LRT vehicle with the following features:
Vehicle length = 35m Maximum acceleration = +1m/s2 (varies by speed) Maximum deceleration = -1m/s2 LRT stop dwell = 20 seconds +/- 1 seconds Frequency = 6 minute headway, both directions, both modelled period Light Rail speed = 50kmph/60kmph on majority of network (equal to equivalent general traffic
speed limit). Section of King Street between James Street and West Street restricted to 20kmph
7 LRT Corridor Operation Overview
7.1 The key output from the corridor VISSIM models is average travel times for auto and LRT. As VISSIM is a micro-simulation model, the outputs for each run are slightly different. Multiple runs were undertaken using random ‘seed’ values and the output times from these runs are average to be included within the reporting.
7.2 The information gleaned from the models provides insight around the likely reliability of the LRT runtimes and how likely the LRT is to be delayed by signals during regular operation.
7.3 Overall auto travel times along the corridor are not significantly impacted as the major traffic movements run with LRT. Movements turning onto and off the corridor are restricted, but the traffic diversion is captured as part of the wider area reporting.
The LRT travel time from McMaster to Queenston was developed independently of VISSIM using a spreadsheet based runtime model. The Runtime model was 20:20 excluding dwells and 24:05 including dwells. This compares with the travel times (including dwells) being output from VISSIM, which range from 24:45 to 27:09 in the AM Peak hour with an average time of 25:44. In the PM peak hour LRT travel times range from 24:10 to 27:00 with an average time of 25:47. In both the AM and PM peak VISSIM models, LRT run times are on average 7% longer than the runtime.
Corridor Operation
7.4 An initial signals strategy had been developed for implementation in VISUM. Due to the implementation of the LRT design, there were a few locations where the minimum green required for each of the movements was approaching the assumed cycle times. This limited the flexibility within the models for the LRT stage timings to be extended and in turn reduced the flexibility to provide the LRT with full priority. A key contributor to this was the minimum green times required for the pedestrian crossings.
7.5 Two options were considered – increasing the cycle times along the corridor (and ultimately within the wider network), or considering the use of staggered pedestrian crossings. It was decided to implement the latter option and this resulted in intersection layout changes being required at the following locations.
Main and Emerson;
Main and Longwood; Main and Ottawa; Main and Kenilworth; King and Dundurn; King and Queen; King and Wellington; King and Wentworth; King and Sherman; and King and Melrose.
7.6 In all the cases listed above, there is an LRT platform that can form this island and in the case of Emerson this crossing is currently staggered on-street so it is actually more in keeping with the existing situation to have the staggered layout.
7.7 These changes provide greater flexibility within the existing cycle times to accommodate LRT since it increases the ‘float time’ available for LRT. The additional float time allows the TSP controller more flexibility to extend the green time slightly to avoid the LRT being delayed by signals. However, the introduction of pedestrian split phases means potentially longer walk times across Main St and King St as it cannot be guaranteed that a pedestrian would cross in one signal cycle.
Auto Travel Times in the LRT Corridor
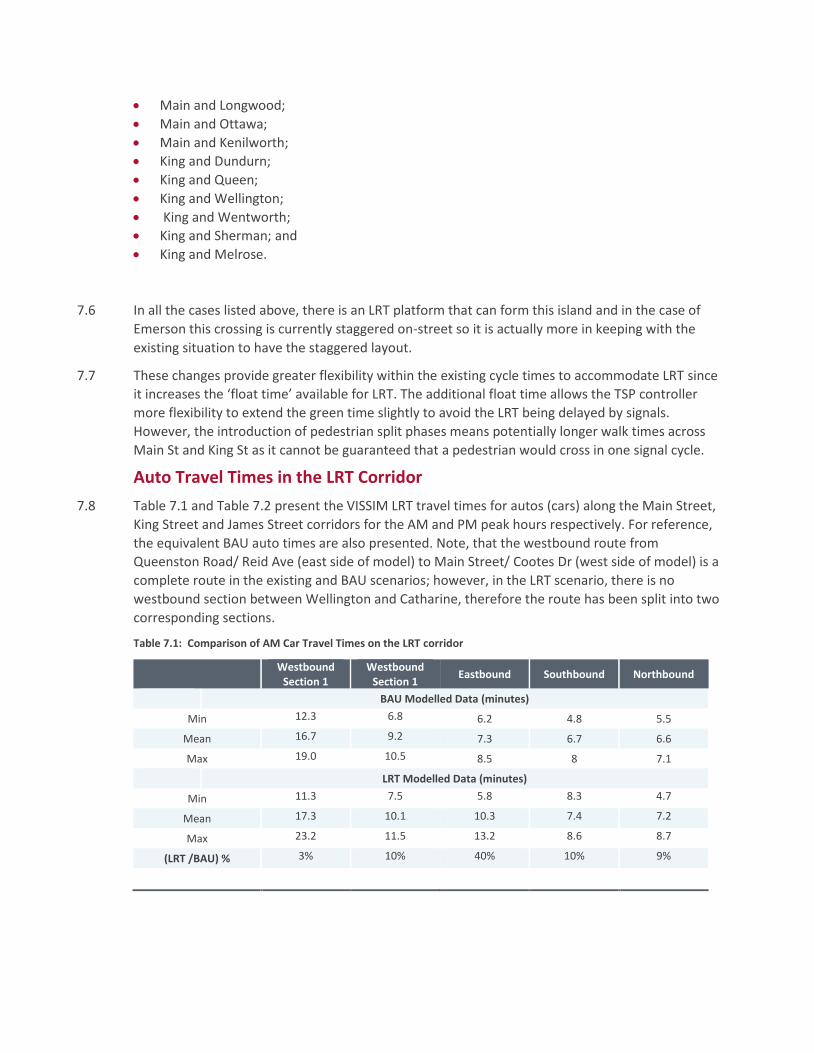
7.8 Table 7.1 and Table 7.2 present the VISSIM LRT travel times for autos (cars) along the Main Street, King Street and James Street corridors for the AM and PM peak hours respectively. For reference, the equivalent BAU auto times are also presented. Note, that the westbound route from Queenston Road/ Reid Ave (east side of model) to Main Street/ Cootes Dr (west side of model) is a complete route in the existing and BAU scenarios; however, in the LRT scenario, there is no westbound section between Wellington and Catharine, therefore the route has been split into two corresponding sections.
Table 7.1: Comparison of AM Car Travel Times on the LRT corridor
Westbound
Section 1 Westbound
Section 1 Eastbound Southbound Northbound
BAU Modelled Data (minutes)
Min 12.3 6.8 6.2 4.8 5.5
Mean 16.7 9.2 7.3 6.7 6.6
Max 19.0 10.5 8.5 8 7.1 LRT Modelled Data (minutes)
Min 11.3 7.5 5.8 8.3 4.7
Mean 17.3 10.1 10.3 7.4 7.2
Max 23.2 11.5 13.2 8.6 8.7
(LRT /BAU) % 3% 10% 40% 10% 9%
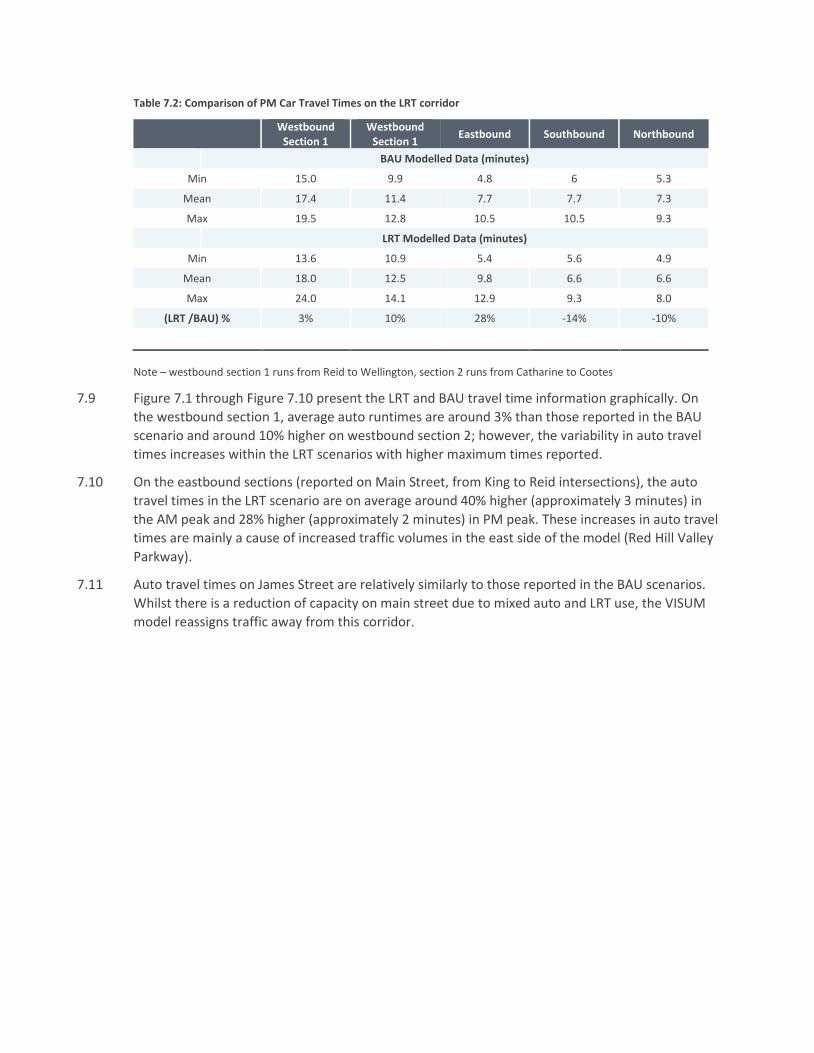
Table 7.2: Comparison of PM Car Travel Times on the LRT corridor
Westbound
Section 1 Westbound
Section 1 Eastbound Southbound Northbound
BAU Modelled Data (minutes)
Min 15.0 9.9 4.8 6 5.3
Mean 17.4 11.4 7.7 7.7 7.3
Max 19.5 12.8 10.5 10.5 9.3 LRT Modelled Data (minutes)
Min 13.6 10.9 5.4 5.6 4.9
Mean 18.0 12.5 9.8 6.6 6.6
Max 24.0 14.1 12.9 9.3 8.0
(LRT /BAU) % 3% 10% 28% -14% -10%
Note – westbound section 1 runs from Reid to Wellington, section 2 runs from Catharine to Cootes
7.9 Figure 7.1 through Figure 7.10 present the LRT and BAU travel time information graphically. On the westbound section 1, average auto runtimes are around 3% than those reported in the BAU scenario and around 10% higher on westbound section 2; however, the variability in auto travel times increases within the LRT scenarios with higher maximum times reported.
7.10 On the eastbound sections (reported on Main Street, from King to Reid intersections), the auto travel times in the LRT scenario are on average around 40% higher (approximately 3 minutes) in the AM peak and 28% higher (approximately 2 minutes) in PM peak. These increases in auto travel times are mainly a cause of increased traffic volumes in the east side of the model (Red Hill Valley Parkway).
7.11 Auto travel times on James Street are relatively similarly to those reported in the BAU scenarios. Whilst there is a reduction of capacity on main street due to mixed auto and LRT use, the VISUM model reassigns traffic away from this corridor.
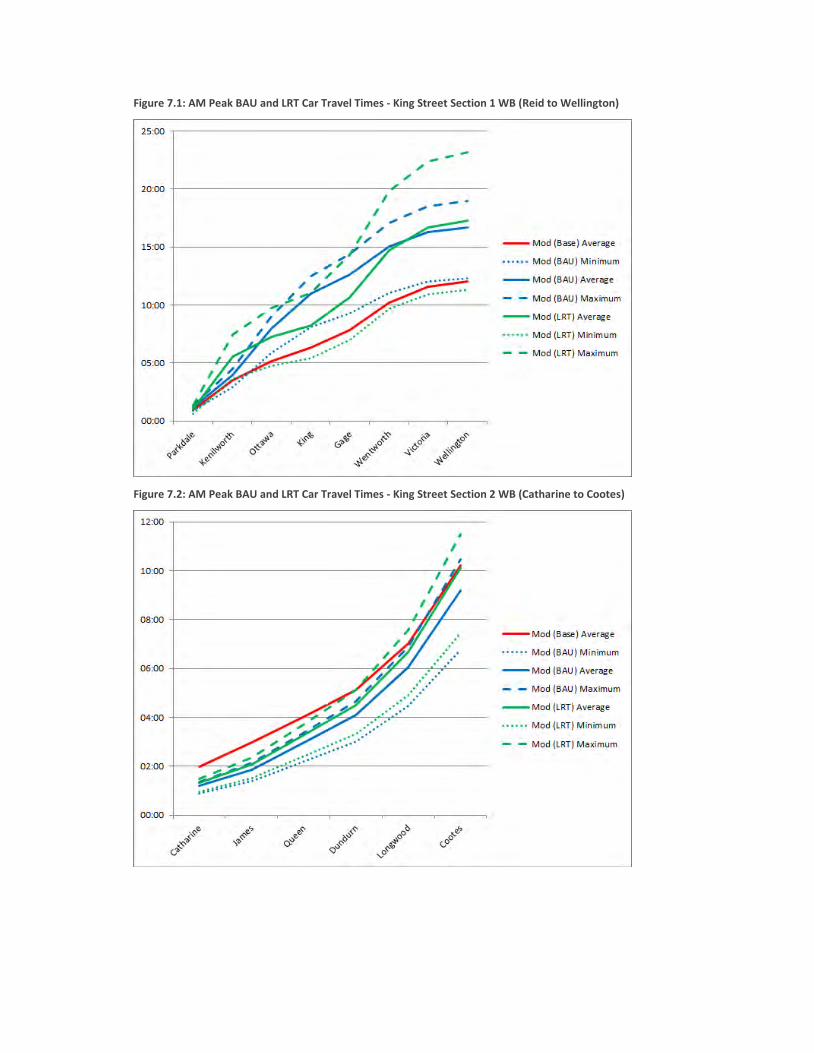
Figure 7.1: AM Peak BAU and LRT Car Travel Times - King Street Section 1 WB (Reid to Wellington)
Figure 7.2: AM Peak BAU and LRT Car Travel Times - King Street Section 2 WB (Catharine to Cootes)
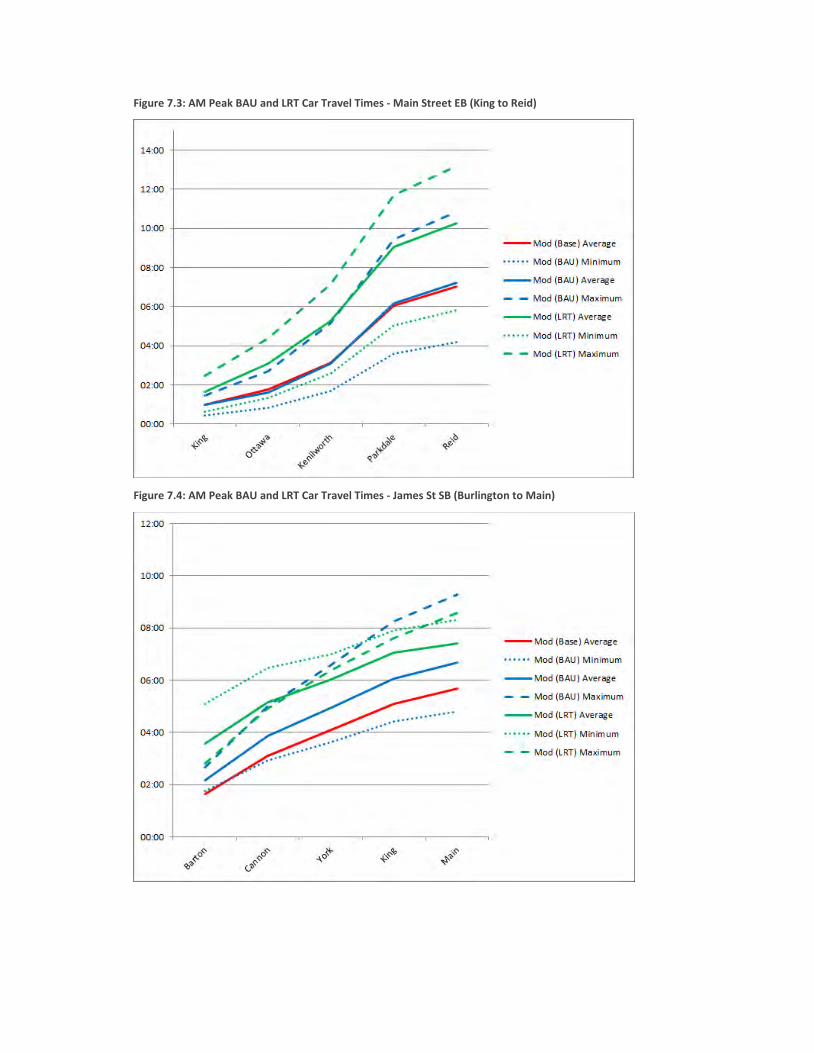
Figure 7.3: AM Peak BAU and LRT Car Travel Times - Main Street EB (King to Reid)
Figure 7.4: AM Peak BAU and LRT Car Travel Times - James St SB (Burlington to Main)
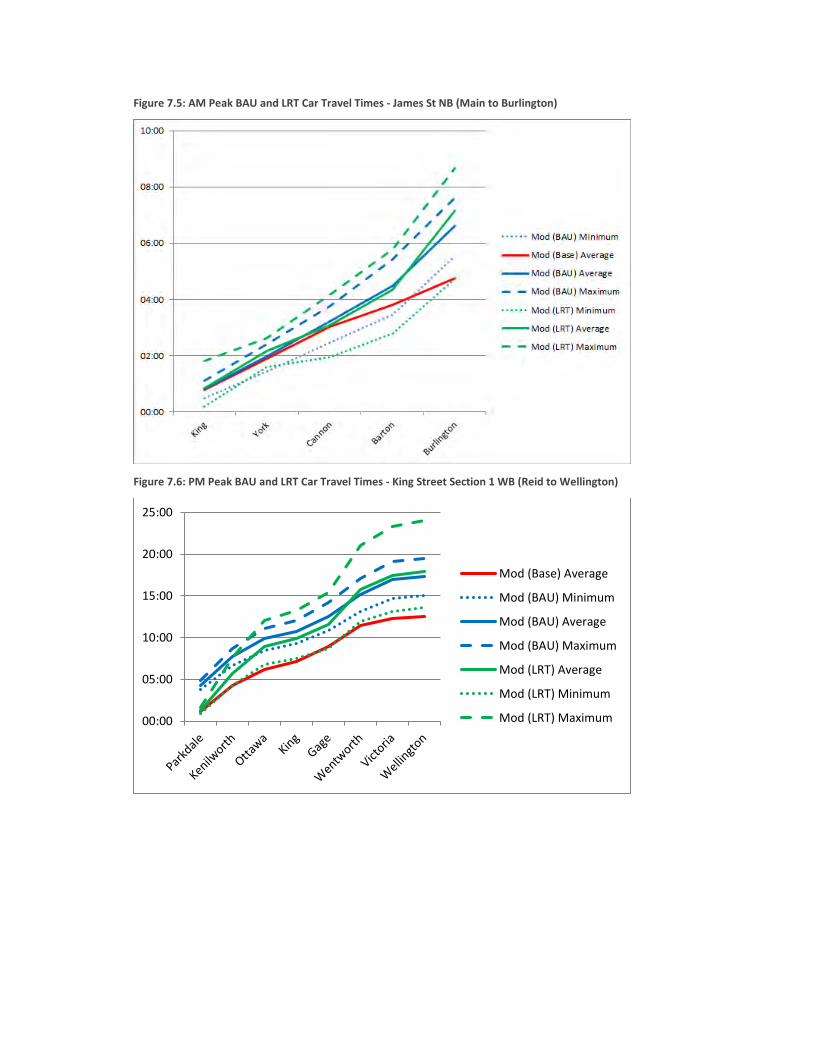
Figure 7.5: AM Peak BAU and LRT Car Travel Times - James St NB (Main to Burlington)
Figure 7.6: PM Peak BAU and LRT Car Travel Times - King Street Section 1 WB (Reid to Wellington)
00:00
05:00
10:00
15:00
20:00
25:00
Mod (Base) Average
Mod (BAU) Minimum
Mod (BAU) Average
Mod (BAU) Maximum
Mod (LRT) Average
Mod (LRT) Minimum
Mod (LRT) Maximum
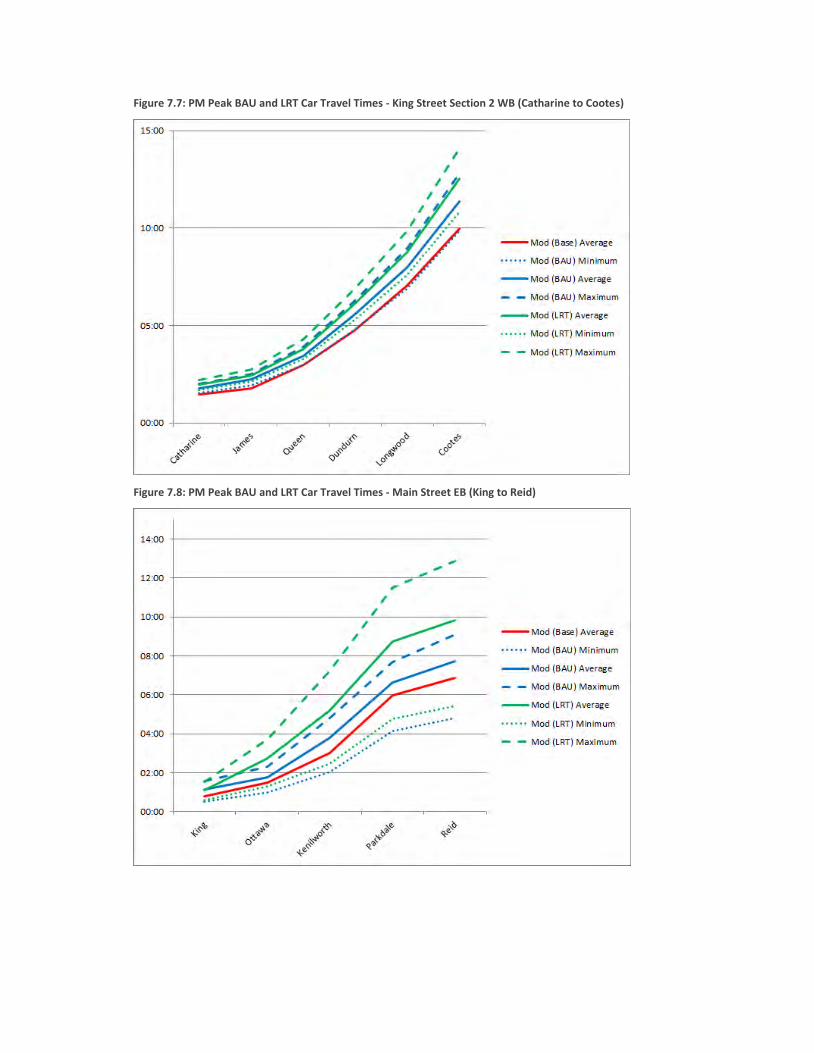
Figure 7.7: PM Peak BAU and LRT Car Travel Times - King Street Section 2 WB (Catharine to Cootes)
Figure 7.8: PM Peak BAU and LRT Car Travel Times - Main Street EB (King to Reid)
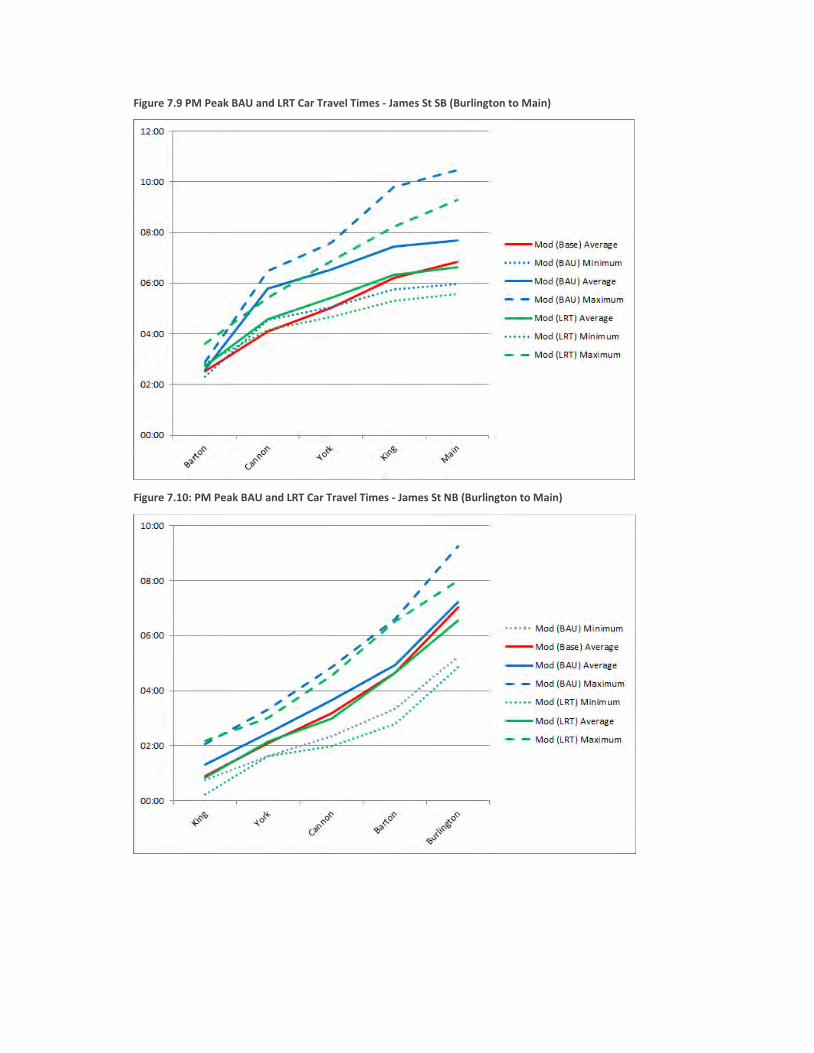
Figure 7.9 PM Peak BAU and LRT Car Travel Times - James St SB (Burlington to Main)
Figure 7.10: PM Peak BAU and LRT Car Travel Times - James St NB (Burlington to Main)
LRT Travel Time and Travel Time Reliability
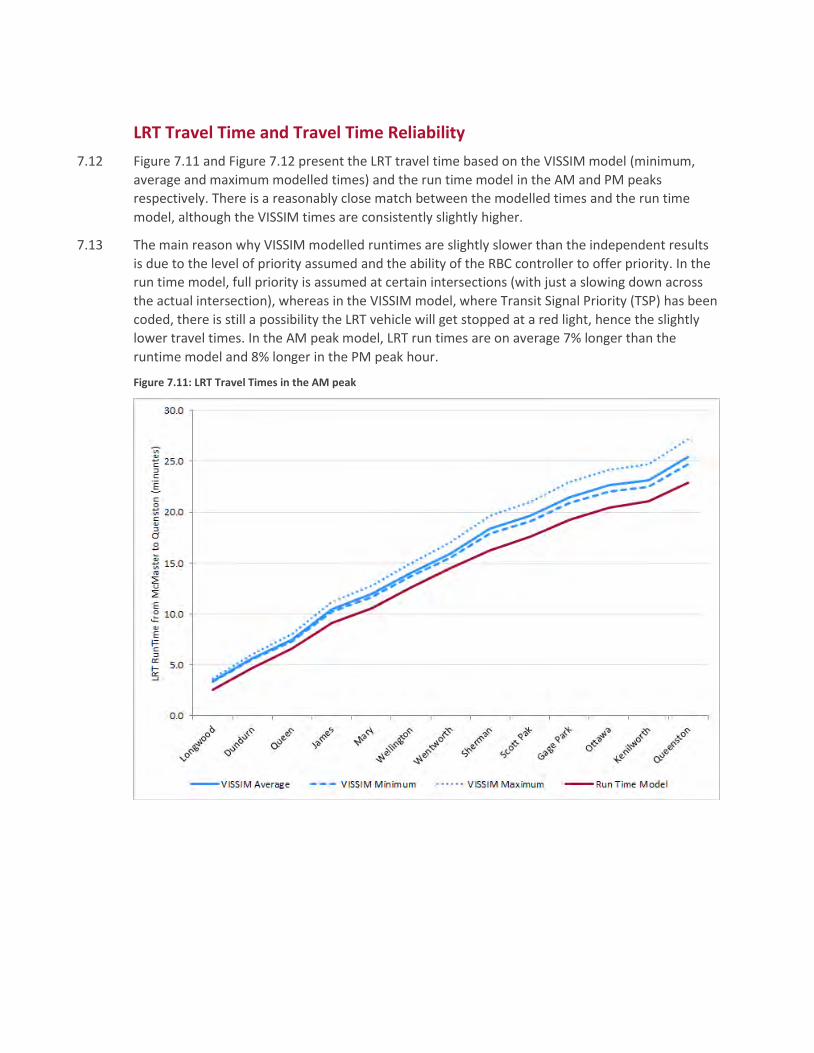
7.12 Figure 7.11 and Figure 7.12 present the LRT travel time based on the VISSIM model (minimum, average and maximum modelled times) and the run time model in the AM and PM peaks respectively. There is a reasonably close match between the modelled times and the run time model, although the VISSIM times are consistently slightly higher.
7.13 The main reason why VISSIM modelled runtimes are slightly slower than the independent results is due to the level of priority assumed and the ability of the RBC controller to offer priority. In the run time model, full priority is assumed at certain intersections (with just a slowing down across the actual intersection), whereas in the VISSIM model, where Transit Signal Priority (TSP) has been coded, there is still a possibility the LRT vehicle will get stopped at a red light, hence the slightly lower travel times. In the AM peak model, LRT run times are on average 7% longer than the runtime model and 8% longer in the PM peak hour.
Figure 7.11: LRT Travel Times in the AM peak
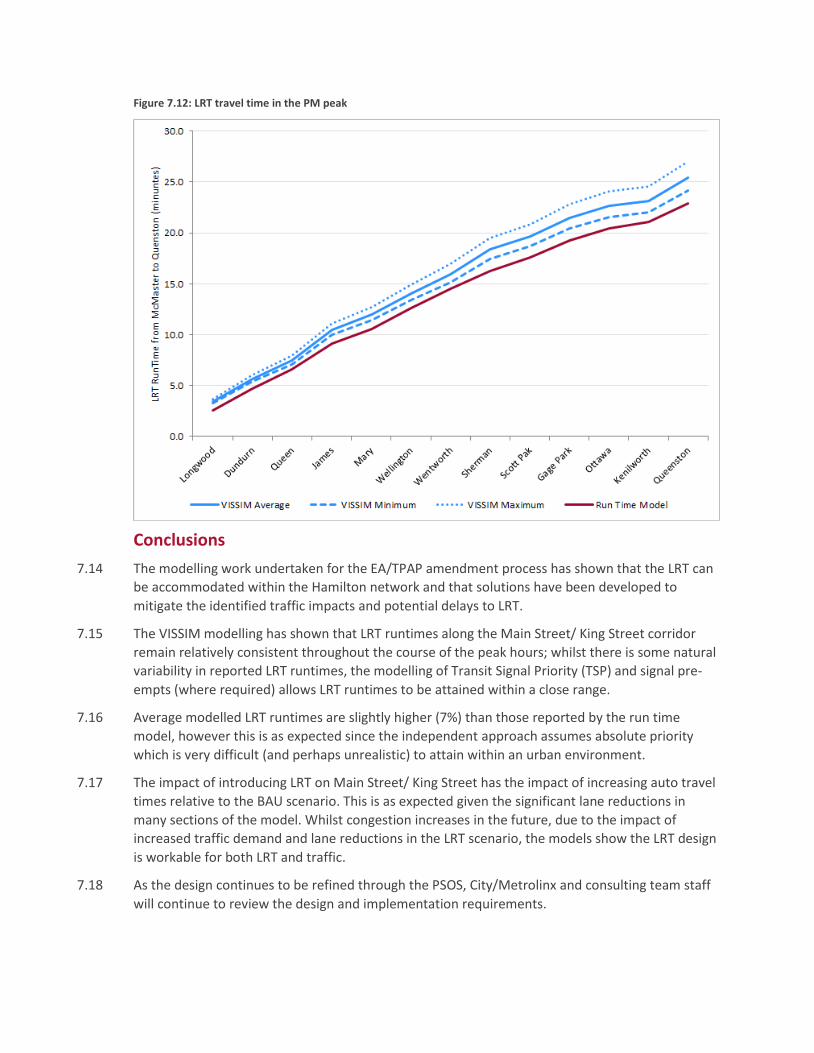
Figure 7.12: LRT travel time in the PM peak
Conclusions
7.14 The modelling work undertaken for the EA/TPAP amendment process has shown that the LRT can be accommodated within the Hamilton network and that solutions have been developed to mitigate the identified traffic impacts and potential delays to LRT.
7.15 The VISSIM modelling has shown that LRT runtimes along the Main Street/ King Street corridor remain relatively consistent throughout the course of the peak hours; whilst there is some natural variability in reported LRT runtimes, the modelling of Transit Signal Priority (TSP) and signal pre-empts (where required) allows LRT runtimes to be attained within a close range.
7.16 Average modelled LRT runtimes are slightly higher (7%) than those reported by the run time model, however this is as expected since the independent approach assumes absolute priority which is very difficult (and perhaps unrealistic) to attain within an urban environment.
7.17 The impact of introducing LRT on Main Street/ King Street has the impact of increasing auto travel times relative to the BAU scenario. This is as expected given the significant lane reductions in many sections of the model. Whilst congestion increases in the future, due to the impact of increased traffic demand and lane reductions in the LRT scenario, the models show the LRT design is workable for both LRT and traffic.
7.18 As the design continues to be refined through the PSOS, City/Metrolinx and consulting team staff will continue to review the design and implementation requirements.