Embed Size (px)
Citation preview

On behalf of the European Commission, DG Regional Policy (2005 CE 16 0 AT 017)
Study on “territorial cohesion, lessons learned from the ESPON programme projects and strategy for the future
Appendix D – Case Study on Exploiting
potential ESPON complementarities with other Community programmes
By Carlo Sessa – ISIS
June 2006

Table of Contents
0. Introduction ____________________________________________________ 3
1. Overview of ESPON complementarities with other EU programmes __________ 4
2. What ESPON has to offer ? _________________________________________ 7
Concepts of territorial cohesion and polycentric development ______________________ 7
ESPON data base and core indicators _________________________________________ 8
GIS orientated instruments _________________________________________________ 9
Regional Classification of Europe____________________________________________ 10
Spatial analysis tools _____________________________________________________ 11
Territorial Impact Analysis_________________________________________________ 13
Macroeconomic, Sectoral, Social and Territorial Model (MASST) ___________________ 14
Know Trans-European Networks (KTEN)______________________________________ 16
European Territorial Cohesion Index (ETCI) ___________________________________ 17
Long-Term Database (LTDB)_______________________________________________ 17
Data availability problems and the ESPON Data Navigator________________________ 19
3. How to overcome data shortages: exploit the linkages with INSPIRE, GEOSS and GMES ___________________________________________________________ 21
What is the INSPIRE initiative ______________________________________________ 21
Environmental user needs_________________________________________________ 22
The INSPIRE implementation process ________________________________________ 26
The GEOSS and GMES initiatives____________________________________________ 29
Potential complementarities of ESPON with INSPIRE and GEOSS/GMES _____________ 30
4. Potential linkages of ESPON with other EU Research activities for EU policy impact assessment ________________________________________________ 33
Monitoring the EU Sustainable Development Strategy ___________________________ 33
Impact assessment of EU policies and the EU Research to develop SIA and SEA methods._____________________________________________________________________ 35
Potential complementarities of ESPON with EU research on sustainable development monitoring and impact assessment__________________________________________ 40
5. How to exploit ESPON at the regional scale: potential linkages with INTERACT/INTERREG programme ____________________________________ 43
About INTERREG and INTERACT ____________________________________________ 43
Potential complementarities of ESPON with INTERACT/ INTERREG _________________ 44
6. How to exploit ESPON at the urban scale: potential linkages with the Urban Audit and the URBACT programme _________________________________________ 47
The EU urban policy and programmes _______________________________________ 47
Urban data needs _______________________________________________________ 49
Potential complementarities of ESPON with other EU urban programmes ____________ 51

0. Introduction The aim of the ESPON strategy case study is to identify potential complementarities of the
ESPON programme with other programmes and policies at EU level, which may be useful to
exploit to enhance the effectiveness and impact of the programme in the future.
The study is articulated in six sections as follows:
1. Overview of ESPON actual and potential complementarities with other Community
programmes and policies.
2. What ESPON has to offer ? This is a review of the main products of the ESPON cross-
thematic projects which represent durable results and for which specific
complementarities with other EU programmes can be identified
3. How to overcome data shortages thanks to the INSPIRE initiative and the exploitation
of the earth observation programmes GEOSS and GMES, by strengthening the interaction
of ESPON with these data infrastructure programmes.
4. Support to the EU Sustainable Development Strategy and EU sectoral policies.
This is a review of the potential support ESPON can provide to the EU Sustainable
Development strategy and the implementation of Sustainable Development Indicators at
national and regional level by one side, and to the spatial impact assessment of EU
sectoral policies on another side. Impact assessment activities need to be coordinated
with the EU Research Framework projects currently developing impact assessment
methodologies and tools (e.g. Sustainability Impact Assessment, Strategic Environmental
Assessment).
5. How to exploit the ESPON results and tools at the regional scale, in particular
strengthening the linkages with the INTERACT/INTERREG programme.
6. How to exploit the ESPON results and tools at the urban scale, in particular
strengthening the linkages with URBACT - and the future Framework programme for the
exchange of experience on urban renewal - to disseminate ESPON data, tools and results
to end users (city policy makers), as well as the linkages with the Urban Audit initiative
to foster and expand city benchmarking activities at EU level.
3

1. Overview of ESPON complementarities with other EU
programmes
The present study focuses on the potential complementarities of the ESPON programme with
other EU programmes and policies which are or could be related in the near future to ESPON
because they:
can provide important spatial data inputs for ESPON activities (INSPIRE, GEOSS, GMES);
will develop methodologies and tools for impact assessment (SIA – Sustainability Impact
Assessment; SEA – Strategic Environmental Assessment) which are strongly related (and
partially overlapping) with the territorial impact assessment methods developed in
ESPON (EU Environmental Research);
can help to disseminate and share the knowledge of ESPON results with end users
beyond the scientific community – policy makers, practitioners – at regional and urban
level (INTERACT, URBACT). In the context of these programmes the ESPON methods and
tools could be also applied to deliver territorial assessments of the thematic co-operation
programme activities focusing on Lisbon and Gothenburg priorities;
are sectoral policies whose spatial impact would be better understood if the new ESPON
methodologies and tools are consistently applied. These sectoral policies are to be
framed also in the context of the overarching EU Sustainable Development Strategy, and
ESPON could provide a specific support in the development and maintenance of
Sustainable Development Indicators (SDI) to monitor the implementation of this
strategy.
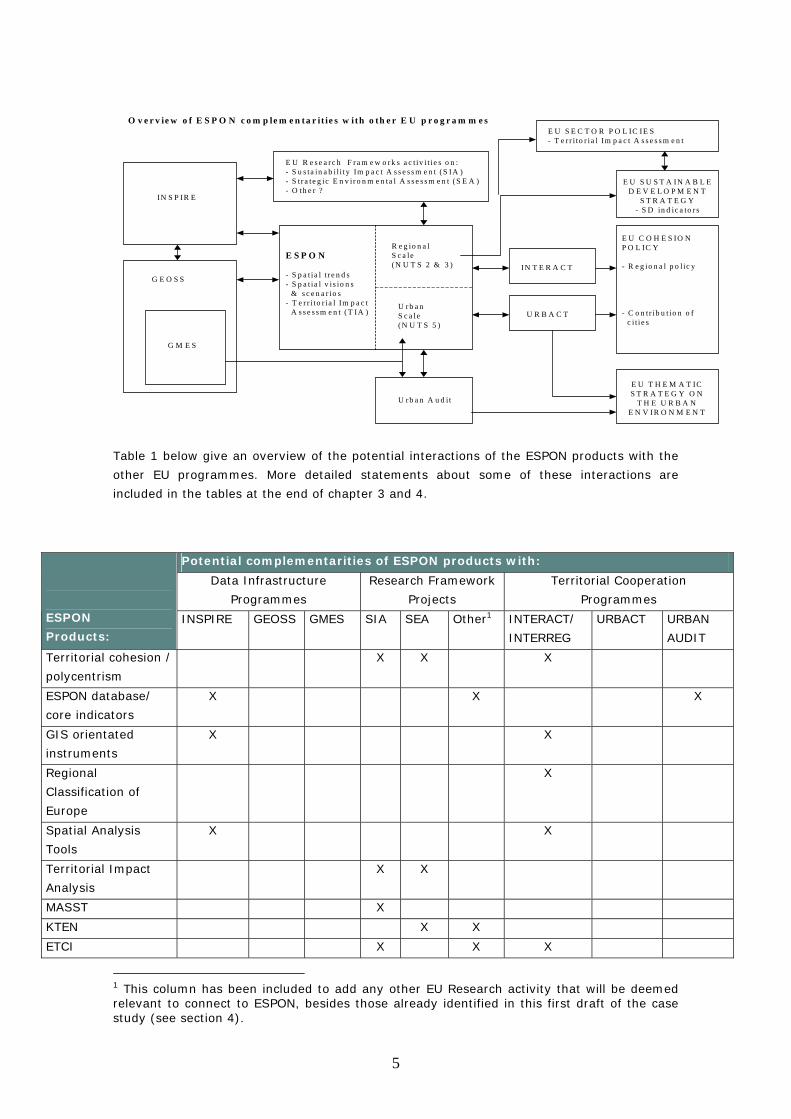
The complex system of complementarities and potential interactions between ESPON and the
mentioned programmes and policies is illustrated in the diagram below.
In the following sections we will describe the single components of the diagram and discuss
the potential linkages with ESPON. In order to identify as far as specific complementarities,
in section 2 the main methodologies and tools delivered so far by ESPON are also described.
4
O v e r v ie w o f E S P O N c o m p le m e n ta r it ie s w i th o th e r E U p r o g r a m m e s
IN S P IR E
G E O S S
G M E S
E S P O N
- S p a t ia l t r e n d s- S p a t ia l v i s io n s
& s c e n a r io s- T e r r i to r ia l Im p a c t
A s s e s s m e n t ( T IA )
R e g io n a lS c a le( N U T S 2 & 3 )
U r b a nS c a le( N U T S 5 )
E U R e s e a r c h F ra m e w o r k s a c t iv i t i e s o n :- S u s ta in a b i l i t y Im p a c t A s s e s s m e n t ( S IA )- S t r a te g ic E n v i r o n m e n ta l A s s e s s m e n t ( S E A )- O th e r ?
U r b a n A u d i t
IN T E R A C T
U R B A C T
E U S U S T A IN A B L ED E V E L O P M E N T
S T R A T E G Y- S D in d ic a to r s
E U C O H E S IO NP O L IC Y
- R e g io n a l p o l ic y
- C o n tr ib u t io n o f c i t i e s
E U T H E M A T ICS T R A T E G Y O N
T H E U R B A NE N V IR O N M E N T
E U S E C T O R P O L IC IE S- T e r r i to r ia l Im p a c t A s s e s s m e n t
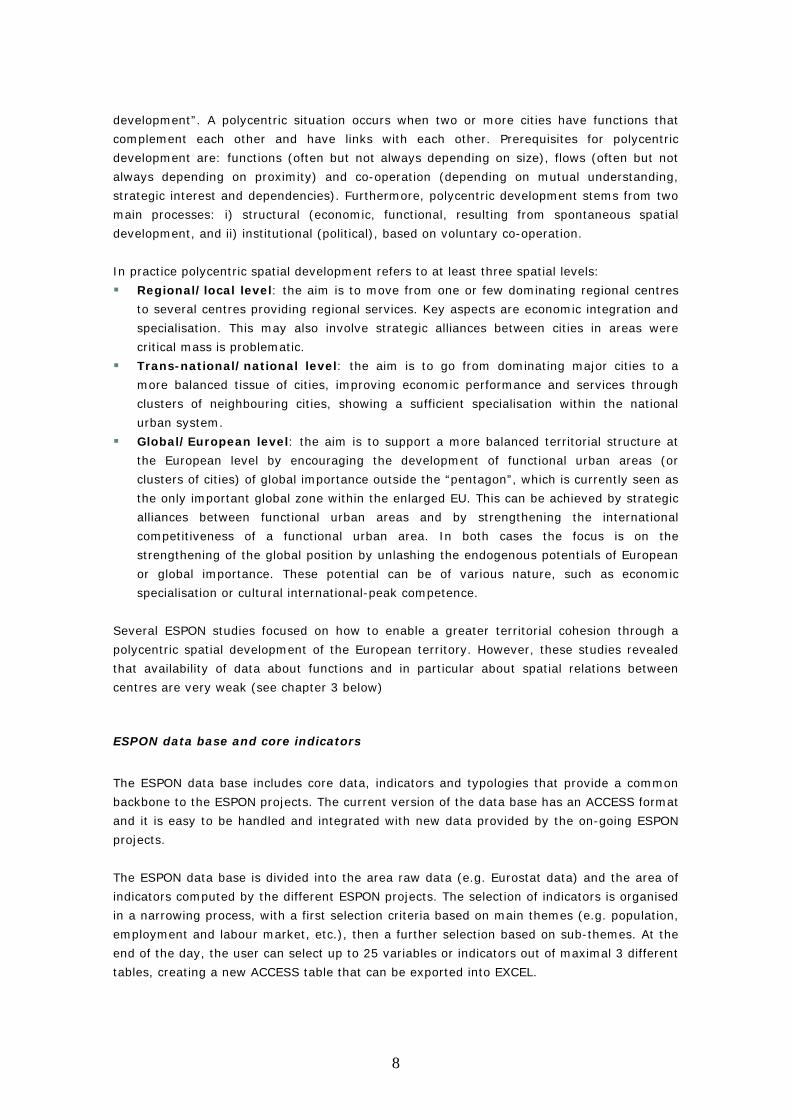
Table 1 below give an overview of the potential interactions of the ESPON products with the
other EU programmes. More detailed statements about some of these interactions are
included in the tables at the end of chapter 3 and 4.
Potential complementarities of ESPON products with:
Data Infrastructure
Programmes
Research Framework
Projects
Territorial Cooperation
Programmes
ESPON
Products: INSPIRE GEOSS GMES SIA SEA Other1 INTERACT/
INTERREG
URBACT URBAN
AUDIT
Territorial cohesion /
polycentrism
X X X
ESPON database/
core indicators
X X X
GIS orientated
instruments
X X
Regional
Classification of
Europe
X
Spatial Analysis
Tools
X X
Territorial Impact
Analysis
X X
MASST X
KTEN X X
ETCI X X X
1 This column has been included to add any other EU Research activity that will be deemed relevant to connect to ESPON, besides those already identified in this first draft of the case study (see section 4).
5

Long-Term database X
Data Navigator X Table 1: Potential complementarities of ESPON products with other EU programmes
6

2. What ESPON has to offer?
Before discussing the potential linkages with other programmes, the obvious starting is to
consider what ESPON has to offer in terms of methodologies, data and tools which can be
delivered or used for the sake of other programmes implementation or policy evaluation.
Briefly, the ESPON applied research so far was focused on three mainstreams:
Trend analysis for several aspects, including urban system and polycentric development,
urban-rural relations, small and medium size cities, accessibility and transport networks,
telecommunication, demography, enlargement, natural and technological hazards,
natural heritage, governance, cultural heritage, information society.
Territorial impact analysis of several policies, including structural funds, pre-accession
aid, EU infrastructure policy, EU R&D policy, EU Agricultural policy, EU energy policy, EU
fisheries policy, structural funds in urban areas.
Cross-thematic projects, focusing so far mainly on integrated tools for spatial
development, spatial scenarios and orientations and the realisation of the Lisbon process.
The focus here is not on the results of these mainstreams activities, which are illustrated in
the ESPON project reports and the synthesis elaborated by the ESPON Secretariat (cfr …),
but on the main problems encountered, and the potentialities to overcome at least some of
them in the future ESPON activities, in particular by establishing effective linkages with other
EU programmes.
However, before discussing in the next chapters why and how to develop fruitful linkages
with other EU programmes, we need to illustrate briefly in the next sections of this chapter
what are the main results and tools provided by ESPON 2.
Concepts of territorial cohesion and polycentric development
ESPON studies have contributed to better define the concepts of “territorial cohesion” and
“polycentric development”.
Territorial cohesion, meaning the balanced development of human activities across the
European Union, is complementary to economic and social cohesion. The concept
encompasses the objective to lessen the disparities between regions, whatever their nature.
Nevertheless, it cannot be limited to this to the extent that the word “territorial” carries
additional meaning. An important additional meaning relates to the accessibility of citizens to
any essential services and basic facilities, wherever they live in the European Union. Thus
territorial cohesion translates the goal of sustainable development in spatial terms, and may
be identified with the fair access for citizens and economic operators to services of
general economic interest (SGEI), irrespective of the territory to which they belong.
The concept of polycentric spatial development merges the two policy aims encompassed
in the European Spatial Development Perspective, i.e. “economic growth” and “balanced
2 the description is based on ESPON project 3.1 and 3.2 reports
7
development”. A polycentric situation occurs when two or more cities have functions that
complement each other and have links with each other. Prerequisites for polycentric
development are: functions (often but not always depending on size), flows (often but not
always depending on proximity) and co-operation (depending on mutual understanding,
strategic interest and dependencies). Furthermore, polycentric development stems from two
main processes: i) structural (economic, functional, resulting from spontaneous spatial
development, and ii) institutional (political), based on voluntary co-operation.
In practice polycentric spatial development refers to at least three spatial levels:
Regional/local level: the aim is to move from one or few dominating regional centres
to several centres providing regional services. Key aspects are economic integration and
specialisation. This may also involve strategic alliances between cities in areas were
critical mass is problematic.
Trans-national/national level: the aim is to go from dominating major cities to a
more balanced tissue of cities, improving economic performance and services through
clusters of neighbouring cities, showing a sufficient specialisation within the national
urban system.
Global/European level: the aim is to support a more balanced territorial structure at
the European level by encouraging the development of functional urban areas (or
clusters of cities) of global importance outside the “pentagon”, which is currently seen as
the only important global zone within the enlarged EU. This can be achieved by strategic
alliances between functional urban areas and by strengthening the international
competitiveness of a functional urban area. In both cases the focus is on the
strengthening of the global position by unlashing the endogenous potentials of European
or global importance. These potential can be of various nature, such as economic
specialisation or cultural international-peak competence.
Several ESPON studies focused on how to enable a greater territorial cohesion through a
polycentric spatial development of the European territory. However, these studies revealed
that availability of data about functions and in particular about spatial relations between
centres are very weak (see chapter 3 below)
ESPON data base and core indicators
The ESPON data base includes core data, indicators and typologies that provide a common
backbone to the ESPON projects. The current version of the data base has an ACCESS format
and it is easy to be handled and integrated with new data provided by the on-going ESPON
projects.
The ESPON data base is divided into the area raw data (e.g. Eurostat data) and the area of
indicators computed by the different ESPON projects. The selection of indicators is organised
in a narrowing process, with a first selection criteria based on main themes (e.g. population,
employment and labour market, etc.), then a further selection based on sub-themes. At the
end of the day, the user can select up to 25 variables or indicators out of maximal 3 different
tables, creating a new ACCESS table that can be exported into EXCEL.
8

An overview of the ESPON data base shows a number of tables of data mostly at NUTS2 level
(but a few are at NUTS3), covering different topics: spatial typologies, population,
employment and labour market, wealth and production, transport, R&D, ICT, education, land
use, environment, agriculture, social situation, tourism, public sector, ESPON Regional
Classification of Europe (see below). The geographical coverage is EU25 + Switzerland,
Norway, Romania and Bulgaria.
From the data available in the ESPON database it was possible to define a list of core
indicators. By now, 103 core indicators have been identified, several of which can be only
implemented on the NUTS2 level due to the lack of more detailed data. However, the
majority of core indicators are available at the NUTS3 level, which was the target level of
territorial data to be included in the database. But it is important to note that to build time
series from these data is often problematic, because adjustments or even delimitation of the
NUTS zones have always caused gaps in information, only sometime filled with backward
related recalculation.
In the field of urban topics, more elaborated data sets are necessary in future which will
allow a more comprehensive analysis of urban areas as nodes in a polycentric development.
For this socio-economic data and coherent time series at municipal scale (NUTS5) are
needed, as well as data on flows between urban areas.
GIS orientated instruments
The ESPON map kit has been elaborated as an ESRI ArcView3.2 application. It enables the
construction of maps covering the EU25+2+2 territory on different regional levels (NUTS0,
NUTS1, NUTS2, NUTS3 and NUTS2&3). The surrounding countries (non ESPON space) have
been also added, including map background and borders and coastlines.
Thus, the ESPON projects all benefited from the availability of a common tool to produce
regionally based thematic maps. In addition to the geographical data on the ESPON regions
(NUT1 to NUTS3) each ESPON project has been equipped with vector data of the
municipalities of the ESPON countries, which could be mapped and used for analytical
purposes.
Another important instrument is the ESPON Web GIS portal, which allows the analysis of
ESPON geographical and statistical data through the Internet for the general public, although
the access is restricted by a password. This portal provides three options:
Simple Analysis Map, an interactive application which allow the user to access and
visualise predefined maps of currently available data and indicators.
Advanced Analysis Map, a more advanced application that allow the user to develop
new dynamic maps from the available ones, modifying key representational features or
adding new data.
Statistical Analysis, an interactive application that allow the user to make a statistical
analysis of any variable or indicator available in the data base, producing standard
statistics (e.g. mean, max, min, standard deviation, coefficient of variation).
9
It is important to mention that in all these Internet tools data are organised according to the
ESPON Data Navigator guidelines, i.e. divided in 19 thematic categories and 64
subcategories of data and structured NUTS0, NUTS1, NUTS2 and NUTS3 geographical levels.
Regional Classification of Europe
The ESPON programme has produced a broad range of specific new knowledge in different
thematic fields, using single indicators to represent the geographical distribution and trends
of specific phenomena.
In particular, 8 thematic fields have been analysed using 37 indicators. The thematic fields of
analysis are:
1. Regionalised Lisbon performance, using 5 indicators of knowledge society
performance according to the Lisbon goals.
2. Economically successful regions, based on 2 economic indicators (level and
change of regional GDP).
3. Efficiency of labour markets, using 7 employment indicators.
4. Accessibility, using 5 indicators of potential accessibility of the regions by different
transport modes.
5. Change of population, based on 4 indicators of population density, structure and
growth.
6. Naturalness, using 3 indicators of artificial, natural and agricultural surface
7. Hazards exposure, using 7 indicators of natural and man made hazards.
8. Spatial concentration, using 4 indicators of spatial settlement.
The indicators of each thematic field have been combined into a unique synthetic indicator,
with a simple technique named “Regional Classification of Europe”. To keep the method as
simple and transparent as possible, the indicators were combined by simply adding the
standardised values of the single indicators and using equal weights for each indicators. Then
the values of the synthesis indicator where divided in 5 classes in order to represent the
indicator on the NUTS2 level maps.3
The analysis was done at NUTS2 level because at the more detailed NUTS3 level the number
of useful indicators, due to data limitations, would have been reduced to five to ten
indicators at most.
3 As explained in a footnote at page 22 of the ESPON Midterm results by spring 2005 “the classes used in the maps have been calculated on the basis of mean value and standard deviation: Highly below average: from minimum up to mean value –1,16 standard deviation Below average: from mean value –1,16 standard deviation up to mean value –1/2
standard deviation Average: mean value +/- ½ standard deviation Above average: from mean value +1/2 standard deviation to mean value +1,16 standard
deviation Highly above average: from mean value +1,16 standard deviation to maximum.”
10
Spatial analysis tools
The aim of the spatial analysis tools developed by ESPON was to define methods to measure
objectively the rather fuzzy concepts that are involved in the ESDP. In the following table the
main spatial analysis tools are listed together with the main policy purpose they may fit in:
Spatial Analysis Tool Policy purpose
Multiscalar Territorial Analysis (MTA): the tool
allows to compute the relative deviation of a
region from the European, national and local
average and it can help to find out potential
contradictions at different levels of action
Subsidiarity & Legitimacy of Regional Policy:
according to this principle, the Regional policy
should not duplicate the action of the Member
States and should avoid contradictions
between levels of intervention (European,
national, regional)
Homogeneity and Discontinuity Analysis
(HAD): these tools are dedicated to the
analysis and measurement of spatial
heterogeneity, which is not the case of
classical econometric indexes
Territorial cohesion & Integration of Sectoral
Policies: the originality of this new concept
lies in taking into account the spatial
dimension of the sectoral policies developed
by EU
Modifiable Area Unit Problem (MAUP): the
effect of changing territorial divisions on
statistical and cartographic results is well
known. But the best division from the
scientific point of view can be politically not
correct (NUTS 2-3)
Gerrymandering and manipulation of
territorial divisions: the allocation of
Structural Funds is related to official NUTS
divisions which can be intentionally
manipulated by states in order to maximise
their benefits
Multiscalar Smoothing Methods (MSM): these
methods make possible to derive multivariate
maps of potential economic and demographic
flows induced by the unequal repartition of
population and wealth
Polycentrism & Accessibility: the connection
of a territory to the rest of Europe or to the
rest of the World should be organised around
nodes or networks which can be defined at
different scales (Source ESPON project 3.1 report)
Multiscalar Territorial Analysis (MTA) is based on the assumption that it is not possible to
evaluate the situation of a given territorial unit without taking into account values for
neighbouring units and for the higher level (regional or national) entities it belongs to.
Indeed, for policy analysis purposes contrast and gradients are of much more interest than
absolute values. Taking the indicator “GDP per capita” as an example, MTA implies a three-
level analysis of deviations of a giver region value from the global level average (EU15 or
EU27), the national average or the local average of neighbouring regions. The latter
deviation is particularly interesting, taking the geographical contiguous regions as a
reference area in most of the cases. However, it is possible to use also more flexible criteria
to identify the “neighbourhoods” of a given region, based on variables measuring the level of
interaction (e.g. commuting flows) between the regions.
Homogeneity and Discontinuity Analysis (HAD) produces maps of discontinuities
describing the contrasts between contiguous territorial entities. They can be defined in
absolute and relative terms, according to the assumptions of the observer or the problem to
be analysed. Substantial differences between contiguous regions create distortions which are
generally considered detrimental for territorial cohesion (“territorial gaps”). But those
11

discontinuities can also reveal opportunities of cooperation and exchange in a framework of
local partnership for development. The database necessary for the analysis of discontinuities
includes GIS files describing the geometry of regional boundaries at NUTS2 level and general
attributes of these boundaries: approximated length, political meaning (external border of
the EU, internal border etc.), presence/absence of a common language, level of potential
interaction (e.g. product of the populations of the two regions in contact), etc. Indeed, the
analysis of “discontinuities” is multivariate, i.e. it relates always to a multiplicity of criteria
measured by various attributes. In some cases an interesting analysis can be done with
reference to only one indicator, as the variation or “gradient” of GDP per capita between two
contiguous regions (these kind of analysis are key for fiscal equalisation purposes). The
analysis of an interregional gradient can be done not only for absolute values but also for
relative ones. However, the definition of territorial discontinuities are better done on the base
of more than one parameter. For instance the evaluation of the potential flows between
neighbouring regions depends also from the amount of population located on each side, from
the presence of a common language, from the demographic complementarities, etc..
The Modifiable Area Unit Problem (MAUP) has been recognised since the 1970’s as one
of the most difficult challenge for geographers, cartographers and spatial analysts. Actually
the level of correlation between two variables distributed in space can be completely
modified according to the level of aggregation of spatial units or more generally the spatial
grid used to collect the spatial information (ecological correlation). The most evident
drawback is the fact that the amount of population or administrative units which fulfil the
condition of eligibility for territorial cooperation policies is completely modified according to
the NUTS level of administrative divisions (communes, provinces, regions) taken into
account. Apparently, the use of a mixture of NUTS2 and NUTS3 levels is a good compromise
between precision of results and elimination of the biases related to the separation of urban,
periurban and rural areas. But some problems remain in the case of isolated metropolitan
areas at upper scale of territorial division (like Hamburg, Bremen or Brussels-Capital which
are NUTS1 units). Policy makers could agree to the choice of different NUTS level according
to the different states (e.g. maps combining NUTS2 in Germany and NUTS3 in France) but
they would certainly not easily agree to the modification of official NUTS level inside a given
state (e.g. aggregation of Brussels with the two regions of North and South Brabant).
Multiscalar Smoothing Methods (MSM) fully eliminate the problem of the initial territorial
division and produce smoothed distribution of the target phenomena. For example the
Gaussian smooting method developed by the Hypercarte Project has been applied to the
distribution of population and GDP in 1999 in order to produce a map of GDP per capita in
neighbourhoods of 50 kilometres, independent from the original territorial divisions. Indeed,
a very important property of the smoothing method is the fact that it makes possible the
comparison of maps derived from different initial territorial divisions (Corine Landcover grid
and a NUTS5 division) and the combination of indexes derived from heterogeneous sources.
Furthermore, the smoothing method can help to solve the major challenge of realisation of
harmonised series of maps at different point of time, whatever the dramatic changes can
occur in basic territorial units. In the of data at NUTS3 level the optimal smoothed map can
be obtained around a span of 50 km. But is also possible to consider the variation of the
spatial distribution according to scale as a major tool for the exploration of social
consequences of spatial heterogeneities. We can propose an equivalent model for the
situation of a place according to neighbourhoods of 50, 100, 200 or 400 kilometres: and
12

island of prosperity surrounded by poor regions will have a decreasing level of GDP per
capita when the scale of neighbourhood increase. On the contrary, some poor areas near
richer regions will have increasing level of GDP per capita when the span of neighbourhood
increases.
Thanks to their properties, maps produced with multiscalar smooting methods can be used:
To define the potential economic and demographic effects of inequalities in the
distribution of population and wealth in the European territory, although the methods
should be used very carefully because many parameters depend on external expert
knowledge on the behaviour of workers and economic actors.
To continue with further research on the key question of polycentrism in the framework
of the ESPON program, because they reveal very different patterns of polycentrism
according to the spans of neighbourhood which are chosen by the observer of economic
convergence. However, keeping in mind that these tools focus on “potential” flows
caused by the structural population and wealth inequalities and not on “effective” flows
which depend also on the distribution of functions (functional polycentrism), it will be
necessary to introduce empirical verifications to use these methods in an operational
framework. An interesting operational use of the MSM could be at this regards the
analysis of relative “peaks” and “pits” of population density in Europe, comparing the
density of locations in relative terms and not in absolute ones. Indeed, the same level of
density does not has the same meaning according to the situation of places in Europe:
100 inhab./km2 is a low level of density for places located inside the “blue banana” but a
very high level for places located in the northern peripheral regions of Scandinavia.
Territorial Impact Analysis
Originally, Territorial Impact Assessment (TIA) has been used in some European
countries as a tool for analysing, assessing and evaluating the impacts of certain projects on
the spatial development of the surrounding territory. This project-related assessment tool
may be considered similar to the Environmental Impact Assessment, although with a wider
range of criteria derived from spatial planning documents. Also in this sense the ESDP
suggests the application of TIA to transnational projects, e.g. in the area of transport
infrastructure.
However, the ESPON programme asked for applying the instrument also to EU policies and
programmes – that are originally not being committed to the goals of territorial development
but actually influencing it considerably – in order to assess how and to what degree they are
affecting the territorial development. In so doing, the ESPON programme is implicitly pushing
forward TIA towards goals similar to those of the so named Strategic Environmental
Assessment (SEA) of policies and programmes.
Whilst it would be possible to advocate a TIA procedure in addition to existing EIA and SEA
procedures it may be more fruitful to integrate them in a common framework, extending the
existing procedures to cover social and economic impacts and to include the spatial
dimension. This may finally result in a sustainability assessment process that covers
programmes and projects, all effects (environmental, social and economic) and the
interactions between activities and space over specified time periods.
13

However, it has been acknowledged that the application of TIA at the programme/policy level
suffers by a methodological dilemma: the influence of the selected Community policy
intervention cannot or can only roughly be isolated from effects of other measures or
influences. Thus, the analysis is restricted to a compilation of the policy measures in certain
regions (input side, e.g. financial interventions), recording what spatial development goals
they follow and the structural status/changes in these regions (output side) evaluated
against the chosen spatial development goals. No direct cause-effect relationships can
usually be disentangled.
The ESPON programme defines as objectives, amongst others, i) to show the influence of
sector policies on spatial development at the relevant EU scale and ii) to develop methods for
the territorial impact assessment of sectoral policies primarily at EU level, but also at the
national level, and find appropriate instruments to improve spatial co-ordination of EU sector
policies. The extension of TIA to the evaluation of programmes and policies was seen as an
important tool in this context, but has been applied only later on within the ESPON 2006
programme and almost immediately its application shown difficulties. Indeed, it turned out
that there are considerable constraints against a quick progress due to:
The actual orientation of EU policy programmes analysed that is still far away from
actually taking into account spatial development goals and concepts (and this concerns
also the Regional Policy, so far).
Hence, as a direct consequence of that orientation, there is a dramatic lack of territorial
differentiation of policy implementation data.
Finally, the elaboration of spatial development goals and concepts in the wake of ESDP
has hardly achieved operational results appropriate for assessment, so far.
The reports of the ESPON policy impact projects confirm the considerable difficulties caused
by the lack of territorial implementation data, and underline the statement concerning the
limitations for a common and co-ordinated TIA approach. Therefore, a major
recommendation for the future EU sectoral policies (e.g. Transport, R&D, Common
Agriculture Policy, Regional Policy) is to provide a monitoring and documentation system
encompassing an appropriate regionalisation of policy implementation data.
Although to establish a common TIA methodology to cover the whole range of EU policy
issues was not possible, what turned out feasible was to develop TIA minimum
requirements to be applied to the different areas of concern in specific ways. The
requirements cover the different phases of policy assessment – scooping, analysis and
assessment – and define the specific questions to be answered to assess the territorial
impacts. Specific goals of the territorial assessment include the evaluation of the polycentric
spatial development (at European, transnational, national or regional level, as needed) and
cohesion issues, encompassing economic, social and territorial cohesion (the latter aiming to
fair access for citizens and economic operators to services of general economic interest and
the balanced distribution of human activities.
Macroeconomic, Sectoral, Social and Territorial Model (MASST)
The MASST model is an econometric model with the aim to measure the determinants of
regional development and regional imbalances; once the causality relationships are
14

estimated, the model estimates future quantitative changes in regional income and
inequality. In fact, the outcome of the MASST model will be different territorial settings of
the new Europe based on conditional quali-quantitative hypothesis on future trends of
macroeconomic and institutional driving forces; each future territorial setting will define
winners and losers, and will identify new levels of regional disparities.
According to the economic logic behind the model, regional growth can be divided into two
components:
a national component, since a national economy influences the dynamics of its regions;
positive macroeconomic elements supporting growth at the national level – like low
interest rates stimulating investment or low exchange rates creating national
competitiveness on international markets – support the development of regional
economies;
a regional component (defined as “differential shift”). National growth is in fact the
average growth of all regional economies of a Country. Each regional economic growth
differs from the average according to the degree of competitiveness of the local
economy. Local competitiveness has traditionally been analysed as dependent on the
quality and quantity of local resources such as capital and labour. More recently, much
attention has been given to the presence of soft elements, like the efficiency of local
institutions, the degree of local synergy among local actors and the cooperation with
external bodies; these soft elements are interpreted as the main determinants of local
competitiveness, in terms of both productivity and innovation activity performance.
The dynamics of macroeconomic elements, at both the national and local level, will be the
result of driving forces of different nature – macroeconomic, technological, institutional,
demographic and socio-cultural – represented in the MASST model by various trends and
variables. The way the model will integrate these variables will be explained later – the
model is still a work in progress at this stage – once the statistical significance of correlation
and dependency patterns between the variables has been clarified. Indeed, the MASST
model requires a large amount of data at a disaggregated territorial level and in time series.
A lot of work has already been achieved in this respect, using different sources, but still
some gaps are present and data are missing, as for instance indicators of human, social and
physical capital endowments.
The results of the MASST model will be territorial scenarios at NUTS2 level, covering the
whole EU25+2+2 countries. Each scenario will be based on general driving forces; the
MASST model is in fact unable to provide results for very specific driving forces (like the
advent of certain technology rather than another). Single driving force impact forecast will be
produced on maps as a first step towards more integrated scenarios. However, the most
interesting and crucial outcome of the MASST scenarios will not be these thematic scenarios,
but rather cross-thematic scenarios, based on a combination of different hypothesis on the
driving forces. Each scenario will be the result of a cause-effect chain, which will influence
variables of different nature (demographic, technological, macroeconomic). Each scenario
will also be the result of territorial and economic linkages that exists among nations and
regions: the former stem from import-export relationships, while the latter are measured via
“territorial proximity effects” – i.e. the economic advantages in terms of economic potentials
provided to a region by its location in a dynamic and increasingly growing area – and by
economic integration potential effects.
15

Know Trans-European Networks (KTEN)
Based on the results of existing forecast models in different strategic sectors (demography,
transport, energy and CO2 emissions), an integrated knowledge tool denominated Know
Trans-European Networks (KTEN) is being developed by ESPON Project 3.2. The main aim of
this tool is to help policy-analysts explore the sensitivity of main trends to some key
variables, and to verify the consistency of scenarios.
The tool takes the form of a “metamodel” based on the results obtained from running
advanced models, using pre-calibrated statistical functions and default assumptions etc..
More than black boxes that are only really used by their developers – as many advanced
transport models are – KTEN will be developed on spreadsheets (enhanced with Visual Basic
programming if needed) and enjoy user-friendly interfaces, to make it a learning experience
for end users to the difference of classical forecast models which are often too complex to
understand for the non-expert.
Indeed, KTEN is a computer-based policy-interface providing interactive access to advanced
forecast and evaluation models. Needless to say, the knowledge tool requires a model
behind. Now KTEN is focused on passenger interregional trips, and it has been linked to
ongoing databases and modelling exercises led at the EU level by DGTREN (ETIS-BASE). An
improvement of KTEN is planned for the near future, to include also freight transport.
However, it is important to note that KTEN metamodel does not take into account intra-
regional traffic. The latter is often source of congestion, especially in densely populated
areas, but current models and databases do not offer a sufficient resolution for evaluating
such traffic.
Interactivity is indispensable to make learning possible. It is because of the experience of
simulating the impacts of alternative decisions that the user may identify behavioural
patterns in the modelled system, but for advanced transport models on-line computation of
alternative actions is often not feasible. This is why a new interactive model as KTEN has to
be developed based on the pre-calculated results of the advanced one. The crucial element in
the design of the knowledge tool is therefore not to oversimplify the model – leading towards
inconsistent and misleading answers – but to interface it, or at least break it up into a
number of interlinked and manageable policy-relevant modules. At the end the paramount
goal is to enable policy makers to integrate the scientific reasoning in the latest steps of the
decision making process.
To be more precise, currently KTEN is a simplified passengers’ traffic model developed to
facilitate a strategic analysis of the trans-European Transport Networks on a wider pan-
European and Mediterranean scale. KTEN is a sequential 4-steps model, with combined
modal split and assignment of multimodal networks (1 complete run of KTEN takes 150
minutes). KTEN uses STREAM model results, WTO and EUROSTAT Air Traffic OD databases
as benchmark and/or reference. KTEN outputs are origin-destination matrices by trip
purpose and mode at NUTS2 level for EU27. Assignment is executed using All or Nothing
assignment tools on a multimodal graph with specific attributes on transport links and nodes.
The metamodel can be used to produce new transport scenarios. The scenario parameters to
16
calculate generated trips can be entered by region and by country, and the results of trip
generation can be visualised also by region or aggregated by trip purpose. The comparison of
the results of the model with the values of STREAMS for each region is also available.
The KTEN freight module is being developed as a main interface where the user has to define
the major trends and policies. Country relation values embedded in the model structure can
be changed to reflect the improvement of commercial relations. Some variables – namely
GDP, population and traffic flows – are linked through elasticity parameters that can be
altered by the user to reflect decoupling trends due to the effect of transport policies.
European Territorial Cohesion Index (ETCI)
The aim of the ESPON research on a European Territorial Cohesion Index (ETCI) is to
develop a technical tool for evaluation of scenarios. The initial idea was simply that each
scenario should be evaluated in a quantitative way with a synthetic indicator which should
take into account the three fundamental objectives of ESDP: economic competitiveness,
social cohesion and sustainable development. This synthetic indicator should be better than
GDP per capita, but should remain very simple.
In a first round of research the literature on composite indexes (like Human Development
Index) has been explored in order to realise a state of the art on the different possible ways
to combine different criteria. The focus was mainly on technical questions and used existing
data in order to support research but without in depth analysis of the quality of information.
This first round of research has produced interesting results from a methodological point of
view, but has also demonstrated that it was possible to introduce strong manipulations in the
results, which make these synthetic indexes too poorly reliable to be substituted to GDP per
capita in practical decisions (as for instance the eligibility of regions for Structural Funds
distribution).
In the second round of research developed since January 2005 the research on statistical
and cartographic tools has been postponed in order to focus more on the availability of data
which could be used for the development of a composite index, taking into account the three
dimensions of ESDP and the definition of territorial cohesion. This analysis of the data
situation in regard to political expectations on territorial cohesion led to the pessimistic
conclusion that it is probably not possible to build any relevant index of territorial cohesion in
the framework of the ESPON database. Indeed, only the economic dimension appears to be
well documented, but very little information are available at regional level for the evaluation
of environmental sustainability and practically nothing for social cohesion. This pessimistic
conclusion – confirmed by the analysis of the ESPON core indicators state of the art (see
below) – claims for further research to explore different ways to complete the ESPON
database by new measures of social cohesion.
Long-Term Database (LTDB)
The aim of the Long Term Database (LTDB) is not to collect an important number of
indicators but to focus on the most useful and general criteria which can be a basis for the
17
elaboration of political scenarios. The most interesting data which were expected to be
harmonised during the year 2005 include time series covering the periods 1960-65, 1980-
89, 1995-2005 and forecasts for the period 2020-2040 for the following data:
Demography: total population, structure by age and sex, births, deaths.
Active population: total and by sector
GDP: total and by sector.
These data are to be collected mostly at NUTS 2-3 level (but the target areas for population
structure data of the period 1995-2005 are NUTS 3-5).
The diversity of the data to be collected is apparently limited but it is important to consider
that some of them are very expensive (age and sex structure, births and deaths by five
years periods) and that all target variables are raw count variables which can be combined
together in order to produce a great diversity of indicators of high interest for territorial
planning. For example, the estimated expectancy of life can be deduced from the
combination between age structure and deaths, through the application of a standard life
table. Apparent migration rate can also be deduced from the combination between
population at different time periods and natural increase. Both indexes would be very useful
for the measure of territorial cohesion in long term perspective, by using an European
Territorial Cohesion Index (see above). Concerning economic competitiveness, all classical
combinations of GDP with total population, active population, economic sectors etc. can be
deduced from basic information, providing a long term view of the economic evolution of
Europe. What is really missing is the environmental dimension.
However, the most difficult problem to be solved is probably not the collection of numbers
(which are available in most cases) but the precise identification of territorial units which are
characterised by these figures. The crucial problem for LTDB is to identify very precisely the
timetable of administrative change of territorial units in all states of the ESPON area. The
fact that the name of a territorial unit remains the same is not necessarily a guarantee that
the spatial extension also remains the same. The situation is different for big and small
changes of territorial units:
Dramatic changes of territorial units are obvious problems for data harmonisation
because they oblige to produce estimations or to introduce very expensive data collection
at lower level like NUT5. But at least they are obvious and clearly identified problems,
less dangerous of …
Small changes in territorial units, which are not depicted on maps but can produce
very important changes on statistical results, especially in case of measures of evolution.
The typical situation is the case of metropolitan areas which enlarge their administrative
territory at a given period of time, but without changing their name: the increase of
territory produces an important increase of raw count variables (population, GDP, etc.)
and an equivalent important decrease in the neighbouring regions which have lost part of
their territory. As the territorial change is very limited, it is not necessarily visible on
maps (which are not necessarily revised) and it can be ignored by the author of the
database if he/she has not a perfect knowledge of administrative changes at all levels. As
a result, significant variations could be observed which are not due to real demographic
or economic drivers, but simply to the modification of territorial divisions.
Due to this problem of changing territorial units over time, it is not immediately possible to
produce maps of the evolution of the data included in the LTDB because the information on
18
territorial units are collected “as they are” at the time period of elaboration. When we look at
the administrative situation of territorial units of the ESPON space in 1980 and 2000, we can
observe that some states have kept more or less the same administrative divisions (France,
Belgium, Spain, Italy, Hungary, Romania …) but that an important minority of states has
completely changed the NUTS2-NUTS3 divisions. These can not be properly recovered
without a full disaggregation at NUTS5 level which would be very expensive and is even not
sufficient in certain cases where local units have also been modified.
This task of precise reformulation of old databases in current administrative division is clearly
not for ESPON and is rather relevant for national statistical institutes, EUROSTAT or the
INSPIRE programme. ESPON may help to solve the problem by making a survey on the
historical evolution of administrative divisions in all states of the ESPON area.
Data availability problems and the ESPON Data Navigator
A general problem which reduces the potentiality of all the above mentioned ESPON tools
and methodologies is the shortage of detailed data. Indeed, after a careful analysis of the
available data in Eurostat, ESPON and in the OECD statistics, the authors of ESPON Project
3.2 concluded that:
the most disaggregated territorial level which can be achieved without incurring in
unmanageable gaps of data is NUTS2 level;
the first year of analysis that can be taken into account for a consistent time series
analysis is 1995: before that year, NUTS2 data for the Eastern Countries are not
available.
Available data cover the economic and environmental dimensions, but the social dimension is
missing. In fact only 4 of the 103 ESPON core indicators can be considered as social: pupils
by educational level; educational level of population; unemployment rates; impact of
accessibility changes on unemployment. There are other indicators indirectly related to the
social dimension, for instance the diffusion of Internet or cellular phones, or the proportion of
households with PCs. But what are missing are truly social indicators, as for example: wages
disparities, share of teen-agers leaving the school without any qualification, life expectancy.
This lack of social indicators has to be seen also as an unintended consequence of the focus
of the Lisbon Strategy on the economic dimension. The situation is not so critical for the
environmental dimension as for the social dimension, because the European Environmental
Agency and the EC Joint Research Centre are able to deliver regular environmental
information of good quality which can support policy orientations concerning the European
environment. In the social field, instead, adequate statistical information is not available, and
it is impossible to develop a policy without good indicators for ex-ante and ex-post
evaluation.
Although the mentioned data problems cannot be solved only in the context of the ESPON
programme (the solution can be provided in the wider context of the INSPIRE initiative, see
chapter 3 below), ESPON project 4.1 has produced an useful Internet search tool which
allows to identify the existing data, the so named Data Navigator. This is a rather simple
and user-friendly tool, which allows to make queries through a structure of hyperlinks
19

defined according to the following search keys: countries, themes, sub-themes, NUTS levels,
maps. The tool provides references in terms of sources, links, addresses and other useful
information in order to get data/information related to the themes dealt in all the ESPON
Projects.
The Data Navigator covers the information available from official sources in the countries of
four main areas:
the EU15 Member States, plus Norway and Switzerland.
Baltic Sea area (Estonia, Latvia, Lithuania, Poland and Belarussia).
CADSES area (Bulgaria, Czech Republic, Hungary, Romania, Slovakia, Slovenia, Albania,
Bosnia-Herzegovina, Serbia-Montenegro, Moldavia, Ukraine).
Mediterranean countries (Morocco, Algeria, Tunisia, Libya, Egypt, Israel, Palestine, Syria,
Jordan, Turkey Malta, Cyprus).
Where available the details on the source of data are well described, including complete
references of the data producers: source, contact details and email address. Not all the
themes are equally treated pointing out the problem of harmonised statistics and data
availability for some countries. So, themes like “Telecommunication and information society”
and “Cultural Site” show very few cases. In contrast, categories more exhaustive are:
“Agriculture”, “Employment and labour Market”, “Population”, “Transport” and “Wealth and
Production”. The quantity of information provided for the different countries is also very
uneven: it goes from only one item for Moldova to 571 items for Cyprus. Amount of data
according to NUTS levels varies considerably, and a lack of information is visible mainly for
NUTS4 and NUTS5.
20

3. How to overcome data shortages: exploit the linkages with
INSPIRE, GEOSS and GMES
What is the INSPIRE initiative
INSPIRE is an initiative launched in 2001 by the Commission to support the availability of
spatial information for the formulation, implementation and evaluation of European Union
policies. The initiative was based on the observation that the accessibility, interoperability
and affordability of spatial data and information systems were limited. It was generally
recognised that this situation prevents society to fully benefit from the potential of the
technology to improve the relevancy, accuracy, impact and public control of territorial
policies and related decisions at all scales and to involve citizens, businesses, non
governmental and research organisations in a participatory information society.
With the INSPIRE initiative the European Union – in collaboration with all the relevant
stakeholders – intends to establish an infrastructure for spatial information in Europe that
will allow the public sector users at the European, national, regional and local level to share
spatial data from a wide range of sources in an interoperable way for the execution of a
variety of public tasks at conditions which do not restrain its use. Moreover, users in private,
research and NGO-organisations and the citizens will be offered services to discover, access
and view these spatial data sources. INSPIRE has been initially focused on environmental
policy needs but, being a cross-sectoral initiative, will gradually be extended to other sectors
(e.g. agriculture, transport, etc.) as other interested Commission services participate.
In order to develop the INSPIRE legislation, all geographical information stakeholders were
mobilised in relevant working groups to prepare and INSPIRE proposal for a Directive. Mid
2004 the proposal for a Directive of the European Parliament and of the Council –
Establishing an infrastructure for spatial information in the Community – saw light.
The INSPIRE initiative recognises the fact that most of the quality spatial information is
available at local and regional level, but that this information is difficult to exploit in a
broader context for a variety of reasons. The situation on spatial information in Europe is one
of fragmentation, gaps in availability of geographical information, duplication of information
collection and problems of identifying, accessing or using data that is available. As a result of
these problems, effective EU policy actions suffer because of lack of monitoring and
assessment capabilities that take into account the spatial dimension.
Indeed, the data are often of unsatisfactory or undefined quality, based on proprietary
geographic information systems and not accessible to the public or other users at local,
regional, national and international level. Therefore, projects that combine data coming from
various sources to provide policy-relevant information and tools are often time consuming
and costly. Policies need to be put in place to reduce the duplication in collection,
harmonisation efforts and to facilitate and promote wide dissemination of the data. These
policies should free funds to be invested in improving the availability and quality of spatial
information.
21

The INSPIRE implementation is following a step-wise approach:
The first step focuses on harmonisation of documenting existing datasets (metadata)
and on the tools needed to make this documentation accessible.
The second step will primarily aim at providing common ways to access the spatial data
sets themselves allowing uncomplicated analysis of data on different themes coming
from different sources. An example of such analysis is the visual inspection of spatial
relations between phenomena by overlay of datasets.
The third step will target the establishment of common models of the objects in the
environment for which spatial data is collected, such as transport networks, forests, etc..
This will allow to map existing datasets to a common set of models, starting in this way
to create a really harmonised spatial data infrastructure that will facilitate the
combination of information of various sources and more advanced analysis work.
The fourth and last step will build upon the previous steps and concentrate on
completing the common models and on providing the services to fully integrate data
from various sources and various levels, from the local to the European level into
coherent seamless datasets supporting the same standards and protocols. This step will
allow real time access to up-to-date data across the whole of Europe.
As mentioned above, INSPIRE is conceived as a cross-sectoral initiative covering the main
Community sectors with a spatial impact such as transport, energy, agriculture, etc., but will
target initially information needed to support environmental policy. Environmental thematic
user needs have been identified in an INSPIRE position paper4, whose main conclusions are
relevant and briefly summarised below.
Environmental user needs
Environmental data users are many and various, and include users who need spatial data for
planning, management, assessment, monitoring and reporting: governments &
administrations, utility and public services, R&D organisations, commercial and professional
end users (e.g. property developers), NGOs and citizens. The producers of spatial
information within the public sector include national environmental protection agencies,
national geological surveys, national maritime administrations, cadastral, land registration
and other land administration organisations, local authorities and utilities. It should also be
noted that, under certain circumstances, private data producers may offer production
capacity to public bodies, or possibly sell data directly onto the market themselves.
Most spatially organised data and information are either used internally by public bodies, or
are supplied to other public sector organisations under various types of agreement. A
relatively small but growing number of government departments or agencies conduct
commercial business with the private sector or with the general public. At this regard it is
important to recognise the difference between retaining, sharing and trading data, which is
illustrated in the following diagram:
4 Cfr INSPIRE Environmental Thematic Coordination Group, Environmental Thematic User Needs Position Paper, EEA, 2002
22
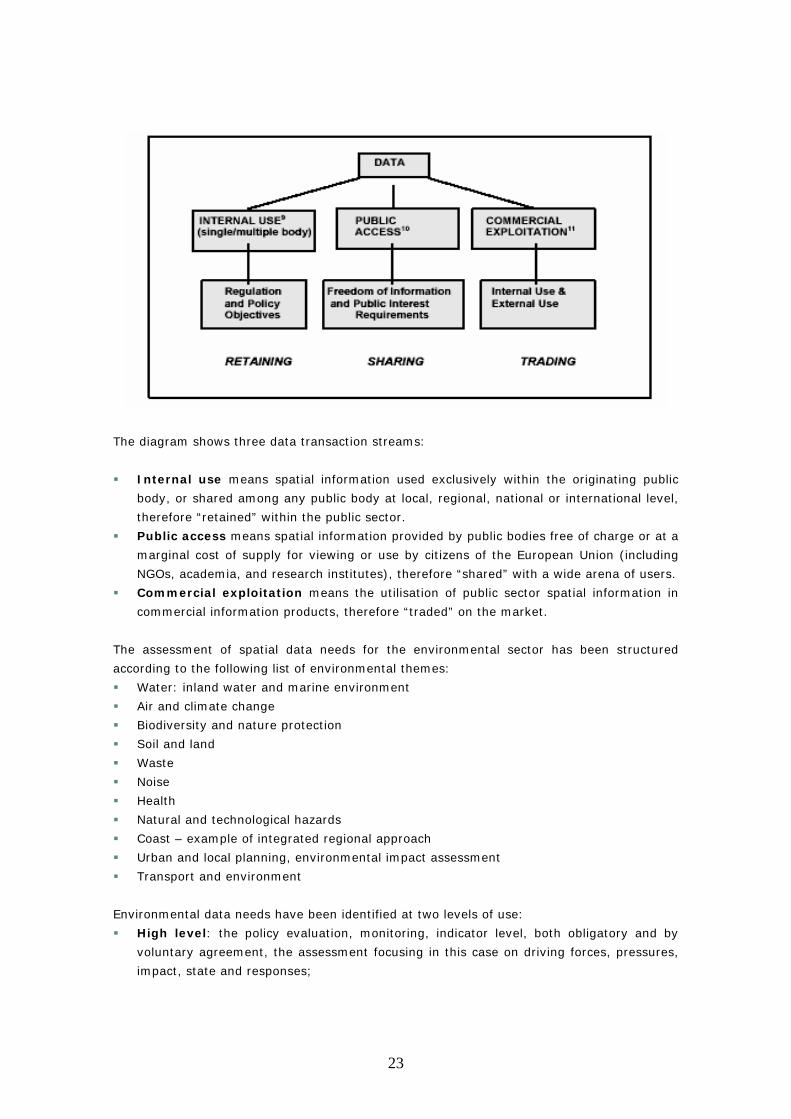
The diagram shows three data transaction streams:
Internal use means spatial information used exclusively within the originating public
body, or shared among any public body at local, regional, national or international level,
therefore “retained” within the public sector.
Public access means spatial information provided by public bodies free of charge or at a
marginal cost of supply for viewing or use by citizens of the European Union (including
NGOs, academia, and research institutes), therefore “shared” with a wide arena of users.
Commercial exploitation means the utilisation of public sector spatial information in
commercial information products, therefore “traded” on the market.
The assessment of spatial data needs for the environmental sector has been structured
according to the following list of environmental themes:
Water: inland water and marine environment
Air and climate change
Biodiversity and nature protection
Soil and land
Waste
Noise
Health
Natural and technological hazards
Coast – example of integrated regional approach
Urban and local planning, environmental impact assessment
Transport and environment
Environmental data needs have been identified at two levels of use:
High level: the policy evaluation, monitoring, indicator level, both obligatory and by
voluntary agreement, the assessment focusing in this case on driving forces, pressures,
impact, state and responses;
23

Local level: the implementation and management level, such as environmental
management of water, air, soil, land use planning, regional planning, risks assessment
etc..
Typical characteristics of data needed at the high level of policy development and evaluation
as identified through the assessment are:
very small scale (aggregate) data for the visualisation of statistical information
small scale data, e.g. 1:1 million for overall assessment and modelling
full coverage of data at small scales and detailed data for case studies. However, the
access to spatial data is difficult at present, also concerning data at small scales
historical data and updates are necessary
products derived from data analysis are based on generalised maps of the temporal and
spatial distribution of phenomena or on information based models where several data are
joined together.
Local level needs require more detailed data to support coastal zone integrated
management, river basin management, land use and urban plans, environmental impact
assessment of projects etc. EIA projects in particular require substantial data collection of
valuable thematic data, and the reuse of the information is commonly inhibited by
management of internal character, missing information about the existence and user rights
constraints.
In order to assess the future data development needs for the environmental sector, a
pragmatic approach has been adopted by categorising data into spatial data themes,
subdivided into spatial data components for which a number of spatial datasets can be
identified. The thematic structure is therefore divided into 20 main thematic areas, and these
are further split into 60 spatial data components, being broad categories of related data.
The table on the following pages shows in the rows the spatial components and in the
columns the linkages to important policy priorities:
European legislation and international legal obligations
Environmental policy focus
European agreements on environmental analysis (indicator)
Health and social security/risk management – local level
Needs in local planning, EIA, integrated management.
The last two columns of the table illustrate the data categories – identifying reference data,
core thematic data, environmental sector data and other sector data – and the priorities
given to data implementation in the INSPIRE framework of action (divided in high, medium
and low priority). The thematic structure is not fixed – new categories of data can be added
at all levels. However, the thematic structure and the defined set of spatial data components
defined in the table was based on a broad assessment, and they were useful as a basis for
the initial development phase of INSPIRE. After this initial phase, a periodic review of the
structure, e.g. 3 years, is envisaged.
24

25

The INSPIRE implementation process
The INSPIRE working group on environmental data needs has identified the need for a two-
track approach for fulfilling user needs following the implementation of environmental
policies:
For data components used at the local and regional level there is a need for high-
resolution data which should be covered by the production of data at the local level, with
a possible generalisation of data to also fulfil needs at the higher levels. However,
generalisation based on harmonised local level data can only be achieved in the long run
given the diversity of data and systems at the local level.
INSPIRE should also facilitate production of national and European-scale data. For data
components used at the national and European levels, needs for more general data
should, until harmonised data becomes available at local and regional level, rely on
production at this scale. Commonly, data production organised at national levels fulfils
these needs. Data from national levels should be generalised into European-level data
wherever feasible, but existing European-scale data should be maintained separately as
long as fully automated generalisation is not feasible.
26

As it concerns the implementation of the overall INSPIRE system, it is envisaged that
producers/owners/custodians of environmental data wanting to give access to data to the
INSPIRE infrastructure have either to load data to an external/central data repository, or
establish and maintain its own server facilities. In the long term it is expected that thousands
of data repositories will be linked to the infrastructure, established by European, national,
regional and local authorities, private companies or other kinds of spatial data custodians.
Any organisation establishing a data repository complying with the specifications defined by
INSPIRE can be linked to the infrastructure. It is not foreseen that environmental sector
users or other users need special software or hardware to download data from the
infrastructure.
In order to let data custodians make spatial data available through the infrastructure,
INSPIRE should develop as a first step a web catalogue system which directly read the
metadata being part of the data sets and present the information, the datasets and the
metadata being placed in distributed data repositories. It should be as a minimum
requirement be possible to search for and locate data according to thematic content,
scale/accuracy, owner/custodian, distributor or by geographical location. The system should
be implemented and in operation in the European Commission and at Member States level by
2007.
Spatial data, including metadata, should be loaded to data repositories complying with
INSPIRE technical and legal specifications. It is expected that the EC will establish and
maintain at least one data repository by 2005, and that all major spatial data producers at
the central European level will establish and maintain spatial data repositories following
INSPIRE specifications by 2008. It is expected that each Member State establish and
maintain at least one similar data repository by 2006, to load priority reference and thematic
core data to the infrastructure, and that major spatial data producers within each MS
establishes and maintains spatial data repositories or have agreements with external data
repositories for provision of their most needed reference and core thematic data, to be
implemented by 2010.
All the process should be ended by 2015. The figure below illustrates how products having
different status in INSPIRE will fulfil different levels of harmonisation and quality when they
are to be loaded on data repositories in the INSPIRE infrastructure. In the initial phases of
INSPIRE it is expected that only existing data are shown in INSPIRE web catalogues, while
full harmonisation it is expected by 2015 at latest.
27

Besides describing the overall process of INSPIRE implementation related to environmental
data needs, the environmental needs assessment working group has issued some specific
recommendations which are relevant for identifying potential complementarities with the
ESPON programme.
One major group of data of prime importance to environmental users is basic features,
commonly termed reference data. The availability of reference data is crucial as they are to
be used in combination with thematic data, as a basis for environmental analysis and map
presentation. Recommendations are given on how to populate the INSPIRE reference data
for two broad levels of use:
Small scale (aggregate) data for overall use at national, cross-national and European
level
Medium to large scale (disaggregated) data to be used at regional and local levels.
There is a very high need for data at small scales, 1:1 million or smaller in accuracy. It was
recommended5 that the Commission develops and maintains a small-scale seamless
reference data base with a Pan-European coverage, due to be implemented by 2005. The
data base should at a minimum contain the following elements:
Elevation and bathymetry in respect to land and sea
Administrative boundaries NUTS 0-5
Coastline and hydrography, river catchments
Main categories of land cover
Main cities and settlements
Transport (networks and nodes)
Geographical names
Grids (1x1 and coarser grids)
The data should contain relevant, officially agreed ID’s for easy linking to official statistics
and other main statistics which are agreed to be reported/generated at the European level.
There is a very high need for spatial reference data to be used at medium to large scales too
(scale ranging from 1:250.000 downwards to 1:25.000). Very large scale data at even higher
geometrical accuracy (1:5000 – 1:500) could also be considered as constituents parts of
INSPIRE. But European initiated harmonisation targets will be far less demanding than on
5 Cfr. INSPIRE ETC, Environmental Thematic User Needs Position Paper, Page 67
28

smaller scales, as the data are not primarily being exchanged outside the national level, and
in many cases not even outside the regional level. Therefore, the target for minimum area
coverage for very large scale data should be defined by INSPIRE taking into account the
need to cover urban areas and areas under particular stress (e.g. industrial sites, coastal
tourist areas, agricultural areas.).
Similar recommendations have been given for the other categories of core thematic and
environmental data.
The GEOSS and GMES initiatives
Where relevant, synergies of INSPIRE with the GEOSS and GMES initiatives will be sought in
order to ensure coherence of the spatial data infrastructure with the availability of
information from earth observation.
During its ten-year implementation period launched in the year 2004, the Global Earth
Observation System of Systems (GEOSS) will provide new impetus for Earth Observation
(EO) research.6
The GEOSS Ten-Year Implementation Plan Reference Document specifies a two-year period
to facilitate the development and availability of data, metadata and products, including base
maps and common socio-economic data, commonly required across the nine GEOSS societal
benefit areas:
Disaster reduction
Climate change
Health
Biodiversity
Water management
Ecosystems
Weather forecasting
Agriculture and desertification
Energy management
Within the next six years, 2006-2011, GEOSS will target data management facilitation
approaches within the different societal benefit areas, encompassing a great part of the EO
data life cycle, from input through data acquisition, processing, archiving and dissemination.
The Seventh Framework Programme (FP7), set to run from 2007 to 2013, will support the
GEOSS implementation plan, strengthening the links with EU environmental research, which
includes work on disaster reduction and climate change, as well other GEOSS benefit areas.
In this context, the elaboration of data information systems that bring together data from all
EO platforms, ground-based, airborne and space-based, is a first pragmatic objective of
GEOSS. Operational data information systems will permit better exchange, dissemination
and archiving of shared data, metadata and products. These systems are essential for the
6 see http://europa.eu.int/comm/research/environment/geo/article_2450_en.htm
29

scientific assessment and modelling of environmental phenomena, and are the only
instruments able to support prediction of events and their impact on the human activity.
The objective of the Global Monitoring for Environment and Security (GMES) initiative
is to provide information and customised services, based on space and non-space
observations (airborne, water-based and ground-based) to a variety of user communities in
the public and private domain. The European Commission has established an Action Plan in
2004, which envisages an operational GMES core capacity starting in 2008. GMES
demonstrator projects, many of which address environmental issues, are already supported
under the FP6 “Aeronautics and Space” priority and by ESA funding.
One of the thematic areas being addressed by ESA in the frame of GMES is the monitoring of
urban areas in Europe, covering issues related to urban areas as urban sprawl, urban
planning models and forecasts, changes in urban land use, environmental monitoring, urban
planning discipline enforcement, etc. . The GMES Urban Services (GUS) project (2003-2004)
aimed to demonstrate a portfolio of products derived from satellite data and other sources in
cooperation with a selection of users (cities and regional authorities) as a starting point for
the full implementation of a GMES service by 2008. These products are oriented to serve the
strategic urban planning needs all over Europe, and are clustered into four blocks:
Land use, including change detection and modelling tools.
Urban development control, including short term hot spot monitoring for urban planning
discipline enforcement.
Environmental quality, including noise, sealing, thermography & risk.
Regional products, including the observation of basic land use and sealing maps for
monitoring of soil consumption.
GMES and GEOSS share a range of strategic and technical issues and offer opportunities for
interactions, e.g. space and non-space observation platform, data exchanges and network
connections, integration of observations, ad-hoc campaigns.
Potential complementarities of ESPON with INSPIRE and GEOSS/GMES
It is obvious that there are a lot of potential complementarities of ESPON with the INSPIRE
and GEOSS/GMES initiatives.
In general terms, the implementation of these spatial data gathering activities will help to
solve the data shortage problems that affect spatial analysis tasks in Europe today.
Therefore, ESPON can only benefit from a coherent implementation of the INSPIRE spatial
data infrastructure.
Indeed, the ESPON programme and community of researchers can also actively cooperate to
the implementation of INSPIRE, by forming a specific Spatial Data Interest Community
(SDIC) for this purpose. Actually there are already many sectoral, thematic or regional
communities of data users and stakeholders involved in the preparation and implementation
activities of INSPIRE.
The main aims of the cooperation with INSPIRE could be for instance:
30

to exploit the Data Navigator tool to provide INSPIRE with an already working web
catalogue;
to assess and plan the availability of environmental data from the INSPIRE infrastructure
that could feed ESPON research activities in the years to come;
to assess the data needs in fields other than the environmental sector, and especially of
territorial information on economic and social aspects that will be needed to assess the
territorial cohesion and polycentric development of Europe.
The focus on territorial cohesion can help to improve the availability of data on the
accessibility of essential services all over Europe, by concentrating the INSPIRE efforts not
only on environmental data, but also on the collection and harmonisation of statistics for
local, regional and national management of public services (education, health, urban
planning etc.). In this context, also urban level data supplied by GMES services can be
particularly useful and relevant.
A more specific appraisal of possible interactions at the level of single ESPON products is
provided in the table below:
Potential complementarities of ESPON products with:
Data Infrastructure Programmes
ESPON
Products:
INSPIRE GEOSS GMES
Territorial
cohesion /
polycentrism
ESPON database/
core indicators
The ESPON database may become
an official data repository
GIS orientated
instruments
ESPON GIS instruments may be
used to facilitate the access and
mapping of INSPIRE datasets
Regional
Classification of
Europe
Spatial Analysis
Tools
Solutions to the Modifiable Area
Unit Problem may be found that
help to obtain time series data.
Multiscalar Smoothing Methods
may be applied as well to produce
comparable historical data
Territorial Impact
Analysis
MASST
KTEN
ETCI
Long-Term
database
This may become an official data
repository
31

Data Navigator This may be used by INSPIRE as a
component of the web data
catalogue
32

4. Potential linkages of ESPON with other EU Research activities for
EU policy impact assessment
Another relevant field of interaction for the ESPON programme relates to the need of
monitoring EU policies and strategies by means of indicators development activities, and to
assess the economic, social and environmental impacts of EU sectoral policies.
We will refer here in particular to:
The need to monitor the implementation of the EU Sustainable Development Strategy by
means of sustainable development indicators to be compiled at national and regional
level, and the contribution that ESPON can give to this task.
The need to assess the impact of EU regulations and sectoral policies in relation to
sustainability goals, encompassing the economic, social and environmental dimensions,
and the role that the ESPON Territorial Impact Assessment methodologies may play
together with the Sustainability Impact Assessment and Strategic Environmental
Assessment tools currently under development in the context of the EU Research
Frameworks.
The need to monitor the competitiveness, growth and social cohesion of the European cities
by means of urban indicators, and the connection with the Urban Audit initiative in this
respect, will be discussed later in chapter 6.
Monitoring the EU Sustainable Development Strategy
The Strategy for Sustainable Development adopted by the European Council in Gothenburg
in June 2001 sets out a commitment to regular monitoring. Indicators for monitoring long-
term progress towards “meeting the needs of the present generation without compromising
the ability of future generations to meet their needs” are needed to assist decision-makers
and inform the general public about achievements, trade-offs and failures in attaining the
commonly agreed objectives of sustainable development.
The recent Communication from Mr. Almunia to the Members of the Commission7 presented
the state of play of the Commission’s reflections on possible indicators for monitoring the
implementation of the EU Sustainable Development Strategy (SDS), including a list of
Sustainable Development Indicators (SDI). At the current stage EU indicators have been
selected only for the purpose of evaluating the EU SDS, and therefore they are not a priori
suited to serve national or regional purposes, in relation to national or regional sustainable
development strategies.
The purpose of indicators is to monitor progress achieved by the implementation of policy
measures towards policy goals and objectives. Inevitably, this implies that the framework
7 SEC(2005) 161 final, “Sustainable Development Indicators to monitor the implementation of the EU Sustainable Development Strategy”, Brussels, 9-2-2005.
33

and the set of SDI have to be flexible to adjust to possible changes in policy priorities and
objectives, for instance in line with issues emerging after the Strategy’s review planned for
2005. Tight policy linkages assure user relevancy and effective utilization of indicators in
decision-making. In this context, the framework provides a structured approach to policy
areas and forms a consistent communication tool between various stakeholders in the EU.
The indicators are framed according to ten SD themes:
1. Economic development
2. Poverty and social exclusion
3. Ageing society
4. Public health
5. Climate change and energy
6. Production and consumption patterns
7. Management of natural resources
8. Transport
9. Good governance
10. Global partnership
The themes are further divided into sub-themes and “areas to be addressed”. The sub-
themes usually monitor the progress towards the headline objectives while the areas to be
addressed facilitate a more detailed and diversified analysis of background factors in each
theme.
In accordance with this hierarchy of themes, sub-themes and areas, the indicator set is built
as a three-level pyramid8:
Level 1: consists of a set of 12 high level indicators allowing an initial analysis of the
theme development.
Level 2: corresponds to the sub-themes of the framework and, together with Level 1
indicators, monitors progress in achieving the headline policy objectives. These 45
indicators are aimed at evaluation of the core policy areas and communication with the
general public.
Level 3: corresponds to the areas to be addressed, i.e. various measures implementing
the headline objectives, and facilitates a deeper insight into special issues in the theme.
Therefore, these 98 indicators are aimed at further policy analysis and better
understanding of the trends and complexity of issues associated with the theme or inter-
linkages with other themes of the framework. They are intended for a more specialised
audience.
All in all, the preliminary set of SDI – consisting of 12 headline, 45 core policy and 98
analytical indicators – forms a basis for regular monitoring of progress in the headline
objectives of the Sustainable Development Strategy and the other core EU policy documents.
The indicators capture the essence of the theme developments and are easily
understandable and responsive to policy interventions. However, the EU SD strategy and
core EU policy documents encompass several priority areas on which no information or only
8 The indicators are described in the Annex to the mentioned Communication, and not repeated here for the sake of brevity.
34

partial information is available, especially – as noted also above when appraising the state of
art of the ESPON core indicators – in the social dimension. To overcome this technical
constraint and assure the production and compilation of the necessary data for policy making
in a longer perspective, the list of SDI divides the indicators into two categories, “best
available” and “best needed”.
The “best available” indicators refer to indicators that can be compiled on the basis of
existing data. Nevertheless, some of these indicators may not be the ideal indicators for
sustainable development policy issues, but serve as proxies for the ideal ones, the so-called
“best needed” indicators. Some of the indicators may also be classified as “best needed” due
to data quality problems. Consequently, the “best needed” indicators are indicators for
which:
data and/or methodology do not exist yet
data exist, but the quality is poor or unknown or does not allow publication
data exist, but the breakdowns needed are not yet available.
The Commission departments, and the European Statistical System, will continue to develop
new indicators and improve the quality of the existing indicators included in the list. The
sustainable development indicators will be made available on the EUROSTAT website.
In addition to this, an EU 6th Research Framework task, under Priority 8 Support to Policies,
is now starting aiming to “assessing interlinkages between different priorities of the
Sustainable Development Strategy”. The task description is as follows:
“Develop methods and indicators for assessing the progress towards Sustainable
Development in view of developing ‘best-needed’ indicators that require research work in
order to be developed on a regular basis. The research should build on existing work
including indicator development by EUROSTAT and other relevant European and international
organisations. Tools and methods should be provided which allow the elaboration of forecasts
on the basis of available scenarios, and the identification of inter-relationships between
selected unsustainable trends in order to explore potential synergies and trade-offs. Potential
analytical frameworks to assess interlinkages between trends should be examined, with the
aim of comparing the merits of different approaches and making recommendations for their
use in monitoring and policy making.”
This research task is clearly similar to tasks of analysis of development trends that are
currently within the scope of the ESPON research.
Impact assessment of EU policies and the EU Research to develop SIA and SEA
methods.
The White Paper of governance of the European Commission (2001) introduced a new impact
assessment method of EU policies and regulations. This method is deemed to be
comprehensive, integrating all sectoral assessments concerning direct and indirect impacts of
a proposed measure into one global instrument. It provides a common set of basic
questions, minimum analytical standards and a common reporting format. The impact
assessment will replace existing requirements for business impact assessment, gender
35

assessment, environmental assessment, trade impact assessment, regulatory impact
assessment etc.
In June 2002 the Commission published a Communication on the Impact Assessment
procedure. According to that, the impact assessment runs in two phases: the “preliminary
assessment” gives a first overview of the problem identified, possible options and sectors
affected and serve as a filter to identify the proposals that will be subject to an “extended
impact assessment”. The extended impact assessment is a more in-depth analysis of the
potential impacts on the economy, the society and environment of regulatory initiatives, the
analysis of subsidiarity and proportionality and it includes consultations with interested
parties and relevant experts. The year 2004 was the first year of implementation of this new
impact assessment procedure.
In order to refine the methodologies to serve such integrated assessment needs, there are
some areas of EU Research which deal with “Sustainability Impact Assessment (SIA)” tools
and “Strategic Environmental Assessment (SEA)” methods. Obviously this research activity is
not only useful for the European Commission impact assessment needs, but also for the
evaluation of sustainability of policies and programmes undertaken at national and regional
level. The main difference between SIA and SEA is that the former encompasses all the
sustainability dimensions – economic, social and environmental – while the latter is focused
on the environmental effects and costs of policies. In what follows we will briefly describe the
SIA and SEA related EU research activities, while the potential connection with the Territorial
Impact Assessment advocated by ESPON will be discussed in the next section.
Indeed, over the years, the European Union has launched research programmes and created
integrated tools to support policy making at all levels, putting sophisticated impact
assessment and monitoring tools – and state of the art research findings – at the disposal of
all stakeholders throughout Europe. In particular, EU environmental research for the
sustainability impact assessment of land management and EU transport research for the
strategic environmental assessment of transport networks seem to be two areas where
important potential overlaps and interactions with the research on territorial impact
assessment methods undertaken by ESPON can be found.9
The Environment Directorate of DG RTD included in the work programme of FP6 a specific
topic on “Strategies for sustainable land management, including coastal zones, agricultural
land and forests”, whose global purpose is to develop tools and methods in the field of land
use that allow:
Ex-ante impact assessment of policies at different levels, from micro to macro.
To identify the contributions of the different sectors and global policies to the EU
Sustainable Development Strategy.
The targeted tools and methods should provide harmonised data systems and services that
can be included in the Global Earth Observation System of Systems. The tools should allow
carrying out the analysis of EU, national and regional policies in terms of Cost-Benefit, Cost-
Efficiency and Scenario Analysis. The tools need to be holistic, considering land use issues
9 Within the limits of the present case study it was not possible to investigate other areas of EU research where potential overlaps with ESPON research may be found, although the research on land use management encompasses in practice several sectors of natural and human activities.
36

from an integrated perspective that takes into consideration the notion of landscape in the
broadest meaning: not just the effects on land aesthetics of policy implementation, but also
other components associated with landscape such as environmental positive and negative
impacts, rural development, social networking, urbanisation, etc.
In this context, the SENSOR project (http://www.sensor-ip.org/) covers the development of
tools that consider all type of land uses, including post-industrial sites, transportation, urban
and rural uses, etc. The scale of coverage is NUTS 2 for the EU25+2+2+1 countries. The
objective is to have a tool that takes into consideration the complementarities and the
contradictions between land uses at an aggregate level, with an entry point that is macro-
economic. Attention is also given to the feasibility of policy options in close interaction with
stakeholders. SENSOR will cover the land uses with synthetic response functions for each use
by sector. These functions can be replaced by equally synthetic but better defined ones
obtained in the other projects. For example, if the project on multifunctional agriculture
(SEAMLESS; see below) or the project on multifunctional Forestry and Wood Chains
(EFORWOOD; see below) defines land use response functions to policies through a thorough
analysis, these functions can/should be adapted to be included in the SENSOR framework.
In this way, SENSOR will provide a methodology and tools for the Sustainability Impact
Assessment of multifunctional land use in the European policy context, looking at policy
scenarios, land use trends, change of indicator values at regional (NUTS 2/3) level and
environmental, social and economic impacts in sensitive areas, as illustrated in the slide
reproduced below:
37

It is important to note that SENSOR takes a macro-perspective, using the macro-economic
model NEMESIS to analyse sectoral changes due to land use drivers - climate changes,
technological developments, global economic changes, demographic changes, land use
policies – and how they affect land use allocation and change the indicator values at regional
level. The analysis of indicators aims to determine cross-sectoral environmental, social and
economic impacts, and these impacts are finally to be evaluated using an externality
valuation and accounting framework.
The output of these scenario analysis will be presented on maps of 573 NUTS regions, which
are a combination of NUTS2 and NUTS3 regions for EU30 countries.
The SENSOR overall time schedule runs from 2005 up to 2009. During this period other
ancillary projects will supply specific inputs to the SENSOR evaluation of multifunctional land
uses. In particular, in the field of multifunctional agriculture, the SEAMLESS project
(http://www.seamless-ip.org/index.htm) focuses the analysis at a very detailed level of
response, which includes the consideration of optional technologies, and aggregates the
stakeholders’ behavioural responses up to the EU and international level. These responses
are later confronted with EU and international food demands to identify price responses and
eventually avoid generating perverse effects that will affect in turn the stakeholders
(producers and consumers). The results of this project should be incorporated in the more
generic tools that will be generated in SENSOR and vice-versa. Also linkages are expected
with EFORWOOD to take into consideration the competition for and complementarities of
land use by agriculture and forestry.
Indeed, in the field of multifunctional forestry/wood chains, the EFORWOOD project
(under negotiation) will deal with the forestry land uses (current and eventual land allocated
to forestry as a response to policies), including the management aspects, the industrial use
of the wood, considering the direct and indirect impacts on sustainable development, and the
demand for forestry and wood products. A strong linkage is expected with SENSOR and
SEAMLESS for the reasons mentioned above.
The above research activities are going to be supplemented since 2007 by two new research
tasks under the same area of sustainable land management:
Urban, peri-urban and rural land use relationships: the main purpose here is to
produce tools that will help in the analysis of the EU urbanising trend in order to identify
ways to improve the process and avoid the negative consequences. The spatial
consideration of the urban expansion into the peri-urban and how this affects the
requests of transportation, food supply chains, environmental and recreation services,
and the pressures that these issues will put on the rural land uses need to be understood
and represented in the tools. Generic tools for urban, peri-urban planning are expected,
based on case studies. The tools should provide the possibility to be easily adapted for
the analysis of any urban situation. The level of analysis will need to be at NUTS3 or
even more detailed. This new project should be complementary and consistent with the
SENSOR project in the sense that it will provide on one hand a thorough analysis of the
urban-peri urban-rural linkages, and on the other hand the results can be summarized
38

and compiled in policy response functions that will be able to be incorporated in SENSOR
models and tools.
Sustainable Development and Integrated Coastal Zone Management: This
particular case of land use needs to be analysed in detail because all the components are
exacerbated at this level and might become one of the principal societal issues in the
near future.
As mentioned above, another area of EU research with strong potential links to the ESPON
research concerns the development and application of Strategic Environmental
Assessment (SEA) methods, in particular for the evaluation of transport policies and
programmes. SEA methods are the subject of the EU Thematic Network BEACON - Build an
Environmental Assessment CONsensus on the Trans-european Transport Network.10 The
project is included in the FP5 Thematic Programme "Sustainable and Competitive Growth”,
with the objective of establishing an effective platform for the harmonisation of approaches,
methodologies, tools and data sets to be used in the Strategic Environmental Assessment
(SEA) of transport infrastructure of the Trans-european Network. The project aims at
building consensus not only on the general principles of SEA practice, but also on the
operational tools and procedures to be adopted for implementation at network, corridor and
project levels. Moreover, the enlargement of the European Union calls for swift and effective
actions to ensure consistency of infrastructure development and usage across the Continent.
BEACON paid therefore particular attention to the implications of a generalised SEA practice
for what concerns cross-border assessments.
There are other EU transport research tasks which potentially overlap with research
undertaken in ESPON. For instance an EU 6th Research Framework task, under Priority 8
Support to Policies, is now starting aiming to analyse “transport related sensitive areas”. The
task description is as follows:
“The objective is to research the development of sets of criteria characterising sensitive
areas from the point of the view of their sensitiveness to transport activities in the context of
EU transport policy. In this respect, sensitiveness should be assessed both regarding nature
protection and human health and well-being. At least mountainous and urban areas should
be covered and various types of traffic should be equally included in the analysis. The
geographical implication of applying sets of criteria for characterising transport related
sensitive areas will be explored. The research will provide for the testing of policy
instruments in order to assess possible implications of the concept from the EU transport
policy point of view. This implies trade-offs between development of transport activities and
their impact on economic development, and the objective to preserve sensitive areas will be
analysed. A spatially disaggregated valuation of the benefits and costs of transport (including
external costs) will be reviewed and used as a starting point to test market-based
instruments to mitigate transport impacts.”
This research task seems to fit well with the purpose of ESPON research concerning the
territorial impacts of transport activities.
10 www.transport-sea.net
39

Potential complementarities of ESPON with EU research on sustainable
development monitoring and impact assessment
The ESPON research can play an important role both in the monitoring and in the impact
assessment of the sustainable development strategies and policies in Europe.
In relation to the commitment of monitoring sustainable development, ESPON could provide
a framework to coordinate the implementation of Sustainable Development Indicators at
national and regional level, in order to assure the compatibility with the indicators selected
for monitoring the SD strategy at the EU level.
In this way ESPON may become a catalyser of the national and regional spatial strategies
and sector policies, ensuring a convergence towards the goals of the EU Sustainable
Development agenda. A coordination of any ESPON activity undertaken at this regard with
the mentioned EU Research Priority 8 task to assess the interlinkages between different
priorities of the Sustainable Development Strategy should be ensured.
In relation to the development of impact assessment methodologies and tools, it is obvious
that the efforts to provide a common and coordinated Territorial Impact Assessment (TIA)
approach covering the policy areas with important spatial impacts shall be continued. The
policy areas addressed so far by ESPON in this respect are:
Transport and TEN policy
Research and Development policy
Common Agriculture policy
Regional policy
Other sectors, such as the energy and environment sector, employment and social policies,
and even cohesion and urban environment policies at the city level should be added in these
efforts. Moreover, TIA application is to be considered including not only Community policies
but also the corresponding policies at the lower levels (national, regional) implemented by
the individual member states.
In any event, an obvious need is to avoid any duplication of efforts between the ESPON
research tasks refining the Territorial Impact Assessment and other relevant tools, such as
for instance the Macro-economic, Sectoral, Social and Territorial Model (MASST), and the EU
research framework tasks currently aiming to develop conceptually similar Sustainability
Impact Assessment tools, as for instance the SENSOR project (which includes a macro-
economic model with purposes similar to those of the MASST).
A more specific appraisal of possible interactions at the level of single ESPON products is
provided in the table below, where the column for “other” research areas possibly related to
ESPON could be completed with other relevant EU Research tasks which have not been
considered here.
40
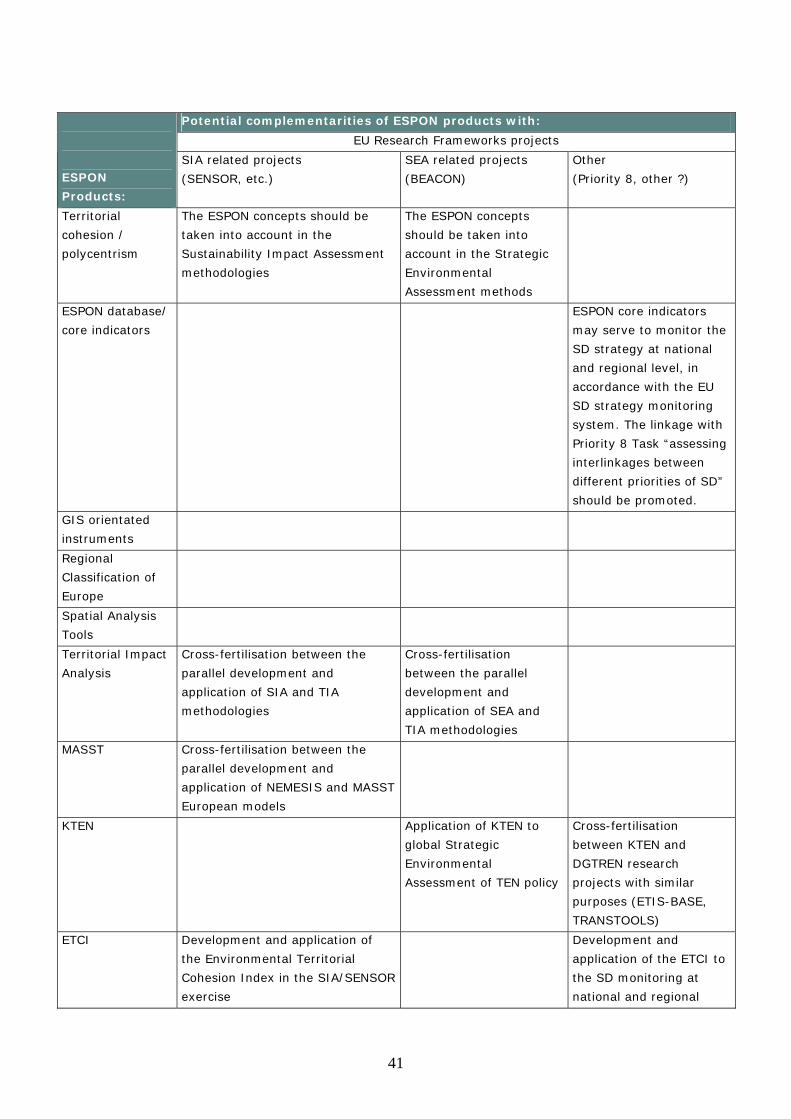
Potential complementarities of ESPON products with:
EU Research Frameworks projects
ESPON
Products:
SIA related projects
(SENSOR, etc.)
SEA related projects
(BEACON)
Other
(Priority 8, other ?)
Territorial
cohesion /
polycentrism
The ESPON concepts should be
taken into account in the
Sustainability Impact Assessment
methodologies
The ESPON concepts
should be taken into
account in the Strategic
Environmental
Assessment methods
ESPON database/
core indicators
ESPON core indicators
may serve to monitor the
SD strategy at national
and regional level, in
accordance with the EU
SD strategy monitoring
system. The linkage with
Priority 8 Task “assessing
interlinkages between
different priorities of SD”
should be promoted.
GIS orientated
instruments
Regional
Classification of
Europe
Spatial Analysis
Tools
Territorial Impact
Analysis
Cross-fertilisation between the
parallel development and
application of SIA and TIA
methodologies
Cross-fertilisation
between the parallel
development and
application of SEA and
TIA methodologies
MASST Cross-fertilisation between the
parallel development and
application of NEMESIS and MASST
European models
KTEN Application of KTEN to
global Strategic
Environmental
Assessment of TEN policy
Cross-fertilisation
between KTEN and
DGTREN research
projects with similar
purposes (ETIS-BASE,
TRANSTOOLS)
ETCI Development and application of
the Environmental Territorial
Cohesion Index in the SIA/SENSOR
exercise
Development and
application of the ETCI to
the SD monitoring at
national and regional
41

level. The linkage with
the mentioned Priority 9
task should be promoted.
Long-Term
database
Data Navigator
42
5. How to exploit ESPON at the regional scale: potential linkages
with INTERACT/INTERREG programme
About INTERREG and INTERACT
The Community Initiative INTERREG was created in order to promote cross-border,
transnational and interregional cooperation. The programme is financed by the European
Regional Development Fund (ERDF) and it is based on the creation of partnerships across
borders in order to encourage the harmonious and balanced development of the European
territory.
INTERREG III, which covers the programming period for 2000 to 2006, is made up of three
strands:
Strand A comprises cross-border cooperation between adjacent regions and supports
projects in the fields of socio-economic development, planning, culture, infrastructure
and related fields. Programmes are mostly set up on a bilateral basis.
Strand B promotes transnational cooperation between national, regional and local
authorities with the aim of achieving better integration within the European Union
through the formation of large groups of European regions.
Strand C promotes interregional cooperation and aims to improve the effectiveness of
regional development policies and instruments through large-scale information
exchange, cooperation projects and sharing of experience (networks).
Supplementing the three strands, and with a view to further encouraging the formation of
networks that promote the sharing of experiences and best practices, INTERREG III has also
provided for the following:
ESPON itself – the main subject of this study – has been developed according to Art. 53
of the INTERREG Guidelines under a programme financed jointly by the European Union
and the 15 Member States, as a network of cooperation between national spatial
planning institutes specialised in the observation and analysis of regional development
trends in Europe and beyond.
Cooperation with neighbouring countries, which had already begun through the TACIS,
PHARE and MEDA programmes in the previous programming period, and will continue to
be developed in INTERREG III.
It is intended that INTERREG III should overcome the obstacles to genuine cooperation that
stem from a lack of appropriate structures and procedures, experience, institutional capacity
or availability of specific know-how. With the consolidation of its transnational strand the
integration of the interregional activities formerly implemented under the innovative actions,
the geographic and thematic scope of INTERREG was widened considerably.
Now INTERACT is part of the Community Initiative INTERREG. The programme seeks to
build on the experience and lessons of INTERREG I and INTERREG II, and to increase the
effectiveness of INTERREG III during the current programming period. The core of the
INTERACT programme is to set up information and communication networks, to define
43

information frameworks and flows, to proactively disseminate information and to stimulate
exchange of experiences.
Indeed, the implementation of INTERREG III requires specific, transnational know-how which
is rarely available at national and regional level. This holds especially true for the
transnational and interregional programmes under strands B and C of INTERREG. Although a
series of new transnational structures and stakeholders is now emerging, resources devoted
to building up this specific know-how are still very limited: INTERACT is designed to meet
this demand and to develop and offer decentralised training interventions and workshops for
implementing bodies and project leaders aimed at enhancing their management skills.
Potential complementarities of ESPON with INTERACT/ INTERREG
Actually ESPON is an ancillary programme of the INTERREG initiative, aimed to develop
studies and data collection, observation and analysis of development trends in support of
territorial cooperation activities. In order to outline the future territorial dimension of the EU
Regional Policy, the task of the ESPON programme is to find valuable sources of information
and data, especially within the transnational geographical spaces of the INTERREG IIIB
programmes.
More recently, INTERACT was designed also to achieve, amongst others, the objective of
supplying a platform for the transfer of data and information between related initiatives like
ESPON, URBACT and the INTERREG programmes in both directions.
The cooperation of ESPON with the INTERREG programmes is therefore a straightforward
task under the INTERACT umbrella. In the first phase of the ESPON programme (ESPON I)
this cooperation has been substantiated in focusing five thematic studies on issues of special
concerns for the on going INTERREG projects. These studies were related to:
Transportation and communication networks
Spatial visions and scenarios
Environmental hazards and risk management
Polycentric development and urban-rural relations
Cross-border cooperation
Some interesting conclusions of these studies are:
The analysis of urban-rural relationships stresses that there is a need for urban-rural and
inter-rural cooperation to provide a decent level of services.
The analysis of cross-border cooperation highlight that on a whole the INTERREG
programmes addressed the main regional bottlenecks resulting from the border
situation, namely missing infrastructure links, weak economic structures due to limited
market and commuting areas as well as institutional and cultural barriers.
The analysis of the impact of transnational cooperation programmes – undertaken for
two INTERREG IIIB regions, namely ARCHIMED and Alpine space – shows that the
44

budget seems to be too low to reveal significant impacts on transnational level and not
only on the smaller regional level.
An assessment has been done of the question to what degree does INTERREG contribute
to the awareness of the idea of polycentric development in Europe, as advocated in the
European Spatial Development Perspective. This assessment illustrates the difficulties
INTERREG participants have in making truly operational concepts such as polycentric
development and in developing genuine trans-national applications. Due to the
difficulties of trans-nationality many projects seem finally to focus on the regional level
and exchanging experience regarding polycentric development etc. at the regional level.
A straightforward conclusion from the latter point is that translating ESPON results into
information assisting the understanding of polycentricity in trans-national and cross-
border situations, on the current state of spatial development and potentials for further
co-operation and development, may help a number of INTERREG projects to make use of
the ESPON findings for enriching their work. Furthermore, with view on future thematic
interregional co-operation programmes focusing on Lisbon and Gothenburg priorities,
ideas regarding projects utilising specific potentials for polycentric development or
territorial cohesion in various cooperation areas could be suggested, based on existing
ESPON studies.
In the same way as INTERREG projects can benefit from utilising ESPON results, also
ESPON may benefit from insights gathered in various INTERREG projects, e.g. in the
form of possible case studies for ESPON studies in the field of the conditions for creating
functional urban areas and successful networking among actors in related areas.
Finally, the INTERREG IIIB transnational areas have been designed as gathering
contiguous regions which are supposed to share similar specificities or concerns: regions
with metropolitan and/or old industry features in North-West Europe, regions with similar
mountain traits in the Alpine space, etc. However, recent ESPON research on cross-
border, transnational and global flows of population encourage to take into account not
only the morphological features but also the functional ones. In other terms, besides the
similarity patterns one must not ignore the networking side: flows between cities and
between regions. ESPON studies on polycentrism display the image of an increasing
integration of urban networks in Europe, with a border that is becoming more open at a
transnational scale – due to urban networking through air traffic, university cooperation
etc. – than at a local cross-border scale. All this advocates in favour of more
systematically taking into account the “space of flows” instead of the geographical
contiguity and morphological similarity in forming the transnational regions in which to
strengthen the territorial cooperation programmes.
Besides the current findings, future cooperation and complementarity of ESPON with
INTERACT may concern:
Targeted analytical deliveries (new studies).
Mutual learning at seminars, based on exchanges between ESPON researchers and
INTERREG projects holders
45

Stimulation of new project ideas coming from specific ESPON studies, both related to
future themes for European applied research and to the generation of new INTERREG
projects.
Systematic analysis of thematic interregional cooperation projects results and
dissemination for improved regional policy design.
46

6. How to exploit ESPON at the urban scale: potential linkages with
the Urban Audit and the URBACT programme
There are several reasons and opportunities to undertake ESPON research not only at
regional scale but also at the urban scale.
Indeed, EU policy interest for urban issues is growing, as demonstrated by two recent
documents of the European Commission:
The Commission Staff Working Paper “Cohesion Policies and cities: the urban
contribution to growth and jobs in the regions” published on 23 November 2005
The EC Communication on Thematic Strategy on the Urban Environment, issued on 11
January 2006.
In addition, there are two EC commission initiatives, the Urban Audit aiming to assess the
performance of a consistent sample of European cities against the Lisbon agenda goals and
the URBACT programme for networking and exchange of experience on urban regeneration
projects, which may benefit from a closer interaction with the ESPON programme.
In the following we will discuss in turn the recent developments of the EU urban policy and
the Urban Audit and URBACT programmes, the urban data needs, and the potential linkages
of ESPON with the other EU initiatives dealing with urban issues.
The EU urban policy and programmes
The European Council of March 2005 reaffirmed that “Europe must renew the basis of its
competitiveness, increase its growth potential and its productivity and strengthen social
cohesion, placing the main emphasis on knowledge, innovation and the optimisation of
human capital”.
In line with this objective, the European Commission has proposed that Cohesion policy
should strengthen this strategic approach for the next period, 2007-2013. Special attention
is paid in this context to specific needs of certain territories, such as urban and rural areas,
with a view to achieving balanced development and removing obstacles to growth. The
Cohesion Policy Guidelines11 also promote an integrated approach, delivering not only growth
and jobs, but also social and environmental goals.
During an informal meeting in Rotterdam in November 2004, Ministers responsible for urban
policy stressed the substantive contribution that Cohesion Policy can make to urban
development. Moreover the European Parliament, in its report on the urban dimension in the
context of enlargement12, welcomed the incorporation of sustainable urban development
into the mainline of Cohesion Policy and the European Structural and Cohesion Funds.
11 Cfr. Communication from the Commission, Cohesion Policy in Support of Growth and Jobs: Community Strategic Guidelines, 2007-2013, COM(2005)0299, Brussels, 05-07-2005. 12 EP(2005)0272 Report on the urban dimension in the context of enlargement
47

In light of the renewed Lisbon strategy for growth and jobs, programmes co-financed
through the cohesion policy should seek to target resources on the following three priorities:
improving the attractiveness of Member States, regions and cities by improving
accessibility, ensuring adequate quality and level of services, and preserving their
environmental potential;
encouraging innovation, entrepreneurship and the growth of the knowledge
economy by research and innovation capacities, including new information and
communication technologies; and
creating more and better jobs by attracting more people into employment or
entrepreneurial activity, improving adaptability of workers and enterprises and increasing
investment in human capital.
Cities and metropolitan areas are drivers of economic development. They are also key
locations for removing obstacles to growth and jobs – notably social exclusion and
environmental degradation. So they are privileged places where the challenges of Cohesion
Policy must be met. According to the three priorities above we need to make the European
cities:
Attractive places to work and invest
Innovative and entrepreneurial
Places where more and better jobs can be found
These are the mainstreams now of the EU Cohesion Policy at the urban level. The mentioned
Commission Staff Working Paper describes therefore in detail the issues at stake for making
cities attractive, innovative and entrepreneurial, and to solve the current paradox of cities
which concentrate many jobs, yet suffer also of high unemployment as compared to “non-
urban” or rural environments.
Another important EU urban policy is set out by the Thematic Strategy on the Urban
Environment. Indeed, cities are where many environmental problems are concentrated. The
environmental challenges facing cities have significant consequences for human health, the
quality of life of urban citizens and the economic performance of the cities themselves. The
6th Environment Action Programme (6th EAP) called therefore for the development of a
Thematic Strategy on the Urban Environment with the objective of “contributing to a
better quality of life through an integrated approach concentrating on urban areas” and to
contribute “to a high level of quality of life and social well-being for citizens providing an
environment where the level of pollution does not give rise to harmful effects on human
health and the environment and by encouraging sustainable urban development”.
Two EC funded urban programmes are relevant here:
The first is the Urban Audit initiative, organised by DGREGIO and EUROSTAT. This is a
unique instrument that brings together urban statistics for 258 large and mid-sized cities
across 27 European countries. It contains over 200 statistical indicators presenting
information on matters such as demography, society, the economy, the environment,
transport, the information society and leisure. It contains data for 1991, 1996 and 2001.
The analysis of Urban Audit will be further developed and lead to the publication of a full
State of European Cities Report, by the end of 2006. One main conclusion from the
Urban Audit analyses is that national and global trends are not felt the same way by
48

different cities. Some cities lead while others lag behind these trends. For example, some
cities maintain low unemployment despite a global downturn, while others fail to benefit
from a global upswing. As a result, the disparities between cities are far greater than the
differences between regions and countries. Analysing cities reveals therefore the biggest
challenges to cohesion in Europe.
The second is the URBACT initiative. This is a Community Initiative Programme for the
period 2002-2006, which facilitates the networking between cities from all Member
States around three larger objectives: i) develop transnational exchanges between
URBAN I and URBAN II cities, those cities having benefited from an Urban Pilot Project,
and all cities with more than 20.000 inhabitants in the New EU Member States; ii) draw
lessons from the analysis of their experiences, policies implemented locally and propose
innovative approaches to those difficult issues; iii) disseminate towards the actors in all
European cities the experiences in those different areas, the lessons learned and the
resulting proposals for problems solving. The efforts of URBACT concern therefore mainly
the cities and those areas which are characterised by a raised level of unemployment, of
delinquency and poverty and by the insufficient presence of public services.
The philosophy behind the EU intervention at the urban level, being through the Urban Audit
assessment and benchmarking of cities’ performance or by means of URBACT knowledge
dissemination and learning experience, is that the urban environment needs action at all
levels – EU, national and regional – because many solutions already exist in certain cities but
are not sufficiently disseminated or implemented. The EU can best support Member States
and local authorities by promoting Europe’s best practices, facilitating their widespread use
throughout Europe and encouraging effective networking and exchange of experiences
between cities. It can offer financial support for investments to meet environmental and
social priorities and support capacity building by making funds available for research and
training, be developing relevant guidance and encouraging the establishment of national
advisory points for cities.
Urban data needs
At the European level, while there are many indicators in use in different cities and towns,
they are in general only sporadically implemented, do not provide comparable data, or are
not suited to the multiple ambitions of the EU urban policy. Similarly, the data gathered in
the framework of sectoral actions, such as climate change or water, are rarely analysed
separately at the urban level, with the notable exception of urban air quality.
There are several actors involved, including the European Commission, EEA, EUROSTAT, JRC,
the Member States, national statistical institutes and the cities themselves. There is some
overlapping in what they are doing, for instance both EEA and EUROSTAT gather data on air
quality but in different contexts, and overall there is lack of consistent, coherent, complete
and comparable urban economic, social and environmental data.
This happens also where a special effort of harmonisation of urban data has been produced,
as for the 258 cities of the Urban Audit exercise. Actually this exercise has demonstrated
that the compilation of urban statistics on a European scale is not without its problems.
49

Based on the individual interpretation that any one country gives to the different indicators,
the collected data may sometimes be difficult to compare (e.g. there are significant
differences in the way urban crime rates are defined from one country to another).
The objective therefore is to establish a coordinated and sufficient flow of data on the urban
environment from towns and cities, encompassing the economic, social and environmental
dimensions, through the Member States to the European Institutions to provide European
level statistical data on the urban environment, economic and social situation. This would be
done making the best use of existing data flows, seeking to minimise the extra burden on
Member States and cities. It would involve identifying what is needed to inform policy
makers and the citizens, reviewing what is collected, identifying the gaps and inefficiencies,
and setting in place a strategy and a plan of actions to ensure that sufficient, comparable
and appropriate data is collected and circulates efficiently.
Some EU level actions aimed to realise this objective are worth of mention:
First and foremost, the INSPIRE initiative described in chapter 3 above. In the context
of this initiative to build up an infrastructure for spatial information in Europe, it is
suggested that a definition of “urban area” should be ready for 2007. Categories of urban
data that are already being addressed in the INSPIRE framework include transport
networks, buildings, land cover, biodiversity, soil, area management, environmental
monitoring facilities, water bodies and catchment.
Second, the EEA State of the Urban Environment report: the EEA will begin to split
more systematically the data it receives into urban and non-urban, and prepare a first
report in 2005 as part of its overall reporting activities. It is likely that this first report
will only cover a part of the range of issues that should in the longer term be covered,
which will focus on key urban environment issues: air, noise, waste, water, energy,
climate change, nature, biodiversity, soil.13 Currently the EEA State of the Environment
reports include a lot of environmental indicators, but little is analysed specifically on an
urban basis.
Third, the Working group on urban environment data needs: this multi-stakeholder
group, involving all key actors (JRC, EEA, EUROSTAT, DGENV, cities and other
stakeholders) will clarify what data is needed to monitor and guide the Thematic
Strategy on Urban Environment as well as to assist national and local decision makers,
review the existing urban environment data collection, and identify the gaps. It will
develop a short and longer term strategy to establish a flow of sufficient and harmonised
urban environment data (both vertical and horizontal, through the various administrative
bodies), and propose an action plan to put into practice.14
Fourth, the European Common Indicators (ECI) project: at the local level, the
Commission has provided an “off the shelf” set of urban environment indicators that can
be used by towns and cities on a voluntary basis (currently are used by 148
13 the information on the state of play of this EEA report needs to be updated. 14 the information on the state of play of this Working group needs to be updated.
50

municipalities). The ECI15 were developed by the EU Expert Group on the Urban
Environment and are particularly useful for local authorities just starting to tackle
environmental issues for their urban area as a whole. They cover citizen satisfaction,
contribution to climate change, mobility and passenger transportation, availability of
local public open areas and services, quality of local ambient air, journeys by children to
and from school, sustainable management of the local authority and local business,
noise, sustainable land use, products promoting sustainability, ecological footprint.
Potential complementarities of ESPON with other EU urban programmes
Provided that the various initiatives in place to improve the availability and harmonisation of
urban data will continue successfully, it is clear the increasing demand for ESPON studies at
the urban level.
Indeed, the Urban Audit analysis undertaken so far already stressed interesting correlations
between the cities’ performance and other aspects investigated by ESPON:
At the global European scale, there is a clear linkage between city accessibility and
economic performance. The multimodal accessibility map produced by ESPON clearly
shows a polycentric pattern with more distant capitals and large cities providing fairly
good accessibility. Comparing multimodal and air accessibility of cities to the city GDP
per capita, as it has been done in the Urban Audit study, shows that both are extremely
closely linked, which underlines the growing importance of air connections for European
cities.
At the local metropolitan scale, cities are centres of employment, leisure, culture and
retail, which attract many people and a substantial amount of traffic. Commuting to work
generates a large share of this traffic. The Urban Audit shows that, on average, one out
of every three jobs in cities goes to someone living outside of the city, and the trend
towards urban sprawl is increasing. In twenty cities, over half of the jobs go to
commuters. Urban sprawl is usually accompanied by a large increase in car ownership
and a corresponding drop in the use of public transport, especially in the new Member
States, with harmful effects on congestion and the urban environment. The Urban Audit,
however, shows that a high level of car ownership does not have to correspond with a
high share of car trips: cities in the Nordic countries have been very successful in
encouraging different forms of transport and discouraging people from driving into the
city centre. The lesson to be drawn is that when public transport offers an attractive
travel option and there are incentives not to drive, many urban residents are prepared to
leave their cars at home.
There is clearly the need to learn further and more scientifically validated lessons about the
evolution of the European cities and the global and local factors which influence their
perspectives of success or failure. This is the area where a new stream of ESPON urban
studies might focus, in close coordination with the Urban Audit and other EU Research
15 www.sustainable-cities.org/indicators/index.htm
51

activities on urban matters which are to be envisaged in the forthcoming 7th Framework
Programme.
Strengthening the link between ESPON and URBACT will finally help to disseminate the
results of these ESPON urban studies to a wider arena of city policy makers and
stakeholders.
52