Embed Size (px)
Citation preview
Version 29/02/2012
The ESPON 2013 Programme
TIGER Territorial Impact of Globalization for Europe and its Regions
Applied Research Project 2013/1/1
Draft Final Scientific Report
Working paper 6
"The London Case Study" Kathy Pain, Sandra Vinciguerra
EUROPEAN UNION Part-financed by the European Regional Development Fund INVESTING IN YOUR FUTURE
ESPON TIGER Draft Final scientific Report February 2012
1
Introduction
Cities have come to be recognised as key drivers of the world economy in the twenty first century. They have become the dominant locations for human habitation, economic and social reproduction worldwide and the number of very large cities in the world - described variously in the literature as mega-cities, mega-city-regions, etc. - is increasing, especially in emerging economies, including China (Pain, 2011a). In the context of these developments, this case study is intended to provide insights into the contribution of urban agglomeration to Europe’s sustainable growth in a changing and competitive global economic context.
Knowledge-intensive business services and their ICT-facilitated global networks have been recognised as having a critical role in boosting Europe’s global economic competitiveness since the inception of the Lisbon agenda in the year 2000 (EC, 2000). Major cities London and Paris have been identified as having a special role as European global gateways which are highly integrated in such networks (Pain, 2011b). However, the role of agglomeration and the specialized functions associated with their city-based business services clusters have largely been overlooked in EU spatial development initiatives.
Instead, dominant policy priorities for investment projects have focused on the supposed link between sustainable development, territorial cohesion and spatial polycentricity at EU-wide, regional and metropolitan scales in the 1999 European Spatial Development Perspective (ESDP). The North West Europe Spatial Vision (2000) which has provided the context for urban spatial planning in the European economic ‘core’ during the past decade, has thus specifically discouraged further growth of major agglomerations and has aimed to rebalance the spatial development of the EU territory (Pain, 2008b).
By the year 2009, the Barca Report indicated a softening of the EU stance on the concept of polycentricity, suggesting that it should be recognized as a descriptive, as opposed to a normative/prescriptive, policy device. Further, CEC (2010) has suggested there is now a tacit acceptance on the part of the European Commission that agglomeration is important for economic growth (a focus of the ESPON, CAEE: The Case for Agglomeration Economies in Europe project),
“There are gains from such concentration in terms of the increasing returns from agglomeration and from the clustering of particular activities in specific locations … This is reflected in the high level of GDP per head, productivity, employment and research and innovation activity relative to the national average in capital cities and in most other densely populated conurbations.” (p. 5).
Yet, in contradiction, the report also states that
“… to ensure a balanced and sustainable territorial development of the EU as whole, strengthening its economic competitiveness and capacity for growth while respecting the need to preserve its natural assets and ensuring social cohesion. This implies avoiding excessive concentrations of growth and facilitating the access to the increasing returns of agglomeration in all territories.” (p. 6.)
Ongoing confusion about the relationship between the arrangement of built space, the economic functions of cities of different sizes and their roles in cross-border business
ESPON TIGER Draft Final scientific Report February 2012
2
networks, illustrates the importance of engaging with this question in the present case study to inform a longstanding policy conundrum.
According to Flyvjberg (2011, p.301), case studies focus on an “individual unit,” referred to by Stake as a “functioning specific” or “bounded system.” (2008, pp. 119–120), thus boundaries must be set for the individual case unit. However, as the ESPON FOCI project has demonstrated, Europe’s global context is increasingly important to its internal development capacities because “city development is strongly embedded in processes happening at other scales” (Ludlow 2011). Hence this case study will examine the multi-scale spaces, functional and nodal capacities of London in advanced business services networks and city real estate investment flows important for the effective pursuit of Europe 2020 sustainable growth objectives.
1.0 The City of London business cluster The Loughborough and Manchester University ESRC/Corporation of London-funded 2001-2002, City of London and Research into Business Clusters study investigated the cluster ecology, sustainability and global agglomeration economies of the dense financial and business services cluster in the City of London, (Taylor et al., 2003).
The morphology of present-day clustering in the ‘Square Mile’ (the City’s longstanding financial cluster) reflects its historical development process. The locations of sectors, firms and institutions continue to reflect their needs for proximity to and face-to-face contact with linked service suppliers and clients and, increasingly, for accessibility to specialized staff in terms of their proximity to clustered ‘City’ transport nodes.
Access to labour has become a key international clustering driver, helping to sustain City centralities and agglomeration. The development of the more recent Canary Wharf site has illustrated the challenges posed for firms by relocation across even a relatively short distance (Taylor et al. 2003).
In 2008, the City cluster consisted of 154 advanced financial and linked business (producer) services firms (APS) headquartered all over the world (table 1 and working paper 3). The importance of access to transnational specialized labour, innovation, depth of infrastructure including ICT, finance capital and specialized service suppliers have become at least, if not more, important locational factors than proximity to customers. Table 1: APS present in London Source: Authors, data supplied by the Globalization & World Cities (GaWC) Research Network: http://www.lboro.ac.uk/gawc/ APS sectors Present in London HQ Total firms Financial Services 61 8 75 Accountancy 25 16 25 Advertising 22 2 25 Law 24 8 25 Management consultancy 22 0 25 Total firms present 154 34 175
ESPON TIGER Draft Final scientific Report February 2012
3
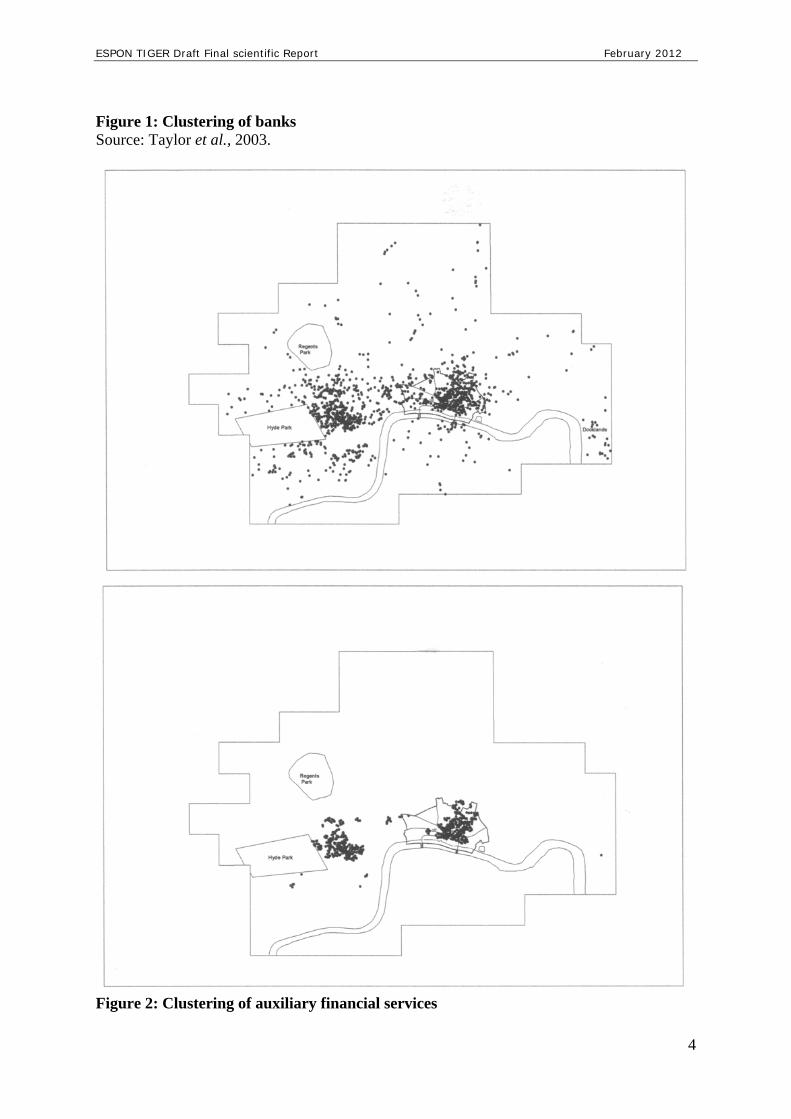
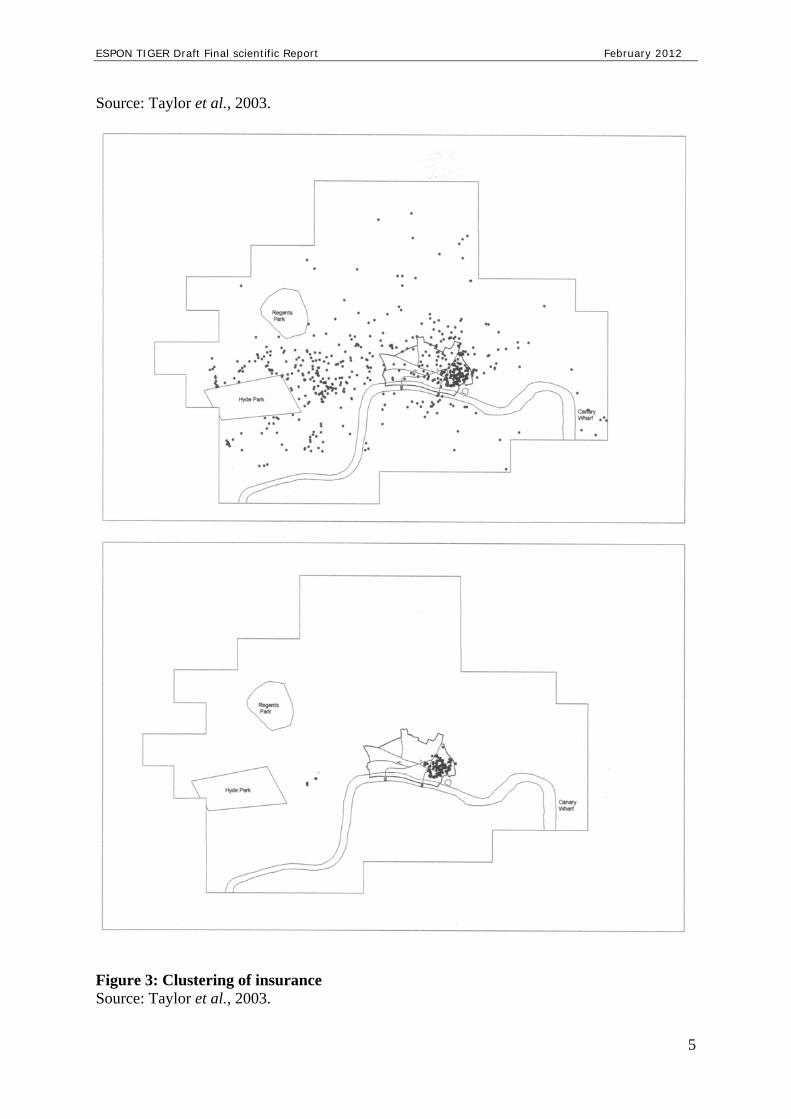
Figures 1-3 show the cluster morphology mapped for banks, auxiliary financial services and insurance which have especially synergistic functional relationships. The bottom map in each figure shows the firms within the total survey population for each sector which are densely clustered. The maps illustrate the strong cluster dynamic of banks, auxiliary financial services and insurance (a second cluster of international banks in London’s ‘West End’ engages with the foreign private client banking market).
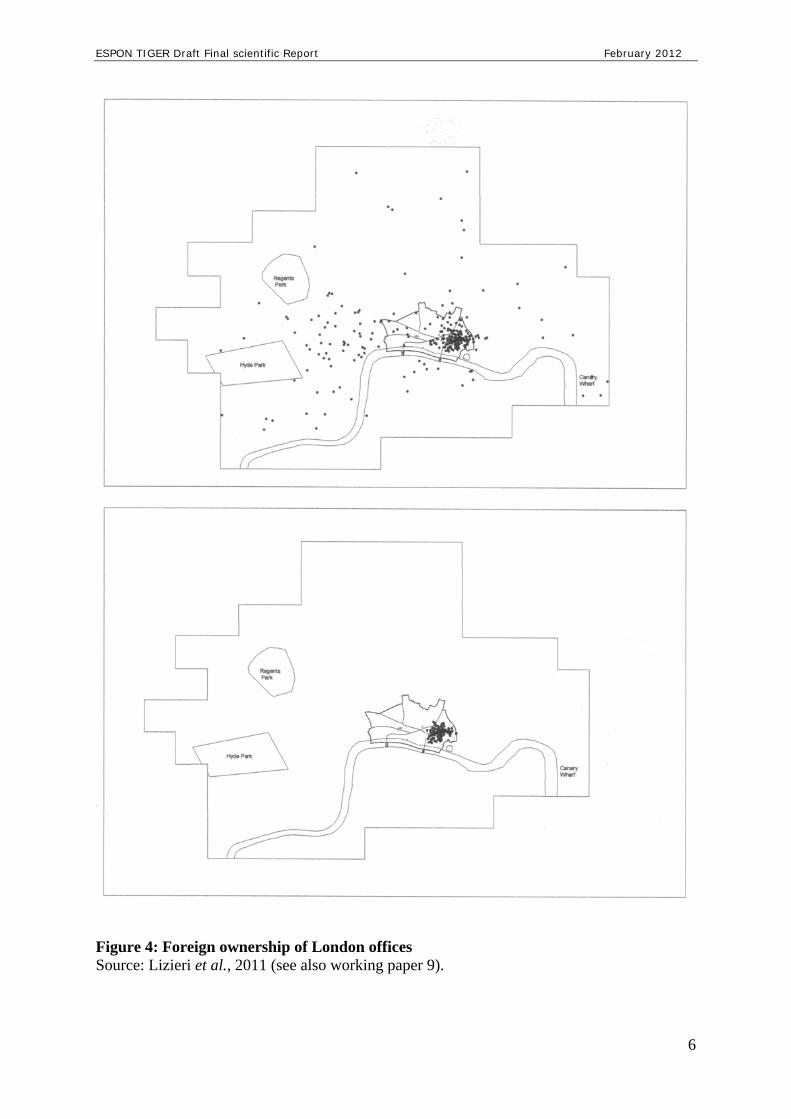
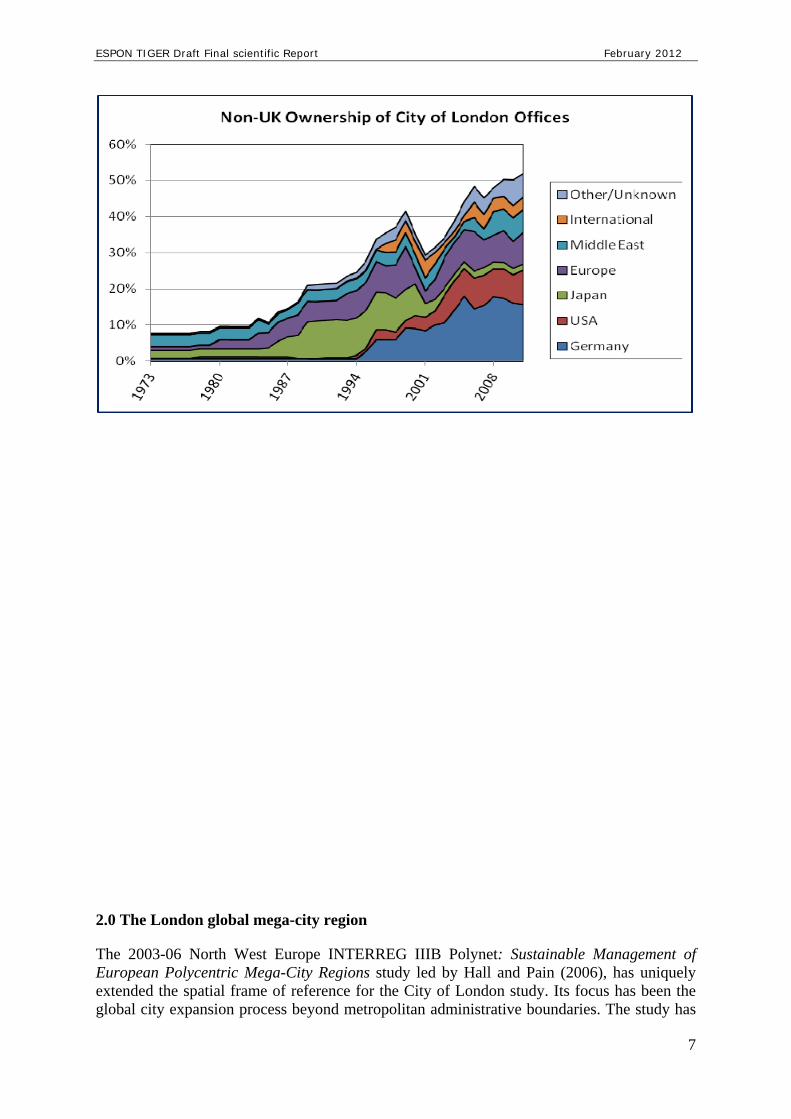
The international and multi-sector constitution of the City of London cluster means that transnational interactions and transactions are taking place within the space of the City which is a node for flows of labour, information, business, capital etc (Pain, 2011c). This means that this dense space has developed a critical mass of commercial office real estate for international corporate businesses and an international investment asset (Lizieri, 2009).
Figure 4 shows the dramatic growth in foreign ownership of London property space between the turn of the century and the year 2008 (see also Lizieri and Kutsch, 2006). London’s population has grown by approximately one million people during the past two decades however it has a small resident population and specialized institutions focusing on the sustainability of its global role (Taylor et al. 2003).
Global capital invested in its compact spaces, flows into London, from London, and within London, giving it a nodal role and a vital need for local and international accessibility for through-flows of city workforce and customers extending far beyond its administrative borders.
ESPON TIGER Draft Final scientific Report February 2012
4
Figure 1: Clustering of banks Source: Taylor et al., 2003.
Figure 2: Clustering of auxiliary financial services
ESPON TIGER Draft Final scientific Report February 2012
5
Source: Taylor et al., 2003.
Figure 3: Clustering of insurance Source: Taylor et al., 2003.
ESPON TIGER Draft Final scientific Report February 2012
6
Figure 4: Foreign ownership of London offices Source: Lizieri et al., 2011 (see also working paper 9).
ESPON TIGER Draft Final scientific Report February 2012
7
2.0 The London global mega-city region
The 2003-06 North West Europe INTERREG IIIB Polynet: Sustainable Management of European Polycentric Mega-City Regions study led by Hall and Pain (2006), has uniquely extended the spatial frame of reference for the City of London study. Its focus has been the global city expansion process beyond metropolitan administrative boundaries. The study has
ESPON TIGER Draft Final scientific Report February 2012
8
been unique in examining the concept of polycentricity in the context of the functional development of North West European mega-city regions.
The research has been informed by network analysis of the operational structures and practices of APS firms at mega-city region, national, European and global scales. In addition, the spaces of flows in associated email, commuting and business travel were studied in order to inform understanding of the relationship between regional polycentricity and economic competitiveness.
The results showed that functional polycentricity, critical for the vibrancy of Europe in a global economic context, does not follow from development patterns based upon the normative policy ideal of morphological polycentricity.
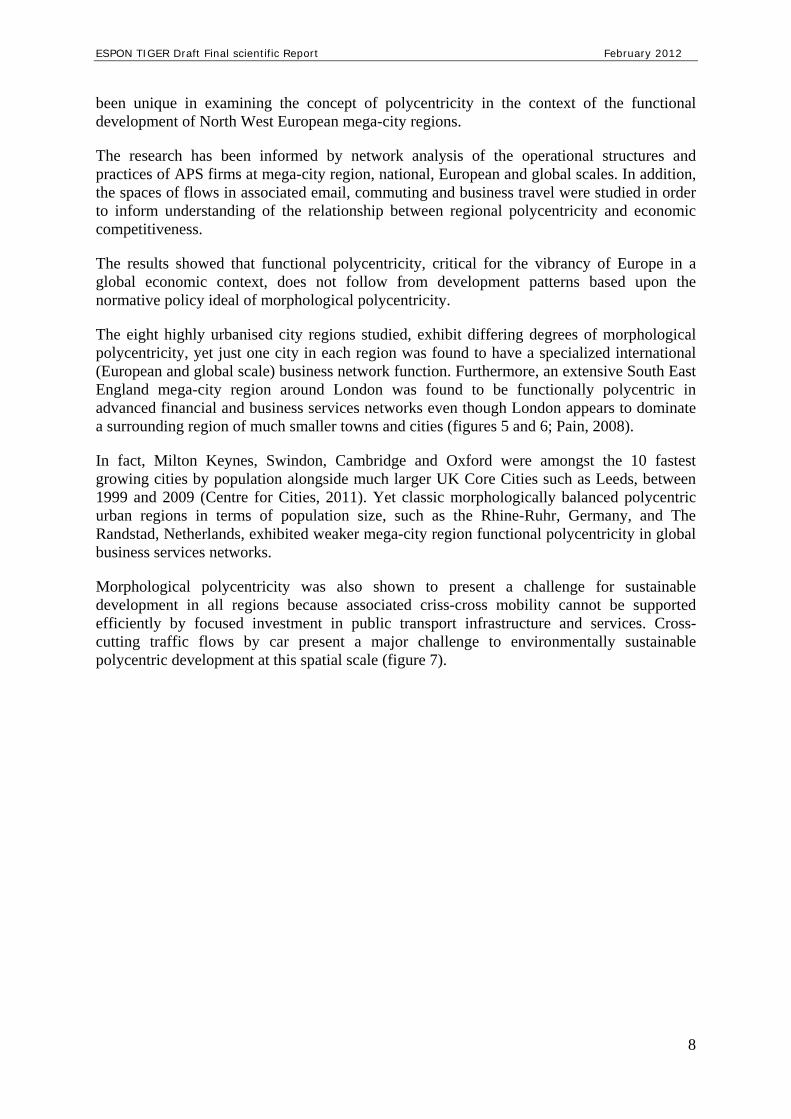
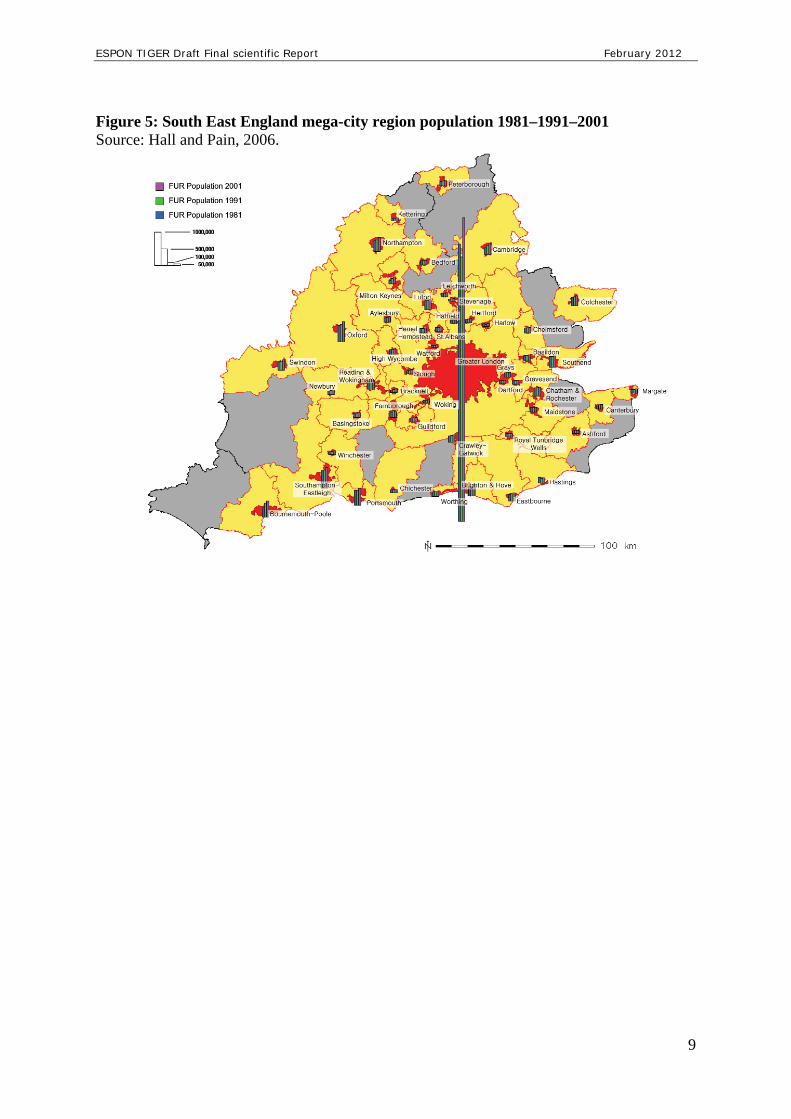
The eight highly urbanised city regions studied, exhibit differing degrees of morphological polycentricity, yet just one city in each region was found to have a specialized international (European and global scale) business network function. Furthermore, an extensive South East England mega-city region around London was found to be functionally polycentric in advanced financial and business services networks even though London appears to dominate a surrounding region of much smaller towns and cities (figures 5 and 6; Pain, 2008).
In fact, Milton Keynes, Swindon, Cambridge and Oxford were amongst the 10 fastest growing cities by population alongside much larger UK Core Cities such as Leeds, between 1999 and 2009 (Centre for Cities, 2011). Yet classic morphologically balanced polycentric urban regions in terms of population size, such as the Rhine-Ruhr, Germany, and The Randstad, Netherlands, exhibited weaker mega-city region functional polycentricity in global business services networks.
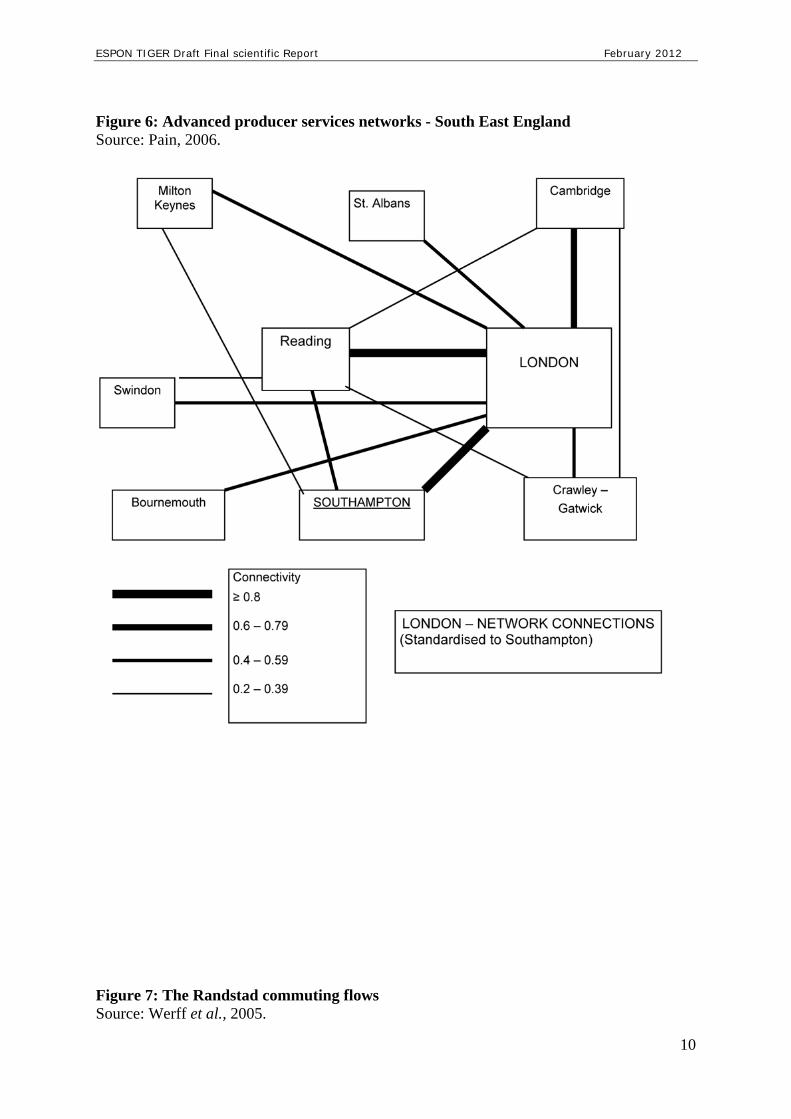
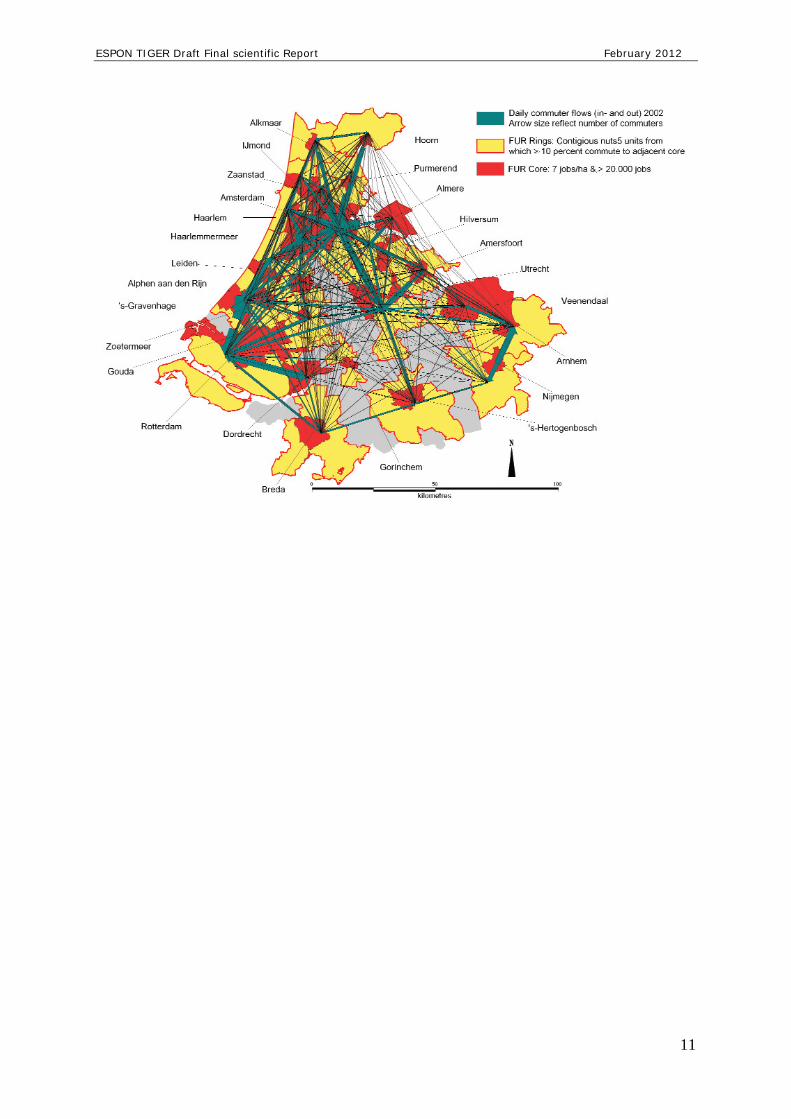
Morphological polycentricity was also shown to present a challenge for sustainable development in all regions because associated criss-cross mobility cannot be supported efficiently by focused investment in public transport infrastructure and services. Cross-cutting traffic flows by car present a major challenge to environmentally sustainable polycentric development at this spatial scale (figure 7).
ESPON TIGER Draft Final scientific Report February 2012
9
Figure 5: South East England mega-city region population 1981–1991–2001 Source: Hall and Pain, 2006.
ESPON TIGER Draft Final scientific Report February 2012
10
Figure 6: Advanced producer services networks - South East England Source: Pain, 2006.
Figure 7: The Randstad commuting flows Source: Werff et al., 2005.
ESPON TIGER Draft Final scientific Report February 2012
11
ESPON TIGER Draft Final scientific Report February 2012
12
3.0 London’s UK spatial relations
Two studies have examined relations between the South East mega-city region and other UK
cities and regions.
The 2008 Project to Map and Measure the Absorptive Capacity of UK cities and Regions
funded by the National Endowment for Science, Technology and the Arts, studied the
external relations and knowledge network connectivity of UK statutory regions associated
with APS, academic/scientific, internet and air flows (Mahroum et al., 2008). The aim was to
assess the capacity of regions to innovate locally and thus to promote UK-wide development
in the knowledge-based global economy.
The data showed the dominance of the London metropolitan region’s external network
connectivity. The findings indicated that the ability of regions to participate actively in global
networks is associated with high density concentrations of specialized knowledge-intensive
firms, research universities and high volume flow infrastructures - built form, ICT and
transportation:
“density – of population, advanced business services, research universities and
infrastructures – associated with metropolitan agglomeration, would seem to be a key
determinant of regional ‘knowledge access’ capacity.” (Mahroum et al., 2008, p.64).
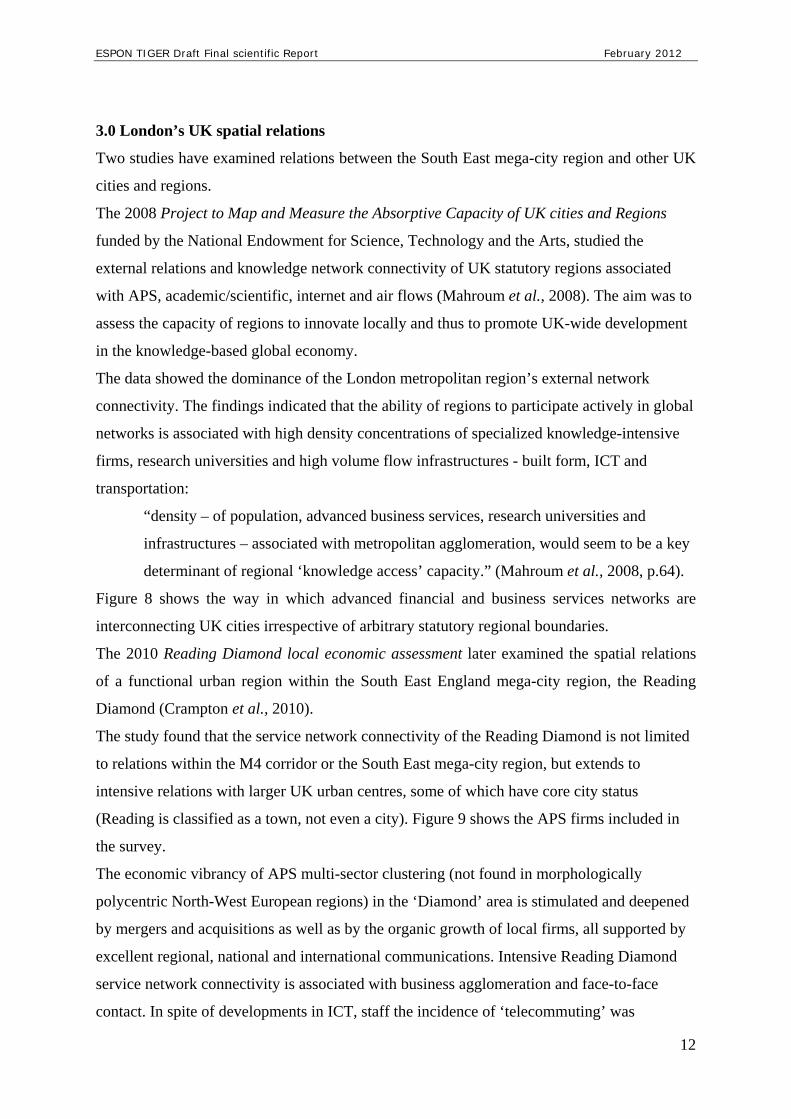
Figure 8 shows the way in which advanced financial and business services networks are
interconnecting UK cities irrespective of arbitrary statutory regional boundaries.
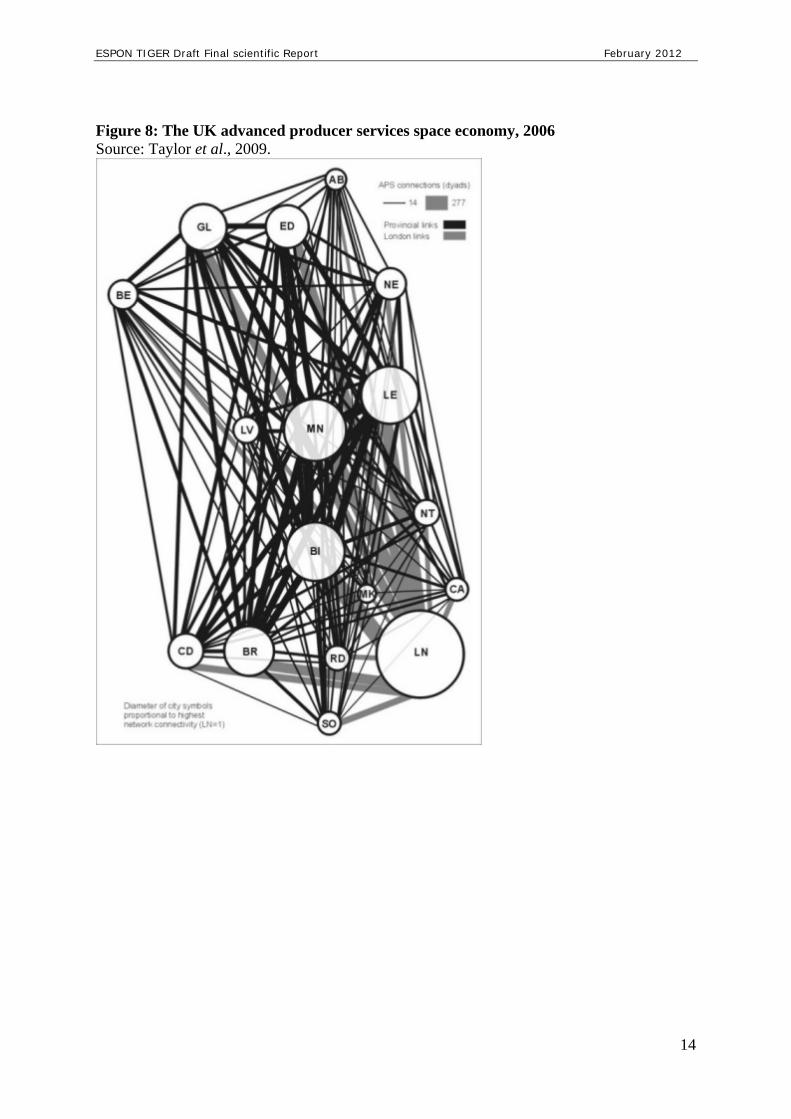
The 2010 Reading Diamond local economic assessment later examined the spatial relations
of a functional urban region within the South East England mega-city region, the Reading
Diamond (Crampton et al., 2010).
The study found that the service network connectivity of the Reading Diamond is not limited
to relations within the M4 corridor or the South East mega-city region, but extends to
intensive relations with larger UK urban centres, some of which have core city status
(Reading is classified as a town, not even a city). Figure 9 shows the APS firms included in
the survey.
The economic vibrancy of APS multi-sector clustering (not found in morphologically
polycentric North-West European regions) in the ‘Diamond’ area is stimulated and deepened
by mergers and acquisitions as well as by the organic growth of local firms, all supported by
excellent regional, national and international communications. Intensive Reading Diamond
service network connectivity is associated with business agglomeration and face-to-face
contact. In spite of developments in ICT, staff the incidence of ‘telecommuting’ was

ESPON TIGER Draft Final scientific Report February 2012
13
therefore insignificant albeit virtual communications were used when possible for distance
business communications.
ESPON TIGER Draft Final scientific Report February 2012
14
Figure 8: The UK advanced producer services space economy, 2006 Source: Taylor et al., 2009.
ESPON TIGER Draft Final scientific Report February 2012
15
Figure 9: Map showing the number of APS firms surveyed by postcode Source: Crampton et al., 2006.
ESPON TIGER Draft Final scientific Report February 2012
16
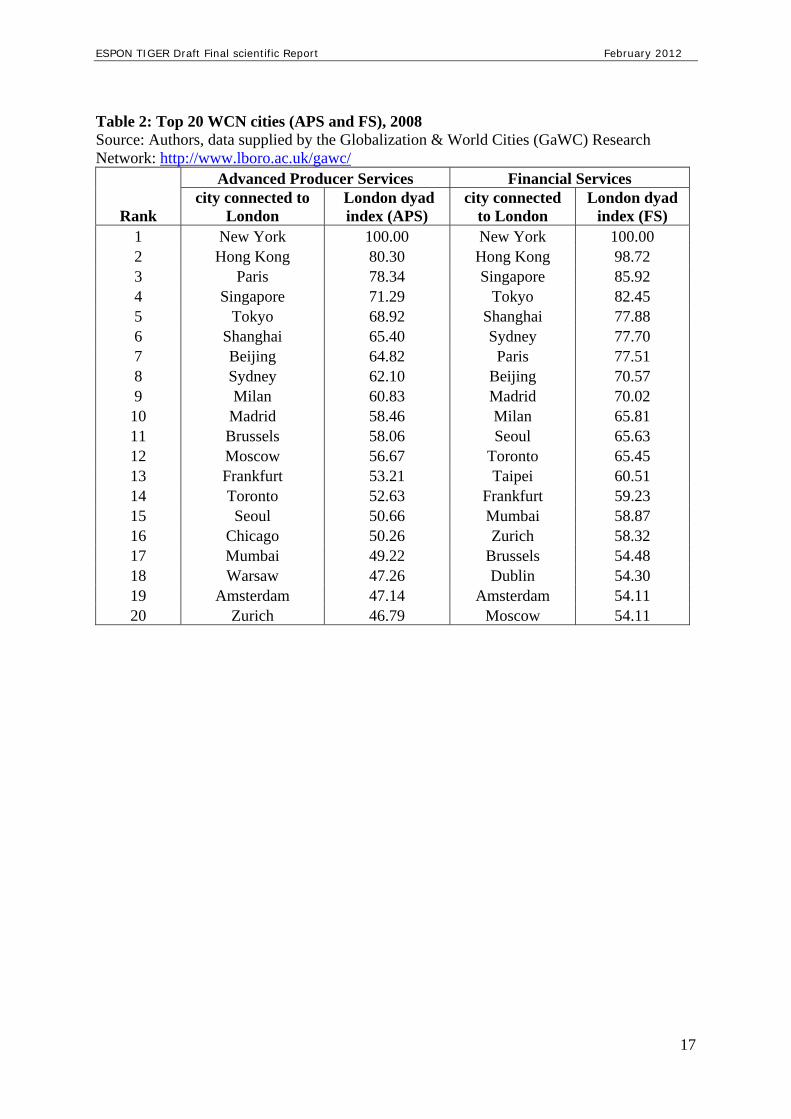
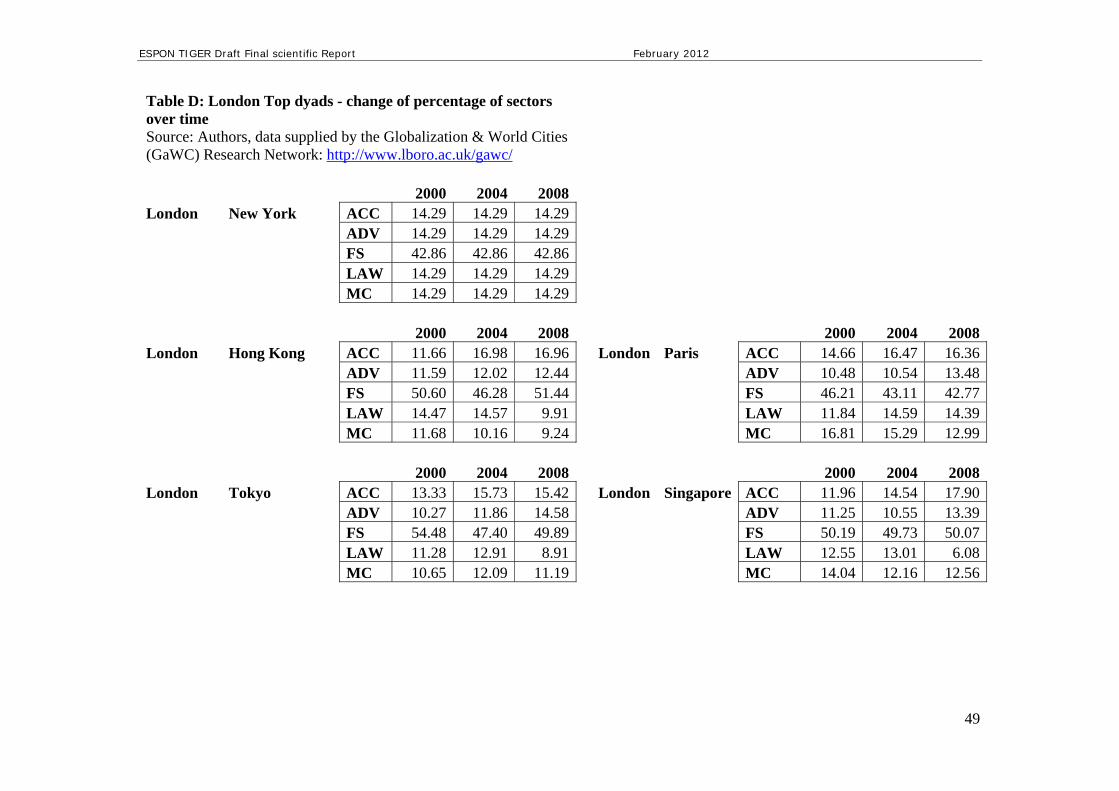
4.0 London’s international spatial relations The left-hand columns of table 2 list the top twenty cities across the world that were all well connected to London through APS organizational networks in the year 2008. The right-hand columns show the cities that were well connected to London just by the important global city APS cluster sub-group, banking/financial services (FS). The London Dyad Index (LDI – see working paper 3 on dyadic city relations) for APS and for FS is calculated as a proportion of the strongest link among all direct connections to London; the index scale ranges from 0 to 100, where 100 indicates the most city connected to London among all cities connected to London. London’s strongest links for all APS, and for FS also, are with New York (ranked first). Pacific Asia cities are then especially well linked to London, especially by FS networks: Hong Kong (APS 2: FS 2); Singapore (APS rank 4; FS rank 3), Tokyo (APS rank 5; FS rank 4), Shanghai (APS rank 6; FS rank 5), Beijing (APS 7; FS rank 8) and Sydney (APS rank 8; FS rank 6). The only non-Pacific Asia region London dyad in the top eight ranking is Paris (APS 3; FS 7). It is interesting to note that the dyad indices show that London is more connected to all other cities listed by FS than by APS in general. Table D in the appendix, shows the percentage division of the different sectors per year for the five London top dyads. It must be stated however that a high percentage for financial services is to be expected since it was decided to keep representation high while proceeding with the data standardization method (see working paper 3 – “Europe in the world cities network” for further details). The London-New York dyad has the biggest value in every year so that it is always the value referred to. London-New York percentages are the values we can use to compare all the other dyads. For example, the London-Hong Kong dyad, has a strong financial services component, which decreases slightly in 2004 and gets stronger in 2008, accountancy and advertising gain more and more over time, while there are thinning law and management consultancy components. This means that connectivity between London and Hong Kong has changed over time, concentrating principally on financial services and intensifying connectivities through accountancy and advertising.
ESPON TIGER Draft Final scientific Report February 2012
17
Table 2: Top 20 WCN cities (APS and FS), 2008 Source: Authors, data supplied by the Globalization & World Cities (GaWC) Research Network: http://www.lboro.ac.uk/gawc/
Advanced Producer Services Financial Services
Rank city connected to
London London dyad index (APS)
city connected to London
London dyad index (FS)
1 New York 100.00 New York 100.00 2 Hong Kong 80.30 Hong Kong 98.72 3 Paris 78.34 Singapore 85.92 4 Singapore 71.29 Tokyo 82.45 5 Tokyo 68.92 Shanghai 77.88 6 Shanghai 65.40 Sydney 77.70 7 Beijing 64.82 Paris 77.51 8 Sydney 62.10 Beijing 70.57 9 Milan 60.83 Madrid 70.02 10 Madrid 58.46 Milan 65.81 11 Brussels 58.06 Seoul 65.63 12 Moscow 56.67 Toronto 65.45 13 Frankfurt 53.21 Taipei 60.51 14 Toronto 52.63 Frankfurt 59.23 15 Seoul 50.66 Mumbai 58.87 16 Chicago 50.26 Zurich 58.32 17 Mumbai 49.22 Brussels 54.48 18 Warsaw 47.26 Dublin 54.30 19 Amsterdam 47.14 Amsterdam 54.11 20 Zurich 46.79 Moscow 54.11
ESPON TIGER Draft Final scientific Report February 2012
18
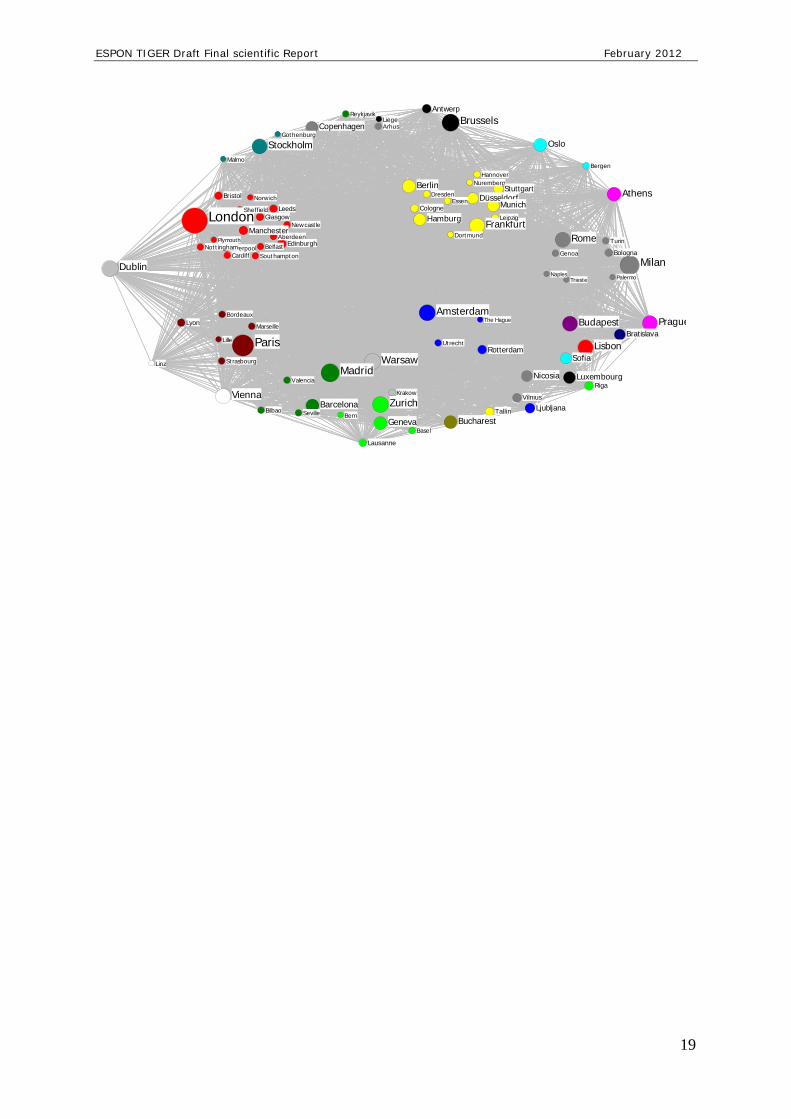
5.0 London’s European spatial relations After Paris, London’s top EU APS links are with Milan (9th), Madrid (10th), Brussels (11th), Frankfurt (13th), Warsaw (18th), Amsterdam (19th) and Zurich (20th). The lower ranking of most EU city links for FS surprisingly include London-Frankfurt (14th). The graph represented in figure 10 shows a 2008 APS ‘Contemporary Mappa Mundi’ (Vinciguerra et al., 2010) for European cities produced by applying a spring embedding algorithm to the data. The position of cities indicates their network relations and centrality within Europe when geographical distance is not considered. Euclidean distances between the city nodes are proportional to the graph distances and cities belonging to the same EU country. This representation shows the global connectivity of Member States (denoted by different colours for nodes) of the EU territory with the most central states in the network located in the core of the system. The size of both the nodes and their city names are proportional to the Gross Connectivity index (GNI) calculated for the European network; the bigger the node, the more central the node is in the system. UK and German APS network centralities are notable. It also interesting that functional polycentricity at a sub-national territorial scale can be detected for some states based on the quantitative data. Figure 10: London’s APS network position in Europe, 2008 Source: Authors, data supplied by the Globalization & World Cities (GaWC) Research Network: http://www.lboro.ac.uk/gawc/
ESPON TIGER Draft Final scientific Report February 2012
19
Aberdeen
Amsterdam
Antwerp
Arhus
Athens
Barcelona
Basel
Belfast
Bergen
Berlin
BernBilbao
Bologna
Bordeaux
Bratislava
Bristol
Brussels
Bucharest
Budapest
Cardiff
Cologne
Copenhagen
Dortmund
Dresden
Dublin
Düsseldorf
Edinburgh
Essen
Frankfurt
Geneva
Genoa
Glasgow
Gothenburg
Hamburg
Hannover
Krakow
Lausanne
LeedsLeipzig
Liege
Lille
Linz
Lisbon
Liverpool
Ljubljana
London
Luxembourg
Lyon
Madrid
Malmo
Manchester
Marseille
Milan
Munich
Naples
Newcastle
Nicosia
Norwich
Nottingham
Nuremberg
Oslo
Palermo
Paris
Plymouth
Prague
Reykjavik
Riga
Rome
Rotterdam
Seville
Sheffield
Sofia
Southampton
Stockholm
Strasbourg
Stuttgart
Tallin
The Hague
Trieste
Turin
Utrecht
Valencia
Vienna Vilnius
Warsaw
Zurich
ESPON TIGER Draft Final scientific Report February 2012
20
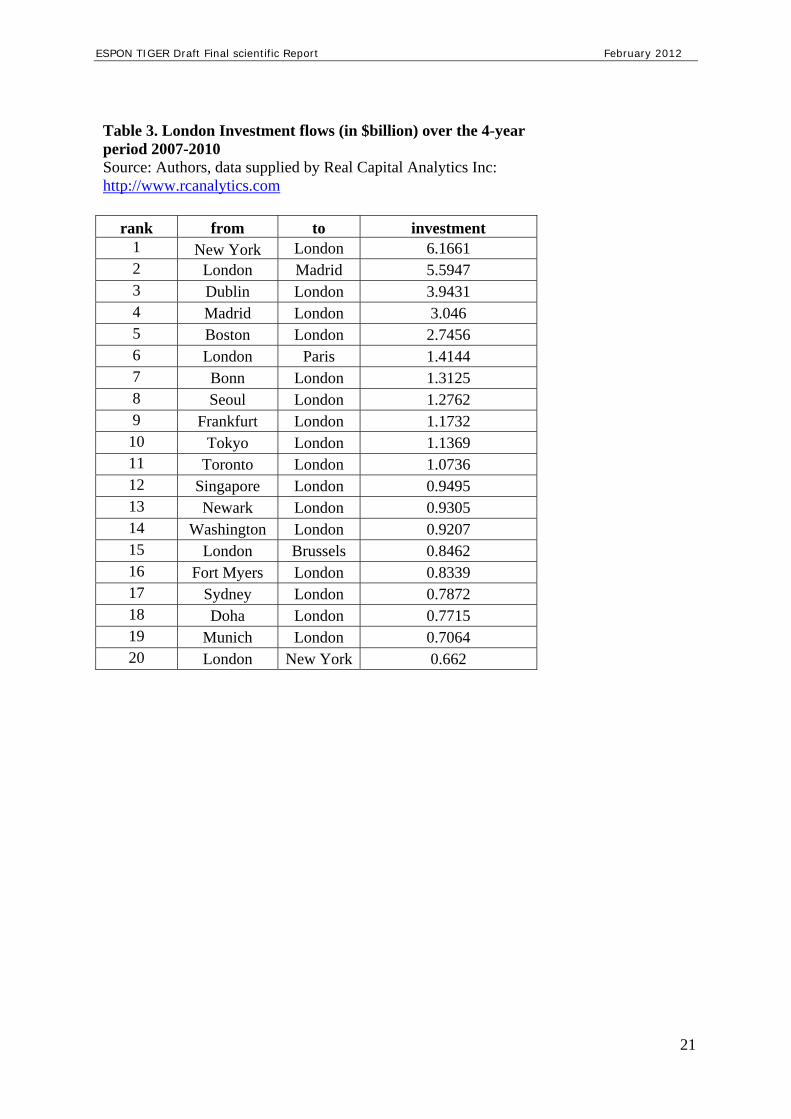
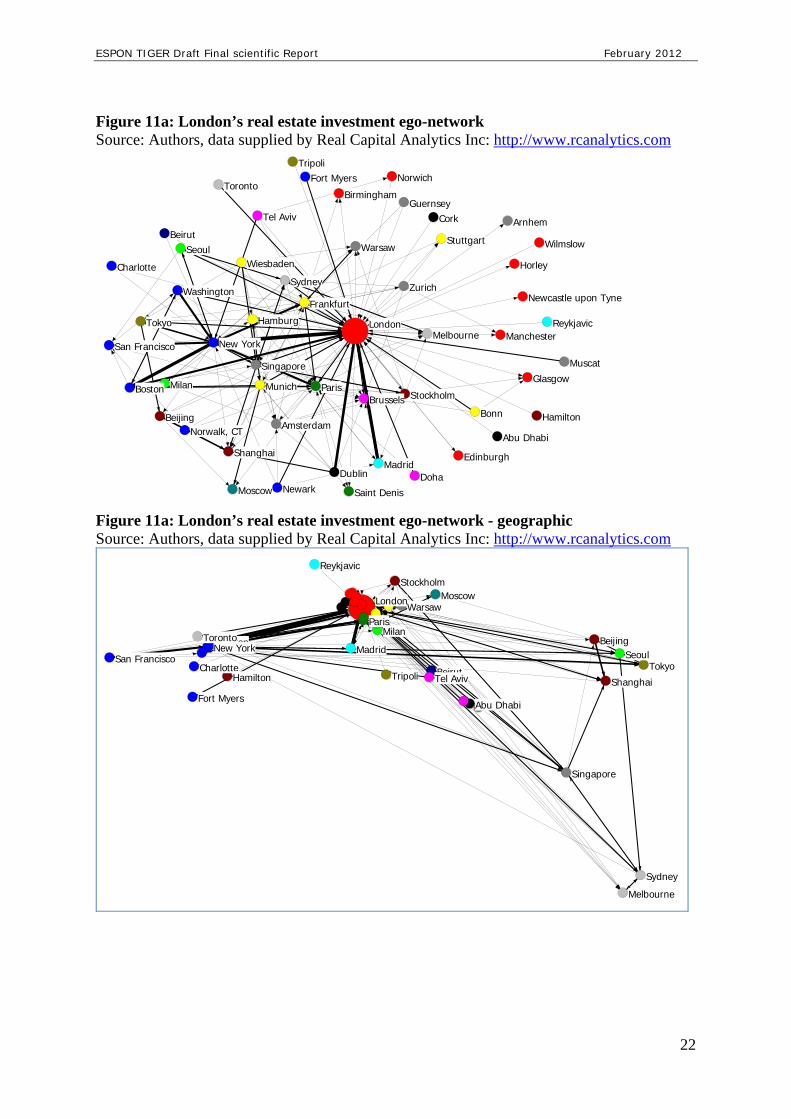
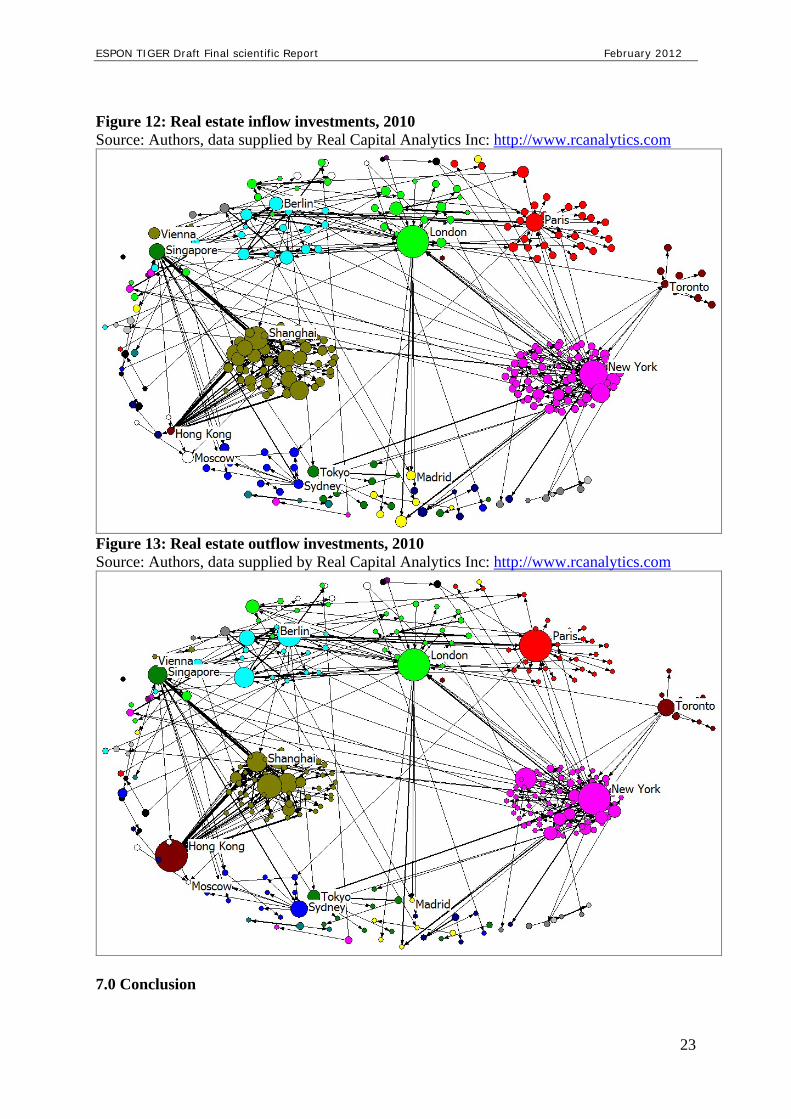
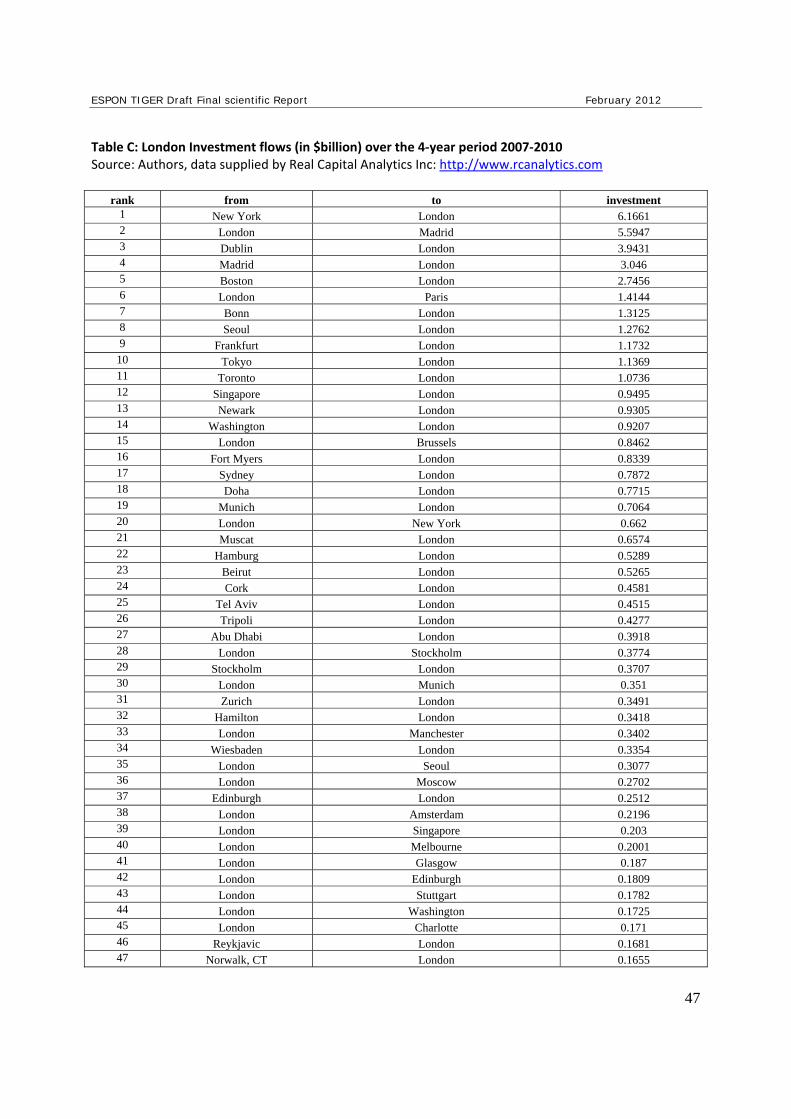
6.0 London’s position in multi-scale real estate investment flows Real estate data provided by RCA (Real Capital Analytics, Inc.) include information on the top 1000 commercial real estate deals for each of the years 2007, 2008, 2009 and 2010. Table 3 shows the ranking of office investment deals involving London, sorted by deals involving flows of financial capital from and to London. Interestingly, only four top nodes providing flows into London are European cities, whereas six out of the top ten nodes benefiting from flows out of London are European cities (for the complete table see appendix, table C). The biggest top ten real estate investment deals involving flows into London are with New York, Dublin, Madrid, Boston, Bonn, Seoul, Frankfurt, Tokyo, Toronto and Singapore. The biggest top ten real estate investment deals involving flows out of London: Madrid, Paris, Brussels, New York, Stockholm, Munich, Manchester, Seoul, Moscow, Amsterdam. In the graphs shown in figures 11a and 11b, London is represented as an ‘Ego-network’ where only cities that are directly connected to London through real estate investment in- and outflows are shown with data aggregated for the years 2007-10. The size of flows is proportional to the size of investments going to and from London and the investments among the cities which are connected to London (the latter are not shown in table 3). Figures 12 and 13 show that London and other UK cities have larger investment inflows than outflows whereas the reverse is the case for New York and many secondary US cities.
ESPON TIGER Draft Final scientific Report February 2012
21
Table 3. London Investment flows (in $billion) over the 4-year period 2007-2010 Source: Authors, data supplied by Real Capital Analytics Inc: http://www.rcanalytics.com
rank from to investment 1 New York London 6.1661 2 London Madrid 5.5947 3 Dublin London 3.9431 4 Madrid London 3.046 5 Boston London 2.7456 6 London Paris 1.4144 7 Bonn London 1.3125 8 Seoul London 1.2762 9 Frankfurt London 1.1732 10 Tokyo London 1.1369 11 Toronto London 1.0736 12 Singapore London 0.9495 13 Newark London 0.9305 14 Washington London 0.9207 15 London Brussels 0.8462 16 Fort Myers London 0.8339 17 Sydney London 0.7872 18 Doha London 0.7715 19 Munich London 0.7064 20 London New York 0.662
ESPON TIGER Draft Final scientific Report February 2012
22
Figure 11a: London’s real estate investment ego-network Source: Authors, data supplied by Real Capital Analytics Inc: http://www.rcanalytics.com
Abu DhabiAmsterdam
Arnhem
Beijing
Beirut
Birmingham
Bonn
BostonBrussels
Charlotte
Cork
DohaDublin
Edinburgh
Fort Myers
Frankfurt
Glasgow
Guernsey
Hamburg
Hamilton
Horley
London
Madrid
ManchesterMelbourne
Milan
Moscow
Munich
Muscat
New York
Newark
Newcastle upon Tyne
Norwalk, CT
Norwich
Paris
Reykjavic
Saint Denis
San Francisco
Seoul
Shanghai
Singapore
Stockholm
Stuttgart
Sydney
Tel Aviv
Tokyo
Toronto
Tripoli
Warsaw
Washington
Wiesbaden
Wilmslow
Zurich
Figure 11a: London’s real estate investment ego-network - geographic Source: Authors, data supplied by Real Capital Analytics Inc: http://www.rcanalytics.com
Abu Dhabi
Beijing
Beirut
Boston
Charlotte
Fort Myers
Hamilton
London
Madrid
Melbourne
Milan
Moscow
New York
Paris
Reykjavic
San Francisco Seoul
Shanghai
Singapore
Stockholm
Sydney
Tel AvivTokyo
Toronto
Tripoli
Warsaw
ESPON TIGER Draft Final scientific Report February 2012
23
Figure 12: Real estate inflow investments, 2010 Source: Authors, data supplied by Real Capital Analytics Inc: http://www.rcanalytics.com
Figure 13: Real estate outflow investments, 2010 Source: Authors, data supplied by Real Capital Analytics Inc: http://www.rcanalytics.com
7.0 Conclusion
ESPON TIGER Draft Final scientific Report February 2012
24
London can be described as functionally polycentric in advanced financial and business
services networks at multiple geographical scales. The concentration of foreign firms using
the City of London cluster also generates the multi-scale commercial real estate investment
flows noted out from and into as well as within the City. We have focused on the analysis of
office investments in this investigation but investments in other sectors, such as retail and
housing, are also linked to London’s role and function as an international centre.
The functional polycentricity of London clearly reflects its transnational agglomeration
economies but these also generate its nodal capacities which link the City cluster to many
other cities in the UK, Europe and worldwide, in positive ways. Within the UK, taxes levied
from the financial services sector (clustered in the City of London) – employment, VAT,
corporation tax etc. – represents an estimated 11.2% of all tax receipts in spite of the effects
of the financial crisis and the sector was still the largest corporation tax payer in 2010 (PWC,
2011).
Agglomeration of specialized international functions thus stimulates complementary external
relations between cities. A recent report shows that firms located in just eight major European
international financial centres (IFCs) - Amsterdam, Dublin, Frankfurt, London, Luxembourg,
Madrid, Milan and Paris – provide the bulk of financial services provision in the EU (Europe
Economics, 2011). The researchers conclude that
“Such concentration in financial centres provides better access to capital, talent and
markets, and brings a specialisation in the provision of services to global business …
this benefit then spills over into higher growth and boosts tax revenues. Location in
these centres contributes to economic efficiency and boosts overall EU economic
performance.” (p. 6).
In addition,
“… spatial concentration allows complementary specialisation in other business
sectors and other geographic regions … This is a general benefit brought about by
competition within the single market.” (p.6).
These conclusions are in alignment with the results of the 2000-2001 Comparing London and
Frankfurt as World Cities - A Relational Study of Urban Change qualitative interview study
funded by the Anglo-German Foundation for the Study of Industrial Society, which found
that European Monetary Union and the creation of the single market were supporting
synergistic relations between London and Frankfurt generated by APS global strategies and
business practices (Beaverstock et al., 2001; Pain, 2008b).
ESPON TIGER Draft Final scientific Report February 2012
25
European policy must respect the functional specialization between cities which is not
possible without agglomeration but which is necessary to the global market operations of
APS firms in contemporary economic globalization.
List of references Barca, F. (2009) An Agenda for a Reformed Cohesion Policy: The Barca Report, European
Commission, Brussels.
Beaverstock, J.V., Hoyler, M., Pain, K. Taylor, P.J. (2001) Comparing London and Frankfurt
as world cities: A relational study of urban change, Anglo-German Foundation for the Study
of Industrial Society Report, London, [WWW] Available from:
http://www.agf.org.uk/cms/upload/pdfs/R/2001_R1290_e_london-frankfurt.pdf (electronic).
CEC (Commission of the European Communities) (2010) Territorial cohesion: what scales
of policy intervention? Follow up of Green Paper on Territorial Cohesion 2nd TCUM session.
Seminar, Brussels, 12 March. [WWW] Available from:
http://ec.europa.eu/regional_policy/conferences/territorial/12032010/i
Centre for Cities (2011) Cities Outlook, Centre for Cities, London.
Crampton, G., Francis-Brophy, E., Meen, G., Nygaard, C., Pain, K. and Wadeson, N. (2010)
The Reading Diamond Local Economic Assessment, University of Reading/Reading Diamond
Forum, Reading.
EC European Council (2000) Presidency Conclusions – Lisbon European Council, 23 and 24
March. http://ue.eu.int/ueDocs/cms_Data/docs/pressData/en-/ec/00100-r1.en0.htm
ESPON (2010) Smart, Sustainable and Inclusive Territories: First ESPON 2013 Synthesis
Report, European Commission, Brussels.
Europe Economics (2011) The Value of Europe’s International Financial Centres to the EU
Economy, City of London Economic Development Unit, London.
Flyvjberg, B. (2011) ‘Case Study’, The Sage Handbook of Qualitative Research, Sage,
Thousand Oaks, CA, pp. 301- 336.
Hague, C. (2011) ESPON 2013 Research and UK Development Strategies, 14th February,
London South Bank University, London.
Lizieri, C.M. (2009) Towers of Capital – office markets & international financial services,
Wiley John & Sons, London.
Lizieri, C. and Kutsch, N. (2006) Who owns the city 2006: Office ownership in the city of London’, University of Reading and Development Securities, Reading, UK.
ESPON TIGER Draft Final scientific Report February 2012
26
Lizieri, C.M., Reinert, J., Baum, A. (2011) Who owns the city 2011: Office ownership in the city of London’, Real Estate Finance Group, University of Cambridge and Development Securities, Cambridge, UK. Ludlow, D. (2011) ESPON 2013 Research and UK Development Strategies, 14th February,
London South Bank University, London.
Mahroum, S., Huggins, R., Clayton, N., Pain, K., Taylor, P.J. (2008) Innovation by Adoption:
Measuring and Mapping Absorptive Capacity in UK Nations and Regions, National
Endowment for Science, Technology and the Arts, [WWW] Available from:
http://www.nesta.org.uk/assets/Uploads/pdf/Research-
Report/innovation_by_adoption_report_NESTA.pdf (electronic).
NWMA (Spatial Vision Group) (2000) Spatial Vision for the North Western Metropolitan
Area (NWMA), University of the West of England, Bristol.
Pain, K. (2008a) Spaces of practice in advanced business services: rethinking London-
Frankfurt relations, Environment and Planning D: Society and Space, 26(2), 2008, 264-279.
Pain, K. (2008b) Examining Core-Periphery Relationships in a Global Mega-City Region -
The Case of London and South East England, Regional Studies, 42(8), 1161-1172.
Pain, K. (2011a) Spatial transformations of cities – Global City Region? Mega City Region?
International Handbook of Globalization and World Cities, Taylor, P.J., Derudder, B.,
Hoyler, M., Witlox, F., Edward Elgar, London, in press.
Pain, K. (2011b) ‘New Worlds’ for ‘Old’? Twenty-First-Century Century Gateways and
Corridors: Reflections on a European spatial perspective” International Journal of Urban &
Regional Research, 35(6), 1154-74.
Pain, K. (2011c) Form follows Finance, Modus, March, 16-21.
PWC (2011) The Total Tax Contribution of UK Financial Services, City of London
Economic Development Unit, London.
Stake, R.E. (2008) Qualitative case studies. In N. K. Denzin & Y. S. Lincoln (Eds.),
Strategies of qualitative inquiry (3rd ed., pp. 119–150), Sage, Thousand Oaks, CA.
Taylor, P.J., Beaverstock, J.V., Cook, G., Pandit, N., Pain, K. (2003) Financial Services
Clustering and its significance for London, Corporation of London, London, [WWW]
Available from: http://www.cityoflondon.gov.uk/NR/rdonlyres/1C75B813-796E-45F8-
83A2-7FD5D28D4F56/0/BC_RS_clustering_0302_XR.pdf (electronic).
Taylor, P.J., Evans, D., Hoyler, M., Derudder, B., Pain, K. (2009) “The UK Space Economy
as Practised by Advanced Producer Service Firms: Identifying two distinctive polycentric
city-regional processes in contemporary Britain”, International Journal of Urban & Regional
Research, 33(3), 700-718.

ESPON TIGER Draft Final scientific Report February 2012
27
Vinciguerra S., Taylor, P. J., Hoyler, M., Pain, K., (2010) "Contemporary Mappa Mundi:
American exceptionalism in the world city network", Environment and Planning A, 42(6),
1271 – 1272.
Werff, M. van der., Lambregts, B., Kapoen, L., Kloosterman, R. (2005) POLYNET action
1.1: commuting and the definition of functional urban regions: The Randstad, Institute of
Community Studies/The Young Foundation and Polynet Partners, London.

ESPON TIGER Draft Final scientific Report February 2012
28
ESPON TIGER Draft Final scientific Report February 2012
29
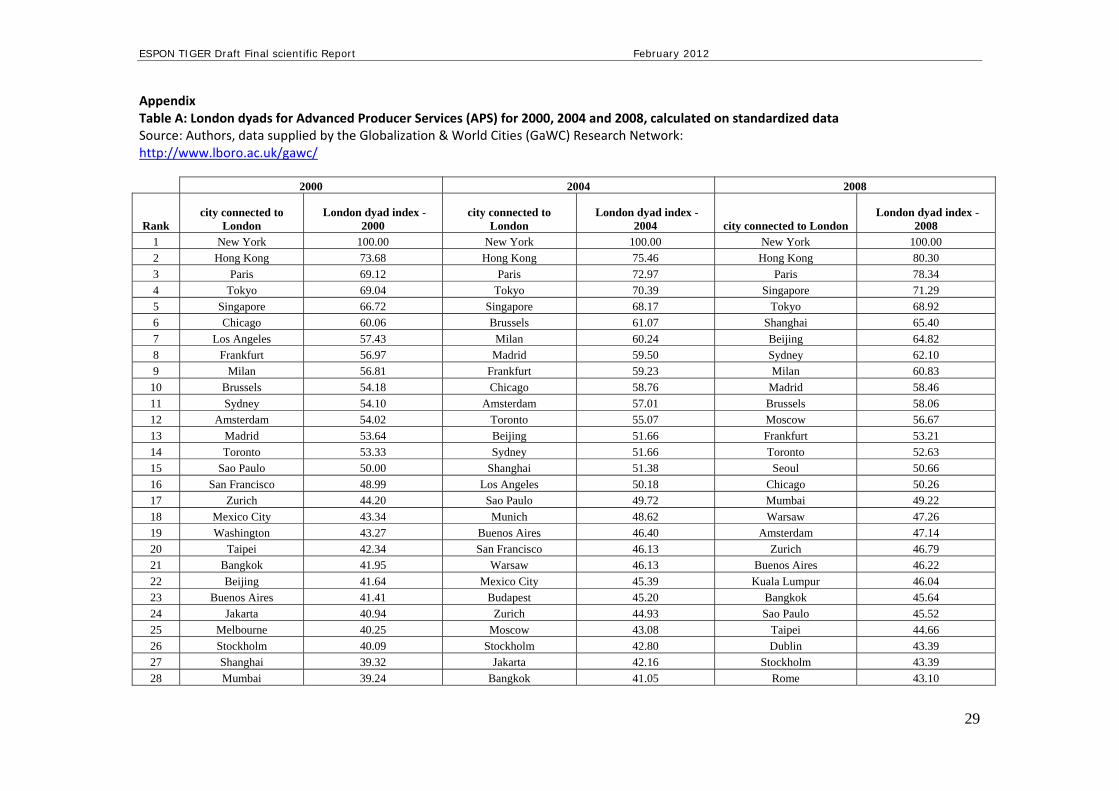
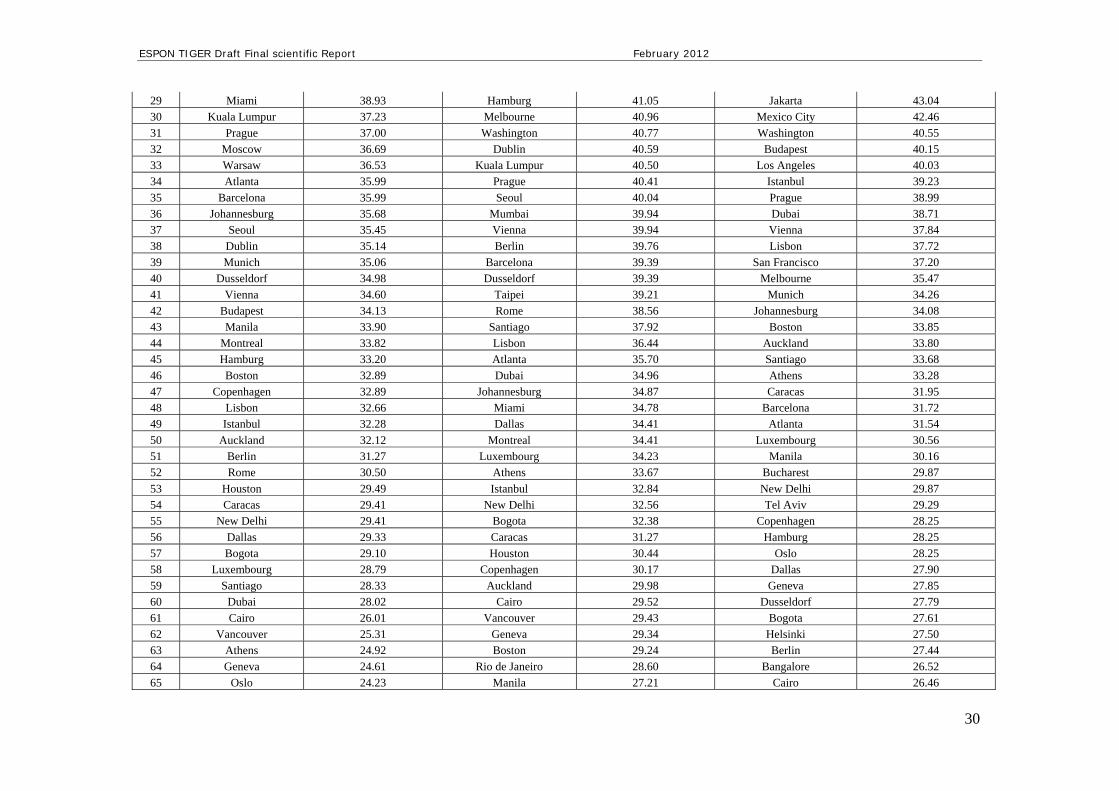
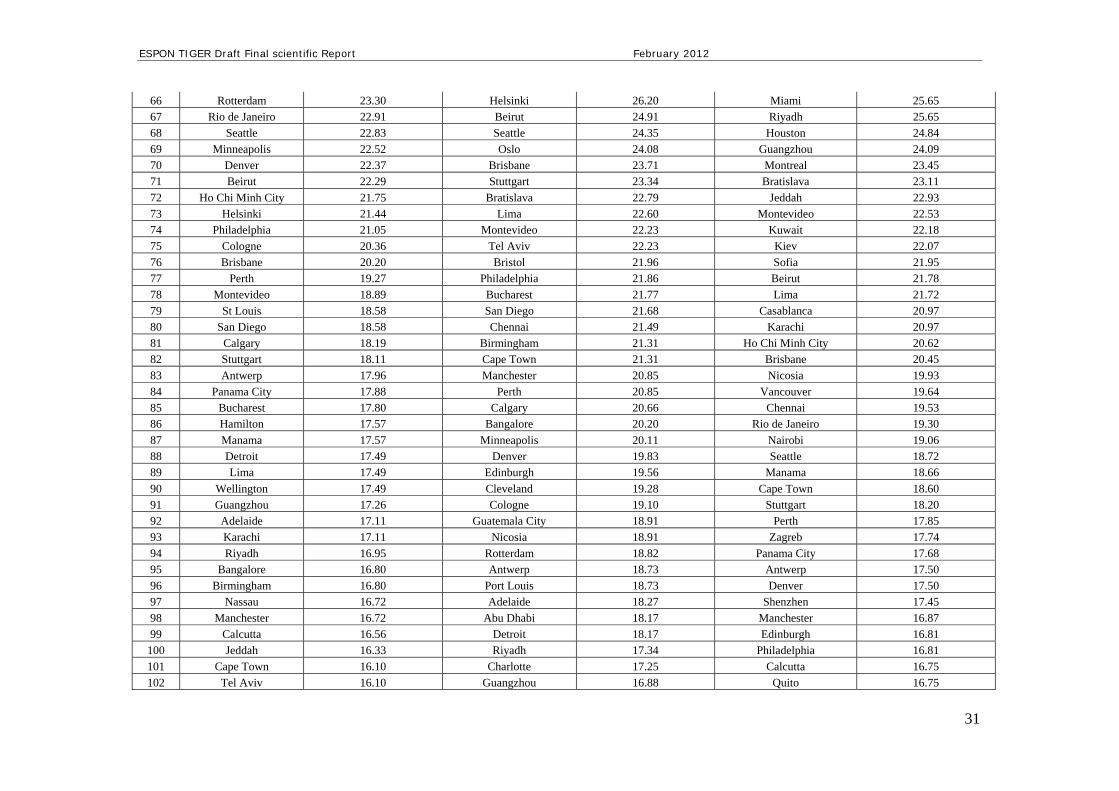
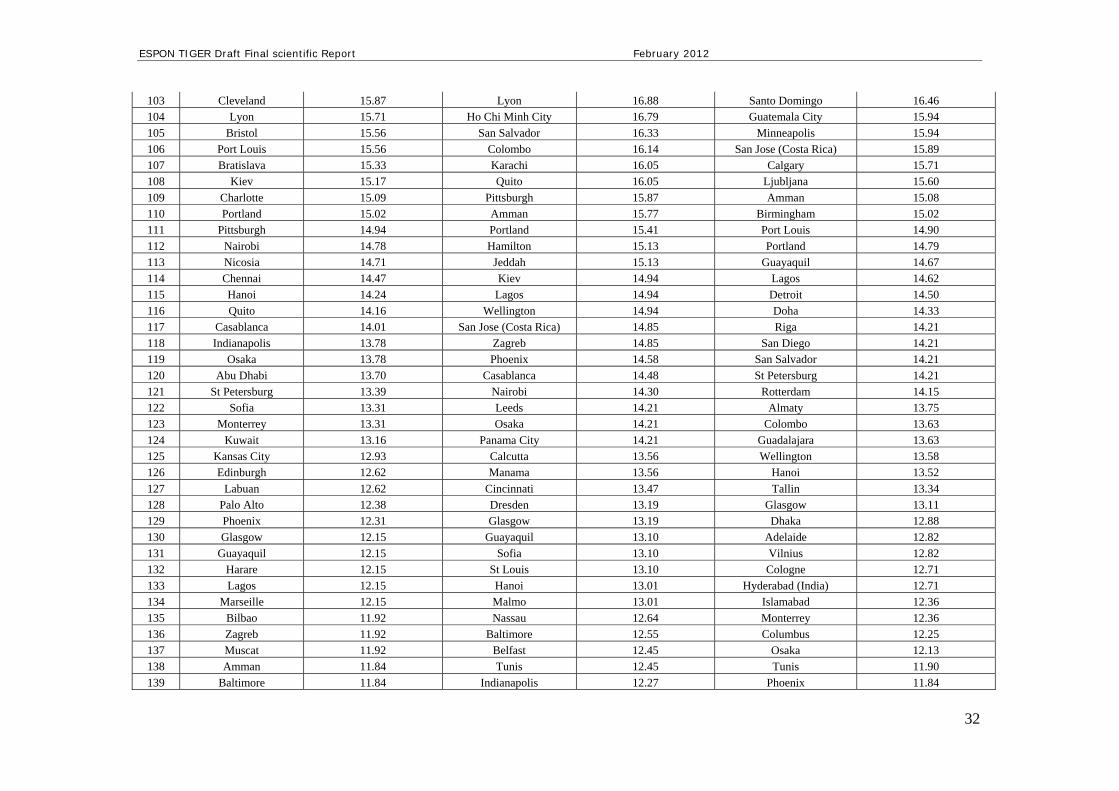
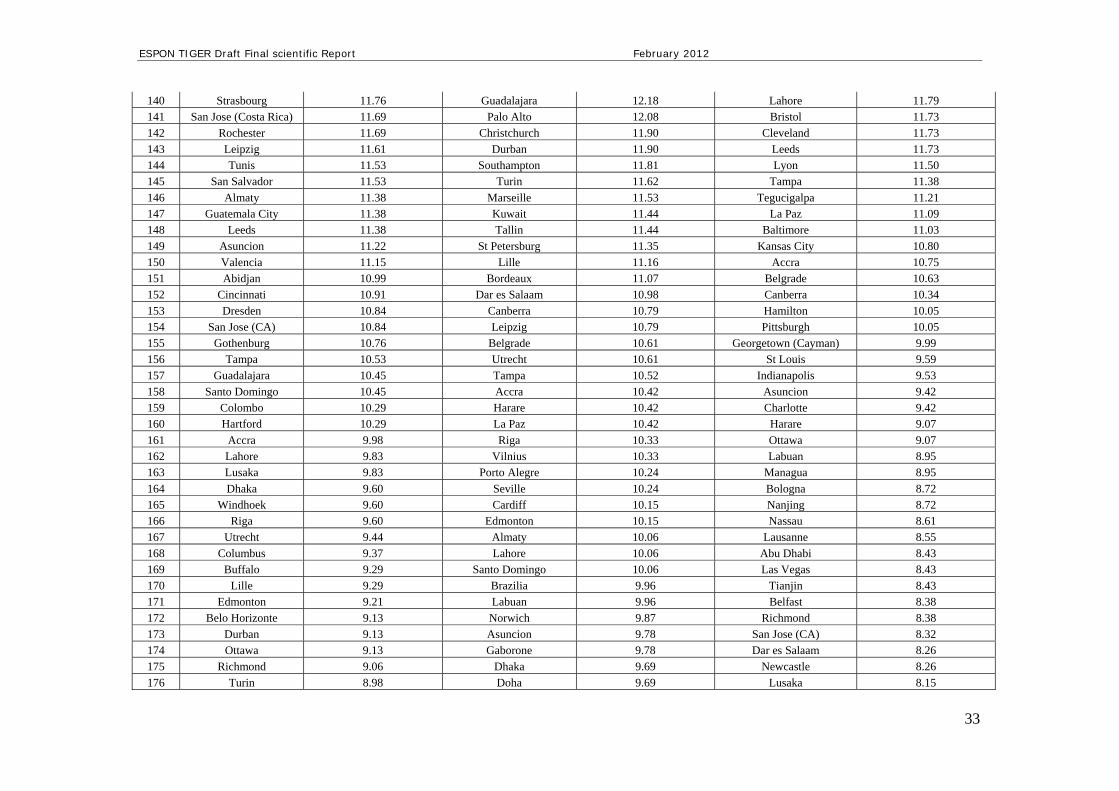
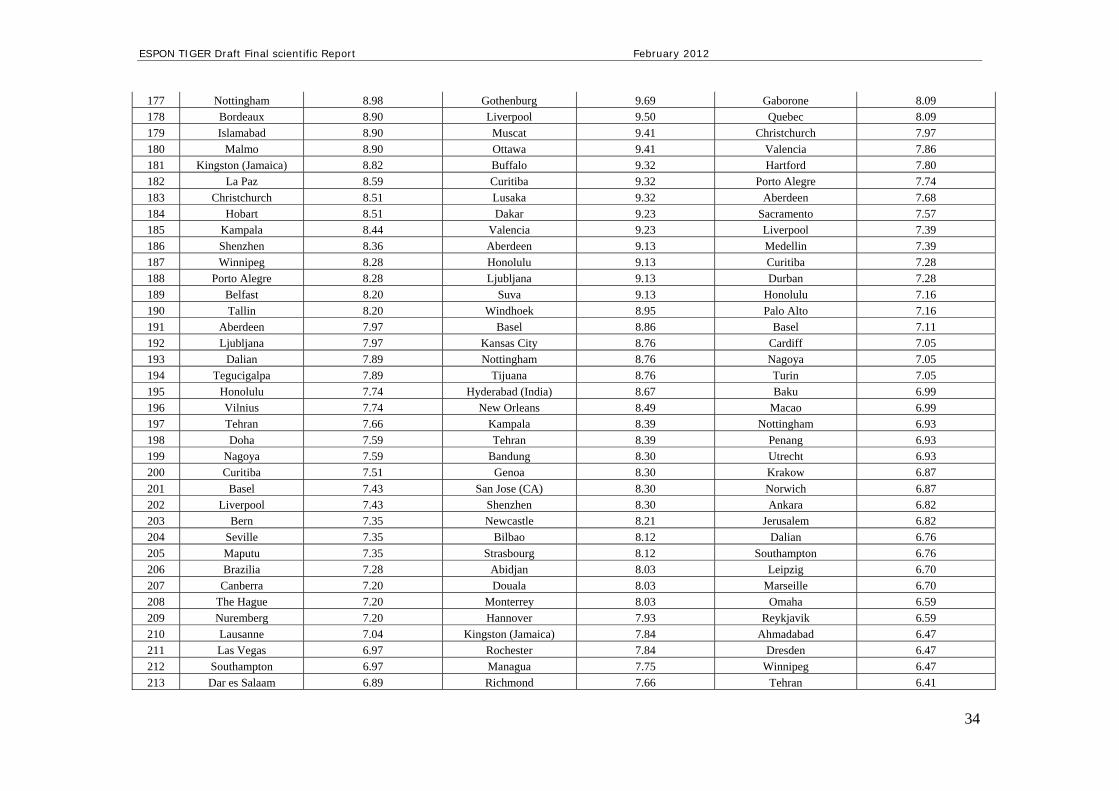
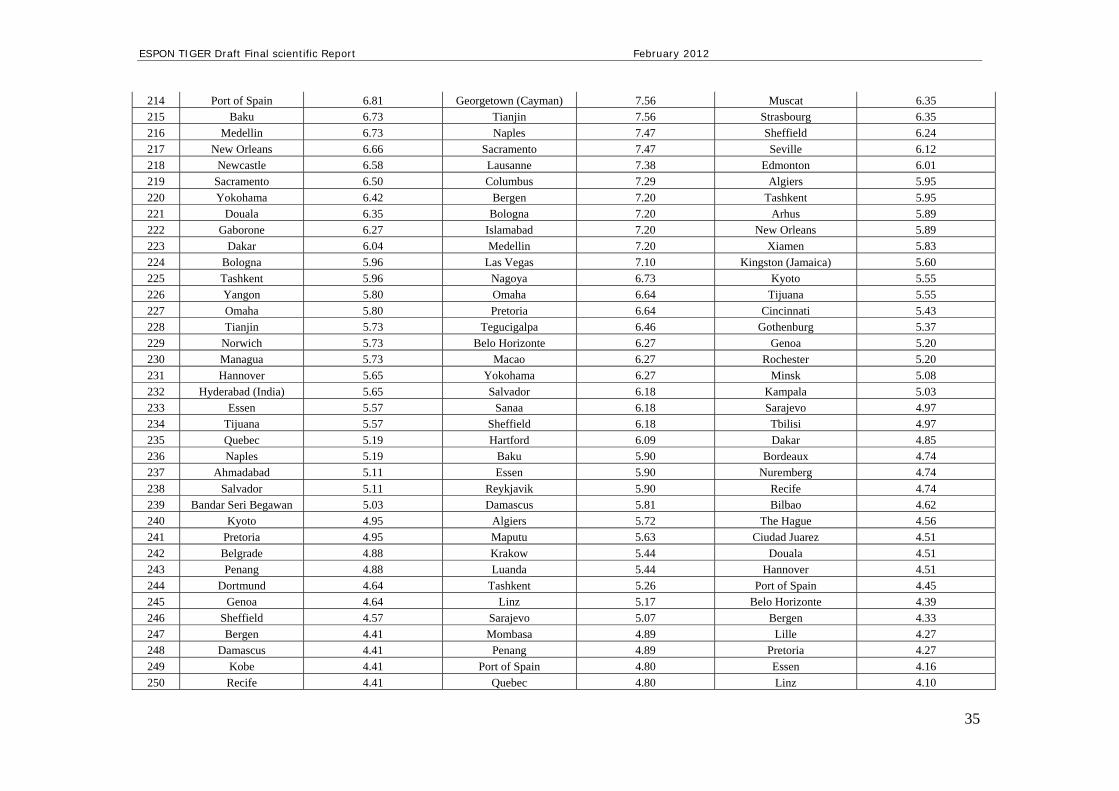
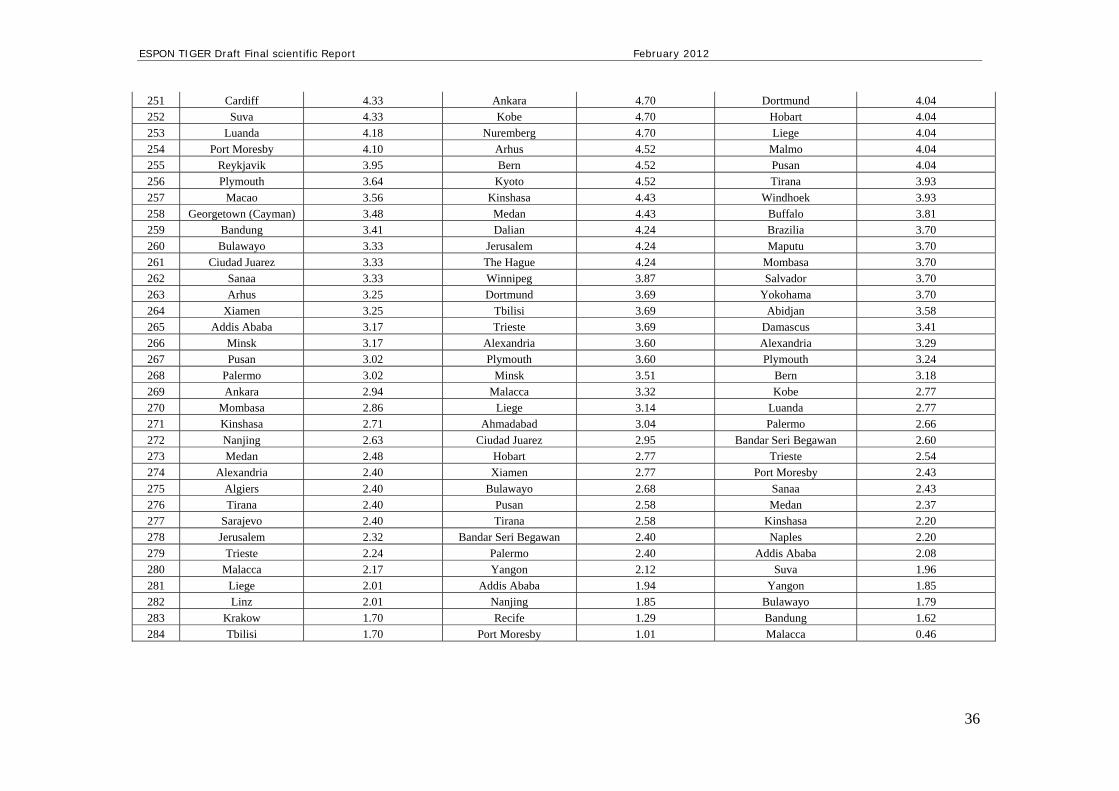
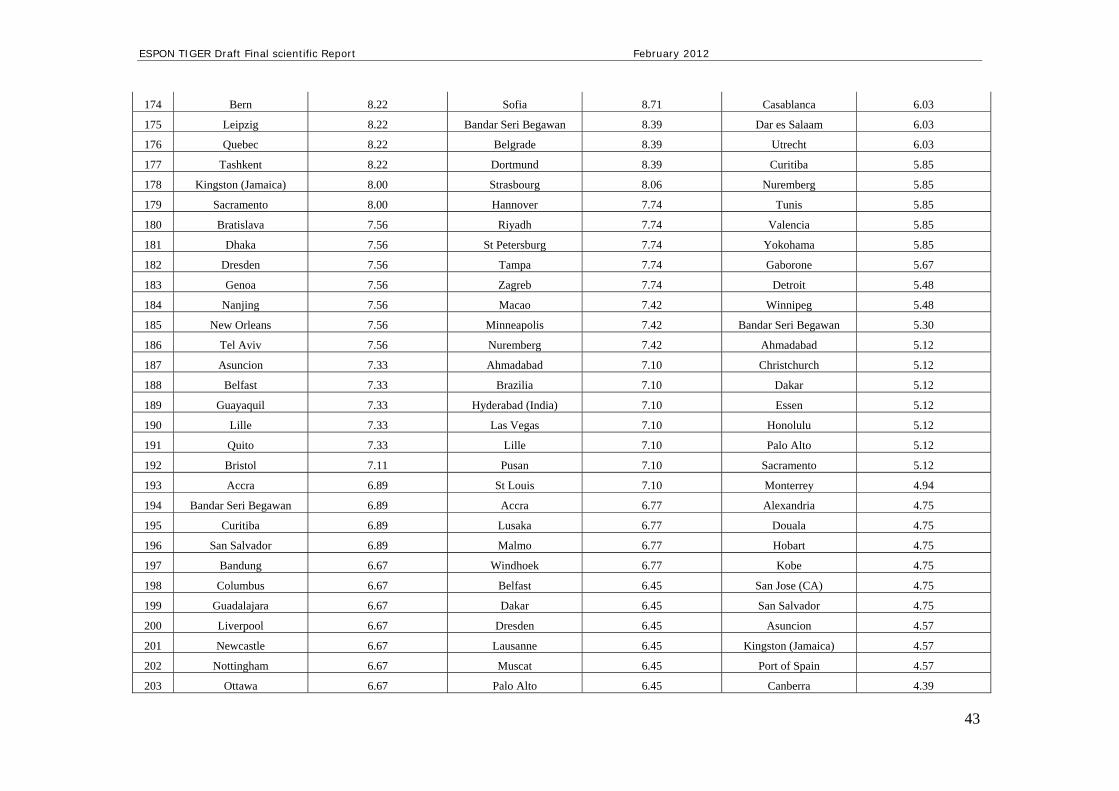
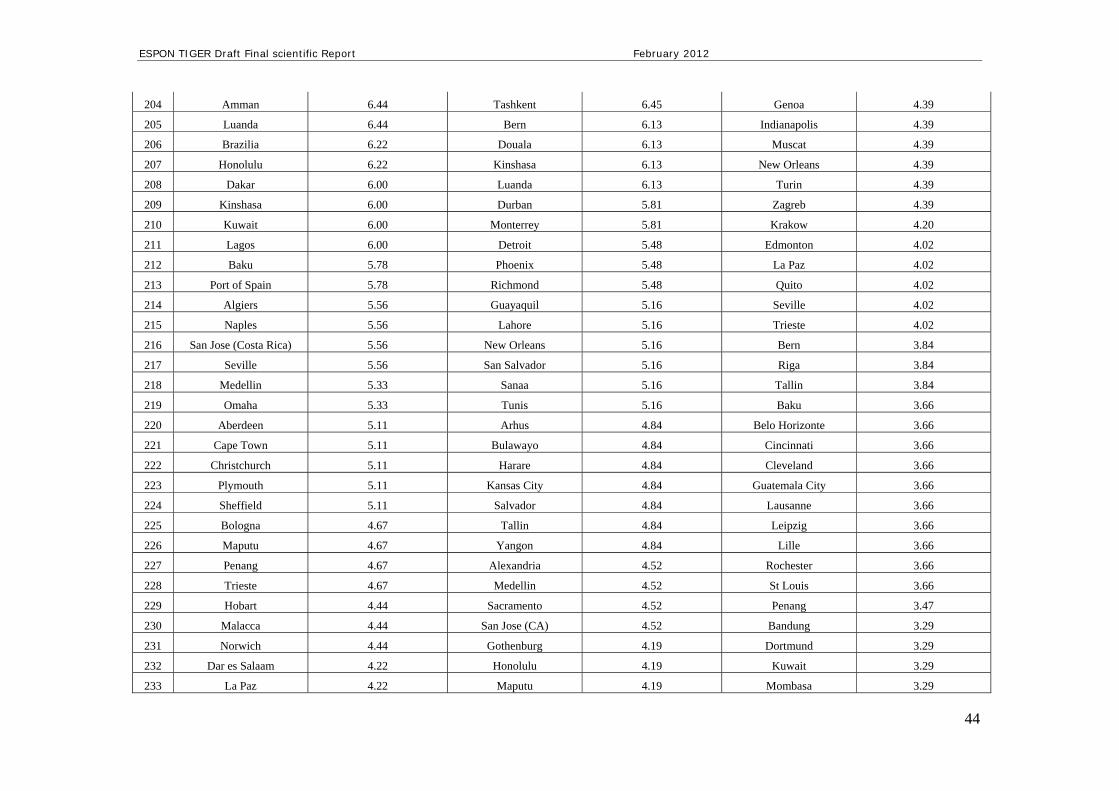
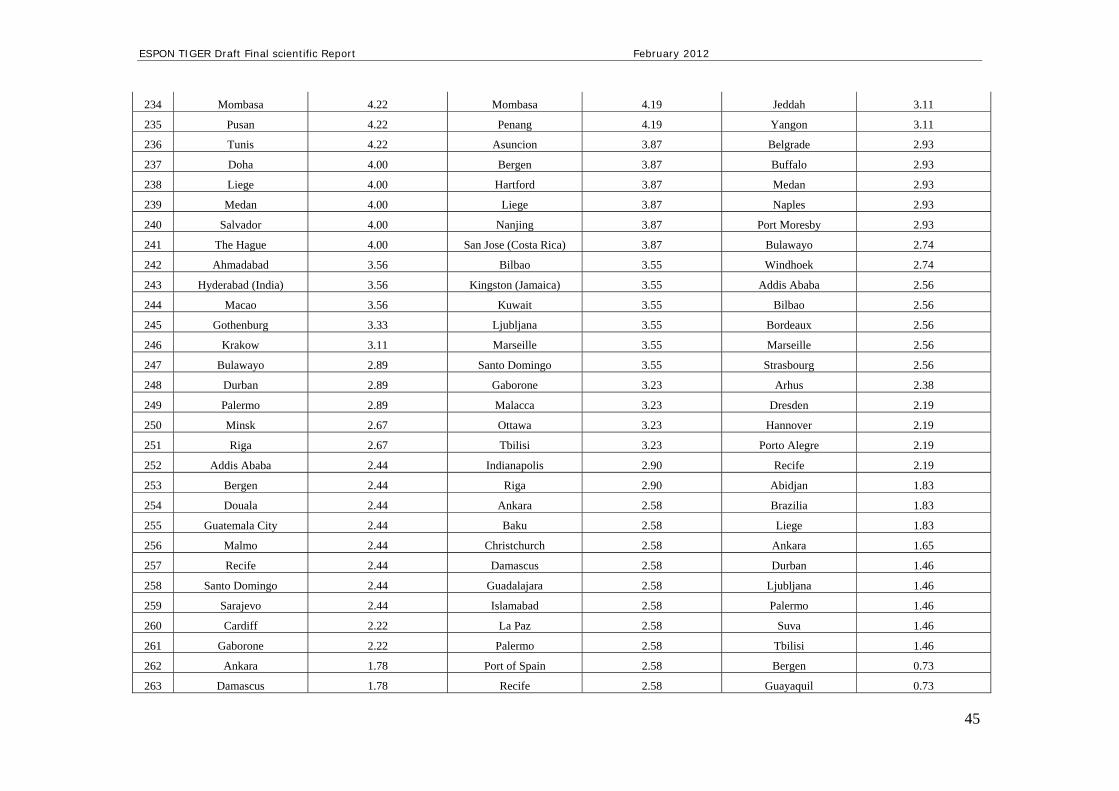
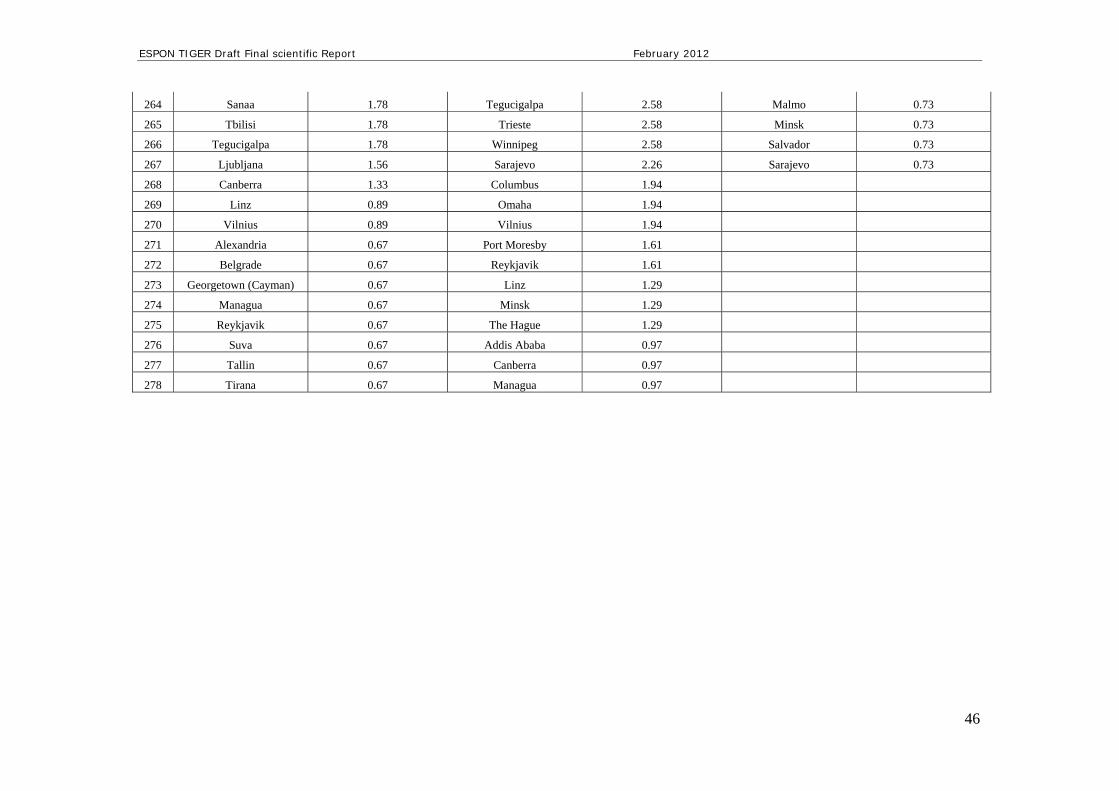
Appendix Table A: London dyads for Advanced Producer Services (APS) for 2000, 2004 and 2008, calculated on standardized data Source: Authors, data supplied by the Globalization & World Cities (GaWC) Research Network: http://www.lboro.ac.uk/gawc/
2000 2004 2008
Rank city connected to
London London dyad index -
2000 city connected to
London London dyad index -
2004 city connected to London London dyad index -
2008 1 New York 100.00 New York 100.00 New York 100.00 2 Hong Kong 73.68 Hong Kong 75.46 Hong Kong 80.30 3 Paris 69.12 Paris 72.97 Paris 78.34 4 Tokyo 69.04 Tokyo 70.39 Singapore 71.29 5 Singapore 66.72 Singapore 68.17 Tokyo 68.92 6 Chicago 60.06 Brussels 61.07 Shanghai 65.40 7 Los Angeles 57.43 Milan 60.24 Beijing 64.82 8 Frankfurt 56.97 Madrid 59.50 Sydney 62.10 9 Milan 56.81 Frankfurt 59.23 Milan 60.83 10 Brussels 54.18 Chicago 58.76 Madrid 58.46 11 Sydney 54.10 Amsterdam 57.01 Brussels 58.06 12 Amsterdam 54.02 Toronto 55.07 Moscow 56.67 13 Madrid 53.64 Beijing 51.66 Frankfurt 53.21 14 Toronto 53.33 Sydney 51.66 Toronto 52.63 15 Sao Paulo 50.00 Shanghai 51.38 Seoul 50.66 16 San Francisco 48.99 Los Angeles 50.18 Chicago 50.26 17 Zurich 44.20 Sao Paulo 49.72 Mumbai 49.22 18 Mexico City 43.34 Munich 48.62 Warsaw 47.26 19 Washington 43.27 Buenos Aires 46.40 Amsterdam 47.14 20 Taipei 42.34 San Francisco 46.13 Zurich 46.79 21 Bangkok 41.95 Warsaw 46.13 Buenos Aires 46.22 22 Beijing 41.64 Mexico City 45.39 Kuala Lumpur 46.04 23 Buenos Aires 41.41 Budapest 45.20 Bangkok 45.64 24 Jakarta 40.94 Zurich 44.93 Sao Paulo 45.52 25 Melbourne 40.25 Moscow 43.08 Taipei 44.66 26 Stockholm 40.09 Stockholm 42.80 Dublin 43.39 27 Shanghai 39.32 Jakarta 42.16 Stockholm 43.39 28 Mumbai 39.24 Bangkok 41.05 Rome 43.10
ESPON TIGER Draft Final scientific Report February 2012
30
29 Miami 38.93 Hamburg 41.05 Jakarta 43.04 30 Kuala Lumpur 37.23 Melbourne 40.96 Mexico City 42.46 31 Prague 37.00 Washington 40.77 Washington 40.55 32 Moscow 36.69 Dublin 40.59 Budapest 40.15 33 Warsaw 36.53 Kuala Lumpur 40.50 Los Angeles 40.03 34 Atlanta 35.99 Prague 40.41 Istanbul 39.23 35 Barcelona 35.99 Seoul 40.04 Prague 38.99 36 Johannesburg 35.68 Mumbai 39.94 Dubai 38.71 37 Seoul 35.45 Vienna 39.94 Vienna 37.84 38 Dublin 35.14 Berlin 39.76 Lisbon 37.72 39 Munich 35.06 Barcelona 39.39 San Francisco 37.20 40 Dusseldorf 34.98 Dusseldorf 39.39 Melbourne 35.47 41 Vienna 34.60 Taipei 39.21 Munich 34.26 42 Budapest 34.13 Rome 38.56 Johannesburg 34.08 43 Manila 33.90 Santiago 37.92 Boston 33.85 44 Montreal 33.82 Lisbon 36.44 Auckland 33.80 45 Hamburg 33.20 Atlanta 35.70 Santiago 33.68 46 Boston 32.89 Dubai 34.96 Athens 33.28 47 Copenhagen 32.89 Johannesburg 34.87 Caracas 31.95 48 Lisbon 32.66 Miami 34.78 Barcelona 31.72 49 Istanbul 32.28 Dallas 34.41 Atlanta 31.54 50 Auckland 32.12 Montreal 34.41 Luxembourg 30.56 51 Berlin 31.27 Luxembourg 34.23 Manila 30.16 52 Rome 30.50 Athens 33.67 Bucharest 29.87 53 Houston 29.49 Istanbul 32.84 New Delhi 29.87 54 Caracas 29.41 New Delhi 32.56 Tel Aviv 29.29 55 New Delhi 29.41 Bogota 32.38 Copenhagen 28.25 56 Dallas 29.33 Caracas 31.27 Hamburg 28.25 57 Bogota 29.10 Houston 30.44 Oslo 28.25 58 Luxembourg 28.79 Copenhagen 30.17 Dallas 27.90 59 Santiago 28.33 Auckland 29.98 Geneva 27.85 60 Dubai 28.02 Cairo 29.52 Dusseldorf 27.79 61 Cairo 26.01 Vancouver 29.43 Bogota 27.61 62 Vancouver 25.31 Geneva 29.34 Helsinki 27.50 63 Athens 24.92 Boston 29.24 Berlin 27.44 64 Geneva 24.61 Rio de Janeiro 28.60 Bangalore 26.52 65 Oslo 24.23 Manila 27.21 Cairo 26.46
ESPON TIGER Draft Final scientific Report February 2012
31
66 Rotterdam 23.30 Helsinki 26.20 Miami 25.65 67 Rio de Janeiro 22.91 Beirut 24.91 Riyadh 25.65 68 Seattle 22.83 Seattle 24.35 Houston 24.84 69 Minneapolis 22.52 Oslo 24.08 Guangzhou 24.09 70 Denver 22.37 Brisbane 23.71 Montreal 23.45 71 Beirut 22.29 Stuttgart 23.34 Bratislava 23.11 72 Ho Chi Minh City 21.75 Bratislava 22.79 Jeddah 22.93 73 Helsinki 21.44 Lima 22.60 Montevideo 22.53 74 Philadelphia 21.05 Montevideo 22.23 Kuwait 22.18 75 Cologne 20.36 Tel Aviv 22.23 Kiev 22.07 76 Brisbane 20.20 Bristol 21.96 Sofia 21.95 77 Perth 19.27 Philadelphia 21.86 Beirut 21.78 78 Montevideo 18.89 Bucharest 21.77 Lima 21.72 79 St Louis 18.58 San Diego 21.68 Casablanca 20.97 80 San Diego 18.58 Chennai 21.49 Karachi 20.97 81 Calgary 18.19 Birmingham 21.31 Ho Chi Minh City 20.62 82 Stuttgart 18.11 Cape Town 21.31 Brisbane 20.45 83 Antwerp 17.96 Manchester 20.85 Nicosia 19.93 84 Panama City 17.88 Perth 20.85 Vancouver 19.64 85 Bucharest 17.80 Calgary 20.66 Chennai 19.53 86 Hamilton 17.57 Bangalore 20.20 Rio de Janeiro 19.30 87 Manama 17.57 Minneapolis 20.11 Nairobi 19.06 88 Detroit 17.49 Denver 19.83 Seattle 18.72 89 Lima 17.49 Edinburgh 19.56 Manama 18.66 90 Wellington 17.49 Cleveland 19.28 Cape Town 18.60 91 Guangzhou 17.26 Cologne 19.10 Stuttgart 18.20 92 Adelaide 17.11 Guatemala City 18.91 Perth 17.85 93 Karachi 17.11 Nicosia 18.91 Zagreb 17.74 94 Riyadh 16.95 Rotterdam 18.82 Panama City 17.68 95 Bangalore 16.80 Antwerp 18.73 Antwerp 17.50 96 Birmingham 16.80 Port Louis 18.73 Denver 17.50 97 Nassau 16.72 Adelaide 18.27 Shenzhen 17.45 98 Manchester 16.72 Abu Dhabi 18.17 Manchester 16.87 99 Calcutta 16.56 Detroit 18.17 Edinburgh 16.81
100 Jeddah 16.33 Riyadh 17.34 Philadelphia 16.81 101 Cape Town 16.10 Charlotte 17.25 Calcutta 16.75 102 Tel Aviv 16.10 Guangzhou 16.88 Quito 16.75
ESPON TIGER Draft Final scientific Report February 2012
32
103 Cleveland 15.87 Lyon 16.88 Santo Domingo 16.46 104 Lyon 15.71 Ho Chi Minh City 16.79 Guatemala City 15.94 105 Bristol 15.56 San Salvador 16.33 Minneapolis 15.94 106 Port Louis 15.56 Colombo 16.14 San Jose (Costa Rica) 15.89 107 Bratislava 15.33 Karachi 16.05 Calgary 15.71 108 Kiev 15.17 Quito 16.05 Ljubljana 15.60 109 Charlotte 15.09 Pittsburgh 15.87 Amman 15.08 110 Portland 15.02 Amman 15.77 Birmingham 15.02 111 Pittsburgh 14.94 Portland 15.41 Port Louis 14.90 112 Nairobi 14.78 Hamilton 15.13 Portland 14.79 113 Nicosia 14.71 Jeddah 15.13 Guayaquil 14.67 114 Chennai 14.47 Kiev 14.94 Lagos 14.62 115 Hanoi 14.24 Lagos 14.94 Detroit 14.50 116 Quito 14.16 Wellington 14.94 Doha 14.33 117 Casablanca 14.01 San Jose (Costa Rica) 14.85 Riga 14.21 118 Indianapolis 13.78 Zagreb 14.85 San Diego 14.21 119 Osaka 13.78 Phoenix 14.58 San Salvador 14.21 120 Abu Dhabi 13.70 Casablanca 14.48 St Petersburg 14.21 121 St Petersburg 13.39 Nairobi 14.30 Rotterdam 14.15 122 Sofia 13.31 Leeds 14.21 Almaty 13.75 123 Monterrey 13.31 Osaka 14.21 Colombo 13.63 124 Kuwait 13.16 Panama City 14.21 Guadalajara 13.63 125 Kansas City 12.93 Calcutta 13.56 Wellington 13.58 126 Edinburgh 12.62 Manama 13.56 Hanoi 13.52 127 Labuan 12.62 Cincinnati 13.47 Tallin 13.34 128 Palo Alto 12.38 Dresden 13.19 Glasgow 13.11 129 Phoenix 12.31 Glasgow 13.19 Dhaka 12.88 130 Glasgow 12.15 Guayaquil 13.10 Adelaide 12.82 131 Guayaquil 12.15 Sofia 13.10 Vilnius 12.82 132 Harare 12.15 St Louis 13.10 Cologne 12.71 133 Lagos 12.15 Hanoi 13.01 Hyderabad (India) 12.71 134 Marseille 12.15 Malmo 13.01 Islamabad 12.36 135 Bilbao 11.92 Nassau 12.64 Monterrey 12.36 136 Zagreb 11.92 Baltimore 12.55 Columbus 12.25 137 Muscat 11.92 Belfast 12.45 Osaka 12.13 138 Amman 11.84 Tunis 12.45 Tunis 11.90 139 Baltimore 11.84 Indianapolis 12.27 Phoenix 11.84
ESPON TIGER Draft Final scientific Report February 2012
33
140 Strasbourg 11.76 Guadalajara 12.18 Lahore 11.79 141 San Jose (Costa Rica) 11.69 Palo Alto 12.08 Bristol 11.73 142 Rochester 11.69 Christchurch 11.90 Cleveland 11.73 143 Leipzig 11.61 Durban 11.90 Leeds 11.73 144 Tunis 11.53 Southampton 11.81 Lyon 11.50 145 San Salvador 11.53 Turin 11.62 Tampa 11.38 146 Almaty 11.38 Marseille 11.53 Tegucigalpa 11.21 147 Guatemala City 11.38 Kuwait 11.44 La Paz 11.09 148 Leeds 11.38 Tallin 11.44 Baltimore 11.03 149 Asuncion 11.22 St Petersburg 11.35 Kansas City 10.80 150 Valencia 11.15 Lille 11.16 Accra 10.75 151 Abidjan 10.99 Bordeaux 11.07 Belgrade 10.63 152 Cincinnati 10.91 Dar es Salaam 10.98 Canberra 10.34 153 Dresden 10.84 Canberra 10.79 Hamilton 10.05 154 San Jose (CA) 10.84 Leipzig 10.79 Pittsburgh 10.05 155 Gothenburg 10.76 Belgrade 10.61 Georgetown (Cayman) 9.99 156 Tampa 10.53 Utrecht 10.61 St Louis 9.59 157 Guadalajara 10.45 Tampa 10.52 Indianapolis 9.53 158 Santo Domingo 10.45 Accra 10.42 Asuncion 9.42 159 Colombo 10.29 Harare 10.42 Charlotte 9.42 160 Hartford 10.29 La Paz 10.42 Harare 9.07 161 Accra 9.98 Riga 10.33 Ottawa 9.07 162 Lahore 9.83 Vilnius 10.33 Labuan 8.95 163 Lusaka 9.83 Porto Alegre 10.24 Managua 8.95 164 Dhaka 9.60 Seville 10.24 Bologna 8.72 165 Windhoek 9.60 Cardiff 10.15 Nanjing 8.72 166 Riga 9.60 Edmonton 10.15 Nassau 8.61 167 Utrecht 9.44 Almaty 10.06 Lausanne 8.55 168 Columbus 9.37 Lahore 10.06 Abu Dhabi 8.43 169 Buffalo 9.29 Santo Domingo 10.06 Las Vegas 8.43 170 Lille 9.29 Brazilia 9.96 Tianjin 8.43 171 Edmonton 9.21 Labuan 9.96 Belfast 8.38 172 Belo Horizonte 9.13 Norwich 9.87 Richmond 8.38 173 Durban 9.13 Asuncion 9.78 San Jose (CA) 8.32 174 Ottawa 9.13 Gaborone 9.78 Dar es Salaam 8.26 175 Richmond 9.06 Dhaka 9.69 Newcastle 8.26 176 Turin 8.98 Doha 9.69 Lusaka 8.15
ESPON TIGER Draft Final scientific Report February 2012
34
177 Nottingham 8.98 Gothenburg 9.69 Gaborone 8.09 178 Bordeaux 8.90 Liverpool 9.50 Quebec 8.09 179 Islamabad 8.90 Muscat 9.41 Christchurch 7.97 180 Malmo 8.90 Ottawa 9.41 Valencia 7.86 181 Kingston (Jamaica) 8.82 Buffalo 9.32 Hartford 7.80 182 La Paz 8.59 Curitiba 9.32 Porto Alegre 7.74 183 Christchurch 8.51 Lusaka 9.32 Aberdeen 7.68 184 Hobart 8.51 Dakar 9.23 Sacramento 7.57 185 Kampala 8.44 Valencia 9.23 Liverpool 7.39 186 Shenzhen 8.36 Aberdeen 9.13 Medellin 7.39 187 Winnipeg 8.28 Honolulu 9.13 Curitiba 7.28 188 Porto Alegre 8.28 Ljubljana 9.13 Durban 7.28 189 Belfast 8.20 Suva 9.13 Honolulu 7.16 190 Tallin 8.20 Windhoek 8.95 Palo Alto 7.16 191 Aberdeen 7.97 Basel 8.86 Basel 7.11 192 Ljubljana 7.97 Kansas City 8.76 Cardiff 7.05 193 Dalian 7.89 Nottingham 8.76 Nagoya 7.05 194 Tegucigalpa 7.89 Tijuana 8.76 Turin 7.05 195 Honolulu 7.74 Hyderabad (India) 8.67 Baku 6.99 196 Vilnius 7.74 New Orleans 8.49 Macao 6.99 197 Tehran 7.66 Kampala 8.39 Nottingham 6.93 198 Doha 7.59 Tehran 8.39 Penang 6.93 199 Nagoya 7.59 Bandung 8.30 Utrecht 6.93 200 Curitiba 7.51 Genoa 8.30 Krakow 6.87 201 Basel 7.43 San Jose (CA) 8.30 Norwich 6.87 202 Liverpool 7.43 Shenzhen 8.30 Ankara 6.82 203 Bern 7.35 Newcastle 8.21 Jerusalem 6.82 204 Seville 7.35 Bilbao 8.12 Dalian 6.76 205 Maputu 7.35 Strasbourg 8.12 Southampton 6.76 206 Brazilia 7.28 Abidjan 8.03 Leipzig 6.70 207 Canberra 7.20 Douala 8.03 Marseille 6.70 208 The Hague 7.20 Monterrey 8.03 Omaha 6.59 209 Nuremberg 7.20 Hannover 7.93 Reykjavik 6.59 210 Lausanne 7.04 Kingston (Jamaica) 7.84 Ahmadabad 6.47 211 Las Vegas 6.97 Rochester 7.84 Dresden 6.47 212 Southampton 6.97 Managua 7.75 Winnipeg 6.47 213 Dar es Salaam 6.89 Richmond 7.66 Tehran 6.41
ESPON TIGER Draft Final scientific Report February 2012
35
214 Port of Spain 6.81 Georgetown (Cayman) 7.56 Muscat 6.35 215 Baku 6.73 Tianjin 7.56 Strasbourg 6.35 216 Medellin 6.73 Naples 7.47 Sheffield 6.24 217 New Orleans 6.66 Sacramento 7.47 Seville 6.12 218 Newcastle 6.58 Lausanne 7.38 Edmonton 6.01 219 Sacramento 6.50 Columbus 7.29 Algiers 5.95 220 Yokohama 6.42 Bergen 7.20 Tashkent 5.95 221 Douala 6.35 Bologna 7.20 Arhus 5.89 222 Gaborone 6.27 Islamabad 7.20 New Orleans 5.89 223 Dakar 6.04 Medellin 7.20 Xiamen 5.83 224 Bologna 5.96 Las Vegas 7.10 Kingston (Jamaica) 5.60 225 Tashkent 5.96 Nagoya 6.73 Kyoto 5.55 226 Yangon 5.80 Omaha 6.64 Tijuana 5.55 227 Omaha 5.80 Pretoria 6.64 Cincinnati 5.43 228 Tianjin 5.73 Tegucigalpa 6.46 Gothenburg 5.37 229 Norwich 5.73 Belo Horizonte 6.27 Genoa 5.20 230 Managua 5.73 Macao 6.27 Rochester 5.20 231 Hannover 5.65 Yokohama 6.27 Minsk 5.08 232 Hyderabad (India) 5.65 Salvador 6.18 Kampala 5.03 233 Essen 5.57 Sanaa 6.18 Sarajevo 4.97 234 Tijuana 5.57 Sheffield 6.18 Tbilisi 4.97 235 Quebec 5.19 Hartford 6.09 Dakar 4.85 236 Naples 5.19 Baku 5.90 Bordeaux 4.74 237 Ahmadabad 5.11 Essen 5.90 Nuremberg 4.74 238 Salvador 5.11 Reykjavik 5.90 Recife 4.74 239 Bandar Seri Begawan 5.03 Damascus 5.81 Bilbao 4.62 240 Kyoto 4.95 Algiers 5.72 The Hague 4.56 241 Pretoria 4.95 Maputu 5.63 Ciudad Juarez 4.51 242 Belgrade 4.88 Krakow 5.44 Douala 4.51 243 Penang 4.88 Luanda 5.44 Hannover 4.51 244 Dortmund 4.64 Tashkent 5.26 Port of Spain 4.45 245 Genoa 4.64 Linz 5.17 Belo Horizonte 4.39 246 Sheffield 4.57 Sarajevo 5.07 Bergen 4.33 247 Bergen 4.41 Mombasa 4.89 Lille 4.27 248 Damascus 4.41 Penang 4.89 Pretoria 4.27 249 Kobe 4.41 Port of Spain 4.80 Essen 4.16 250 Recife 4.41 Quebec 4.80 Linz 4.10
ESPON TIGER Draft Final scientific Report February 2012
36
251 Cardiff 4.33 Ankara 4.70 Dortmund 4.04 252 Suva 4.33 Kobe 4.70 Hobart 4.04 253 Luanda 4.18 Nuremberg 4.70 Liege 4.04 254 Port Moresby 4.10 Arhus 4.52 Malmo 4.04 255 Reykjavik 3.95 Bern 4.52 Pusan 4.04 256 Plymouth 3.64 Kyoto 4.52 Tirana 3.93 257 Macao 3.56 Kinshasa 4.43 Windhoek 3.93 258 Georgetown (Cayman) 3.48 Medan 4.43 Buffalo 3.81 259 Bandung 3.41 Dalian 4.24 Brazilia 3.70 260 Bulawayo 3.33 Jerusalem 4.24 Maputu 3.70 261 Ciudad Juarez 3.33 The Hague 4.24 Mombasa 3.70 262 Sanaa 3.33 Winnipeg 3.87 Salvador 3.70 263 Arhus 3.25 Dortmund 3.69 Yokohama 3.70 264 Xiamen 3.25 Tbilisi 3.69 Abidjan 3.58 265 Addis Ababa 3.17 Trieste 3.69 Damascus 3.41 266 Minsk 3.17 Alexandria 3.60 Alexandria 3.29 267 Pusan 3.02 Plymouth 3.60 Plymouth 3.24 268 Palermo 3.02 Minsk 3.51 Bern 3.18 269 Ankara 2.94 Malacca 3.32 Kobe 2.77 270 Mombasa 2.86 Liege 3.14 Luanda 2.77 271 Kinshasa 2.71 Ahmadabad 3.04 Palermo 2.66 272 Nanjing 2.63 Ciudad Juarez 2.95 Bandar Seri Begawan 2.60 273 Medan 2.48 Hobart 2.77 Trieste 2.54 274 Alexandria 2.40 Xiamen 2.77 Port Moresby 2.43 275 Algiers 2.40 Bulawayo 2.68 Sanaa 2.43 276 Tirana 2.40 Pusan 2.58 Medan 2.37 277 Sarajevo 2.40 Tirana 2.58 Kinshasa 2.20 278 Jerusalem 2.32 Bandar Seri Begawan 2.40 Naples 2.20 279 Trieste 2.24 Palermo 2.40 Addis Ababa 2.08 280 Malacca 2.17 Yangon 2.12 Suva 1.96 281 Liege 2.01 Addis Ababa 1.94 Yangon 1.85 282 Linz 2.01 Nanjing 1.85 Bulawayo 1.79 283 Krakow 1.70 Recife 1.29 Bandung 1.62 284 Tbilisi 1.70 Port Moresby 1.01 Malacca 0.46
ESPON TIGER Draft Final scientific Report February 2012
37
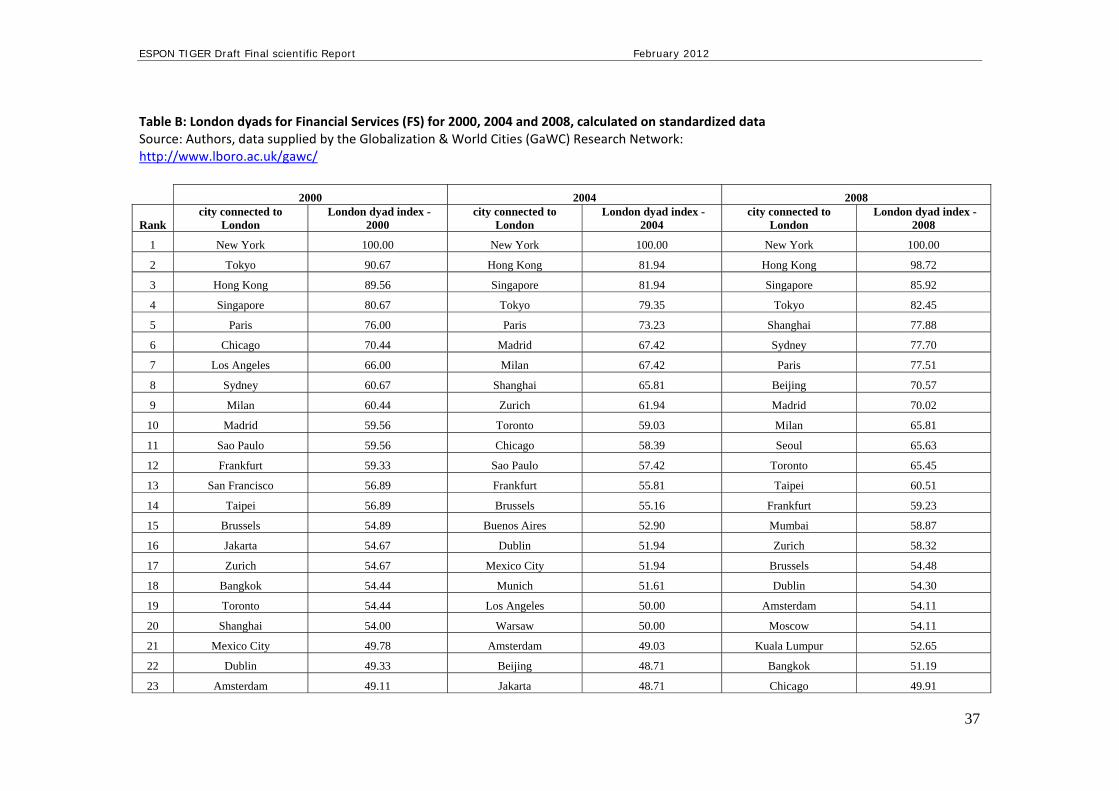
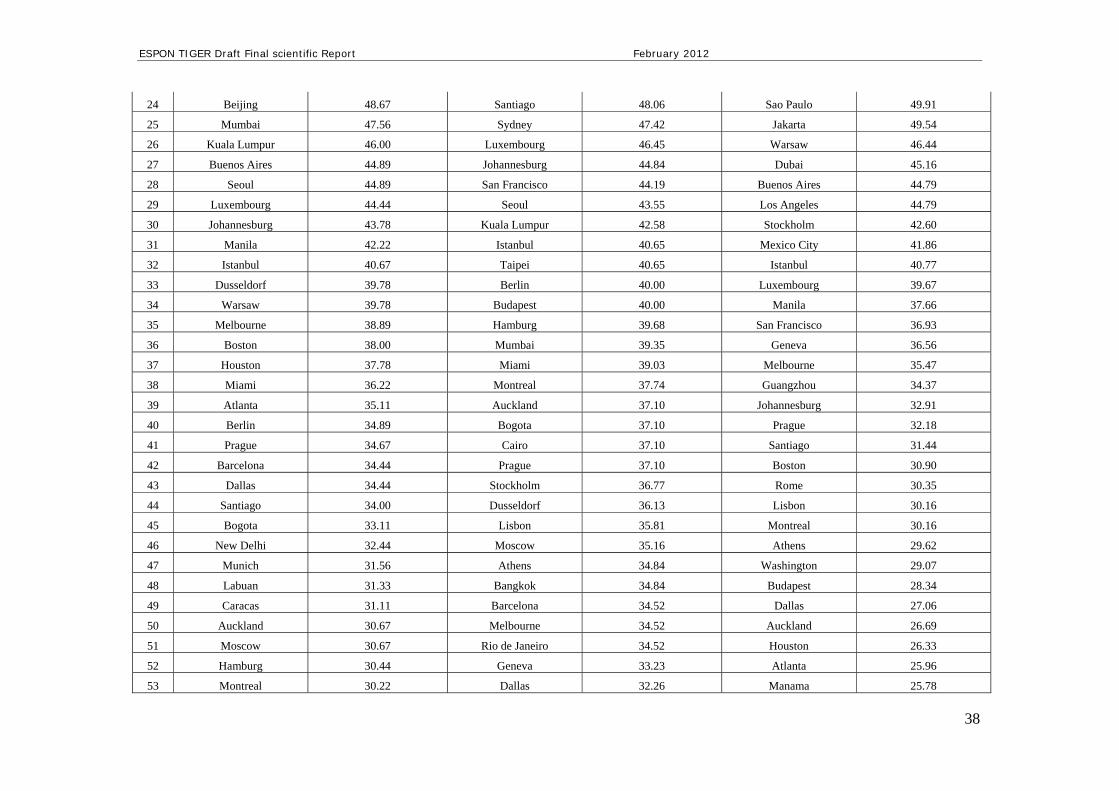
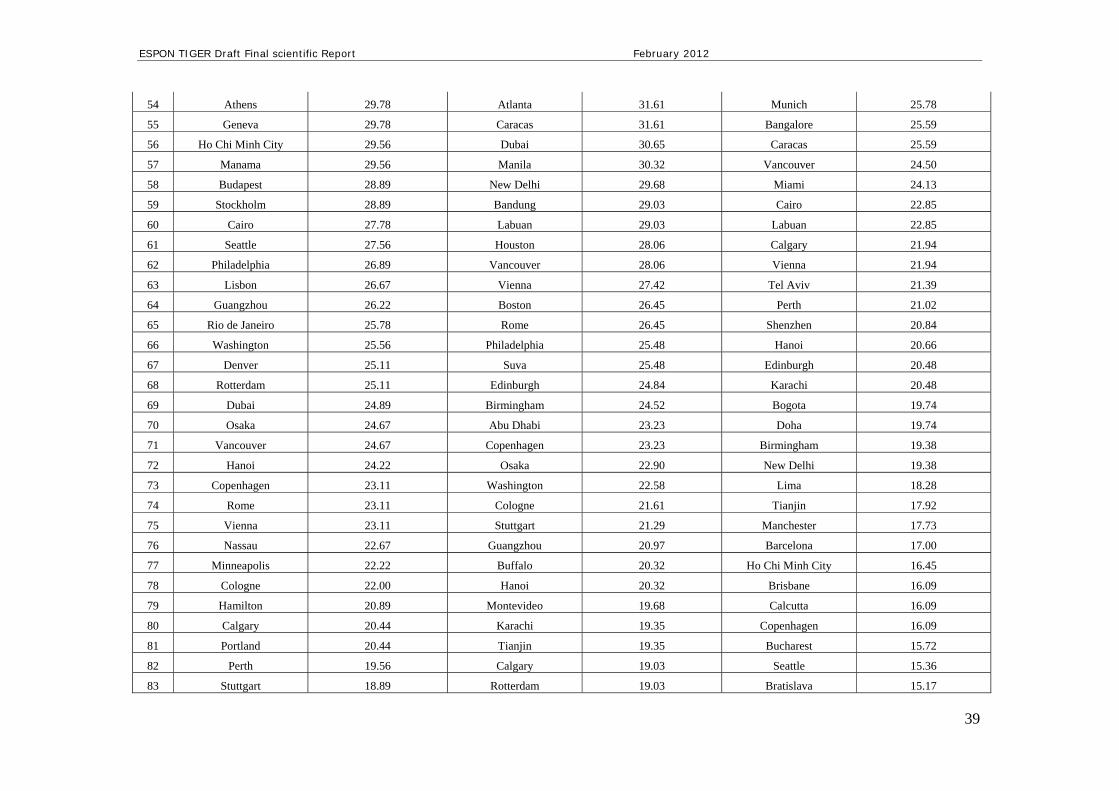
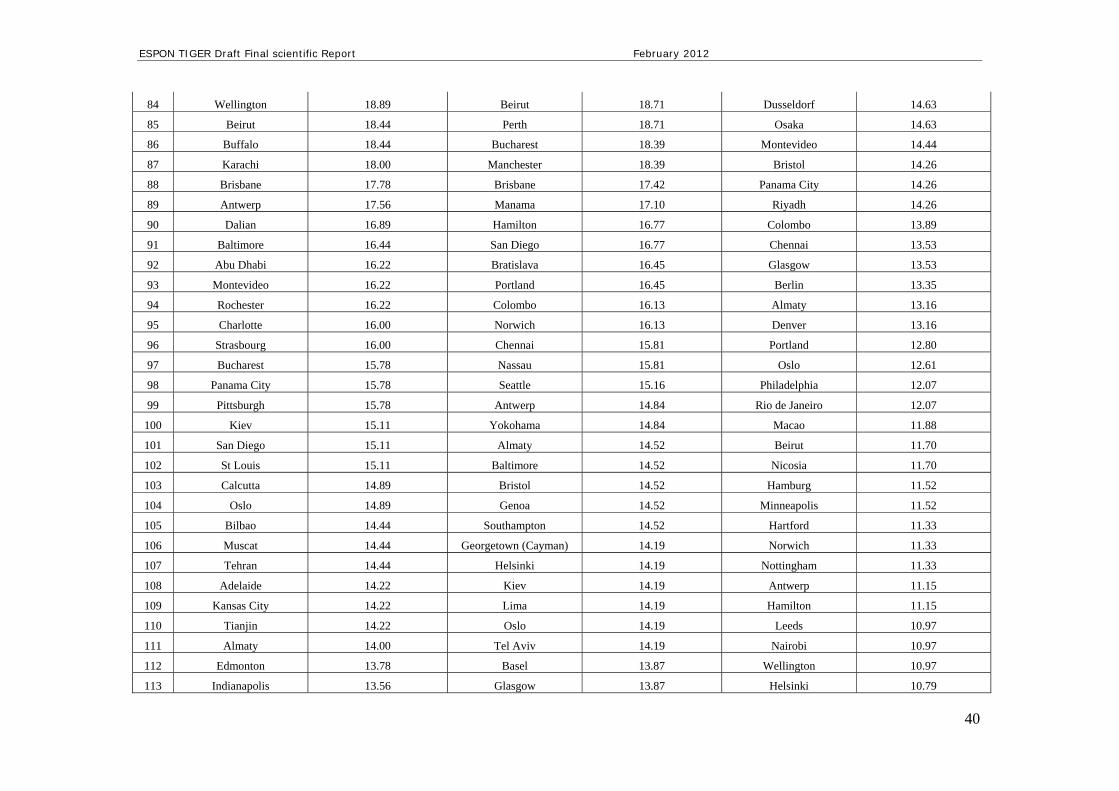
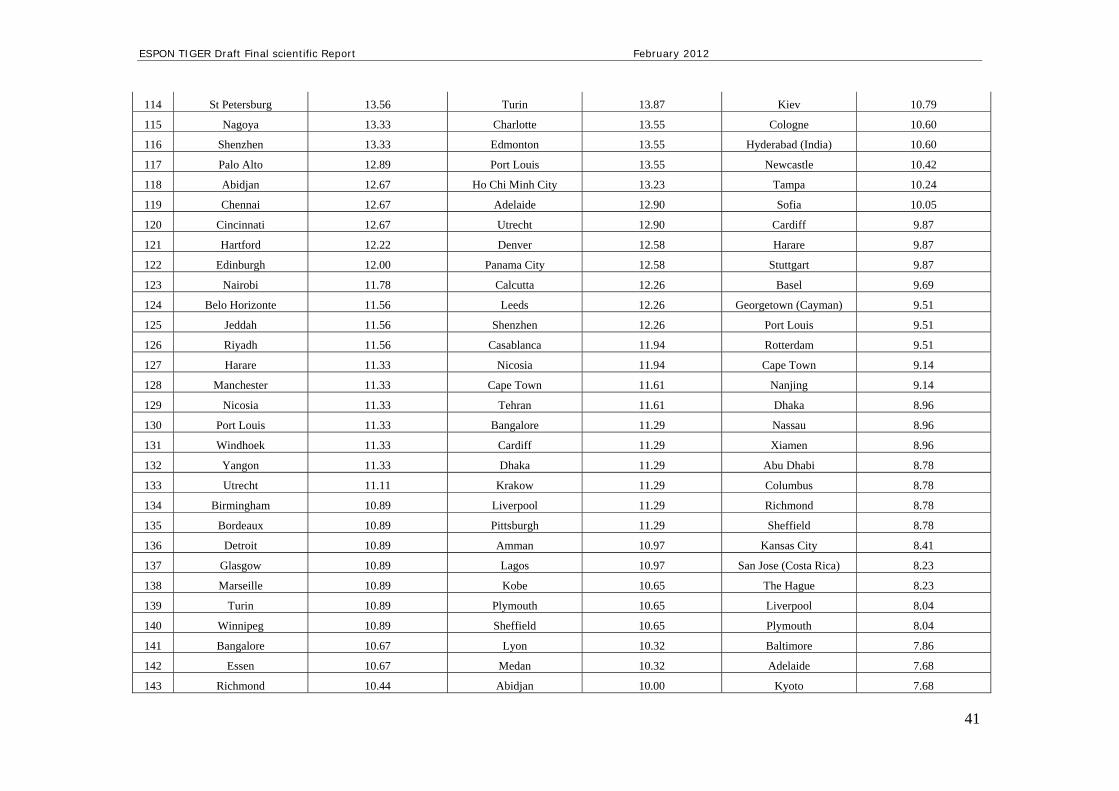
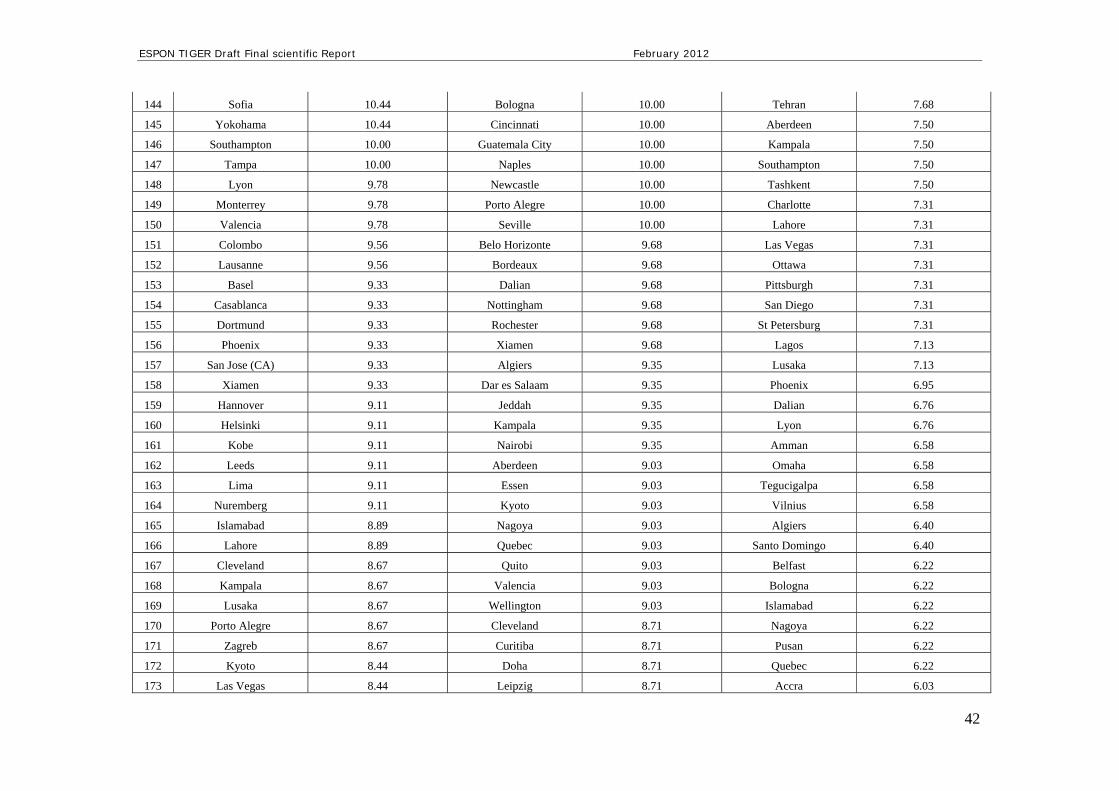
Table B: London dyads for Financial Services (FS) for 2000, 2004 and 2008, calculated on standardized data Source: Authors, data supplied by the Globalization & World Cities (GaWC) Research Network: http://www.lboro.ac.uk/gawc/
2000 2004 2008
Rank city connected to
London London dyad index -
2000 city connected to
London London dyad index -
2004 city connected to
London London dyad index -
2008
1 New York 100.00 New York 100.00 New York 100.00
2 Tokyo 90.67 Hong Kong 81.94 Hong Kong 98.72
3 Hong Kong 89.56 Singapore 81.94 Singapore 85.92
4 Singapore 80.67 Tokyo 79.35 Tokyo 82.45
5 Paris 76.00 Paris 73.23 Shanghai 77.88
6 Chicago 70.44 Madrid 67.42 Sydney 77.70
7 Los Angeles 66.00 Milan 67.42 Paris 77.51
8 Sydney 60.67 Shanghai 65.81 Beijing 70.57
9 Milan 60.44 Zurich 61.94 Madrid 70.02
10 Madrid 59.56 Toronto 59.03 Milan 65.81
11 Sao Paulo 59.56 Chicago 58.39 Seoul 65.63
12 Frankfurt 59.33 Sao Paulo 57.42 Toronto 65.45
13 San Francisco 56.89 Frankfurt 55.81 Taipei 60.51
14 Taipei 56.89 Brussels 55.16 Frankfurt 59.23
15 Brussels 54.89 Buenos Aires 52.90 Mumbai 58.87
16 Jakarta 54.67 Dublin 51.94 Zurich 58.32
17 Zurich 54.67 Mexico City 51.94 Brussels 54.48
18 Bangkok 54.44 Munich 51.61 Dublin 54.30
19 Toronto 54.44 Los Angeles 50.00 Amsterdam 54.11
20 Shanghai 54.00 Warsaw 50.00 Moscow 54.11
21 Mexico City 49.78 Amsterdam 49.03 Kuala Lumpur 52.65
22 Dublin 49.33 Beijing 48.71 Bangkok 51.19
23 Amsterdam 49.11 Jakarta 48.71 Chicago 49.91
ESPON TIGER Draft Final scientific Report February 2012
38
24 Beijing 48.67 Santiago 48.06 Sao Paulo 49.91
25 Mumbai 47.56 Sydney 47.42 Jakarta 49.54
26 Kuala Lumpur 46.00 Luxembourg 46.45 Warsaw 46.44
27 Buenos Aires 44.89 Johannesburg 44.84 Dubai 45.16
28 Seoul 44.89 San Francisco 44.19 Buenos Aires 44.79
29 Luxembourg 44.44 Seoul 43.55 Los Angeles 44.79
30 Johannesburg 43.78 Kuala Lumpur 42.58 Stockholm 42.60
31 Manila 42.22 Istanbul 40.65 Mexico City 41.86
32 Istanbul 40.67 Taipei 40.65 Istanbul 40.77
33 Dusseldorf 39.78 Berlin 40.00 Luxembourg 39.67
34 Warsaw 39.78 Budapest 40.00 Manila 37.66
35 Melbourne 38.89 Hamburg 39.68 San Francisco 36.93
36 Boston 38.00 Mumbai 39.35 Geneva 36.56
37 Houston 37.78 Miami 39.03 Melbourne 35.47
38 Miami 36.22 Montreal 37.74 Guangzhou 34.37
39 Atlanta 35.11 Auckland 37.10 Johannesburg 32.91
40 Berlin 34.89 Bogota 37.10 Prague 32.18
41 Prague 34.67 Cairo 37.10 Santiago 31.44
42 Barcelona 34.44 Prague 37.10 Boston 30.90
43 Dallas 34.44 Stockholm 36.77 Rome 30.35
44 Santiago 34.00 Dusseldorf 36.13 Lisbon 30.16
45 Bogota 33.11 Lisbon 35.81 Montreal 30.16
46 New Delhi 32.44 Moscow 35.16 Athens 29.62
47 Munich 31.56 Athens 34.84 Washington 29.07
48 Labuan 31.33 Bangkok 34.84 Budapest 28.34
49 Caracas 31.11 Barcelona 34.52 Dallas 27.06
50 Auckland 30.67 Melbourne 34.52 Auckland 26.69
51 Moscow 30.67 Rio de Janeiro 34.52 Houston 26.33
52 Hamburg 30.44 Geneva 33.23 Atlanta 25.96
53 Montreal 30.22 Dallas 32.26 Manama 25.78
ESPON TIGER Draft Final scientific Report February 2012
39
54 Athens 29.78 Atlanta 31.61 Munich 25.78
55 Geneva 29.78 Caracas 31.61 Bangalore 25.59
56 Ho Chi Minh City 29.56 Dubai 30.65 Caracas 25.59
57 Manama 29.56 Manila 30.32 Vancouver 24.50
58 Budapest 28.89 New Delhi 29.68 Miami 24.13
59 Stockholm 28.89 Bandung 29.03 Cairo 22.85
60 Cairo 27.78 Labuan 29.03 Labuan 22.85
61 Seattle 27.56 Houston 28.06 Calgary 21.94
62 Philadelphia 26.89 Vancouver 28.06 Vienna 21.94
63 Lisbon 26.67 Vienna 27.42 Tel Aviv 21.39
64 Guangzhou 26.22 Boston 26.45 Perth 21.02
65 Rio de Janeiro 25.78 Rome 26.45 Shenzhen 20.84
66 Washington 25.56 Philadelphia 25.48 Hanoi 20.66
67 Denver 25.11 Suva 25.48 Edinburgh 20.48
68 Rotterdam 25.11 Edinburgh 24.84 Karachi 20.48
69 Dubai 24.89 Birmingham 24.52 Bogota 19.74
70 Osaka 24.67 Abu Dhabi 23.23 Doha 19.74
71 Vancouver 24.67 Copenhagen 23.23 Birmingham 19.38
72 Hanoi 24.22 Osaka 22.90 New Delhi 19.38
73 Copenhagen 23.11 Washington 22.58 Lima 18.28
74 Rome 23.11 Cologne 21.61 Tianjin 17.92
75 Vienna 23.11 Stuttgart 21.29 Manchester 17.73
76 Nassau 22.67 Guangzhou 20.97 Barcelona 17.00
77 Minneapolis 22.22 Buffalo 20.32 Ho Chi Minh City 16.45
78 Cologne 22.00 Hanoi 20.32 Brisbane 16.09
79 Hamilton 20.89 Montevideo 19.68 Calcutta 16.09
80 Calgary 20.44 Karachi 19.35 Copenhagen 16.09
81 Portland 20.44 Tianjin 19.35 Bucharest 15.72
82 Perth 19.56 Calgary 19.03 Seattle 15.36
83 Stuttgart 18.89 Rotterdam 19.03 Bratislava 15.17
ESPON TIGER Draft Final scientific Report February 2012
40
84 Wellington 18.89 Beirut 18.71 Dusseldorf 14.63
85 Beirut 18.44 Perth 18.71 Osaka 14.63
86 Buffalo 18.44 Bucharest 18.39 Montevideo 14.44
87 Karachi 18.00 Manchester 18.39 Bristol 14.26
88 Brisbane 17.78 Brisbane 17.42 Panama City 14.26
89 Antwerp 17.56 Manama 17.10 Riyadh 14.26
90 Dalian 16.89 Hamilton 16.77 Colombo 13.89
91 Baltimore 16.44 San Diego 16.77 Chennai 13.53
92 Abu Dhabi 16.22 Bratislava 16.45 Glasgow 13.53
93 Montevideo 16.22 Portland 16.45 Berlin 13.35
94 Rochester 16.22 Colombo 16.13 Almaty 13.16
95 Charlotte 16.00 Norwich 16.13 Denver 13.16
96 Strasbourg 16.00 Chennai 15.81 Portland 12.80
97 Bucharest 15.78 Nassau 15.81 Oslo 12.61
98 Panama City 15.78 Seattle 15.16 Philadelphia 12.07
99 Pittsburgh 15.78 Antwerp 14.84 Rio de Janeiro 12.07
100 Kiev 15.11 Yokohama 14.84 Macao 11.88
101 San Diego 15.11 Almaty 14.52 Beirut 11.70
102 St Louis 15.11 Baltimore 14.52 Nicosia 11.70
103 Calcutta 14.89 Bristol 14.52 Hamburg 11.52
104 Oslo 14.89 Genoa 14.52 Minneapolis 11.52
105 Bilbao 14.44 Southampton 14.52 Hartford 11.33
106 Muscat 14.44 Georgetown (Cayman) 14.19 Norwich 11.33
107 Tehran 14.44 Helsinki 14.19 Nottingham 11.33
108 Adelaide 14.22 Kiev 14.19 Antwerp 11.15
109 Kansas City 14.22 Lima 14.19 Hamilton 11.15
110 Tianjin 14.22 Oslo 14.19 Leeds 10.97
111 Almaty 14.00 Tel Aviv 14.19 Nairobi 10.97
112 Edmonton 13.78 Basel 13.87 Wellington 10.97
113 Indianapolis 13.56 Glasgow 13.87 Helsinki 10.79
ESPON TIGER Draft Final scientific Report February 2012
41
114 St Petersburg 13.56 Turin 13.87 Kiev 10.79
115 Nagoya 13.33 Charlotte 13.55 Cologne 10.60
116 Shenzhen 13.33 Edmonton 13.55 Hyderabad (India) 10.60
117 Palo Alto 12.89 Port Louis 13.55 Newcastle 10.42
118 Abidjan 12.67 Ho Chi Minh City 13.23 Tampa 10.24
119 Chennai 12.67 Adelaide 12.90 Sofia 10.05
120 Cincinnati 12.67 Utrecht 12.90 Cardiff 9.87
121 Hartford 12.22 Denver 12.58 Harare 9.87
122 Edinburgh 12.00 Panama City 12.58 Stuttgart 9.87
123 Nairobi 11.78 Calcutta 12.26 Basel 9.69
124 Belo Horizonte 11.56 Leeds 12.26 Georgetown (Cayman) 9.51
125 Jeddah 11.56 Shenzhen 12.26 Port Louis 9.51
126 Riyadh 11.56 Casablanca 11.94 Rotterdam 9.51
127 Harare 11.33 Nicosia 11.94 Cape Town 9.14
128 Manchester 11.33 Cape Town 11.61 Nanjing 9.14
129 Nicosia 11.33 Tehran 11.61 Dhaka 8.96
130 Port Louis 11.33 Bangalore 11.29 Nassau 8.96
131 Windhoek 11.33 Cardiff 11.29 Xiamen 8.96
132 Yangon 11.33 Dhaka 11.29 Abu Dhabi 8.78
133 Utrecht 11.11 Krakow 11.29 Columbus 8.78
134 Birmingham 10.89 Liverpool 11.29 Richmond 8.78
135 Bordeaux 10.89 Pittsburgh 11.29 Sheffield 8.78
136 Detroit 10.89 Amman 10.97 Kansas City 8.41
137 Glasgow 10.89 Lagos 10.97 San Jose (Costa Rica) 8.23
138 Marseille 10.89 Kobe 10.65 The Hague 8.23
139 Turin 10.89 Plymouth 10.65 Liverpool 8.04
140 Winnipeg 10.89 Sheffield 10.65 Plymouth 8.04
141 Bangalore 10.67 Lyon 10.32 Baltimore 7.86
142 Essen 10.67 Medan 10.32 Adelaide 7.68
143 Richmond 10.44 Abidjan 10.00 Kyoto 7.68
ESPON TIGER Draft Final scientific Report February 2012
42
144 Sofia 10.44 Bologna 10.00 Tehran 7.68
145 Yokohama 10.44 Cincinnati 10.00 Aberdeen 7.50
146 Southampton 10.00 Guatemala City 10.00 Kampala 7.50
147 Tampa 10.00 Naples 10.00 Southampton 7.50
148 Lyon 9.78 Newcastle 10.00 Tashkent 7.50
149 Monterrey 9.78 Porto Alegre 10.00 Charlotte 7.31
150 Valencia 9.78 Seville 10.00 Lahore 7.31
151 Colombo 9.56 Belo Horizonte 9.68 Las Vegas 7.31
152 Lausanne 9.56 Bordeaux 9.68 Ottawa 7.31
153 Basel 9.33 Dalian 9.68 Pittsburgh 7.31
154 Casablanca 9.33 Nottingham 9.68 San Diego 7.31
155 Dortmund 9.33 Rochester 9.68 St Petersburg 7.31
156 Phoenix 9.33 Xiamen 9.68 Lagos 7.13
157 San Jose (CA) 9.33 Algiers 9.35 Lusaka 7.13
158 Xiamen 9.33 Dar es Salaam 9.35 Phoenix 6.95
159 Hannover 9.11 Jeddah 9.35 Dalian 6.76
160 Helsinki 9.11 Kampala 9.35 Lyon 6.76
161 Kobe 9.11 Nairobi 9.35 Amman 6.58
162 Leeds 9.11 Aberdeen 9.03 Omaha 6.58
163 Lima 9.11 Essen 9.03 Tegucigalpa 6.58
164 Nuremberg 9.11 Kyoto 9.03 Vilnius 6.58
165 Islamabad 8.89 Nagoya 9.03 Algiers 6.40
166 Lahore 8.89 Quebec 9.03 Santo Domingo 6.40
167 Cleveland 8.67 Quito 9.03 Belfast 6.22
168 Kampala 8.67 Valencia 9.03 Bologna 6.22
169 Lusaka 8.67 Wellington 9.03 Islamabad 6.22
170 Porto Alegre 8.67 Cleveland 8.71 Nagoya 6.22
171 Zagreb 8.67 Curitiba 8.71 Pusan 6.22
172 Kyoto 8.44 Doha 8.71 Quebec 6.22
173 Las Vegas 8.44 Leipzig 8.71 Accra 6.03
ESPON TIGER Draft Final scientific Report February 2012
43
174 Bern 8.22 Sofia 8.71 Casablanca 6.03
175 Leipzig 8.22 Bandar Seri Begawan 8.39 Dar es Salaam 6.03
176 Quebec 8.22 Belgrade 8.39 Utrecht 6.03
177 Tashkent 8.22 Dortmund 8.39 Curitiba 5.85
178 Kingston (Jamaica) 8.00 Strasbourg 8.06 Nuremberg 5.85
179 Sacramento 8.00 Hannover 7.74 Tunis 5.85
180 Bratislava 7.56 Riyadh 7.74 Valencia 5.85
181 Dhaka 7.56 St Petersburg 7.74 Yokohama 5.85
182 Dresden 7.56 Tampa 7.74 Gaborone 5.67
183 Genoa 7.56 Zagreb 7.74 Detroit 5.48
184 Nanjing 7.56 Macao 7.42 Winnipeg 5.48
185 New Orleans 7.56 Minneapolis 7.42 Bandar Seri Begawan 5.30
186 Tel Aviv 7.56 Nuremberg 7.42 Ahmadabad 5.12
187 Asuncion 7.33 Ahmadabad 7.10 Christchurch 5.12
188 Belfast 7.33 Brazilia 7.10 Dakar 5.12
189 Guayaquil 7.33 Hyderabad (India) 7.10 Essen 5.12
190 Lille 7.33 Las Vegas 7.10 Honolulu 5.12
191 Quito 7.33 Lille 7.10 Palo Alto 5.12
192 Bristol 7.11 Pusan 7.10 Sacramento 5.12
193 Accra 6.89 St Louis 7.10 Monterrey 4.94
194 Bandar Seri Begawan 6.89 Accra 6.77 Alexandria 4.75
195 Curitiba 6.89 Lusaka 6.77 Douala 4.75
196 San Salvador 6.89 Malmo 6.77 Hobart 4.75
197 Bandung 6.67 Windhoek 6.77 Kobe 4.75
198 Columbus 6.67 Belfast 6.45 San Jose (CA) 4.75
199 Guadalajara 6.67 Dakar 6.45 San Salvador 4.75
200 Liverpool 6.67 Dresden 6.45 Asuncion 4.57
201 Newcastle 6.67 Lausanne 6.45 Kingston (Jamaica) 4.57
202 Nottingham 6.67 Muscat 6.45 Port of Spain 4.57
203 Ottawa 6.67 Palo Alto 6.45 Canberra 4.39
ESPON TIGER Draft Final scientific Report February 2012
44
204 Amman 6.44 Tashkent 6.45 Genoa 4.39
205 Luanda 6.44 Bern 6.13 Indianapolis 4.39
206 Brazilia 6.22 Douala 6.13 Muscat 4.39
207 Honolulu 6.22 Kinshasa 6.13 New Orleans 4.39
208 Dakar 6.00 Luanda 6.13 Turin 4.39
209 Kinshasa 6.00 Durban 5.81 Zagreb 4.39
210 Kuwait 6.00 Monterrey 5.81 Krakow 4.20
211 Lagos 6.00 Detroit 5.48 Edmonton 4.02
212 Baku 5.78 Phoenix 5.48 La Paz 4.02
213 Port of Spain 5.78 Richmond 5.48 Quito 4.02
214 Algiers 5.56 Guayaquil 5.16 Seville 4.02
215 Naples 5.56 Lahore 5.16 Trieste 4.02
216 San Jose (Costa Rica) 5.56 New Orleans 5.16 Bern 3.84
217 Seville 5.56 San Salvador 5.16 Riga 3.84
218 Medellin 5.33 Sanaa 5.16 Tallin 3.84
219 Omaha 5.33 Tunis 5.16 Baku 3.66
220 Aberdeen 5.11 Arhus 4.84 Belo Horizonte 3.66
221 Cape Town 5.11 Bulawayo 4.84 Cincinnati 3.66
222 Christchurch 5.11 Harare 4.84 Cleveland 3.66
223 Plymouth 5.11 Kansas City 4.84 Guatemala City 3.66
224 Sheffield 5.11 Salvador 4.84 Lausanne 3.66
225 Bologna 4.67 Tallin 4.84 Leipzig 3.66
226 Maputu 4.67 Yangon 4.84 Lille 3.66
227 Penang 4.67 Alexandria 4.52 Rochester 3.66
228 Trieste 4.67 Medellin 4.52 St Louis 3.66
229 Hobart 4.44 Sacramento 4.52 Penang 3.47
230 Malacca 4.44 San Jose (CA) 4.52 Bandung 3.29
231 Norwich 4.44 Gothenburg 4.19 Dortmund 3.29
232 Dar es Salaam 4.22 Honolulu 4.19 Kuwait 3.29
233 La Paz 4.22 Maputu 4.19 Mombasa 3.29
ESPON TIGER Draft Final scientific Report February 2012
45
234 Mombasa 4.22 Mombasa 4.19 Jeddah 3.11
235 Pusan 4.22 Penang 4.19 Yangon 3.11
236 Tunis 4.22 Asuncion 3.87 Belgrade 2.93
237 Doha 4.00 Bergen 3.87 Buffalo 2.93
238 Liege 4.00 Hartford 3.87 Medan 2.93
239 Medan 4.00 Liege 3.87 Naples 2.93
240 Salvador 4.00 Nanjing 3.87 Port Moresby 2.93
241 The Hague 4.00 San Jose (Costa Rica) 3.87 Bulawayo 2.74
242 Ahmadabad 3.56 Bilbao 3.55 Windhoek 2.74
243 Hyderabad (India) 3.56 Kingston (Jamaica) 3.55 Addis Ababa 2.56
244 Macao 3.56 Kuwait 3.55 Bilbao 2.56
245 Gothenburg 3.33 Ljubljana 3.55 Bordeaux 2.56
246 Krakow 3.11 Marseille 3.55 Marseille 2.56
247 Bulawayo 2.89 Santo Domingo 3.55 Strasbourg 2.56
248 Durban 2.89 Gaborone 3.23 Arhus 2.38
249 Palermo 2.89 Malacca 3.23 Dresden 2.19
250 Minsk 2.67 Ottawa 3.23 Hannover 2.19
251 Riga 2.67 Tbilisi 3.23 Porto Alegre 2.19
252 Addis Ababa 2.44 Indianapolis 2.90 Recife 2.19
253 Bergen 2.44 Riga 2.90 Abidjan 1.83
254 Douala 2.44 Ankara 2.58 Brazilia 1.83
255 Guatemala City 2.44 Baku 2.58 Liege 1.83
256 Malmo 2.44 Christchurch 2.58 Ankara 1.65
257 Recife 2.44 Damascus 2.58 Durban 1.46
258 Santo Domingo 2.44 Guadalajara 2.58 Ljubljana 1.46
259 Sarajevo 2.44 Islamabad 2.58 Palermo 1.46
260 Cardiff 2.22 La Paz 2.58 Suva 1.46
261 Gaborone 2.22 Palermo 2.58 Tbilisi 1.46
262 Ankara 1.78 Port of Spain 2.58 Bergen 0.73
263 Damascus 1.78 Recife 2.58 Guayaquil 0.73
ESPON TIGER Draft Final scientific Report February 2012
46
264 Sanaa 1.78 Tegucigalpa 2.58 Malmo 0.73
265 Tbilisi 1.78 Trieste 2.58 Minsk 0.73
266 Tegucigalpa 1.78 Winnipeg 2.58 Salvador 0.73
267 Ljubljana 1.56 Sarajevo 2.26 Sarajevo 0.73
268 Canberra 1.33 Columbus 1.94
269 Linz 0.89 Omaha 1.94
270 Vilnius 0.89 Vilnius 1.94
271 Alexandria 0.67 Port Moresby 1.61
272 Belgrade 0.67 Reykjavik 1.61
273 Georgetown (Cayman) 0.67 Linz 1.29
274 Managua 0.67 Minsk 1.29
275 Reykjavik 0.67 The Hague 1.29
276 Suva 0.67 Addis Ababa 0.97
277 Tallin 0.67 Canberra 0.97
278 Tirana 0.67 Managua 0.97
ESPON TIGER Draft Final scientific Report February 2012
47
Table C: London Investment flows (in $billion) over the 4‐year period 2007‐2010 Source: Authors, data supplied by Real Capital Analytics Inc: http://www.rcanalytics.com
rank from to investment 1 New York London 6.1661 2 London Madrid 5.5947 3 Dublin London 3.9431 4 Madrid London 3.046 5 Boston London 2.7456 6 London Paris 1.4144 7 Bonn London 1.3125 8 Seoul London 1.2762 9 Frankfurt London 1.1732
10 Tokyo London 1.1369 11 Toronto London 1.0736 12 Singapore London 0.9495 13 Newark London 0.9305 14 Washington London 0.9207 15 London Brussels 0.8462 16 Fort Myers London 0.8339 17 Sydney London 0.7872 18 Doha London 0.7715 19 Munich London 0.7064 20 London New York 0.662 21 Muscat London 0.6574 22 Hamburg London 0.5289 23 Beirut London 0.5265 24 Cork London 0.4581 25 Tel Aviv London 0.4515 26 Tripoli London 0.4277 27 Abu Dhabi London 0.3918 28 London Stockholm 0.3774 29 Stockholm London 0.3707 30 London Munich 0.351 31 Zurich London 0.3491 32 Hamilton London 0.3418 33 London Manchester 0.3402 34 Wiesbaden London 0.3354 35 London Seoul 0.3077 36 London Moscow 0.2702 37 Edinburgh London 0.2512 38 London Amsterdam 0.2196 39 London Singapore 0.203 40 London Melbourne 0.2001 41 London Glasgow 0.187 42 London Edinburgh 0.1809 43 London Stuttgart 0.1782 44 London Washington 0.1725 45 London Charlotte 0.171 46 Reykjavic London 0.1681 47 Norwalk, CT London 0.1655

ESPON TIGER Draft Final scientific Report February 2012
48
48 London Newcastle upon Tyne 0.1611 49 Beijing London 0.1536 50 London San Francisco 0.1425 51 London Shanghai 0.1379 52 London Arnhem 0.1277 53 London Birmingham 0.1206 54 Wilmslow London 0.1171 55 Guernsey London 0.1073 56 London Warsaw 0.1061 57 London Horley 0.1034 58 London Milan 0.0836 59 Norwich London 0.0697
ESPON TIGER Draft Final scientific Report February 2012
49
Table D: London Top dyads - change of percentage of sectors over time Source: Authors, data supplied by the Globalization & World Cities (GaWC) Research Network: http://www.lboro.ac.uk/gawc/ 2000 2004 2008 London New York ACC 14.29 14.29 14.29 ADV 14.29 14.29 14.29 FS 42.86 42.86 42.86 LAW 14.29 14.29 14.29 MC 14.29 14.29 14.29 2000 2004 2008 2000 2004 2008London Hong Kong ACC 11.66 16.98 16.96 London Paris ACC 14.66 16.47 16.36 ADV 11.59 12.02 12.44 ADV 10.48 10.54 13.48 FS 50.60 46.28 51.44 FS 46.21 43.11 42.77 LAW 14.47 14.57 9.91 LAW 11.84 14.59 14.39 MC 11.68 10.16 9.24 MC 16.81 15.29 12.99 2000 2004 2008 2000 2004 2008London Tokyo ACC 13.33 15.73 15.42 London Singapore ACC 11.96 14.54 17.90 ADV 10.27 11.86 14.58 ADV 11.25 10.55 13.39 FS 54.48 47.40 49.89 FS 50.19 49.73 50.07 LAW 11.28 12.91 8.91 LAW 12.55 13.01 6.08 MC 10.65 12.09 11.19 MC 14.04 12.16 12.56