Embed Size (px)
Citation preview
Fundão Tailings Dam Review Panel Report on the Immediate Causes of the Failure of the Fundão Dam
August 25, 2016
APPENDIX C Field Geotechnical Data and Interpretation
Fundão Tailings Dam Review Panel Report on the Immediate Causes of the Failure of the Fundão Dam
August 25, 2016 Page C-i
Appendix C Field Geotechnical Data and Interpretation
TABLE OF CONTENTS
C1 INTRODUCTION ............................................................................................................................. 1
C2 PRE-FAILURE INVESTIGATION DATA ............................................................................................. 1 C2.1 General ............................................................................................................................. 1 C2.2 Specific Programs .............................................................................................................. 7
C2.2.1 DeltaGeo (July 2011) ....................................................................................... 7 C2.2.2 DeltaGeo (September 2012 – July 2013) ........................................................ 7 C2.2.3 Fugro (April 2014) ........................................................................................... 7 C2.2.4 Fugro (June 2014 – August 2014) ................................................................... 7 C2.2.5 Fugro (June 2014 – May 2015) ....................................................................... 7 C2.2.6 Fugro (September 2014 – March 2015) ......................................................... 8 C2.2.7 Fugro (March 2015 – July 2015) ..................................................................... 8 C2.2.8 Fugro/Geocontrole (June 2015) ..................................................................... 8
C2.3 Data Reduction ................................................................................................................. 8 C2.4 Data Gaps .......................................................................................................................... 9
C3 PANEL FIELD PROGRAM .............................................................................................................. 10 C3.1 Scope ............................................................................................................................... 10 C3.2 Field Investigation Methods ........................................................................................... 14
C3.2.1 Sharky Sampling of Slimes at GSSAM16-02 .................................................. 14 C3.2.2 In Situ Testing ............................................................................................... 14 C3.2.3 MASW Survey ............................................................................................... 16 C3.2.4 Test Hole Location Survey ............................................................................ 16
C3.3 Laboratory Testing .......................................................................................................... 16 C3.4 Test Results ..................................................................................................................... 17
C3.4.1 Germano Slimes ............................................................................................ 17 C3.4.2 Germano Buttress ......................................................................................... 18 C3.4.3 Germano Pit Dam ......................................................................................... 18 C3.4.4 MASW Surveys .............................................................................................. 19
C4 TEST FILLS .................................................................................................................................... 20 C4.1 Baia 4 .............................................................................................................................. 20 C4.2 2008 Test Fill ................................................................................................................... 22 C4.3 2013 Test Fill ................................................................................................................... 24
C5 SUMMARY ................................................................................................................................... 25
Fundão Tailings Dam Review Panel Report on the Immediate Causes of the Failure of the Fundão DamAppendix C – Field Geotechnical Data and Interpretation
TABLE OF CONTENTS (continued)
August 25, 2016 Page C-ii
List of Tables
Table C2-1 Summary of pre-failure field programs ............................................................................ 4 Table C3-1 2016 Panel field investigation test locations .................................................................. 13 Table C3-2 Summary of lab index testing – “pure” slimes ............................................................... 17 Table C3-3 Summary of seismic and in situ density data – Germano Pit Dam ................................ 19 Table C3-4 Summary of lab index testing – Germano Pit Dam ........................................................ 19 Table C3-5 Summary of vs data (MASW) .......................................................................................... 20 Table C4-1 Summary of Baia 4 stratigraphic profile[38] ..................................................................... 21 Table C4-2 Summary of geotechnical parameters[38] ....................................................................... 21 Table C5-1 Summary of geotechnical parameters ........................................................................... 25
List of Figures
Figure C2-1 Pre-failure geotechnical investigation location plan ........................................................ 3 Figure C2-2 Void ratio/unit weight relationship .................................................................................. 9 Figure C3-1 2016 geotechnical investigation location plan ............................................................... 12 Figure C4-1 Back analysis of the Baia 4 failure completed by UFOP[38] ............................................. 21 Figure C4-2 Example instrumentation response to 2008 test fill[4] ................................................... 23 Figure C4-3 Slimes compressibility characteristics back calculated 2008 test fill ............................. 24 Figure C4-4 Pore pressure response to 2013 test fill ......................................................................... 25
List of Attachments
Attachment C1 Pre-Failure Field Program Data
Attachment C2 ConeTec Field Report
Attachment C3 AFC Geofisica Ltda. Geophysical Survey - MASW Report
Attachment C4 Test Hole Logs
Attachment C5 Photographs of Sharky Samples from GSSAM16-02
Attachment C6 Field Laboratory Test Data
Attachment C7 CPT Interpretative Plots
Attachment C8 Test Fill Data
Fundão Tailings Dam Review Panel Report on the Immediate Causes of the Failure of the Fundão DamAppendix C – Field Geotechnical Data and Interpretation
August 25, 2016 Page C-1
C1 INTRODUCTION
This appendix summarizes the pre-failure geotechnical investigation data available to the Panel and describes the Panel’s 2016 geotechnical data obtained from its field program. The search of the pre-failure data was done with two main goals. The first was to obtain any drill holes or CPTs on the left abutment that penetrated the slimes that were thought to be present between elevations 830 m and 850 m based on slimes mapping in Appendix B. Although a 2014-2015 CPT beach program on the left abutment was found that provided reliable sand tailings information, none of the profiles penetrated 850 m. The second goal was to obtain engineering properties of the tailings from in situ measurements prior to failure. That goal was partially met. While field data acquisition followed local practice, there were many uncertainties as to the quality of the pre-failure data so the Panel mounted its own field investigation.
Section C2 lists the field investigation programs that were identified and reviewed by the Panel. The most valuable of these programs are described in more detail in Section C2 with data featured in Attachment C1. Section C3 describes the Panel investigation program. The Panel program was designed to determine the three basic tailings profiles which would have existed at Fundão: sand tailings with no slimes, interbedded slimes and sands where the interbedding ranges from discrete layering to mixing of sand tailings and slimes, and slimes with no sand tailings. The Panel selected locations that served as proxies for all three profiles: Germano Buttress and Germano Pit Dam for sand tailings and two other locations on the Germano plateau for slimes and interbedded slimes and sand tailings.
Three investigation contractors were used for the Panel investigation. The first was the Brazilian affiliation of Fugro, the second was Pattrol, a Brazilian firm, and the third was ConeTec, a Canadian cone testing contractor. Fugro had done much work at Samarco, whereas ConeTec had never been to the site. Most of the Panel investigation program was done with ConeTec to be independent of past investigation practice. Pattrol had a minor role in supplying field equipment but also did laboratory testing as described in Appendix D.
Section C4 describes the Baia 4 dike failure in 2005 and derives strength parameters by back analyses. Two other instrumented trial embankments are also described in Section C4.
C2 PRE-FAILURE INVESTIGATION DATA
C2.1 General
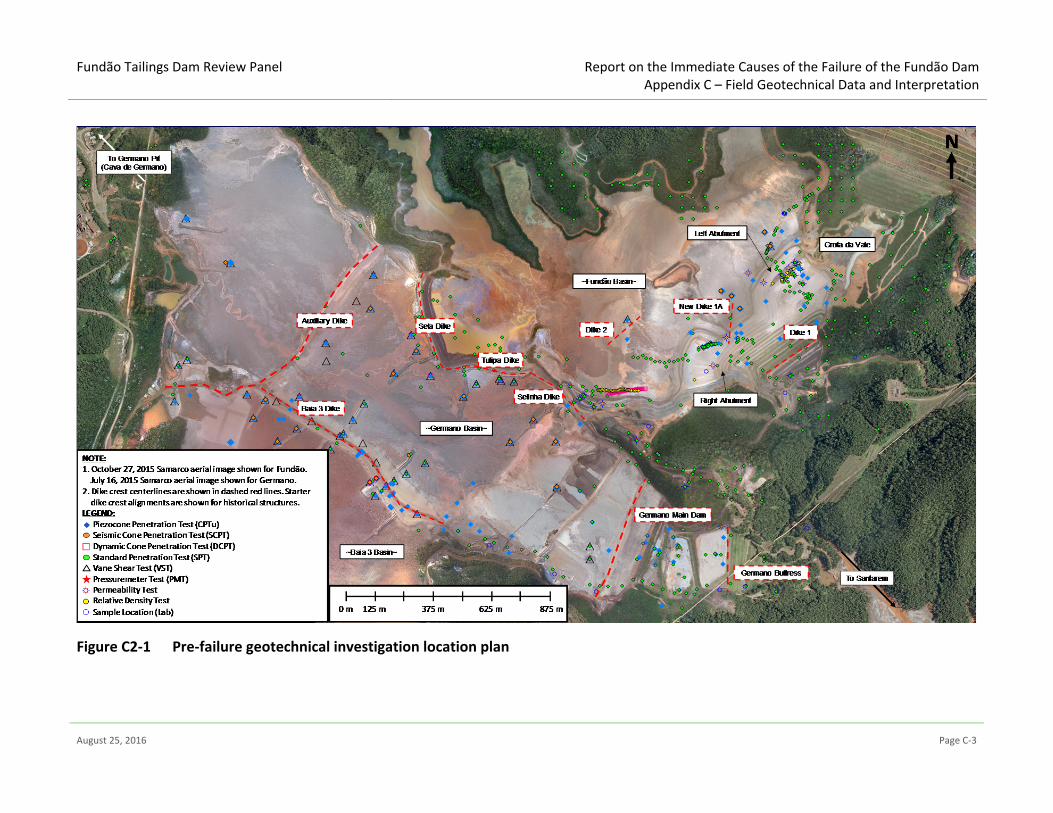
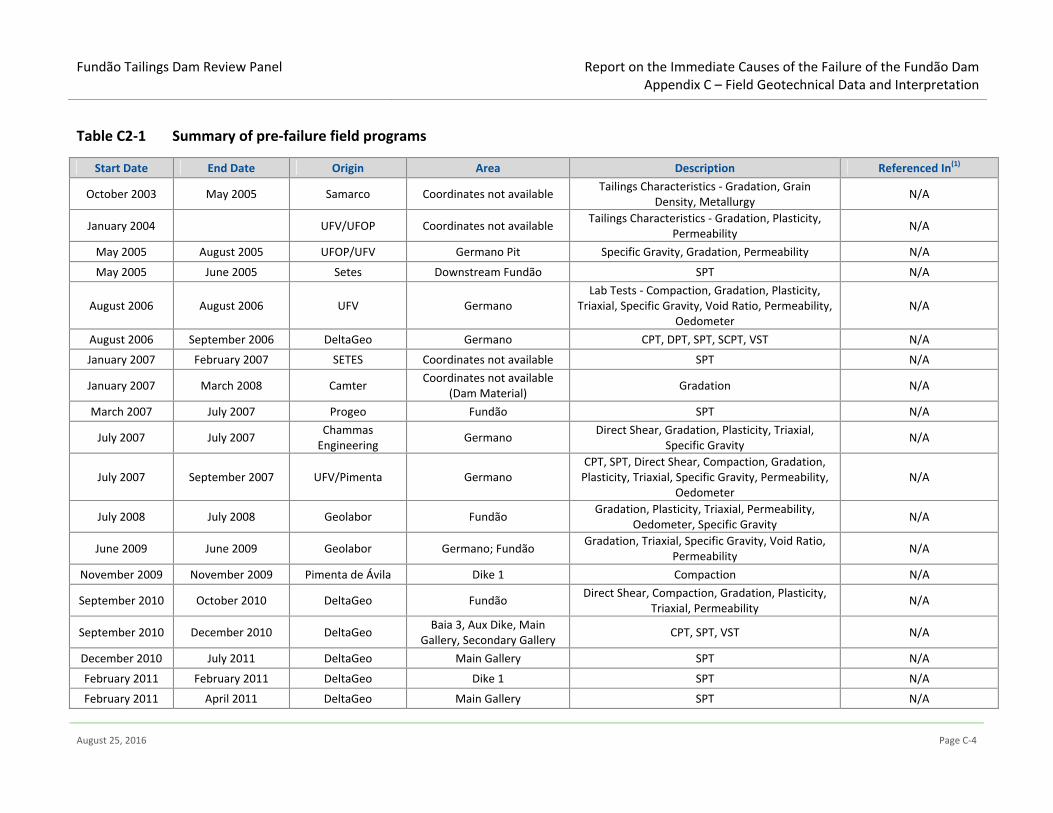
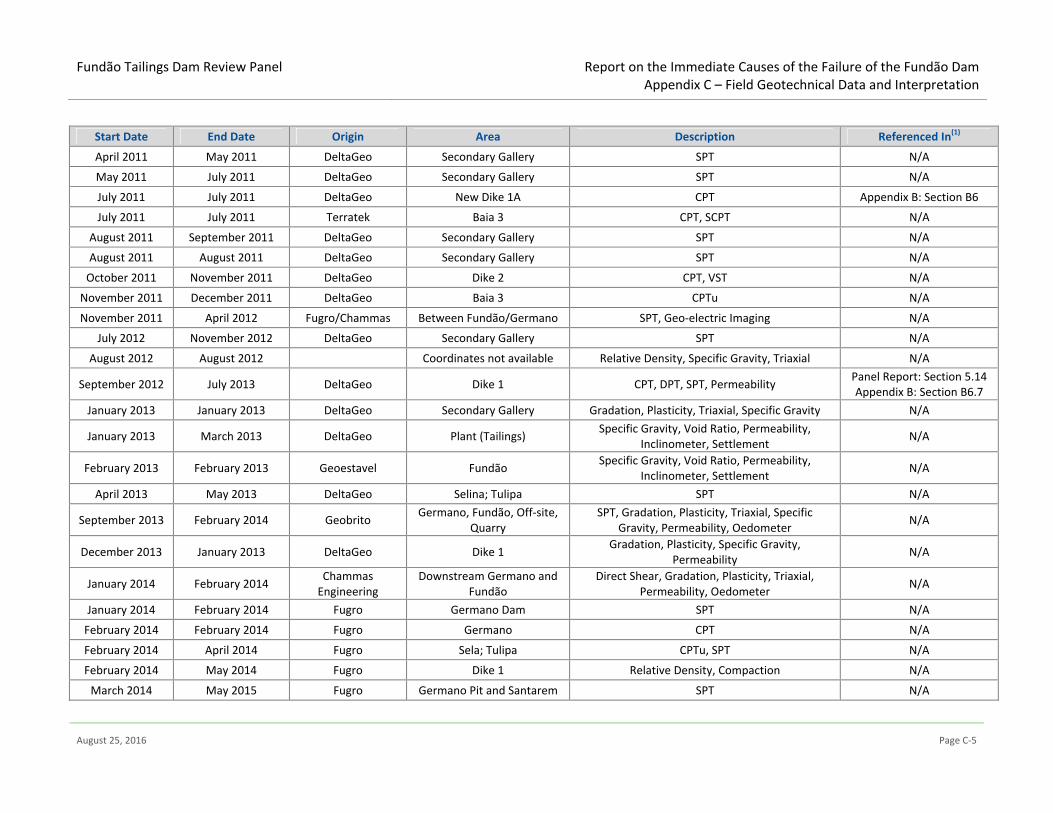
The numerous pre-failure field investigation programs are compiled and listed in Table C 2-1 below. Figure C 2-1 shows the locations of selected past drill holes and CPT locations by Samarco. Past investigation programs were first filtered by keyword from the master spreadsheet of available Samarco reports and data sources; primarily in Portuguese. After translation into English, the coordinates and elevations of the data were confirmed. Then the field data was evaluated and tabulated.
Fundão Tailings Dam Review Panel Report on the Immediate Causes of the Failure of the Fundão DamAppendix C – Field Geotechnical Data and Interpretation
August 25, 2016 Page C-2
Some of the data in Table C 2-1 was more useful to the Panel than others. Where the field data was used directly in the Panel Investigation, that utility is referenced in the right hand column of the table. Where the program was used directly in the Panel Investigation, the data is given in Attachment C1 of this appendix.
The investigation data in Table C 2-1 may or may not have been included in an engineering report. In many cases, the data by itself was found in the Samarco database. Thus, the description of the program in the table is the sole reference to that data source.
Fundão Tailings Dam Review Panel Report on the Immediate Causes of the Failure of the Fundão DamAppendix C – Field Geotechnical Data and Interpretation
August 25, 2016 Page C-3
Figure C 2-1 Pre-failure geotechnical investigation location plan
Fundão Tailings Dam Review Panel Report on the Immediate Causes of the Failure of the Fundão DamAppendix C – Field Geotechnical Data and Interpretation
August 25, 2016 Page C-4
Table C 2-1 Summary of pre-failure field programs
Start Date End Date Origin Area Description Referenced In(1)
October 2003 May 2005 Samarco Coordinates not available Tailings Characteristics - Gradation, Grain Density, Metallurgy N/A
January 2004 UFV/UFOP Coordinates not available Tailings Characteristics - Gradation, Plasticity, Permeability N/A
May 2005 August 2005 UFOP/UFV Germano Pit Specific Gravity, Gradation, Permeability N/A
May 2005 June 2005 Setes Downstream Fundão SPT N/A
August 2006 August 2006 UFV Germano Lab Tests - Compaction, Gradation, Plasticity,
Triaxial, Specific Gravity, Void Ratio, Permeability, Oedometer
N/A
August 2006 September 2006 DeltaGeo Germano CPT, DPT, SPT, SCPT, VST N/A
January 2007 February 2007 SETES Coordinates not available SPT N/A
January 2007 March 2008 Camter Coordinates not available (Dam Material) Gradation N/A
March 2007 July 2007 Progeo Fundão SPT N/A
July 2007 July 2007 Chammas Engineering Germano Direct Shear, Gradation, Plasticity, Triaxial,
Specific Gravity N/A
July 2007 September 2007 UFV/Pimenta Germano CPT, SPT, Direct Shear, Compaction, Gradation,
Plasticity, Triaxial, Specific Gravity, Permeability, Oedometer
N/A
July 2008 July 2008 Geolabor Fundão Gradation, Plasticity, Triaxial, Permeability, Oedometer, Specific Gravity N/A
June 2009 June 2009 Geolabor Germano; Fundão Gradation, Triaxial, Specific Gravity, Void Ratio, Permeability N/A
November 2009 November 2009 Pimenta de Ávila Dike 1 Compaction N/A
September 2010 October 2010 DeltaGeo Fundão Direct Shear, Compaction, Gradation, Plasticity, Triaxial, Permeability N/A
September 2010 December 2010 DeltaGeo Baia 3, Aux Dike, Main Gallery, Secondary Gallery CPT, SPT, VST N/A
December 2010 July 2011 DeltaGeo Main Gallery SPT N/A
February 2011 February 2011 DeltaGeo Dike 1 SPT N/A
February 2011 April 2011 DeltaGeo Main Gallery SPT N/A
Fundão Tailings Dam Review Panel Report on the Immediate Causes of the Failure of the Fundão DamAppendix C – Field Geotechnical Data and Interpretation
August 25, 2016 Page C-5
Start Date End Date Origin Area Description Referenced In(1)
April 2011 May 2011 DeltaGeo Secondary Gallery SPT N/A
May 2011 July 2011 DeltaGeo Secondary Gallery SPT N/A
July 2011 July 2011 DeltaGeo New Dike 1A CPT Appendix B: Section B6
July 2011 July 2011 Terratek Baia 3 CPT, SCPT N/A
August 2011 September 2011 DeltaGeo Secondary Gallery SPT N/A
August 2011 August 2011 DeltaGeo Secondary Gallery SPT N/A
October 2011 November 2011 DeltaGeo Dike 2 CPT, VST N/A
November 2011 December 2011 DeltaGeo Baia 3 CPTu N/A
November 2011 April 2012 Fugro/Chammas Between Fundão/Germano SPT, Geo-electric Imaging N/A
July 2012 November 2012 DeltaGeo Secondary Gallery SPT N/A
August 2012 August 2012 Coordinates not available Relative Density, Specific Gravity, Triaxial N/A
September 2012 July 2013 DeltaGeo Dike 1 CPT, DPT, SPT, Permeability Panel Report: Section 5.14 Appendix B: Section B6.7
January 2013 January 2013 DeltaGeo Secondary Gallery Gradation, Plasticity, Triaxial, Specific Gravity N/A
January 2013 March 2013 DeltaGeo Plant (Tailings) Specific Gravity, Void Ratio, Permeability, Inclinometer, Settlement N/A
February 2013 February 2013 Geoestavel Fundão Specific Gravity, Void Ratio, Permeability, Inclinometer, Settlement N/A
April 2013 May 2013 DeltaGeo Selina; Tulipa SPT N/A
September 2013 February 2014 Geobrito Germano, Fundão, Off-site, Quarry
SPT, Gradation, Plasticity, Triaxial, Specific Gravity, Permeability, Oedometer N/A
December 2013 January 2013 DeltaGeo Dike 1 Gradation, Plasticity, Specific Gravity, Permeability N/A
January 2014 February 2014 Chammas Engineering
Downstream Germano and Fundão
Direct Shear, Gradation, Plasticity, Triaxial, Permeability, Oedometer N/A
January 2014 February 2014 Fugro Germano Dam SPT N/A
February 2014 February 2014 Fugro Germano CPT N/A
February 2014 April 2014 Fugro Sela; Tulipa CPTu, SPT N/A
February 2014 May 2014 Fugro Dike 1 Relative Density, Compaction N/A
March 2014 May 2015 Fugro Germano Pit and Santarem SPT N/A
Fundão Tailings Dam Review Panel Report on the Immediate Causes of the Failure of the Fundão DamAppendix C – Field Geotechnical Data and Interpretation
August 25, 2016 Page C-6
Start Date End Date Origin Area Description Referenced In(1)
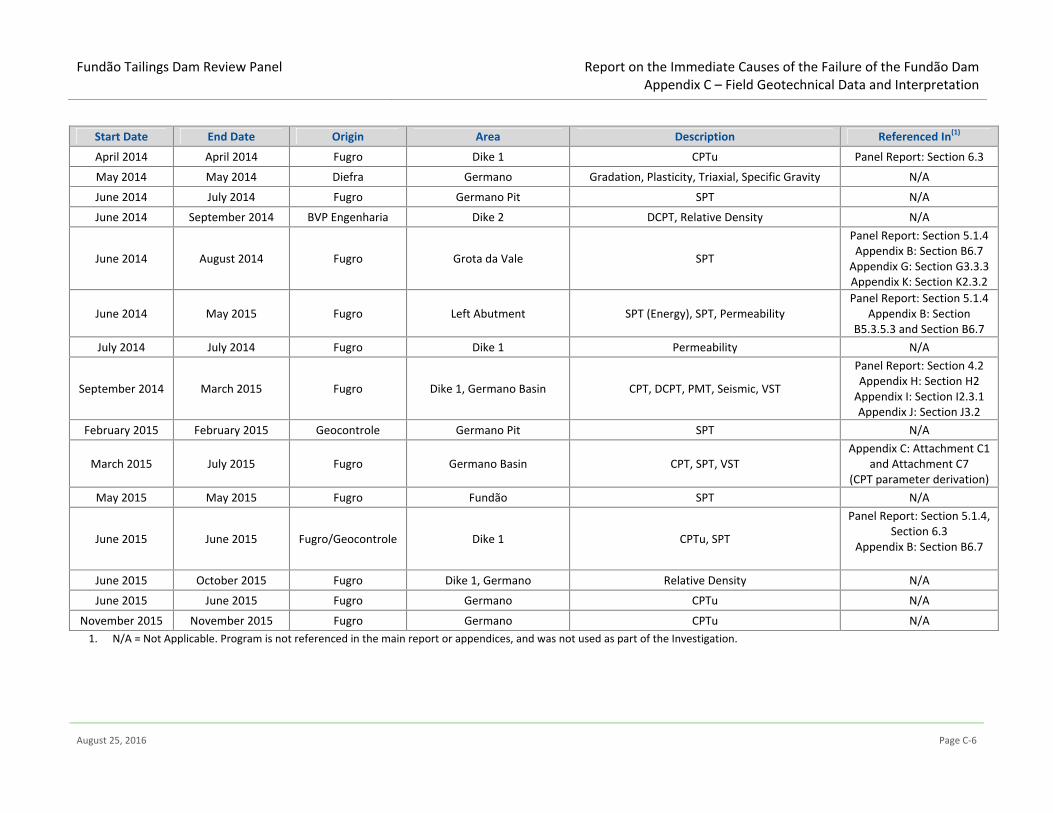
April 2014 April 2014 Fugro Dike 1 CPTu Panel Report: Section 6.3
May 2014 May 2014 Diefra Germano Gradation, Plasticity, Triaxial, Specific Gravity N/A
June 2014 July 2014 Fugro Germano Pit SPT N/A
June 2014 September 2014 BVP Engenharia Dike 2 DCPT, Relative Density N/A
June 2014 August 2014 Fugro Grota da Vale SPT
Panel Report: Section 5.1.4 Appendix B: Section B6.7
Appendix G: Section G3.3.3 Appendix K: Section K2.3.2
June 2014 May 2015 Fugro Left Abutment SPT (Energy), SPT, Permeability Panel Report: Section 5.1.4
Appendix B: Section B5.3.5.3 and Section B6.7
July 2014 July 2014 Fugro Dike 1 Permeability N/A
September 2014 March 2015 Fugro Dike 1, Germano Basin CPT, DCPT, PMT, Seismic, VST
Panel Report: Section 4.2 Appendix H: Section H2
Appendix I: Section I2.3.1 Appendix J: Section J3.2
February 2015 February 2015 Geocontrole Germano Pit SPT N/A
March 2015 July 2015 Fugro Germano Basin CPT, SPT, VST Appendix C: Attachment C1
and Attachment C7 (CPT parameter derivation)
May 2015 May 2015 Fugro Fundão SPT N/A
June 2015 June 2015 Fugro/Geocontrole Dike 1 CPTu, SPT
Panel Report: Section 5.1.4, Section 6.3
Appendix B: Section B6.7
June 2015 October 2015 Fugro Dike 1, Germano Relative Density N/A
June 2015 June 2015 Fugro Germano CPTu N/A
November 2015 November 2015 Fugro Germano CPTu N/A 1. N/A = Not Applicable. Program is not referenced in the main report or appendices, and was not used as part of the Investigation.
Fundão Tailings Dam Review Panel Report on the Immediate Causes of the Failure of the Fundão DamAppendix C – Field Geotechnical Data and Interpretation
August 25, 2016 Page C-7
C2.2 Specific Programs
The data from pre-failure field programs used by the Panel is described below. Interpretative CPT plots produced by KCB and other data reduction results are given by program name in Attachment C1.
C2.2.1 DeltaGeo (July 2011)
DeltaGeo undertook an investigation in July, 2011 along the crest of New Dike 1A at about El. 823 m. The investigation comprised 4 cone penetration tests (CPTu) with pore pressure measurements. The purpose of New Dike 1A was to keep active sand deposition in the Dike 1 reservoir away from the area of the Main Gallery jet grouting repairs. The four CPT profiles show little evidence of slimes. Two of the four CPTs met refusal at about El. 808 m. A plan of this program is presented in Attachment C1, Figure C.C1-1.
C2.2.2 DeltaGeo (September 2012 – July 2013)
DeltaGeo completed an extensive field test program between September, 2012 and July, 2013. The investigation included 6 CPTs, 52 Standard Penetration Tests (SPTs), 41 Dynamic Cone Penetration Tests (DPT), and 52 permeability tests. Only the locations of the June, 2013 CPTs are presented together with the CPT profiles. Much of the rest of the program was on natural ground so is not relevant to the Panel Investigation on tailings. There are minor indications of slimes in CPTu-04.
A plan of the CPT holes is presented in Attachment C1, Figure C.C1-2.
C2.2.3 Fugro (April 2014)
Fugro completed six CPTs in April, 2014, spanning across Dike 1. These holes were limited in depth, but provided information on the ground condition near the instability that developed in August, 2014.
A plan of these tests can be found in Attachment C1, Figure C.C1-3.
C2.2.4 Fugro (June 2014 – August 2014)
Fugro undertook an investigation from June, 2014 to August, 2014 in Grota da Vale. The investigation included 8 SPTs. The data was reviewed to assess the presence of slimes. A location plan for these SPTs is included in Attachment C1, Figures C.C1-4.
C2.2.5 Fugro (June 2014 – May 2015)
Between June, 2014 and May, 2015, Fugro installed 32 piezometers on Fundão Dam (Dike 1). At 10 of these piezometers, there were permeability tests done. Generally, there was an installation log and a SPT log for each piezometer installation. The piezometers were reviewed to determine the piezometric elevation across Fundão Dam and specifically across the left abutment. A plan of these tests is presented on Figure C.C1-5 with several SPT logs.
Fundão Tailings Dam Review Panel Report on the Immediate Causes of the Failure of the Fundão DamAppendix C – Field Geotechnical Data and Interpretation
August 25, 2016 Page C-8
C2.2.6 Fugro (September 2014 – March 2015)
Fugro completed an investigation between September, 2014 and March, 2015 across Fundão (near Dike 1) and across the Germano basin. The investigation across Fundão comprised 6 CPTs and 5 SCPTs. The remaining 23 CPTs, 21 SCPTs, 2 pressuremeter tests (PMT), 16 vane shear tests (VST) and 2 pore pressure dissipation tests were undertaken across the Germano basin. Apageo, a separate drilling company from Fugro, completed the PMTs. A location plan of these tests is presented on Figure C.C1-6.
The CPT data was reviewed to assess the presence of slimes. CPTs F-01, F-02, F-04, and F-05 show slimes present across Fundão, specifically upstream of the left abutment and near the Fundão basin island, all above El. 850 m. Interpretative CPT logs are provided in Attachment C1, following Figure C.C1-6.
C2.2.7 Fugro (March 2015 – July 2015)
Fugro completed a field program between March, 2015 and July, 2015 across the Germano basin. The investigation comprised 26 CPTs, 15 SPTs, and 12 VSTs. A location plan is provided in Attachment C1, Figure C.C1-7 with interpretative CPT logs.
C2.2.8 Fugro/Geocontrole (June 2015)
In June, 2015, Fugro and Geocontrole completed a number of tests at Fundão. Fugro performed 9 CPTs, while Geocontrole performed 8 SPTs.
A 2016 VOGBR study[37] used the SPT and CPT data independently to determine the liquefaction susceptibility of the region. The CPT data analysis showed that the region was more susceptible to liquefaction than inferred from the SPT data analysis. The report notes that since SPTs may be affected more easily by procedural errors than CPTs, the SPT results should be disregarded.
A location plan is included in Attachment C1, Figure C.C1-8. SPT logs and interpretative CPT logs are also provided.
C2.3 Data Reduction
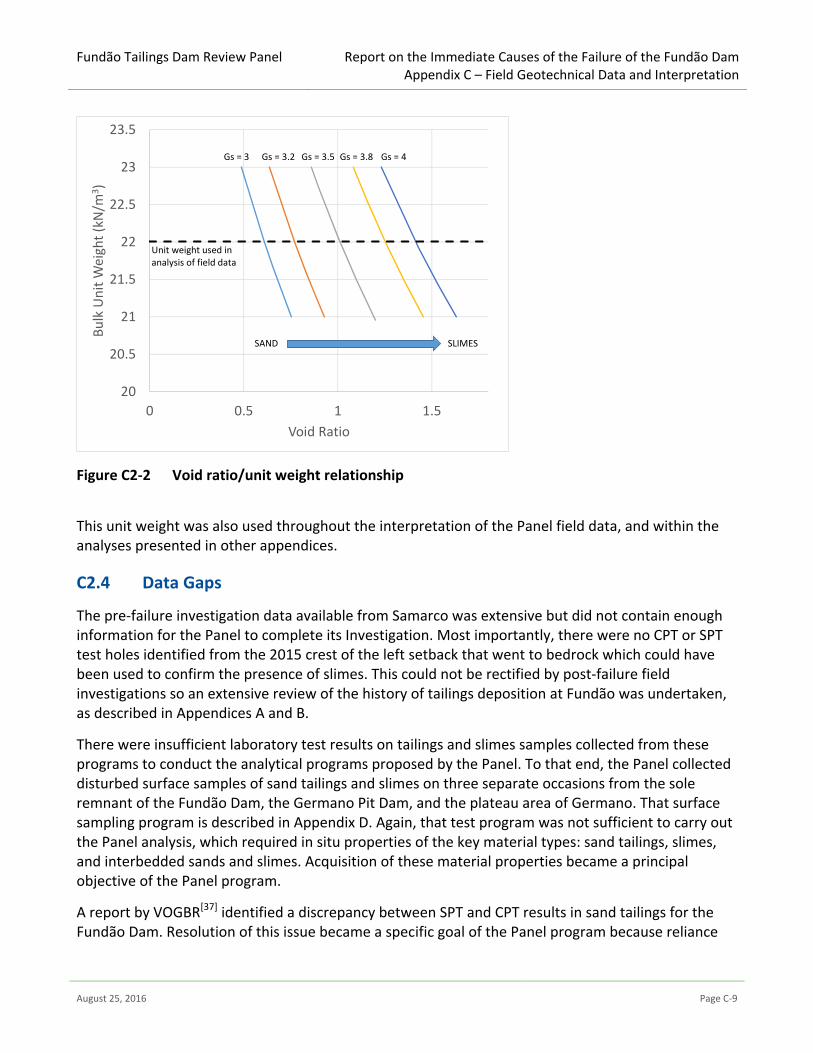
Where raw data was available from the pre-failure programs, the data was processed using standard methods to establish a common format for interpretation. In light of the expected range of specific gravity and void ratio for the sand and slimes, a single bulk unit weight of 22 kN/m3 was applied to all materials in our interpretation. The variation of saturated bulk unit weight with specific gravity and void ratio is calculated using the following formula: = , and is illustrated on Figure C 2-2.
Fundão Tailings Dam Review Panel Report on the Immediate Causes of the Failure of the Fundão DamAppendix C – Field Geotechnical Data and Interpretation
August 25, 2016 Page C-9
Figure C 2-2 Void ratio/unit weight relationship
This unit weight was also used throughout the interpretation of the Panel field data, and within the analyses presented in other appendices.
C2.4 Data Gaps
The pre-failure investigation data available from Samarco was extensive but did not contain enough information for the Panel to complete its Investigation. Most importantly, there were no CPT or SPT test holes identified from the 2015 crest of the left setback that went to bedrock which could have been used to confirm the presence of slimes. This could not be rectified by post-failure field investigations so an extensive review of the history of tailings deposition at Fundão was undertaken, as described in Appendices A and B.
There were insufficient laboratory test results on tailings and slimes samples collected from these programs to conduct the analytical programs proposed by the Panel. To that end, the Panel collected disturbed surface samples of sand tailings and slimes on three separate occasions from the sole remnant of the Fundão Dam, the Germano Pit Dam, and the plateau area of Germano. That surface sampling program is described in Appendix D. Again, that test program was not sufficient to carry out the Panel analysis, which required in situ properties of the key material types: sand tailings, slimes, and interbedded sands and slimes. Acquisition of these material properties became a principal objective of the Panel program.
A report by VOGBR[37] identified a discrepancy between SPT and CPT results in sand tailings for the Fundão Dam. Resolution of this issue became a specific goal of the Panel program because reliance
20
20.5
21
21.5
22
22.5
23
23.5
0 0.5 1 1.5
Bulk
Uni
t Wei
ght (
kN/m
3 )
Void Ratio
Gs = 3 Gs = 3.2 Gs = 3.5 Gs = 3.8 Gs = 4
Unit weight used in analysis of field data
SAND SLIMES
Fundão Tailings Dam Review Panel Report on the Immediate Causes of the Failure of the Fundão DamAppendix C – Field Geotechnical Data and Interpretation
August 25, 2016 Page C-10
on one or the other data set would have led to much different conclusions about liquefaction susceptibility. That resolution is described in the next section.
Several CPTu Fundão beach profiles by Samarco contained reliable data that could be used by the Panel for standard liquefaction susceptibility assessments of the sand tailings. However, the Panel required additional downhole shear wave velocity data, which had to be obtained to proceed with any seismic shaking analysis. Thus, the Panel designed a program using a seismic CPTu cone to collect this data on every profile. Additionally, MASW (Multichannel Analysis of Surface Waves) tests were done at several locations by a Brazilian contractor to obtain data in the weathered phyllite for seismic shaking analysis using SHAKE2000 (see Appendix J).
In general, the properties of the slimes were not well quantified in past in situ investigations. There was a lack of vane shear su data, shear wave velocity data, and laboratory test results on undisturbed samples. Obtaining properties of the slimes also became a principal objective of the Panel program.
The Baia 4 Dike on Germano failed by static liquefaction during raising in September, 2005. Back analysis of this failure was done to estimate large-strain strengths of the interbedded sands and slimes at this location. The original field investigation program through the interbedded tailings sand and slimes lacked some data, so SCPTu profiling through interbedded sands and slimes was added to the Panel program.
C3 PANEL FIELD PROGRAM
C3.1 Scope
To close the data gaps identified above, the Panel completed a field investigation program between April 19 and May 27, 2016 at locations on the Germano tailings impoundment and the Germano Pit tailings impoundment. The Panel program included SCPTu with downhole shear wave velocity, compressional wave velocity, and resistivity in all three material types, “undisturbed” sampling (Sharky samples) of the slimes, vane shear tests in the slimes, and SPTs in the sand tailings.
The ConeTec field report is included as Attachment C2. Their cone equipment was attached to Pattrol’s equipment at first, and later to a D8 bulldozer. Fugro supplied a drilling rig and personnel to conduct SPTs. Personnel from TÜV SÜD, a Brazilian engineering company, were present during most of the Panel investigation. KCB designed the investigation under the direction of the Panel and attended some of the field work, especially the first part of each testing type where techniques had to be developed in the field.
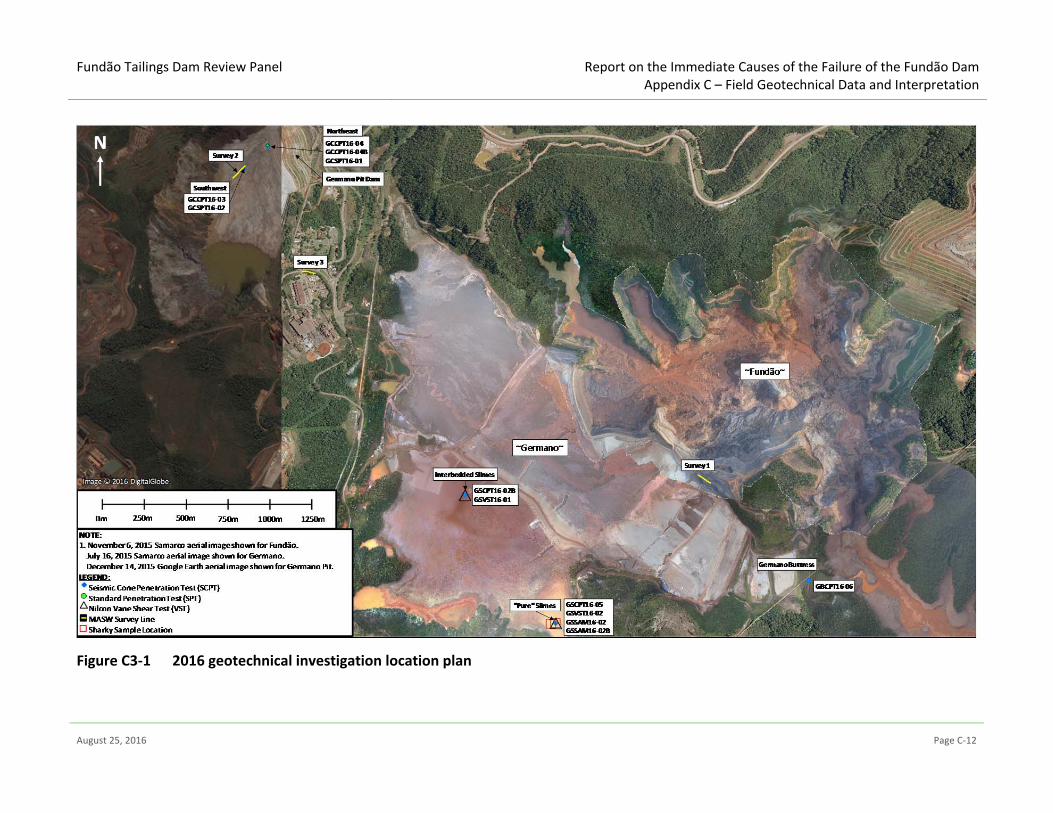
The investigation locations are shown on Figure C 3-1. The test holes are numbered to reflect the test location and the testing type. The test holes start with one of the following two letters to denote general location:
GS = Germano Slimes GB = Germano Buttress GC = Germano Pit Dam (Germano “Cava”)
Fundão Tailings Dam Review Panel Report on the Immediate Causes of the Failure of the Fundão DamAppendix C – Field Geotechnical Data and Interpretation
August 25, 2016 Page C-11
Figure C 3-1 shows two locations on the plateau of the Germano tailing impoundment where the test locations start with “GS”. The area marked “Interbedded Slimes” was drilled from an existing rockfill berm that had been pushed out over interbedded sands and slimes many years ago. The tailings would have consolidated under this rockfill weight over the period of loading. The other location with test locations marked “GS” is marked “pure” slimes. A berm had to be constructed to access this area of ponded water over slimes. Samarco pumps pond water from this location so this is likely the low point in the impoundment. The other two locations GB and GC were on sand tailings; GB on the 825/845 m berms on the Germano Buttress and GC on the beach of the Germano Pit dam. The test hole locations and test types are listed on Table C 3-1.
In addition, the test hole numbering includes the following to identify the test type:
GS/GB/GC-xx-16-yy
Where:
xx signifies the type of investigation: • CPT = Cone penetration test • VST = Field vane • SPT = Standard penetration test • SAM = Samples • DEN = In situ density test
yy signifies the test hole number (01, 02, 03, etc.) The completed field investigations included:
Germano Slimes (2 locations at “pure slimes” and “interbedded” sands and slimes): 2 Seismic Cone Penetration Test (SCPT) holes 2 boreholes for Nilcon field vane tests 2 boreholes for collection of Sharky samples of the slimes
Germano Buttress (two locations): 1 Seismic Cone Penetration Test (SCPT) hole (4 attempts met refusal)
Germano Pit Dam crest (two locations): 3 Seismic Cone Penetration Test (SCPT) holes 2 boreholes for Standard Penetration Tests (SPT), including energy measurements and for
the collection of samples
MASW surveys: 3 MASW surveys - Multi-channel analysis of surface waves (MASW)
Samples collected from the boreholes were used for index testing; including moisture contents, specific gravity and particle size distribution (PSD). A summary of the sampling and testing at each location is presented in Table C 3-1 and is described later in this appendix.
The following section summarizes the field investigation procedures.
Fundão Tailings Dam Review Panel Report on the Immediate Causes of the Failure of the Fundão DamAppendix C – Field Geotechnical Data and Interpretation
August 25, 2016 Page C-12
Figure C 3-1 2016 geotechnical investigation location plan
Fundão Tailings Dam Review Panel Report on the Immediate Causes of the Failure of the Fundão DamAppendix C – Field Geotechnical Data and Interpretation
August 25, 2016 Page C-13
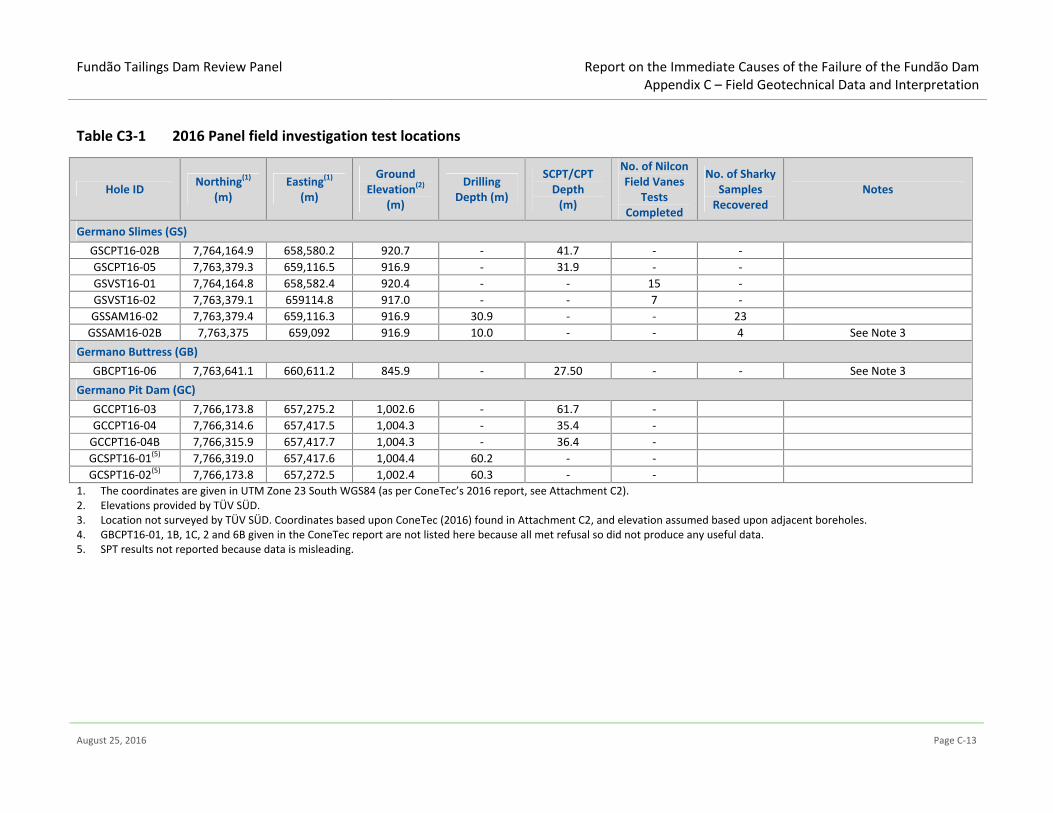
Table C 3-1 2016 Panel field investigation test locations
Hole ID Northing(1)
(m) Easting(1)
(m)
Ground Elevation(2)
(m)
Drilling Depth (m)
SCPT/CPT Depth
(m)
No. of Nilcon Field Vanes
Tests Completed
No. of Sharky Samples
Recovered Notes
Germano Slimes (GS) GSCPT16-02B 7,764,164.9 658,580.2 920.7 - 41.7 - - GSCPT16-05 7,763,379.3 659,116.5 916.9 - 31.9 - - GSVST16-01 7,764,164.8 658,582.4 920.4 - - 15 - GSVST16-02 7,763,379.1 659114.8 917.0 - - 7 - GSSAM16-02 7,763,379.4 659,116.3 916.9 30.9 - - 23
GSSAM16-02B 7,763,375 659,092 916.9 10.0 - - 4 See Note 3 Germano Buttress (GB)
GBCPT16-06 7,763,641.1 660,611.2 845.9 - 27.50 - - See Note 3 Germano Pit Dam (GC)
GCCPT16-03 7,766,173.8 657,275.2 1,002.6 - 61.7 - GCCPT16-04 7,766,314.6 657,417.5 1,004.3 - 35.4 -
GCCPT16-04B 7,766,315.9 657,417.7 1,004.3 - 36.4 - GCSPT16-01(5) 7,766,319.0 657,417.6 1,004.4 60.2 - - GCSPT16-02(5) 7,766,173.8 657,272.5 1,002.4 60.3 - -
1. The coordinates are given in UTM Zone 23 South WGS84 (as per ConeTec’s 2016 report, see Attachment C2). 2. Elevations provided by TÜV SÜD. 3. Location not surveyed by TÜV SÜD. Coordinates based upon ConeTec (2016) found in Attachment C2, and elevation assumed based upon adjacent boreholes. 4. GBCPT16-01, 1B, 1C, 2 and 6B given in the ConeTec report are not listed here because all met refusal so did not produce any useful data. 5. SPT results not reported because data is misleading.
Fundão Tailings Dam Review Panel Report on the Immediate Causes of the Failure of the Fundão DamAppendix C – Field Geotechnical Data and Interpretation
August 25, 2016 Page C-14
C3.2 Field Investigation Methods
C3.2.1 Sharky Sampling of Slimes at GSSAM16-02
Sharky sampler boreholes were completed at two slimes locations in GSSAM16-02 and GSSAM16-02B. These test holes were completed using a Boart Longyear LX6 rig. The sampler was operated by ConeTec. The Sharky sampling system procedure is described in Attachment C2.
This method was used to obtain a continuous series of slimes samples that were used for index property and triaxial testing. The Sharky samples were sealed, and were transported to Samarco’s on site laboratory for index testing. Four slimes samples were taken in GSSAM16-02B and shipped to Pattrol’s geotechnical laboratory in Belo Horizonte for triaxial tests which are given in Attachment D7.
C3.2.2 In Situ Testing
In situ testing consisted of a combination of SCPTs, SPTs with energy measurements, and Nilcon vane tests and MASW surveys. The Nilcon field vanes were conducted in the slime deposits and the SPTs with energy measurements were conducted on the sand tailings. The SCPTs were undertaken on both the slimes and sand tailings deposits.
The SPT energy measurements, SCPTs, and Nilcon Vane tests were completed by ConeTec (see Attachment C2). The SPTs were done by Fugro and the MASW survey was conducted by AFC Geofisica Ltda. (see Attachment C3).
The SCPTs were carried out using a seismic piezocone with either 10 cm2 or 15 cm2 end areas, a net area ratio of 0.8 and a 60 degree apex angle. Tip resistance and sleeve friction measurements were collected at 0.05 m depth intervals while the cone was pushed into the ground at a rate of 2 cm/s. Dynamic pore pressure measurements were taken continuously during each SCPT test using a pore pressure filter located in the u2 position directly behind the cone tip. The Panel tests are not differentiated from each other using the designation CPTu, since, unlike the pre-failure tests, the “u” is common to all of the Panel testing. Pore pressure dissipation tests were undertaken in all test holes at selected depth intervals to give an indication of the static pore pressure. The seismic measurements were made during the SCPTs using a horizontal geophone that was incorporated within the cone, approximately 0.2 m behind the tip. The geophone recorded shear waves and compression waves that were generated at the ground surface.
The Nilcon vane tests were generally completed using a 110 mm and 50 mm diameter vane (GSVST16-01) and a 150 mm and 75 mm diameter vane (GSVST16-01 and GSVST16-02). “Peak”, “residual” and “remolded” undrained shear strengths were generally recorded during these tests. The vane shear test results are given on the nearest CPT profile.
Shear wave velocity was determined at three locations using MASW by AFC Geofisica Ltda. (AFC) along 100 m survey lines. The equipment included a Geode seismograph with 24 channels, which was connected to two spread cables with 12 take-outs, which were attached to 24 vertical 4.5 Hz geophones. The survey was conducted at the three locations shown on Figure C 3-1.
Fundão Tailings Dam Review Panel Report on the Immediate Causes of the Failure of the Fundão DamAppendix C – Field Geotechnical Data and Interpretation
August 25, 2016 Page C-15
MASW is a surface geophysical technique in which energy is input to the ground (typically a hammer blow to a surface metal plate) with measurement of surface waves at the geophones using the seismograph. The shear wave velocity with depth is inferred from inversion software. Shear wave velocity is not directly measured. The average S-wave velocities are used to classify the site according to the criteria established by the IBC – International Building Code (2015).
A summary of the tests completed at each location is provided in the following sections.
C3.2.2.1 Germano Slimes
On the Germano plateau, separate SCPT and Nilcon Vane holes were completed at both locations. The vane testing holes were offset approximately 3 m from the CPT holes. Seismic shear wave measurements were collected by the seismic cone penetrometer at depth intervals of 1 m. Nilcon vane tests were completed at approximately 1 m depth intervals. The Nilcon vane test holes were completed using a Boart Longyear LX6 rig and were advanced until refusal. Refusal was met at depths of between 28.0 m and 40.5 m for the Nilcon Vane, and for the SCPT between 11.4 m and 41.65 m.
C3.2.2.2 Germano Buttress
At the Germano Buttress, three SCPTs were attempted at the first location on the 825 m berm. None of the CPTs could advance more than 2 m. The SCPT rig was moved to the higher 845 m berm. The first attempt at (GBCPT-06) only penetrated 3.4 m. The second attempt at GBCPT-06B reached 27.5 m. Seismic shear wave measurements were collected by a seismic cone penetrometer at depth intervals of 1 m. Thus, only one SCPT was done on the Germano Buttress.
C3.2.2.3 Germano Pit Dam
At the Germano Pit Dam, separate pairs of SCPT and SPT holes were completed at two locations. The SPT holes were offset approximately 3 m from the SCPT holes. Within the SCPT test holes, shear wave measurements were collected by a seismic cone penetrometer at depth intervals of 1 m. SPTs were completed at approximately 1 m depth intervals. Test pits were completed at four locations for the purpose of undertaking in situ density tests and collecting samples (also at a 3 m offset from the CPT, but in the opposite direction to the SPT).
The SPT profiles were done at GCSPT16-01 and GCSPT16-02 because the Panel identified a discrepancy between SPT and CPT results in the pre-failure Fundão in situ data. These two Panel test holes gave SPT values much higher than would have been predicted by standard correlations with CPT. The Panel considers that the SPT results are too high because the methodology and equipment used to undertake the SPTs did not meet the minimum ASTM standards (nor internationally accepted practice) as follows:
The outside (33.7 mm) and inside (22.3 mm) diameters of the drill rods are less than the minimum requirements of the ASTM standard.
The moment of inertia of the drill rods (51,082 mm4) is less than the minimum requirements of the ASTM standard (110,231 mm4).
Fundão Tailings Dam Review Panel Report on the Immediate Causes of the Failure of the Fundão DamAppendix C – Field Geotechnical Data and Interpretation
August 25, 2016 Page C-16
The rods are not flush jointed; the ASTM standard requires flush-joint steel drill rods to be used to connect the split-barrel sampler to the drive-weight assembly.
Drilling was by rotary coring using a bottom-discharge drill bit with a weak bentonite mud; ASTM states advancing a borehole with bottom discharge bits is not permissible.
Because of these procedural issues, the Panel considers that the SPT results are misleading so will not be reported herein. However, water contents were collected from the SPT samples; these are reported on the logs in Attachment C4.
C3.2.3 MASW Survey
The MASW survey was conducted at three locations, as shown on Figure C 3-1:
Survey 1 - at the location of the current accelerometer positioned on a bedrock outcrop between Germano and Fundão.
Survey 2 - adjacent to GCCPT16-03 at Germano Pit Dam to compare with the seismic shear wave measurements collected by the seismic cone penetrometer.
Survey 3 - adjacent to the reception building in the main plant area where seismic intensity observations were previously made.
A copy of the AFC Geofisica Ltda. report is included as Attachment C3.
C3.2.4 Test Hole Location Survey
The initial layout of all boreholes and test sites was carried out using a handheld GPS. Final as-built co-ordinates were subsequently surveyed using a consumer grade GPS device. All coordinates cited within the field investigation relate to the UTM Zone 23 South/WGS84.
C3.3 Laboratory Testing
Soil samples retrieved from the SPT boreholes and Sharky samplers were subjected to standard laboratory index testing, including moisture content determination, PSD and specific gravity testing. Fugro carried out the PSD analysis and specific gravity testing for samples collected from SPT16-01. All other laboratory index testing was undertaken by TÜV SÜD/Samarco.
A summary of the laboratory index testing to support the field program is presented in Attachment C6. All of these tests were conducted in Brazilian laboratories. Thus, the Panel members could not directly check the test results, although supervision was provided by TÜV SÜD.
Fundão Tailings Dam Review Panel Report on the Immediate Causes of the Failure of the Fundão DamAppendix C – Field Geotechnical Data and Interpretation
August 25, 2016 Page C-17
C3.4 Test Results
C3.4.1 Germano Slimes
C3.4.1.1 Southwest Corner – “Pure” Slimes
Cone penetration test results, vane shear tests, and sampling holes were completed at the southwest corner of Germano in GSCPT16-05, GS-VST16-02, and GSSAM16-02/02B respectively. Water content and fines content were done on ConeTec Sharky samples in Brazil. The vane shear test results are shown on the SCPT log, found in Attachment C7, Figure C.C7-2. The water content results are shown on GSSAM16-02 together with specific gravity.
A second sampling hole, GSSAM16-02B, was drilled to collect four Shelby tube samples. The depth of these samples are given on the GSSAM16-02 test hole log, shown in Attachment C4. Triaxial tests were done on some of these samples in the Pattrol laboratory in Belo Horizonte. These results are given in Attachment D7.
An access fill pad was constructed to reach this testing location with a top elevation of about 917 m. The first three meters shown on the test hole log and the SCPT are likely this fill material. Below that fill, slimes reached to El. 886 m until cone refusal; a slimes thickness of 28 m. The tip resistance of the slimes at El. 914 m was about 0.07 MPa, increasing to 1 MPa at El. 898 m or 16 m depth. Thereafter, the tip resistance was essentially constant. The dynamic pore-water pressure was much higher than static, indicating fine grained materials. None of the dissipation tests reached equilibrium. The shear wave velocity was about 100 m/s just below the access fill, increasing to 350 m/s at the bottom of the CPT. The peak vane shear values reached about 10 kPa at El. 910 m (4 m below the access fill or 7 m depth). The vane shear strength reached 50 kPa at El. 890 m or 27 m deep.
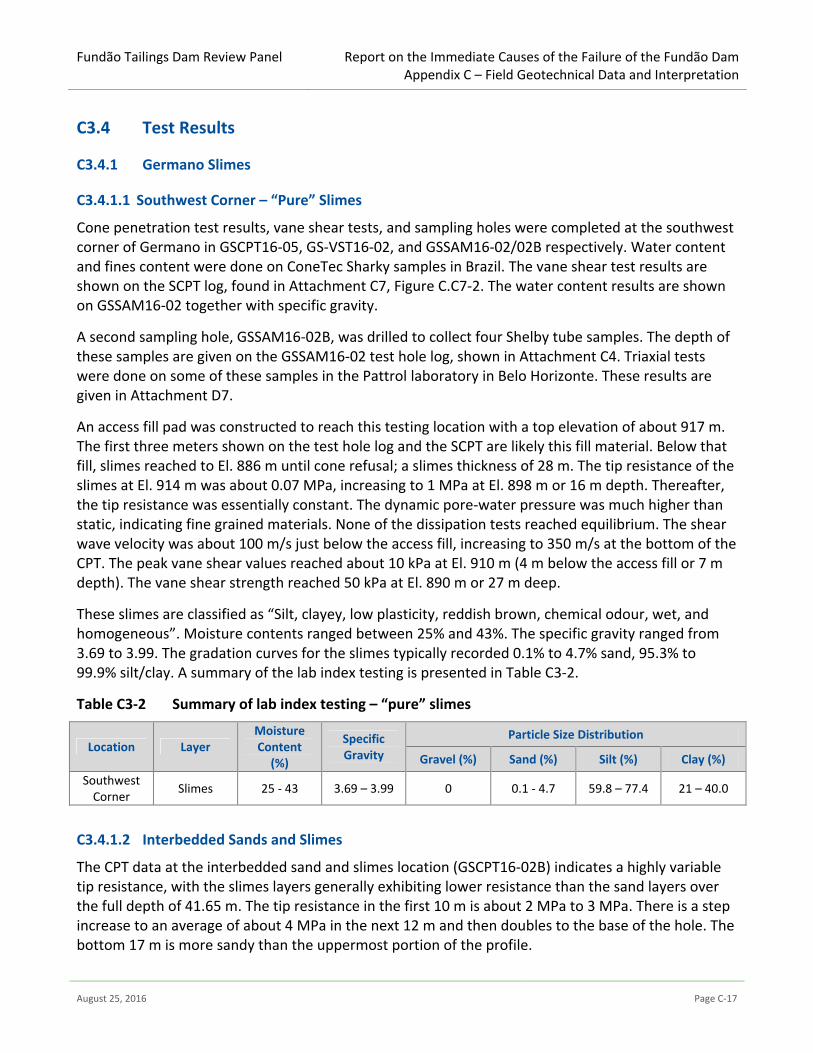
These slimes are classified as “Silt, clayey, low plasticity, reddish brown, chemical odour, wet, and homogeneous”. Moisture contents ranged between 25% and 43%. The specific gravity ranged from 3.69 to 3.99. The gradation curves for the slimes typically recorded 0.1% to 4.7% sand, 95.3% to 99.9% silt/clay. A summary of the lab index testing is presented in Table C 3-2.
Table C 3-2 Summary of lab index testing – “pure” slimes
Location Layer Moisture Content
(%)
Specific Gravity
Particle Size Distribution
Gravel (%) Sand (%) Silt (%) Clay (%) Southwest
Corner Slimes 25 - 43 3.69 – 3.99 0 0.1 - 4.7 59.8 – 77.4 21 – 40.0
C3.4.1.2 Interbedded Sands and Slimes
The CPT data at the interbedded sand and slimes location (GSCPT16-02B) indicates a highly variable tip resistance, with the slimes layers generally exhibiting lower resistance than the sand layers over the full depth of 41.65 m. The tip resistance in the first 10 m is about 2 MPa to 3 MPa. There is a step increase to an average of about 4 MPa in the next 12 m and then doubles to the base of the hole. The bottom 17 m is more sandy than the uppermost portion of the profile.
Fundão Tailings Dam Review Panel Report on the Immediate Causes of the Failure of the Fundão DamAppendix C – Field Geotechnical Data and Interpretation
August 25, 2016 Page C-18
In contrast to the “pure” slimes CPT profile, the pore-water pressure dissipation tests reduced to the hydrostatic value over the full profile. The water table was at about 8.9 m depth. The shear wave velocity increased from 200 m/s at El. 905 m to 275 m/s at El. 880 m.
Plots of the CPT test data are presented in Attachment C7, Figure C.C7-1, together with the vane shear test results from GSVST16-01.
C3.4.1.3 Nkt Value for Undrained Strength
Robertson (2009) suggests that Nkt typically varies from about 10 to 20, with an average of 14. The vane shear test results were plotted against normalized CPT tip resistance to obtain an average Nkt of 20. This Nkt was used in the Panel’s interpretation, which is different from the Nkt on the standard ConeTec plots. See Figure C.C6-3 in Attachment C6.
C3.4.2 Germano Buttress
One SCPT (GBCPT16-06) was completed on the 845 m berm on Germano Buttress. Shear wave velocity measurements were recorded in this profile. The SCPT data is presented in Attachment C7, Figure C.C7-3.
The CPT data recorded a tip resistance generally increasing with depth from a minimum 0.64 MPa at 9.6 m (El. 835.4 m) to a maximum 30.21 MPa recorded at 26.4 m (El. 818.4 m). The CPT was terminated at 27.5 m within a sandy layer. A more competent layer was encountered from the ground surface to a depth of 3.35 m (El. 841.65 m) with tip resistances increasing from 13.00 MPa at the ground surface to a maximum 46.67 MPa at 2.55 m (El. 842.45 m). No water table was encountered at a depth of 3.1 m.
The shear wave velocity, vs, ranged from 233 m/s to 374 m/s with an average of 303 m/s. The sand tailings were unsaturated and generally dilative.
C3.4.3 Germano Pit Dam
Two locations were investigated at the Germano Pit Dam as shown on Figure C3-1. At the northeast location, GCCPT16-04, GCCPT16-04B and GCSPT16-01 were completed and given on Figure C.C7-7 (Attachment C7), Figure C.C7-9 (Attachment C7), and Attachment C4 respectively. At the southwest location GCCPT16-03 and GCSPT16-02 were completed and shown on Figure C.C7-5 (Attachment C7) and Attachment C4 respectively. Both SCPT profiles are reported herein in their entirety. The penetration blow counts from the SPT holes are not reported herein because the SPT procedures and equipment were suspect, as discussed in Section C3.2. Moisture content and specific gravity tests were done on the SPT samples and are reported on the test hole logs in Attachment C4.
Germano Pit Dam is constructed entirely of spigotted sand tailings with no direct slimes deposition in any part of the impoundment. The location of the impoundment relative to Germano Buttress is shown on Figure C3-1. There is a foundation finger drain beneath the impoundment whose intent is to maintain an unsaturated downstream slope. Gradation testing was done on surface samples prior to drilling which showed that the gradation of the sand tailings at Fundão Dam and Germano Pit Dam are virtually identical.
Fundão Tailings Dam Review Panel Report on the Immediate Causes of the Failure of the Fundão DamAppendix C – Field Geotechnical Data and Interpretation
August 25, 2016 Page C-19
At the southwest location, GCCPT16-03 was pushed to about 64 m depth without drill outs. The water table was encountered at El. 970 m or a depth of about 33 m. The tip resistance steadily rose with depth to the water table, beneath which it became relatively constant. The equivalent Clean Sand Tip Resistance was constant with depth. When saturated, the Robertson (2010) approach shows the sand is liquefiable. The state parameter is -0.05 or more in the saturated zone, also indicating susceptibility to liquefaction.
In the northeast corner, the CPT data recorded a tip resistance generally constant with depth (ignoring minor variations) from the ground surface to a depth of 28.8 m (El. 975.53 m); below 28.8 m the tip resistance generally increases with depth to refusal at 36.35 m. Between the ground surface and 28.8 m, the tip resistance varied within 10 MPa to 20 MPa, with locally higher and lower values recorded. The water table was not encountered.
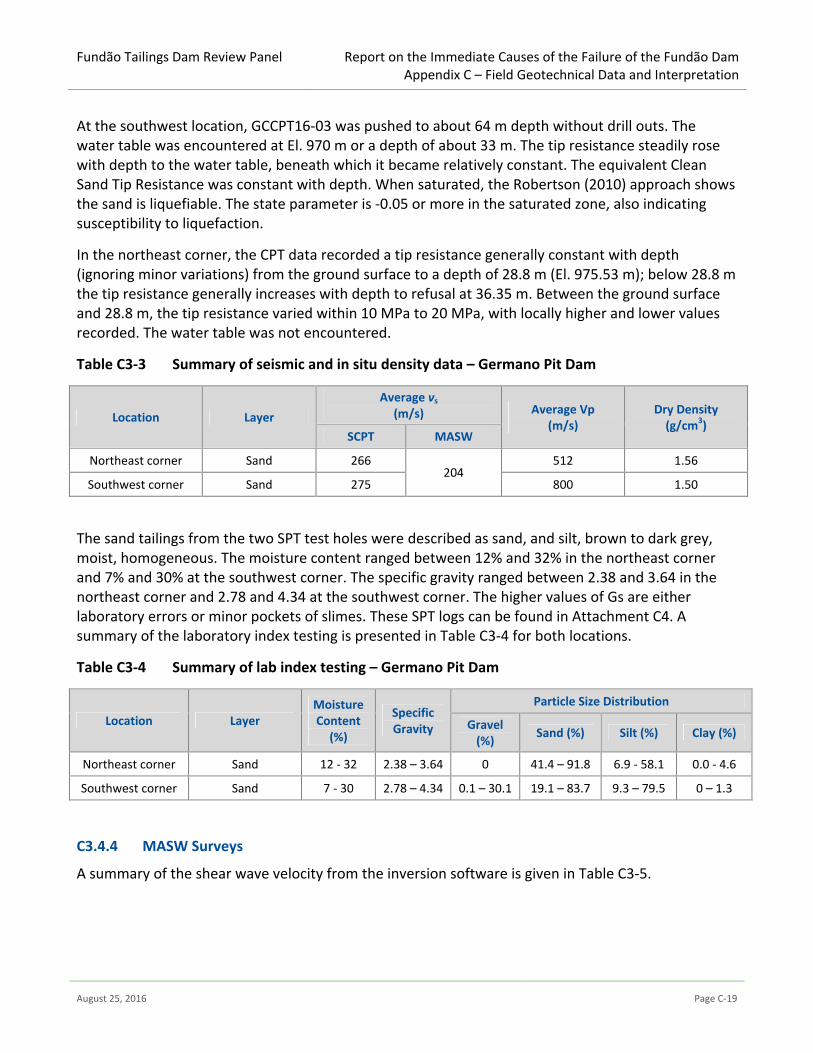
Table C 3-3 Summary of seismic and in situ density data – Germano Pit Dam
Location Layer Average vs
(m/s) Average Vp (m/s)
Dry Density (g/cm3)
SCPT MASW
Northeast corner Sand 266 204
512 1.56
Southwest corner Sand 275 800 1.50
The sand tailings from the two SPT test holes were described as sand, and silt, brown to dark grey, moist, homogeneous. The moisture content ranged between 12% and 32% in the northeast corner and 7% and 30% at the southwest corner. The specific gravity ranged between 2.38 and 3.64 in the northeast corner and 2.78 and 4.34 at the southwest corner. The higher values of Gs are either laboratory errors or minor pockets of slimes. These SPT logs can be found in Attachment C4. A summary of the laboratory index testing is presented in Table C 3-4 for both locations.
Table C 3-4 Summary of lab index testing – Germano Pit Dam
Location Layer Moisture Content
(%)
Specific Gravity
Particle Size Distribution
Gravel (%) Sand (%) Silt (%) Clay (%)
Northeast corner Sand 12 - 32 2.38 – 3.64 0 41.4 – 91.8 6.9 - 58.1 0.0 - 4.6
Southwest corner Sand 7 - 30 2.78 – 4.34 0.1 – 30.1 19.1 – 83.7 9.3 – 79.5 0 – 1.3
C3.4.4 MASW Surveys
A summary of the shear wave velocity from the inversion software is given in Table C 3-5.
Fundão Tailings Dam Review Panel Report on the Immediate Causes of the Failure of the Fundão DamAppendix C – Field Geotechnical Data and Interpretation
August 25, 2016 Page C-20
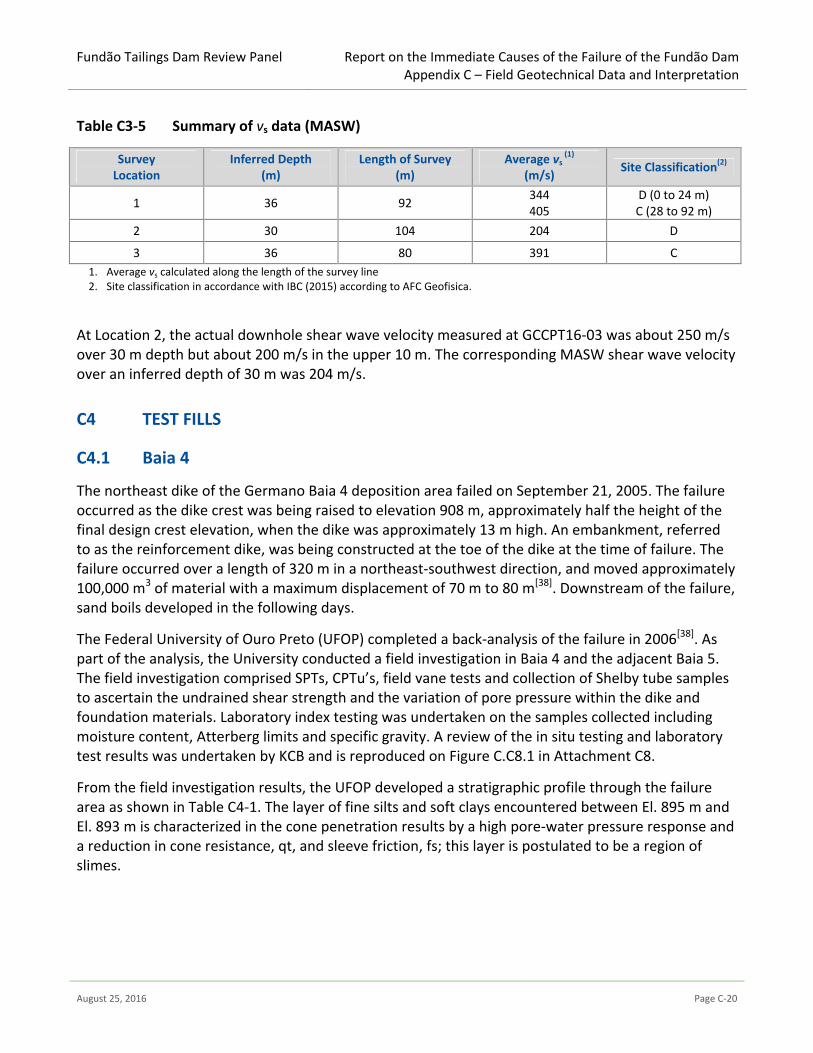
Table C 3-5 Summary of vs data (MASW)
Survey Location
Inferred Depth (m)
Length of Survey (m)
Average vs (1)
(m/s) Site Classification(2)
1 36 92 344405
D (0 to 24 m)C (28 to 92 m)
2 30 104 204 D
3 36 80 391 C 1. Average vs calculated along the length of the survey line 2. Site classification in accordance with IBC (2015) according to AFC Geofisica.
At Location 2, the actual downhole shear wave velocity measured at GCCPT16-03 was about 250 m/s over 30 m depth but about 200 m/s in the upper 10 m. The corresponding MASW shear wave velocity over an inferred depth of 30 m was 204 m/s.
C4 TEST FILLS
C4.1 Baia 4
The northeast dike of the Germano Baia 4 deposition area failed on September 21, 2005. The failure occurred as the dike crest was being raised to elevation 908 m, approximately half the height of the final design crest elevation, when the dike was approximately 13 m high. An embankment, referred to as the reinforcement dike, was being constructed at the toe of the dike at the time of failure. The failure occurred over a length of 320 m in a northeast-southwest direction, and moved approximately 100,000 m3 of material with a maximum displacement of 70 m to 80 m[38]. Downstream of the failure, sand boils developed in the following days.
The Federal University of Ouro Preto (UFOP) completed a back-analysis of the failure in 2006[38]. As part of the analysis, the University conducted a field investigation in Baia 4 and the adjacent Baia 5. The field investigation comprised SPTs, CPTu’s, field vane tests and collection of Shelby tube samples to ascertain the undrained shear strength and the variation of pore pressure within the dike and foundation materials. Laboratory index testing was undertaken on the samples collected including moisture content, Atterberg limits and specific gravity. A review of the in situ testing and laboratory test results was undertaken by KCB and is reproduced on Figure C.C8.1 in Attachment C8.
From the field investigation results, the UFOP developed a stratigraphic profile through the failure area as shown in Table C 4-1. The layer of fine silts and soft clays encountered between El. 895 m and El. 893 m is characterized in the cone penetration results by a high pore-water pressure response and a reduction in cone resistance, qt, and sleeve friction, fs; this layer is postulated to be a region of slimes.
Fundão Tailings Dam Review Panel Report on the Immediate Causes of the Failure of the Fundão DamAppendix C – Field Geotechnical Data and Interpretation
August 25, 2016 Page C-21
Table C 4-1 Summary of Baia 4 stratigraphic profile[38]
Elevation Description qT u2
902 to 899 Silts and soft sand 2 - 899 to 895 Soft sands and silts 4 - 895 to 893 Fine silts and soft clays 0.6 400 893 to 885 Soft and compacted sands 6 -
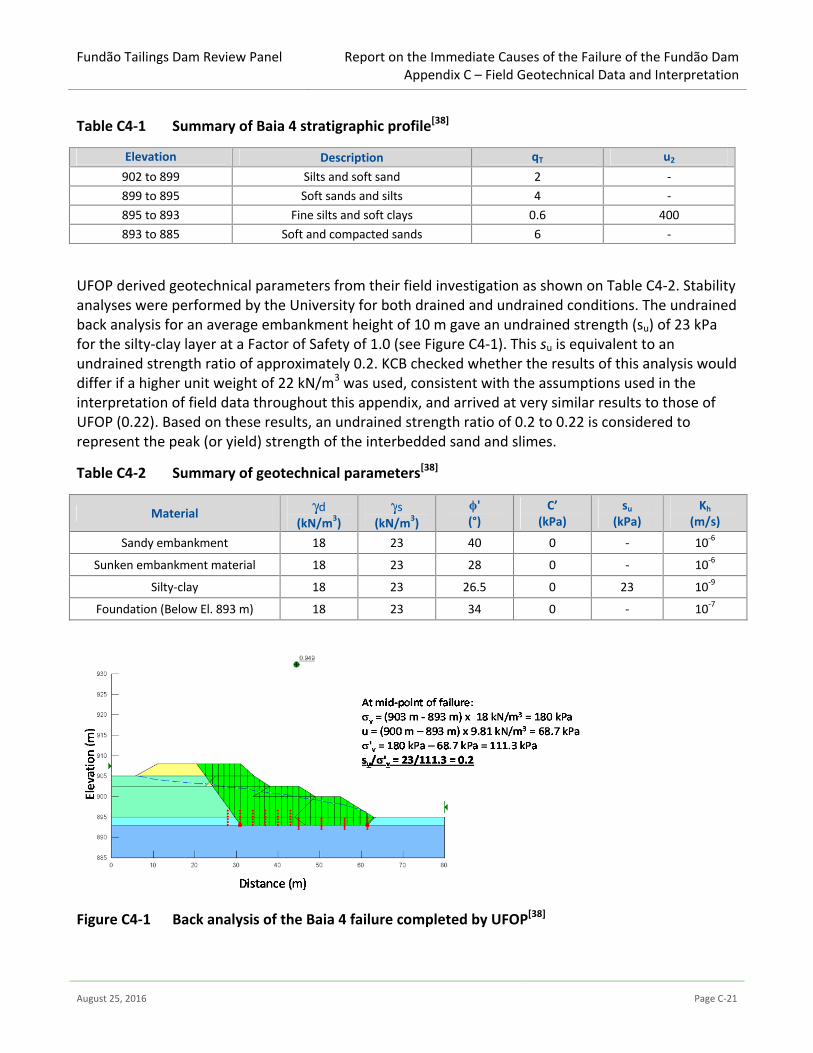
UFOP derived geotechnical parameters from their field investigation as shown on Table C 4-2. Stability analyses were performed by the University for both drained and undrained conditions. The undrained back analysis for an average embankment height of 10 m gave an undrained strength (su) of 23 kPa for the silty-clay layer at a Factor of Safety of 1.0 (see Figure C 4-1). This su is equivalent to an undrained strength ratio of approximately 0.2. KCB checked whether the results of this analysis would differ if a higher unit weight of 22 kN/m3 was used, consistent with the assumptions used in the interpretation of field data throughout this appendix, and arrived at very similar results to those of UFOP (0.22). Based on these results, an undrained strength ratio of 0.2 to 0.22 is considered to represent the peak (or yield) strength of the interbedded sand and slimes.
Table C 4-2 Summary of geotechnical parameters[38]
Material γd (kN/m3)
γs (kN/m3)
ϕ' (°)
C’ (kPa)
su (kPa)
Kh (m/s)
Sandy embankment 18 23 40 0 - 10-6
Sunken embankment material 18 23 28 0 - 10-6
Silty-clay 18 23 26.5 0 23 10-9
Foundation (Below El. 893 m) 18 23 34 0 - 10-7
Figure C 4-1 Back analysis of the Baia 4 failure completed by UFOP[38]
Fundão Tailings Dam Review Panel Report on the Immediate Causes of the Failure of the Fundão DamAppendix C – Field Geotechnical Data and Interpretation
August 25, 2016 Page C-22
KCB ran slope stability analyses to calculate the large-strain undrained shear strength ratio using the post-failure geometry. Observations of the failure at Baia 4 indicate the run-out of the rupture was approximately 70 m, so a slip surface length equivalent to the total observed run-out was used in back analysis. The height of the dike and the undrained strength was varied to produce a factor of safety equal to 1.0.
Given the uncertainties in the post-failure geometry, we have calculated a range of post-failure strength ratios for a factor of safety equal to unity. We calculated strength ratios of between roughly 0.07 and 0.12 for post-failure slopes of between 12H:1V and 8H:1V, respectively. This analysis does not account for the momentum created by the sliding mass, so the static large-strain strength ratio lies between 0.07 and 0.22. Following the simplified approach to accounting for momentum effects discussed by Webber (2015), an approximate large-strain strength can be calculated as the average of those associated with the pre- and post-failure geometries. Averaging these values would give a large-strain undrained strength ratio of approximately 0.14 to 0.15 for interbedded regions of sand and slimes.
C4.2 2008 Test Fill
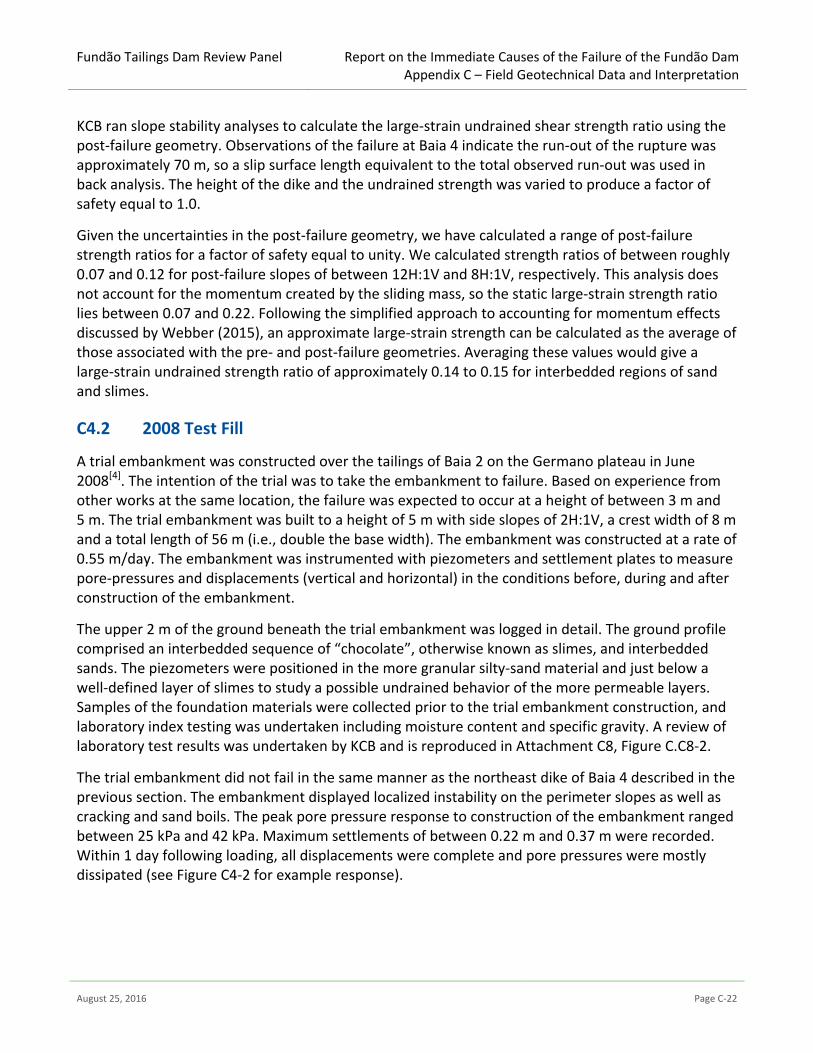
A trial embankment was constructed over the tailings of Baia 2 on the Germano plateau in June 2008[4]. The intention of the trial was to take the embankment to failure. Based on experience from other works at the same location, the failure was expected to occur at a height of between 3 m and 5 m. The trial embankment was built to a height of 5 m with side slopes of 2H:1V, a crest width of 8 m and a total length of 56 m (i.e., double the base width). The embankment was constructed at a rate of 0.55 m/day. The embankment was instrumented with piezometers and settlement plates to measure pore-pressures and displacements (vertical and horizontal) in the conditions before, during and after construction of the embankment.
The upper 2 m of the ground beneath the trial embankment was logged in detail. The ground profile comprised an interbedded sequence of “chocolate”, otherwise known as slimes, and interbedded sands. The piezometers were positioned in the more granular silty-sand material and just below a well-defined layer of slimes to study a possible undrained behavior of the more permeable layers. Samples of the foundation materials were collected prior to the trial embankment construction, and laboratory index testing was undertaken including moisture content and specific gravity. A review of laboratory test results was undertaken by KCB and is reproduced in Attachment C8, Figure C.C8-2.
The trial embankment did not fail in the same manner as the northeast dike of Baia 4 described in the previous section. The embankment displayed localized instability on the perimeter slopes as well as cracking and sand boils. The peak pore pressure response to construction of the embankment ranged between 25 kPa and 42 kPa. Maximum settlements of between 0.22 m and 0.37 m were recorded. Within 1 day following loading, all displacements were complete and pore pressures were mostly dissipated (see Figure C 4-2 for example response).
Fundão Tailings Dam Review Panel Report on the Immediate Causes of the Failure of the Fundão DamAppendix C – Field Geotechnical Data and Interpretation
August 25, 2016 Page C-23
Schematic layout of test fill instrumentation
a) Settlement b) Pore Pressure
Figure C 4-2 Example instrumentation response to 2008 test fill[4]
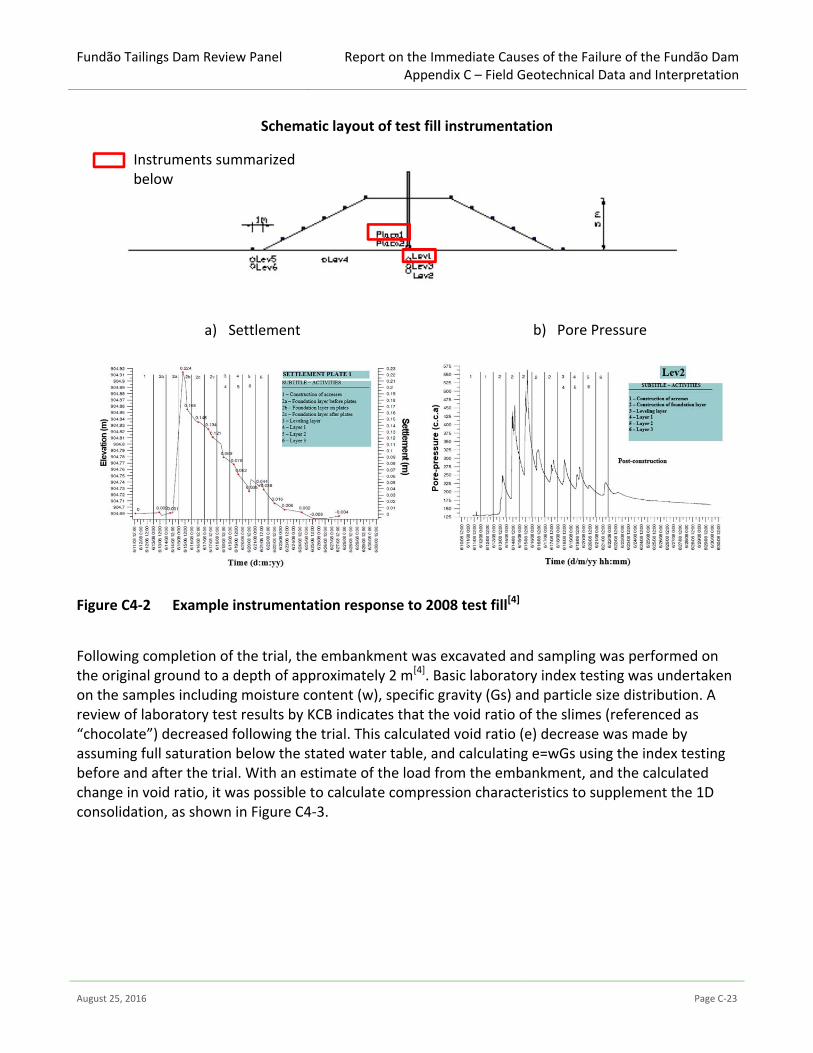
Following completion of the trial, the embankment was excavated and sampling was performed on the original ground to a depth of approximately 2 m[4]. Basic laboratory index testing was undertaken on the samples including moisture content (w), specific gravity (Gs) and particle size distribution. A review of laboratory test results by KCB indicates that the void ratio of the slimes (referenced as “chocolate”) decreased following the trial. This calculated void ratio (e) decrease was made by assuming full saturation below the stated water table, and calculating e=wGs using the index testing before and after the trial. With an estimate of the load from the embankment, and the calculated change in void ratio, it was possible to calculate compression characteristics to supplement the 1D consolidation, as shown in Figure C 4-3.
Instruments summarized below
Fundão Tailings Dam Review Panel Report on the Immediate Causes of the Failure of the Fundão DamAppendix C – Field Geotechnical Data and Interpretation
August 25, 2016 Page C-24
Figure C 4-3 Slimes compressibility characteristics back calculated 2008 test fill
C4.3 2013 Test Fill
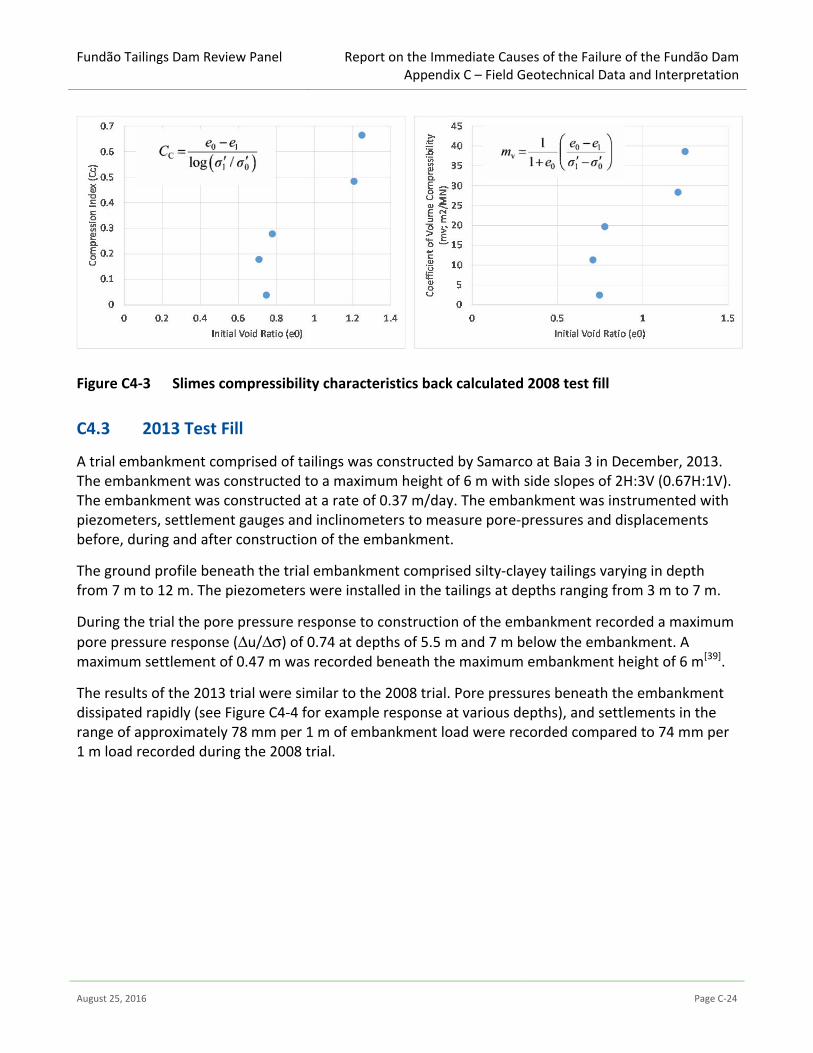
A trial embankment comprised of tailings was constructed by Samarco at Baia 3 in December, 2013. The embankment was constructed to a maximum height of 6 m with side slopes of 2H:3V (0.67H:1V). The embankment was constructed at a rate of 0.37 m/day. The embankment was instrumented with piezometers, settlement gauges and inclinometers to measure pore-pressures and displacements before, during and after construction of the embankment.
The ground profile beneath the trial embankment comprised silty-clayey tailings varying in depth from 7 m to 12 m. The piezometers were installed in the tailings at depths ranging from 3 m to 7 m.
During the trial the pore pressure response to construction of the embankment recorded a maximum pore pressure response (Δu/Δσ) of 0.74 at depths of 5.5 m and 7 m below the embankment. A maximum settlement of 0.47 m was recorded beneath the maximum embankment height of 6 m[39].
The results of the 2013 trial were similar to the 2008 trial. Pore pressures beneath the embankment dissipated rapidly (see Figure C 4-4 for example response at various depths), and settlements in the range of approximately 78 mm per 1 m of embankment load were recorded compared to 74 mm per 1 m load recorded during the 2008 trial.
Fundão Tailings Dam Review Panel Report on the Immediate Causes of the Failure of the Fundão DamAppendix C – Field Geotechnical Data and Interpretation
August 25, 2016 Page C-25
Figure C 4-4 Pore pressure response to 2013 test fill
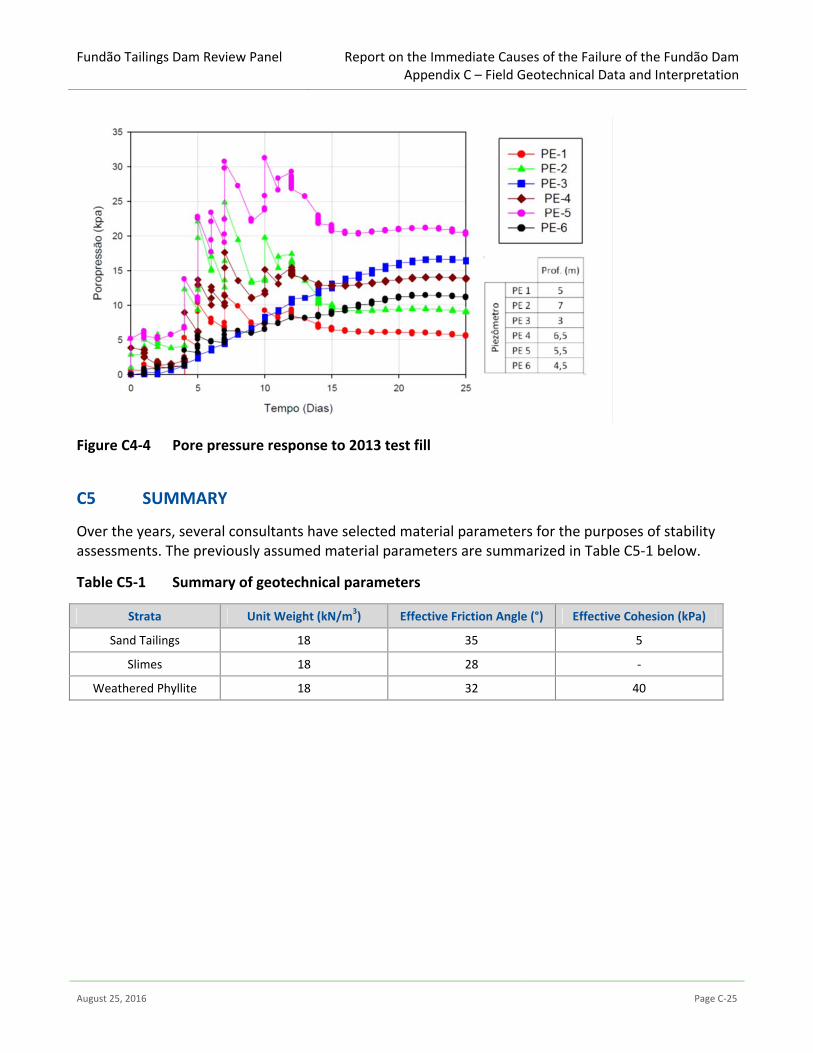
C5 SUMMARY
Over the years, several consultants have selected material parameters for the purposes of stability assessments. The previously assumed material parameters are summarized in Table C 5-1 below.
Table C 5-1 Summary of geotechnical parameters
Strata Unit Weight (kN/m3) Effective Friction Angle (°) Effective Cohesion (kPa)
Sand Tailings 18 35 5
Slimes 18 28 -
Weathered Phyllite 18 32 40