Embed Size (px)
Citation preview
MAFAC CBP Task Force Phase II Report Final 8/29/20
1
Appendix C- Biological Analysis Documentation INTRODUCTION ....................................................................................................................... 3
LIMITING FACTORS ANALYSIS .................................................................................................. 5 Approach ............................................................................................................................. 5 Impact Estimates - Tributary Habitat ................................................................................... 7
Definition ................................................................................................................................. 7 Background ............................................................................................................................. 7 Estimation Methods ................................................................................................................ 8 Stock-Specific Estimates ........................................................................................................ 10
Impact Estimates - Estuary Habitat .................................................................................... 12 Definition ............................................................................................................................... 12 Background ........................................................................................................................... 12 Estimation Methods .............................................................................................................. 14 Stock-Specific Estimates ........................................................................................................ 15
Impacts Estimates – Mainstem/Latent/Hydro Factors ....................................................... 17 Definition ............................................................................................................................... 17 Mainstem/Hydro ................................................................................................................... 18 Net Mainstem Impact ........................................................................................................... 24 Latent Hydro Mortality ......................................................................................................... 25
Impact Estimates - Blocked Areas ...................................................................................... 30 Definition ............................................................................................................................... 30 Background ........................................................................................................................... 30 Estimation Methods .............................................................................................................. 30 Stock-Specific Estimates ........................................................................................................ 33
Impact Estimates - Predation ............................................................................................. 34 Definition ............................................................................................................................... 34 Background ........................................................................................................................... 34 Estimation Methods .............................................................................................................. 35 Potential for Compensation .................................................................................................. 41 Stock-Specific Estimates ........................................................................................................ 42
Impact Estimates - Harvest ................................................................................................ 44 Definition ............................................................................................................................... 44 Background ........................................................................................................................... 44 Estimation Methods .............................................................................................................. 47 Stock-Specific Estimates ........................................................................................................ 47
Impact Estimates - Hatcheries............................................................................................ 50 Definition ............................................................................................................................... 50
MAFAC CBP Task Force Phase II Report Final 8/29/20
2
Background ........................................................................................................................... 50 Estimation Methods .............................................................................................................. 56 Stock-Specific Estimates ........................................................................................................ 57
Impacts Summary - The Heat Map ..................................................................................... 59
LIFE -CYCLE ANALYSIS - THE SALMON ANALYZER ................................................................... 62 Model Description ............................................................................................................. 62
Model Derivation .................................................................................................................. 64 Inputs, Outputs and Function ................................................................................................ 66 Assumptions and Limitations ................................................................................................ 68 Model Validation ................................................................................................................... 70
Analyses ............................................................................................................................ 74 Discussion .......................................................................................................................... 76
REFERENCES .......................................................................................................................... 78

MAFAC CBP Task Force Phase II Report Final 8/29/20
3
INTRODUCTION The MAFAC Columbia Basin Partnership Task Force employed a series of biological analyses to help understand the factors that limit naturally-produced Columbia Basin salmon and steelhead abundance and the potential pathways for increasing abundance to achieve the quantitative natural production goals. A large volume of scientific information is available on factors affecting Columbia Basin salmon and steelhead. Analyses are intended to provide high-level summaries and analyses of the available scientific information, described in more detail below.
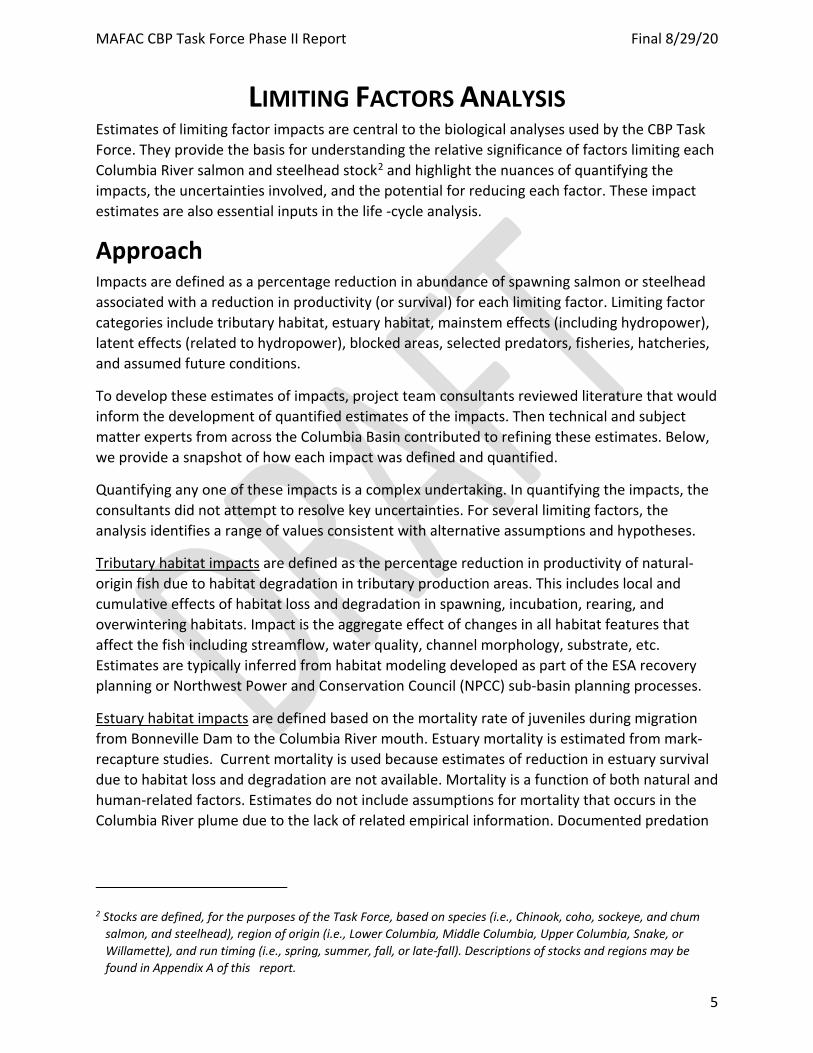
Conceptually, the Task Force thinks of these analyses as a dial-turning exercise (Figure 1) to inform the following questions:
• What dials can we turn (i.e., what impacts can we reduce) to increase salmon or steelhead abundance?
• How much do we have to turn the dials (i.e., reduce impacts) to achieve a desired improvement?
• How feasible is it to turn any particular dial (i.e., to reduce any particular impact)?
• What combinations of dial turns (i.e., reductions in multiple impacts) get us where we want to go?
Figure 1. Conceptual diagram of the “dials” that can be turned to change salmon and steelhead
abundance. Turning these dials (or changing the level of impact from these factors) affects salmon and steelhead abundance.
MAFAC CBP Task Force Phase II Report Final 8/29/20
4
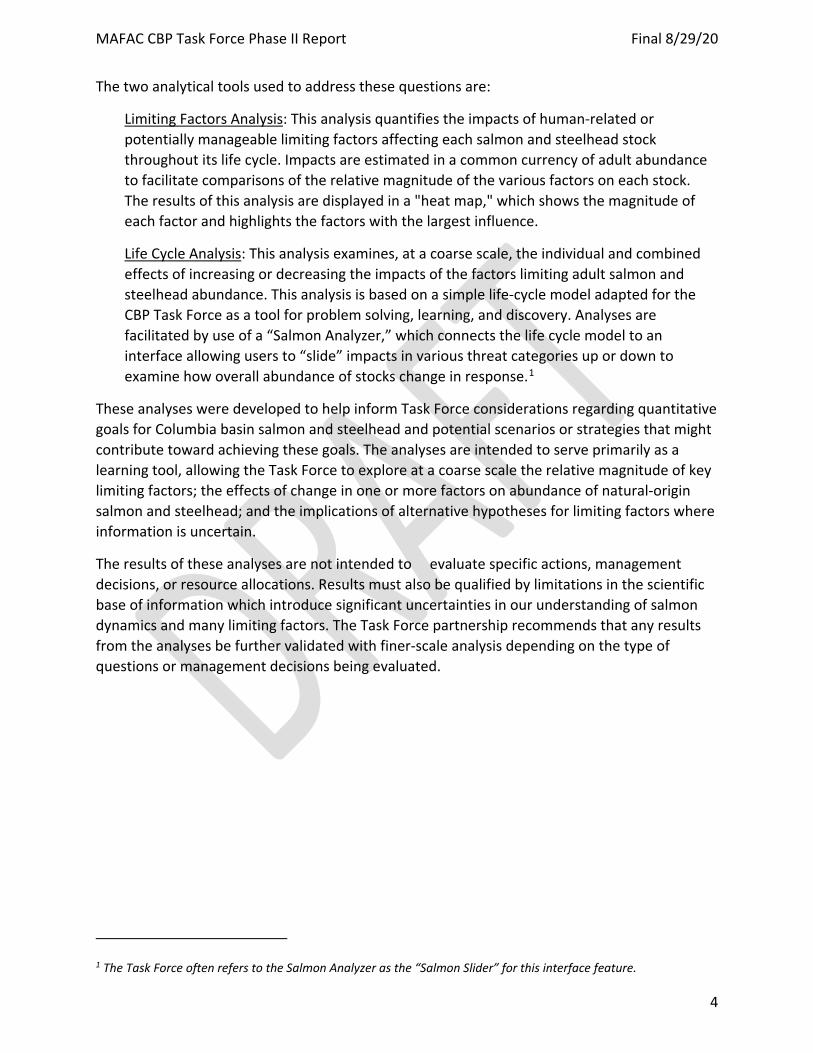
The two analytical tools used to address these questions are:
Limiting Factors Analysis: This analysis quantifies the impacts of human-related or potentially manageable limiting factors affecting each salmon and steelhead stock throughout its life cycle. Impacts are estimated in a common currency of adult abundance to facilitate comparisons of the relative magnitude of the various factors on each stock. The results of this analysis are displayed in a "heat map," which shows the magnitude of each factor and highlights the factors with the largest influence.
Life Cycle Analysis: This analysis examines, at a coarse scale, the individual and combined effects of increasing or decreasing the impacts of the factors limiting adult salmon and steelhead abundance. This analysis is based on a simple life-cycle model adapted for the CBP Task Force as a tool for problem solving, learning, and discovery. Analyses are facilitated by use of a “Salmon Analyzer,” which connects the life cycle model to an interface allowing users to “slide” impacts in various threat categories up or down to examine how overall abundance of stocks change in response.1
These analyses were developed to help inform Task Force considerations regarding quantitative goals for Columbia basin salmon and steelhead and potential scenarios or strategies that might contribute toward achieving these goals. The analyses are intended to serve primarily as a learning tool, allowing the Task Force to explore at a coarse scale the relative magnitude of key limiting factors; the effects of change in one or more factors on abundance of natural-origin salmon and steelhead; and the implications of alternative hypotheses for limiting factors where information is uncertain.
The results of these analyses are not intended to evaluate specific actions, management decisions, or resource allocations. Results must also be qualified by limitations in the scientific base of information which introduce significant uncertainties in our understanding of salmon dynamics and many limiting factors. The Task Force partnership recommends that any results from the analyses be further validated with finer-scale analysis depending on the type of questions or management decisions being evaluated.
1 The Task Force often refers to the Salmon Analyzer as the “Salmon Slider” for this interface feature.
MAFAC CBP Task Force Phase II Report Final 8/29/20
5
LIMITING FACTORS ANALYSIS Estimates of limiting factor impacts are central to the biological analyses used by the CBP Task Force. They provide the basis for understanding the relative significance of factors limiting each Columbia River salmon and steelhead stock2 and highlight the nuances of quantifying the impacts, the uncertainties involved, and the potential for reducing each factor. These impact estimates are also essential inputs in the life -cycle analysis.
Approach Impacts are defined as a percentage reduction in abundance of spawning salmon or steelhead associated with a reduction in productivity (or survival) for each limiting factor. Limiting factor categories include tributary habitat, estuary habitat, mainstem effects (including hydropower), latent effects (related to hydropower), blocked areas, selected predators, fisheries, hatcheries, and assumed future conditions.
To develop these estimates of impacts, project team consultants reviewed literature that would inform the development of quantified estimates of the impacts. Then technical and subject matter experts from across the Columbia Basin contributed to refining these estimates. Below, we provide a snapshot of how each impact was defined and quantified.
Quantifying any one of these impacts is a complex undertaking. In quantifying the impacts, the consultants did not attempt to resolve key uncertainties. For several limiting factors, the analysis identifies a range of values consistent with alternative assumptions and hypotheses.
Tributary habitat impacts are defined as the percentage reduction in productivity of natural-origin fish due to habitat degradation in tributary production areas. This includes local and cumulative effects of habitat loss and degradation in spawning, incubation, rearing, and overwintering habitats. Impact is the aggregate effect of changes in all habitat features that affect the fish including streamflow, water quality, channel morphology, substrate, etc. Estimates are typically inferred from habitat modeling developed as part of the ESA recovery planning or Northwest Power and Conservation Council (NPCC) sub-basin planning processes.
Estuary habitat impacts are defined based on the mortality rate of juveniles during migration from Bonneville Dam to the Columbia River mouth. Estuary mortality is estimated from mark-recapture studies. Current mortality is used because estimates of reduction in estuary survival due to habitat loss and degradation are not available. Mortality is a function of both natural and human-related factors. Estimates do not include assumptions for mortality that occurs in the Columbia River plume due to the lack of related empirical information. Documented predation
2 Stocks are defined, for the purposes of the Task Force, based on species (i.e., Chinook, coho, sockeye, and chum salmon, and steelhead), region of origin (i.e., Lower Columbia, Middle Columbia, Upper Columbia, Snake, or Willamette), and run timing (i.e., spring, summer, fall, or late-fall). Descriptions of stocks and regions may be found in Appendix A of this report.
MAFAC CBP Task Force Phase II Report Final 8/29/20
6
mortality of juveniles below Bonneville Dam is subtracted from the total estuary mortality because predation is treated as a separate impact.
Mainstem impacts are defined as the cumulative percentage mortality of juveniles and adults during migration between dams through the Columbia and Snake River mainstem ("reach mortality") and the reduction in productivity due to spawning habitat inundation. The reach mortality estimates are intended primarily to reflect effects of dam passage and reservoir mortality but also include non-hydropower factors, since hydropower effects cannot be distinguished from other effects in reach mortality data (e.g., natural mortality during migration). Estimates of reach mortality are adjusted for quantifiable predation wherever possible. Estimates do not include impacts from impassable mainstem or tributary dams, which are treated separately as blocked areas.
Latent impacts are defined as the percentage mortality due to passage through the Columbia Basin hydropower system but manifested in the estuary and ocean. Latent mortality is distinguished from mainstem migration mortality for transparency regarding this key assumption Latent mortality is not estimated directly but rather inferred from empirical information. Numbers are presented as a range due to their uncertainty.
Blocked area impacts are defined as the percentage loss in potential production due to dams that block access or inundate historically accessible habitat. Affected areas include the Upper Columbia River basin (above Chief Joseph and Grand Coulee Dams), the Upper Snake River basin (above Hells Canyon Dam), tributaries to the Willamette River (dams on the Santiam, Middle Fork, and McKenzie Rivers), and other tributaries (dams on the North Fork Clearwater, Deschutes, Cowlitz, and Lewis Rivers). Smaller-scale blockages due to culverts and diversion dams are incorporated under freshwater habitat.
Predation impacts are defined as the percentage mortality due to potentially manageable predators. These include birds (Caspian terns, double-crested cormorants, and gulls), pinnipeds (California and Steller sea lions), and fish (northern pikeminnow) where empirical estimates of mortality are available. Although predation is a natural source of mortality on both juvenile and adult salmonids, it has been exacerbated by human activities, such as the creation of dredge material islands used by terns and cormorants for nesting colonies and the narrowing of adult passage to ladders at mainstem dams, which become focused foraging areas for sea lions.
Fishery impacts are defined as mortality occurring in or as a result of handling in fisheries. Fishery impacts include harvest and indirect mortalities. Harvest refers to fish that are caught and retained. Indirect mortalities are fish that are not retained but die due to handling or encounter in the fishery. Fishery impacts are considered in the aggregate but may occur in a variety of subsistence, ceremonial, sport, and commercial fisheries broadly distributed in freshwater and marine areas. More detailed documentation of the sources of fishing mortality may be found in stock summary information included in Appendix A of this report.
Hatchery impacts are defined as the percentage reduction in natural productivity due to the effects of hatchery fish on natural population diversity, productivity, and fitness, as well as effects on fish health and effects resulting from complex ecological interactions. Values are
MAFAC CBP Task Force Phase II Report Final 8/29/20
7
based on the midpoint between a range of values reflecting uncertainties in the magnitude of fitness-related and ecological effects.3
This definition of hatchery impacts refers only to the negative effects on natural production. The scale and significance of hatchery fish interactions with natural production remains a source of substantial uncertainty and no small amount of controversy. It is important to note that looking at hatcheries through the lens of negative impacts represents only one side of the equation. This approach does not capture the positive demographic effects of hatchery-origin fish spawning in natural populations. Net effects are much more complicated involving a complex of both negative and positive contributions that depend on the status of the natural populations and characteristics of the hatchery fish.
Assumed future conditions is defined as the percentage reduction in productivity or expected survival due to potential future declines in ocean survival and freshwater productivity. This is a “what-if” input to allow exploration of potential consequences of future declines due to climate change, human population growth, or other long-term threats. Analyses make no assumptions regarding future conditions but provide an option for exploration by others.
Impact Estimates - Tributary Habitat Definition For the purposes of Columbia Basin Partnership analysis, tributary habitat impacts are defined as the percentage reduction in productivity of natural-origin fish due to habitat degradation. This includes local and cumulative effects of habitat loss and degradation in spawning, incubation, rearing, and overwintering habitats. Impact is the aggregate effect of changes in all habitat features that affect the fish including streamflow, water quality, channel morphology, substrate, etc. Impacts are also the aggregate for all populations comprising a stock. The average was weighted by the size of the historical population to estimate the net habitat impact for the entire stock. Impacts include only populations returning to areas within the currently-accessible range.
Background Large and pervasive habitat effects resulting from a long history human activity and development have severely impacted the quantity and quality for salmon and steelhead. Healthy stream habitat, including cool stream flows, clean gravel beds, and deep pools, is critical for sustaining these fish species. Healthy streams are also the product of healthy watershed conditions include the riparian zone, floodplain, wetlands, and uplands. These
3 Low range values for hatchery impacts were based on the product of an assumed 10% fitness effect and the percentage of hatchery origin spawners (pHOS) for the stock [e.g., 0.1 x pHOS). These values reflect a high relative fitness of hatchery fish that might be expected in a fully-integrated program High range values are based on relationships identified in Chilcote et al. 2011, which typically produce impacts substantially greater than pHOS (e.g., 1.5 x pHOS). High range values reflect both fitness and some level of fish health or ecological impact.
MAFAC CBP Task Force Phase II Report Final 8/29/20
8
essential habitat features have been widely affected by urbanization, logging, agriculture, road building, gravel mining, channelization, and water withdrawals.
Estimation Methods The general approach used to measure this change in productivity so to compare historical, or pre-development, adult abundance to current abundance and the resulting percent change in abundance is used as the habitat impact estimate. Tributary Habitat Impact is estimated using abundance data and the formula for this calculation is as follows:
Impact = 1 – (current abundance/historical abundance)
Individual estimates for populations are combined to provide an aggregate habitat impact estimates for the stock. Population specific habitat impacts are combined using a weighted average, rather than a simple average, to estimate habitat impacts at the stock level. The weighted average is preferred because this average better reflects the contribution of individual populations to the overall stock average. The weighting strategy utilizes a metric that represents what percentage of the stock an individual population comprises and is calculated using the following steps:
1. Individual population values for weighting factor divided by sum of weighting factor for all populations to estimate the proportion of the stock each population represents
2. Individual population impact estimates multiplied by proportion calculated in step 1 to estimate weighted estimate for each population
3. Weighted estimates for individual population calculated in Step 2 summed to estimate habitat impact for entire stock
This approach assumes that abundance estimates provide reasonable estimates of freshwater productivity and that methodologies used to estimate historical and current abundance provide comparable results. Ideally, directly measured abundance number would be available for use in this analysis. However, direct measures of historic abundance are seldom available so other methodologies are used to estimate adult abundances. Historical and current abundance estimates need to be made using similar methodology to provide accurate estimates of habitat impacts and in most cases inferences from habitat-based models are used to estimate historical and current abundance. For some stocks, habitat models are not available and estimates from the CBP Phase 1 report are used.
For some stocks estimates of both historical and current abundance are not available and in these cases the habitat impact is estimated directly. Methodologies used for estimating habitat impacts include results of habitat based modelling or expert opinion of biologists that are familiar with the basin in question.
The method utilized by the CBP Partnership depends on the data, which varies between stocks and populations. A summary of the different sources of data are as follows:
Ecosystem Diagnosis and Treatment (EDT) - EDT can be classified as a mechanistic model that is based on relationships between aquatic habitat characteristics and fish performance. The model considers 46 different physical habitat attributes, integrates all potential life history
MAFAC CBP Task Force Phase II Report Final 8/29/20
9
trajectories, and calculates four performance metrics, including equilibrium abundance. Inputs for the physical habitat metrics are preferably based on empirical data, but this data is not always available and for attributes where direct empirical data is not available inputs are inferred from similar areas where empirical data exists or using expert opinion. The EDT model incorporates a density-dependent Beverton-Holt survival function to estimate equilibrium abundance and habitat capacity, measured using adult abundance.
The EDT model provides estimates of current (patient) and historical (template) abundance. The historical/template condition is defined as pre-non-Native American European influence and represents a hypothetical optimum. The current/patient condition represents the immediate past few years. The model also produces estimate of habitat capacity but abundance at capacity is not sustainable over multiple generations. Therefore, the CBP Partnership used the equilibrium abundance estimates to estimate Tributary Habitat Impacts. A more complete description of the EDT analytical methodology is presented in the Appendix E of the Washington Lower Columbia Salmon Recovery and Fish & Wildlife Subbasin Plan.
Conservation Assessment Tool for Anadromous Salmonids (CATAS) - CATAS is a population model that was developed to assist salmonid conservation and recovery planning in Oregon. The primary focus of the model is to forecast probabilities of extinction risk for Oregon salmon and steelhead populations. Forecasts are performed using a set of assumptions for several key variables such as reproductive rate, habitat capacity, environmental variability, critical population abundance, proportion of hatchery fish, and fishery caused mortality rates. The values can be set for a variety of time periods, one of which is the current time frame. CATAS combines a deterministic recruitment model (Beverton-Holt) and a Monte Carlo simulation of random fluctuations in environmental conditions to forecast future population abundance.
Estimates of historical abundance for Oregon stocks in the Lower Columbia Evolutionarily Significant Unit (ESU) are provided by National Marine Fisheries Service (NMFS) status reviews and the Willamette Lower Columbia Technical Review Team (WLC TRT). These historical abundance estimates are then compared to the current abundance estimates produced using the CATAS model. ODFW used the CATAS model to estimate current mortality due to anthropogenic causes associated with six major threat categories: tributary habitat, estuary habitat, hydropower, fish harvest, hatchery fish and estuary predation. Direct estimates of mortality can only be estimated for five of the six anthropogenic causes, with tributary habitat being the cause that cannot be directly estimated using CATAS. The current cumulative mortality is estimated using the five anthropogenic causes for which there are direct estimates and the resulting current abundance is compared to the historical abundance. The remaining difference is attributed between current, after accounting for impacts from the five anthropogenic causes, and historical abundance is then attributed to anthropogenic alterations to tributary habitat, which are used to estimate the Tributary Habitat Impacts for a given population. A more complete description of the CATAS modeling approach can be found in Chapter 4, Chapter 6 and Appendix C of the Lower Columbia River Conservation & Recovery Plan for Oregon Populations of Salmon and Steelhead.
MAFAC CBP Task Force Phase II Report Final 8/29/20
10
Life Cycle Modeling - Lower Columbia Fish Recovery Board (LCFRB) and Washington Department of Fish and Wildlife (WDFW) conducted a population viability analysis as part of the development of the recovery plan for Washington populations in the Lower Columbia. This analysis utilized results from EDT analyses and a Beverton-Holt recruitment function to conduct a Population Viability Analysis (PVA) and evaluate risk to individual populations. The PVA analysis is a demographic analysis that is based on estimates of abundance and productivity. Analyses are useful for quantifying the level of improvement needed to reduce risk to specified levels.
This analysis is used to estimate impacts (i.e. reductions in populations productivity) for six different threat categories, including freshwater habitat. The model estimates the impacts to the population at the time of listing and impacts when the population achieved its recovery target. The impact estimate at the recovery target is used to estimate the Tributary Habitat Impacts for a given population. Impact estimates from life cycle modeling are used for some Washington populations where calculation of the habitat impact using available historical and current abundance estimates provide an unreasonable habitat impact estimate. A more complete description of the Life Cycle modeling can be found in Chapter 6 and Appendix 12 of the Washington Lower Columbia Salmon Recovery and Fish & Wildlife Subbasin Plan.
Expert Panel - In 2012 the Upper Columbia Salmon Recovery Board (UCSRB) convened and expert panel to re-examine the list of ecological concerns being used in each watershed, and used all current monitoring information to adjust the current condition and potential future condition values for each watershed. The result is a useful in summarizing the condition of habitat in the Upper Columbia, which includes an estimate of current habitat condition for each ecological concern within each assessment unit. The individual ecological concerns are weighted by assessment unit and ecological concern importance to provide an overall estimate of current condition of the watershed, which is expressed as a percentage of the historical habitat potential. This percentage is termed Percent Function and is used to estimate the Freshwater Habitat Impacts. For CBP Partnership purposes this percent function metric is used as the habitat impact estimate for most Upper Columbia populations. A more complete description of the Upper Columbia Salmon Recovery Board Habitat Background Summary.
Regional Experts - For some populations information necessary to estimate historical abundance, current abundance or habitat impact is not available. In these situations, the CBP Partnership convened regional experts with knowledge of the habitat conditions in the basin of interest. Generally, regional experts provided estimates of the current habitat conditions in comparison to their historical condition, similar to percent function described in expert panel section, and this estimate is used to estimate the Tributary Habitat Impacts. In some situations, regional experts provided historical and current abundance estimates that are subsequently used to produce impact estimates.
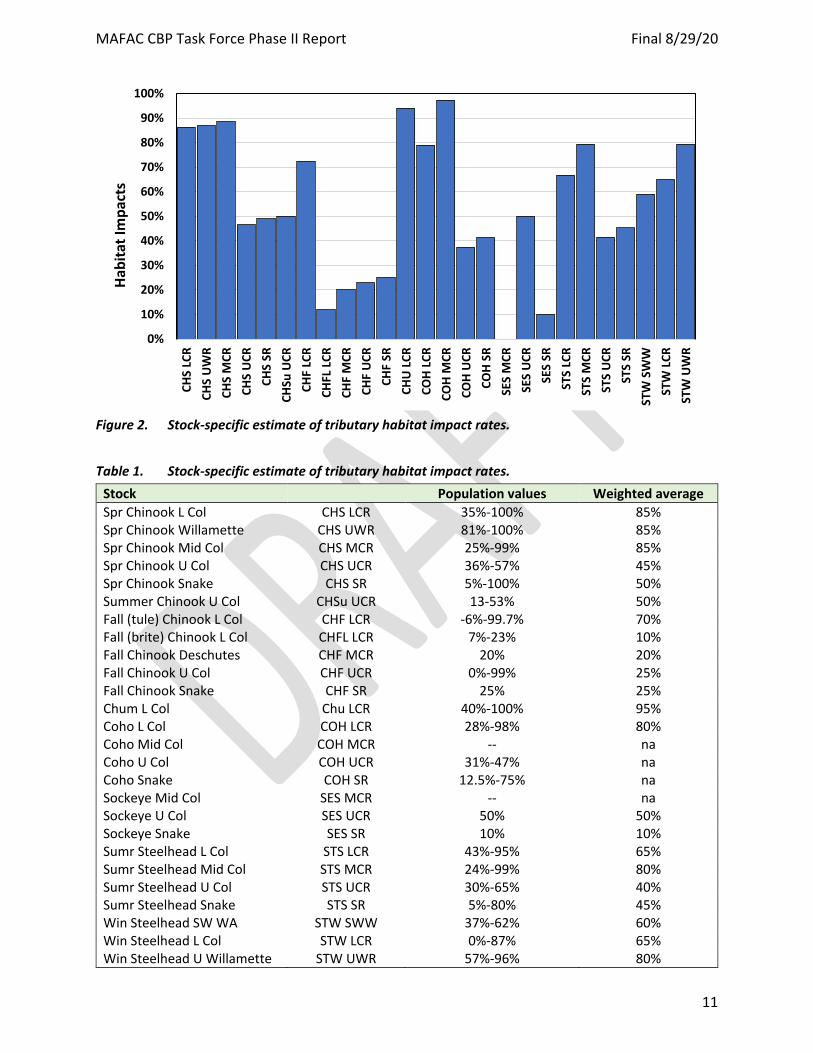
Stock-Specific Estimates Habitat impacts are substantial for most stocks, often exceeding 80 percent in highly developed portions of the Basin (Figure 1). Habitat impacts exceed 50 percent in 14 of the 26 stocks. Habitat impacts exceed 20 percent in 23 stocks.
MAFAC CBP Task Force Phase II Report Final 8/29/20
11
Figure 2. Stock-specific estimate of tributary habitat impact rates. Table 1. Stock-specific estimate of tributary habitat impact rates.
Stock Population values Weighted average Spr Chinook L Col CHS LCR 35%-100% 85% Spr Chinook Willamette CHS UWR 81%-100% 85% Spr Chinook Mid Col CHS MCR 25%-99% 85% Spr Chinook U Col CHS UCR 36%-57% 45% Spr Chinook Snake CHS SR 5%-100% 50% Summer Chinook U Col CHSu UCR 13-53% 50% Fall (tule) Chinook L Col CHF LCR -6%-99.7% 70% Fall (brite) Chinook L Col CHFL LCR 7%-23% 10% Fall Chinook Deschutes CHF MCR 20% 20% Fall Chinook U Col CHF UCR 0%-99% 25% Fall Chinook Snake CHF SR 25% 25% Chum L Col Chu LCR 40%-100% 95% Coho L Col COH LCR 28%-98% 80% Coho Mid Col COH MCR -- na Coho U Col COH UCR 31%-47% na Coho Snake COH SR 12.5%-75% na Sockeye Mid Col SES MCR -- na Sockeye U Col SES UCR 50% 50% Sockeye Snake SES SR 10% 10% Sumr Steelhead L Col STS LCR 43%-95% 65% Sumr Steelhead Mid Col STS MCR 24%-99% 80% Sumr Steelhead U Col STS UCR 30%-65% 40% Sumr Steelhead Snake STS SR 5%-80% 45% Win Steelhead SW WA STW SWW 37%-62% 60% Win Steelhead L Col STW LCR 0%-87% 65% Win Steelhead U Willamette STW UWR 57%-96% 80%
0%
10%
20%
30%
40%
50%
60%
70%
80%
90%
100%
CHS
LCR
CHS
UW
RCH
S M
CRCH
S U
CRCH
S SR
CHSu
UCR
CHF
LCR
CHFL
LCR
CHF
MCR
CHF
UCR
CHF
SRCH
U L
CRCO
H LC
RCO
H M
CRCO
H U
CRCO
H SR
SES
MCR
SES
UCR
SES
SRST
S LC
RST
S M
CRST
S U
CRST
S SR
STW
SW
WST
W L
CRST
W U
WR
Habi
tat I
mpa
cts
MAFAC CBP Task Force Phase II Report Final 8/29/20
12
Impact Estimates - Estuary Habitat Definition For the purposes of Columbia Basin Partnership analysis, estuary impacts are defined in terms of the mortality rate of juvenile salmonids in migration through the tidally influenced 146 miles of the Columbia River from Bonneville Dam to the Pacific Ocean. Mortality is distinguished by documented predation and other sources. Current mortality reflects the effects on salmon and steelhead due to estuarine habitat loss and alternation, as well of mortality which would otherwise have occurred under natural conditions.
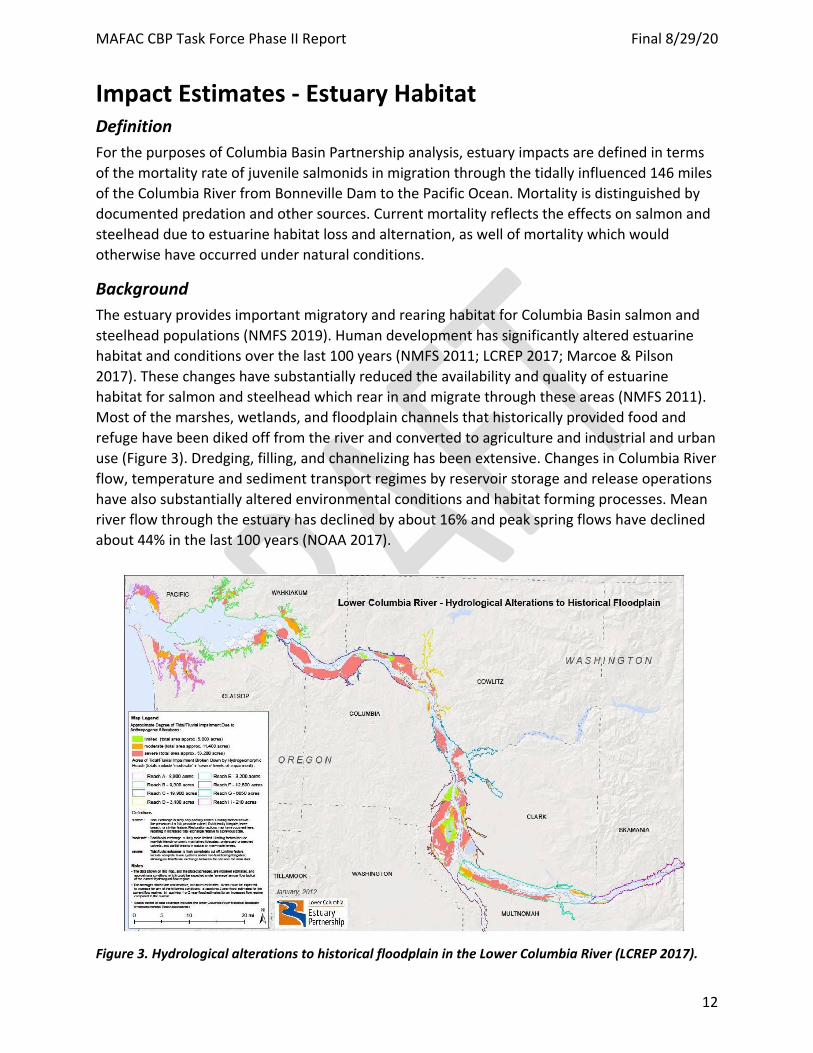
Background The estuary provides important migratory and rearing habitat for Columbia Basin salmon and steelhead populations (NMFS 2019). Human development has significantly altered estuarine habitat and conditions over the last 100 years (NMFS 2011; LCREP 2017; Marcoe & Pilson 2017). These changes have substantially reduced the availability and quality of estuarine habitat for salmon and steelhead which rear in and migrate through these areas (NMFS 2011). Most of the marshes, wetlands, and floodplain channels that historically provided food and refuge have been diked off from the river and converted to agriculture and industrial and urban use (Figure 3). Dredging, filling, and channelizing has been extensive. Changes in Columbia River flow, temperature and sediment transport regimes by reservoir storage and release operations have also substantially altered environmental conditions and habitat forming processes. Mean river flow through the estuary has declined by about 16% and peak spring flows have declined about 44% in the last 100 years (NOAA 2017).
Figure 3. Hydrological alterations to historical floodplain in the Lower Columbia River (LCREP 2017).
MAFAC CBP Task Force Phase II Report Final 8/29/20
13
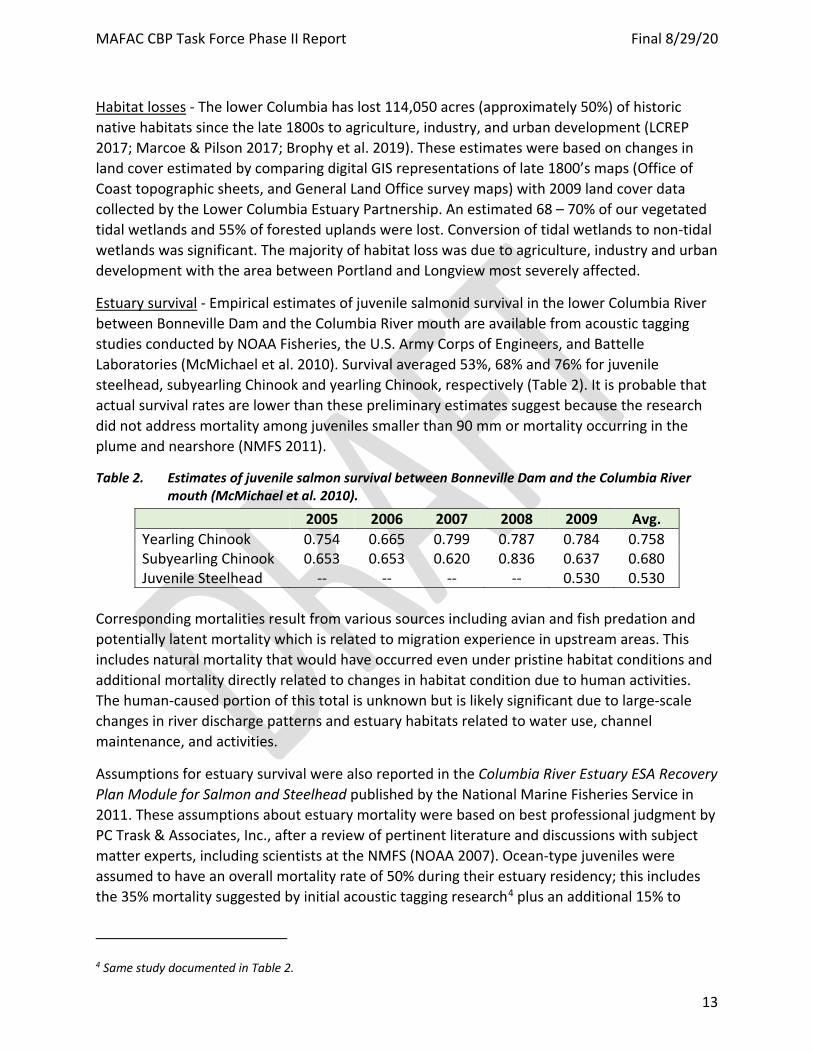
Habitat losses - The lower Columbia has lost 114,050 acres (approximately 50%) of historic native habitats since the late 1800s to agriculture, industry, and urban development (LCREP 2017; Marcoe & Pilson 2017; Brophy et al. 2019). These estimates were based on changes in land cover estimated by comparing digital GIS representations of late 1800’s maps (Office of Coast topographic sheets, and General Land Office survey maps) with 2009 land cover data collected by the Lower Columbia Estuary Partnership. An estimated 68 – 70% of our vegetated tidal wetlands and 55% of forested uplands were lost. Conversion of tidal wetlands to non-tidal wetlands was significant. The majority of habitat loss was due to agriculture, industry and urban development with the area between Portland and Longview most severely affected.
Estuary survival - Empirical estimates of juvenile salmonid survival in the lower Columbia River between Bonneville Dam and the Columbia River mouth are available from acoustic tagging studies conducted by NOAA Fisheries, the U.S. Army Corps of Engineers, and Battelle Laboratories (McMichael et al. 2010). Survival averaged 53%, 68% and 76% for juvenile steelhead, subyearling Chinook and yearling Chinook, respectively (Table 2). It is probable that actual survival rates are lower than these preliminary estimates suggest because the research did not address mortality among juveniles smaller than 90 mm or mortality occurring in the plume and nearshore (NMFS 2011).
Table 2. Estimates of juvenile salmon survival between Bonneville Dam and the Columbia River mouth (McMichael et al. 2010).
2005 2006 2007 2008 2009 Avg. Yearling Chinook 0.754 0.665 0.799 0.787 0.784 0.758 Subyearling Chinook 0.653 0.653 0.620 0.836 0.637 0.680 Juvenile Steelhead -- -- -- -- 0.530 0.530
Corresponding mortalities result from various sources including avian and fish predation and potentially latent mortality which is related to migration experience in upstream areas. This includes natural mortality that would have occurred even under pristine habitat conditions and additional mortality directly related to changes in habitat condition due to human activities. The human-caused portion of this total is unknown but is likely significant due to large-scale changes in river discharge patterns and estuary habitats related to water use, channel maintenance, and activities.
Assumptions for estuary survival were also reported in the Columbia River Estuary ESA Recovery Plan Module for Salmon and Steelhead published by the National Marine Fisheries Service in 2011. These assumptions about estuary mortality were based on best professional judgment by PC Trask & Associates, Inc., after a review of pertinent literature and discussions with subject matter experts, including scientists at the NMFS (NOAA 2007). Ocean-type juveniles were assumed to have an overall mortality rate of 50% during their estuary residency; this includes the 35% mortality suggested by initial acoustic tagging research4 plus an additional 15% to
4 Same study documented in Table 2.
MAFAC CBP Task Force Phase II Report Final 8/29/20
14
account for juveniles too small to be tracked. Stream-type juveniles were assumed to have an overall mortality rate of 40% during estuary and plume residency. This rate was based on the 25% mortality found in initial acoustic tagging research plus an additional 15% to account for mortality occurring in the plume, which was not part of study. The Estuary Module did not distinguish between human and other unmanageable and potentially-manageable sources of mortality.
Improvement targets - Estuary survival assumptions previously reported by NMFS (2011) were the basis for estuary survival improvement targets identified in the estuary recovery plan module. These targets were intended to provide guidance for implementation of different management actions as a planning tool describing the level of effort needed to recover salmonids. For planning purposes only, this estuary recovery plan module selected 20% as a target for improvement in the survival rate of wild, ESA-listed ocean and stream-type juveniles in the estuary and plume. Twenty percent represented a hypothetical level of improvement that might be realized through the implementation of the management actions, assuming that considerable effort is expended to help offset constraints to implementation, such that threats and limiting factors are reduced. Based on module assumptions of a 50% ocean-type life history survival and a 60% stream-type life history survival, this translates into a net survival increase or mortality decrease of 10% for ocean types and 12% for stream types (including predation).
Extensive estuary habitat protection and restoration efforts are ongoing. This work involves a variety of regional partners (land trusts, watershed councils, and agencies amongst others) and the Lower Columbia Estuary Partnership (LCREP). From 2000 through 2019, related efforts have protected or restored over 28,387 acres of habitat at 236 projects (https://www.estuarypartnership.org/who-we-are/mission-accomplishments). The Estuary Partnership has developed additional voluntary targets with a focus on maintaining the remaining native habitats and restoring priority habitats— those habitats that suffered the most loss (LCREP 2017). Priorities are based on potential habitat restoration sites with the highest value at the ecosystem scale. These habitat coverage targets were derived using the historic rate of implementation of restoration and protection actions. Key targets include:
1) No net loss of native habitats from the 2009 baseline; 2) Recover 30% (10,382 acres) of the historic coverage of priority native habitats by 2030;
and 3) Recover 40% (22,480 acres) of the historic coverage of priority native habitats by 2050.
Meeting these targets will bring us to an average of 60% native habitat coverage by 2050 (LCREP 2017).
Estimation Methods Quantifying the impact of habitat changes in the estuary on juvenile salmon mortality is extremely difficult. Other assessments have measured changes in habitat conditions that are known to affect salmonid life history. However, translating these habitat changes into fish values is difficult because the relationships are complex and have not been extensively investigated.
MAFAC CBP Task Force Phase II Report Final 8/29/20
15
Therefore, the CBP analysis is based simply on empirical estimates of estuary mortality reported by McMichael et al. (2010).5 These values are based on average annual survival rates between the Bonneville Forebay and the Columbia River mouth and are a function of both natural and human-related factors. Estimates do not include assumptions for mortality which occurs in the Columbia River plume due to the lack related empirical information. Documented predation mortality of juveniles is subtracted from the total estuary mortality because predation is treated as a separate impact for the purposes of the CBP analysis.6
Stock-specific mortality rates are based on values for species and life history type documented in Table 2. Estimates are available for subyearling Chinook, yearling Chinook and juvenile steelhead. Estuary mortality rates for Coho and Sockeye were assumed to be similar to those of yearling Chinook. No information is available on estuary mortality rates of Chum salmon. Because Chum salmon emigrate into the estuary as fry, we hypothesize that estuary mortality rates are greater than those of other species. We assumed a 50% mortality rate for the purposes of this exercise.
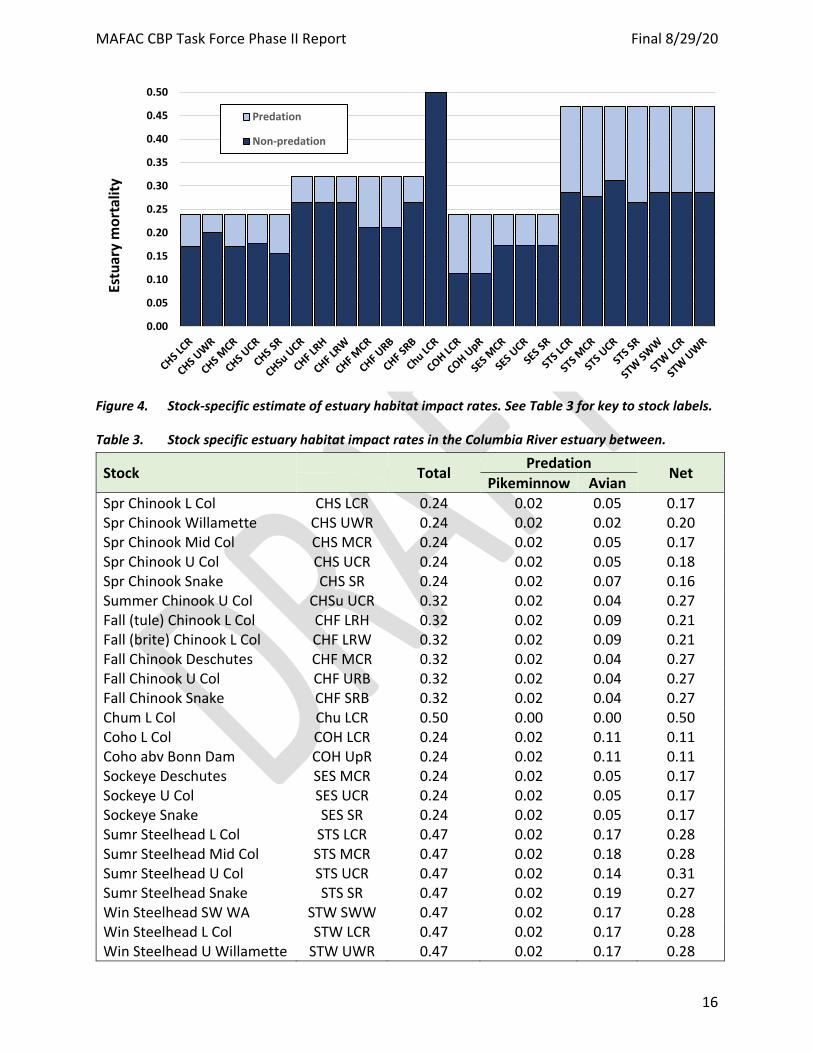
Stock-Specific Estimates Estuary mortality of juvenile salmon and steelhead ranges from 24% to 50% (Figure 4, Table 3). Predation documented for Terns, Cormorants and pikeminnow accounts for 0 to 19% of the totals. Non-predation mortality ranges from 11-50%. Rate vary with species and life history. The highest rates are assumed to occur for Chum Salmon which emigrate into the estuary as fry soon after emergence and may rear there for some period. The lowest rates were estimated for Spring Chinook, Coho and Sockeye salmon which typically transit the estuary relatively quickly on their way to the ocean.
5 The Washington Lower Columbia Recovery Plan previously attempted to assign values to human related estuary mortality based on PC Trask & Associate values documented in NOAA (2011) in order to place estuary habitat impacts in perspective relative to other potentially-manageable factors affecting salmonids. There, estuary habitat impacts were assumed account for half of the non-predation related total mortality of juveniles in the estuary from Caspian terns, cormorants, and northern pikeminnow. The CBP values made no such attempt to apportion human-related and natural sources of mortality in the estuary.
6 Predation impacts are documented in a separate chapter.
MAFAC CBP Task Force Phase II Report Final 8/29/20
16
Figure 4. Stock-specific estimate of estuary habitat impact rates. See Table 3 for key to stock labels.
Table 3. Stock specific estuary habitat impact rates in the Columbia River estuary between.
Stock Total Predation Net Pikeminnow Avian
Spr Chinook L Col CHS LCR 0.24 0.02 0.05 0.17 Spr Chinook Willamette CHS UWR 0.24 0.02 0.02 0.20 Spr Chinook Mid Col CHS MCR 0.24 0.02 0.05 0.17 Spr Chinook U Col CHS UCR 0.24 0.02 0.05 0.18 Spr Chinook Snake CHS SR 0.24 0.02 0.07 0.16 Summer Chinook U Col CHSu UCR 0.32 0.02 0.04 0.27 Fall (tule) Chinook L Col CHF LRH 0.32 0.02 0.09 0.21 Fall (brite) Chinook L Col CHF LRW 0.32 0.02 0.09 0.21 Fall Chinook Deschutes CHF MCR 0.32 0.02 0.04 0.27 Fall Chinook U Col CHF URB 0.32 0.02 0.04 0.27 Fall Chinook Snake CHF SRB 0.32 0.02 0.04 0.27 Chum L Col Chu LCR 0.50 0.00 0.00 0.50 Coho L Col COH LCR 0.24 0.02 0.11 0.11 Coho abv Bonn Dam COH UpR 0.24 0.02 0.11 0.11 Sockeye Deschutes SES MCR 0.24 0.02 0.05 0.17 Sockeye U Col SES UCR 0.24 0.02 0.05 0.17 Sockeye Snake SES SR 0.24 0.02 0.05 0.17 Sumr Steelhead L Col STS LCR 0.47 0.02 0.17 0.28 Sumr Steelhead Mid Col STS MCR 0.47 0.02 0.18 0.28 Sumr Steelhead U Col STS UCR 0.47 0.02 0.14 0.31 Sumr Steelhead Snake STS SR 0.47 0.02 0.19 0.27 Win Steelhead SW WA STW SWW 0.47 0.02 0.17 0.28 Win Steelhead L Col STW LCR 0.47 0.02 0.17 0.28 Win Steelhead U Willamette STW UWR 0.47 0.02 0.17 0.28
0.00
0.05
0.10
0.15
0.20
0.25
0.30
0.35
0.40
0.45
0.50
Estu
ary
mor
talit
yPredation
Non-predation
MAFAC CBP Task Force Phase II Report Final 8/29/20
17
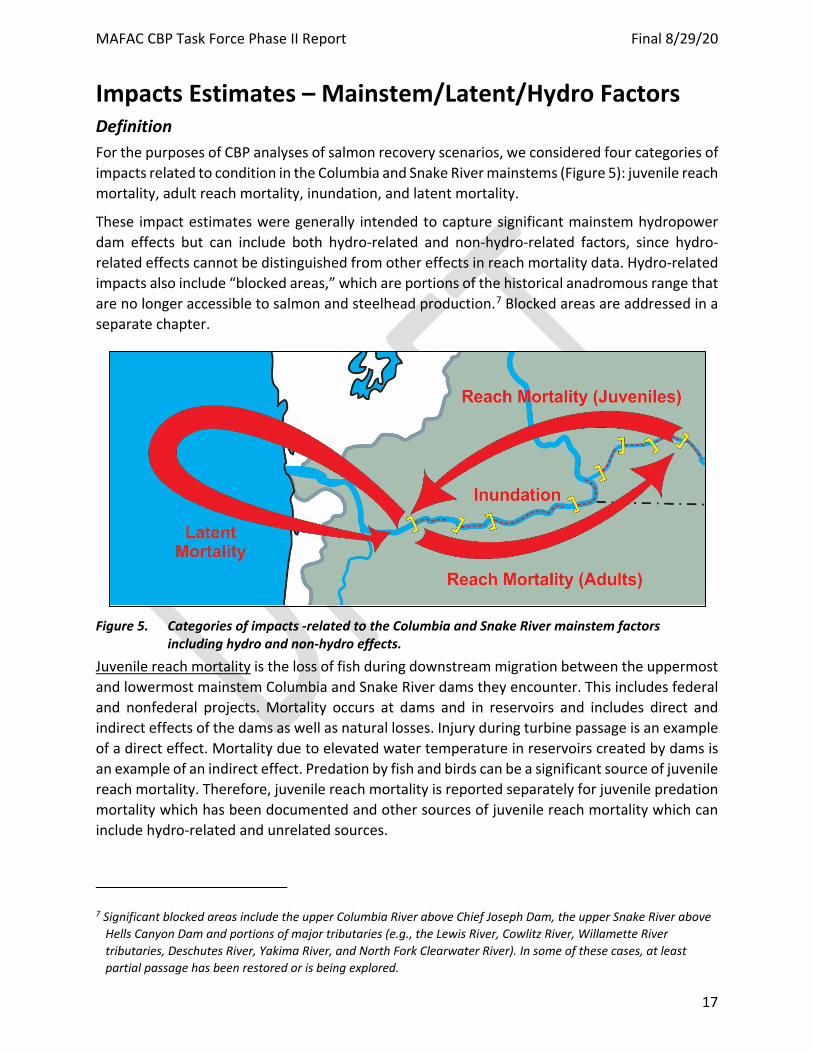
Impacts Estimates – Mainstem/Latent/Hydro Factors Definition For the purposes of CBP analyses of salmon recovery scenarios, we considered four categories of impacts related to condition in the Columbia and Snake River mainstems (Figure 5): juvenile reach mortality, adult reach mortality, inundation, and latent mortality.
These impact estimates were generally intended to capture significant mainstem hydropower dam effects but can include both hydro-related and non-hydro-related factors, since hydro-related effects cannot be distinguished from other effects in reach mortality data. Hydro-related impacts also include “blocked areas,” which are portions of the historical anadromous range that are no longer accessible to salmon and steelhead production.7 Blocked areas are addressed in a separate chapter.
Figure 5. Categories of impacts -related to the Columbia and Snake River mainstem factors
including hydro and non-hydro effects. Juvenile reach mortality is the loss of fish during downstream migration between the uppermost and lowermost mainstem Columbia and Snake River dams they encounter. This includes federal and nonfederal projects. Mortality occurs at dams and in reservoirs and includes direct and indirect effects of the dams as well as natural losses. Injury during turbine passage is an example of a direct effect. Mortality due to elevated water temperature in reservoirs created by dams is an example of an indirect effect. Predation by fish and birds can be a significant source of juvenile reach mortality. Therefore, juvenile reach mortality is reported separately for juvenile predation mortality which has been documented and other sources of juvenile reach mortality which can include hydro-related and unrelated sources.
7 Significant blocked areas include the upper Columbia River above Chief Joseph Dam, the upper Snake River above Hells Canyon Dam and portions of major tributaries (e.g., the Lewis River, Cowlitz River, Willamette River tributaries, Deschutes River, Yakima River, and North Fork Clearwater River). In some of these cases, at least partial passage has been restored or is being explored.
MAFAC CBP Task Force Phase II Report Final 8/29/20
18
Adult reach mortality is the loss of fish during upstream migration between the lowermost and uppermost mainstem Columbia and Snake River dams they encounter. This includes federal and nonfederal projects. Mortality occurs at dams and in reservoirs and includes direct and indirect effects of the dams as well as natural losses. Reported fishery mortality between dams is subtracted from total estimates of adult reach mortality and reported separately. Estimates of adult reach mortality do not quantify percentages of fish straying outside subbasins of origin, which in some cases is a secondary hydro effect similar to increased straying of juveniles that were collected and transported around mainstem dams.
Inundation is the loss of historical production areas due to inundation, in this case by Columbia and Snake River mainstem reservoirs within the current area of anadromy. This is not a mortality per se but rather a reduction in the numbers of fish that could be produced in the absence of the reservoirs. Large numbers of salmon, particularly fall Chinook, historically spawned in the river mainstems. Spawning in many reaches is now limited to dam tailraces.
Latent mortality is mortality that occurs downstream from Bonneville Dam, either in the estuary or the ocean, as a result of delayed effects of passage through the hydro system. Latent mortality is identified separately in order to clearly represent the magnitude and uncertainty of this parameter relative to reach mortality which is estimated with relatively high confidence.
Mainstem/Hydro Juvenile Reach Mortality
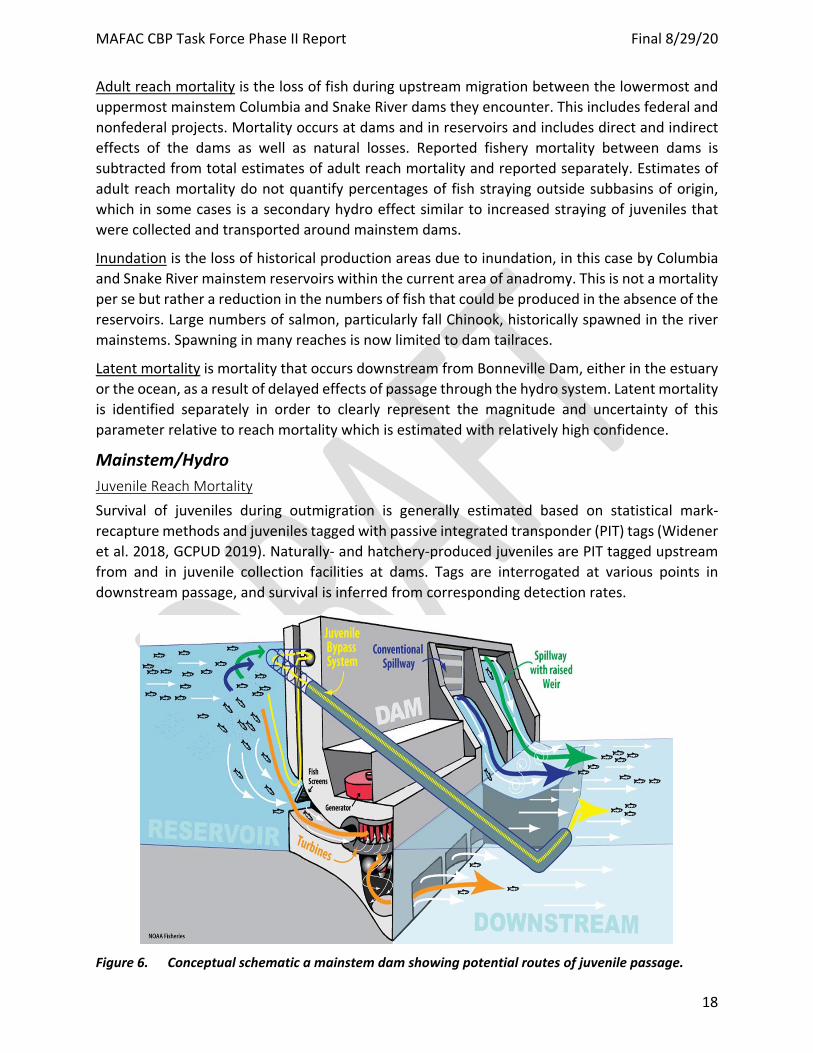
Survival of juveniles during outmigration is generally estimated based on statistical mark-recapture methods and juveniles tagged with passive integrated transponder (PIT) tags (Widener et al. 2018, GCPUD 2019). Naturally- and hatchery-produced juveniles are PIT tagged upstream from and in juvenile collection facilities at dams. Tags are interrogated at various points in downstream passage, and survival is inferred from corresponding detection rates.
Figure 6. Conceptual schematic a mainstem dam showing potential routes of juvenile passage.
MAFAC CBP Task Force Phase II Report Final 8/29/20
19
Juvenile mortality occurs at dams and in reservoirs between dams. Dam passage mortality varies with passage route and fish characteristics such as size and degree of smoltification (Muir et al. 2001 Faulkner et. al. 2019). Fish can pass over spillways, through juvenile bypass systems, or through turbines (Figure 6). Typically, turbines are the least benign route and spillways are the most benign route. The large majority of fish passing via any of these routes survive passage at any individual dam – in other words, net passage survival at any given dam is relatively high. Dam and reservoir mortality rates of any given stock are generally around 10 percent (±5 percent) per project, when averaged over several projects. Rates at specific projects may be lower or higher than the average depending on conditions at any particular project. Mortality accrues with the number of dams passed. Thus, net mortality of juveniles can reach or exceed 50 percent for those that pass eight or nine dams and associated reservoirs.8
Reach survivals used in the CBP analysis are the 2013-2018 averages reported by NMFS (2019). This time period generally represents recent conditions, including increased spill and reduced transportation of juveniles from Snake River dams to below Bonneville Dam. Because transported fish are not subject to reach mortality, estimates are weighted by the percentage of migrants that are collected and transported from Snake River dams and to below Bonneville Dam. Hence, aggregate stock estimates of migration mortality are less than estimates reported for in-river migrants alone. PIT tag estimates are not available for every stock. Impacts for stocks without empirical estimates were inferred from similar stocks with adjustments for numbers of dams passed based on per dam averages.
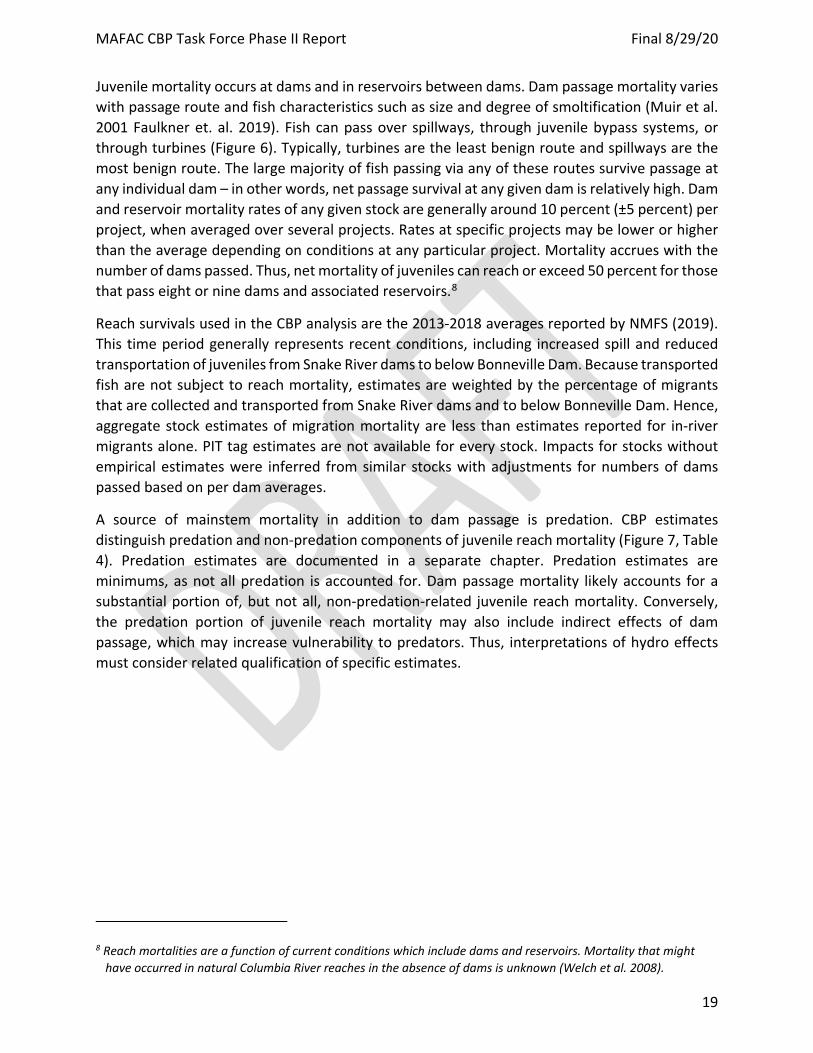
A source of mainstem mortality in addition to dam passage is predation. CBP estimates distinguish predation and non-predation components of juvenile reach mortality (Figure 7, Table 4). Predation estimates are documented in a separate chapter. Predation estimates are minimums, as not all predation is accounted for. Dam passage mortality likely accounts for a substantial portion of, but not all, non-predation-related juvenile reach mortality. Conversely, the predation portion of juvenile reach mortality may also include indirect effects of dam passage, which may increase vulnerability to predators. Thus, interpretations of hydro effects must consider related qualification of specific estimates.
8 Reach mortalities are a function of current conditions which include dams and reservoirs. Mortality that might have occurred in natural Columbia River reaches in the absence of dams is unknown (Welch et al. 2008).
MAFAC CBP Task Force Phase II Report Final 8/29/20
20
Figure 7. Stock-specific estimates of juvenile reach mortality upstream from Bonneville Dam (inriver
migrants).
0%
10%
20%
30%
40%
50%
60%
CHS
LCR
CHS
UW
R
CHS
MCR
CHS
UCR
CHS
SR
CHSu
UCR
CHF
LCR
CHFl
LCR
CHF
MCR
CHF
UCR
CHF
SR
CHU
LCR
COH
LCR
COH
UpR
SES
MCR
SES
UCR
SES
SR
STS
LCR
STS
MCR
STS
UCR
STS
SR
STW
SW
W
STW
LCR
STW
UW
R
Juve
nile
reac
h m
orta
lity
Predation Other
MAFAC CBP Task Force Phase II Report Final 8/29/20
21
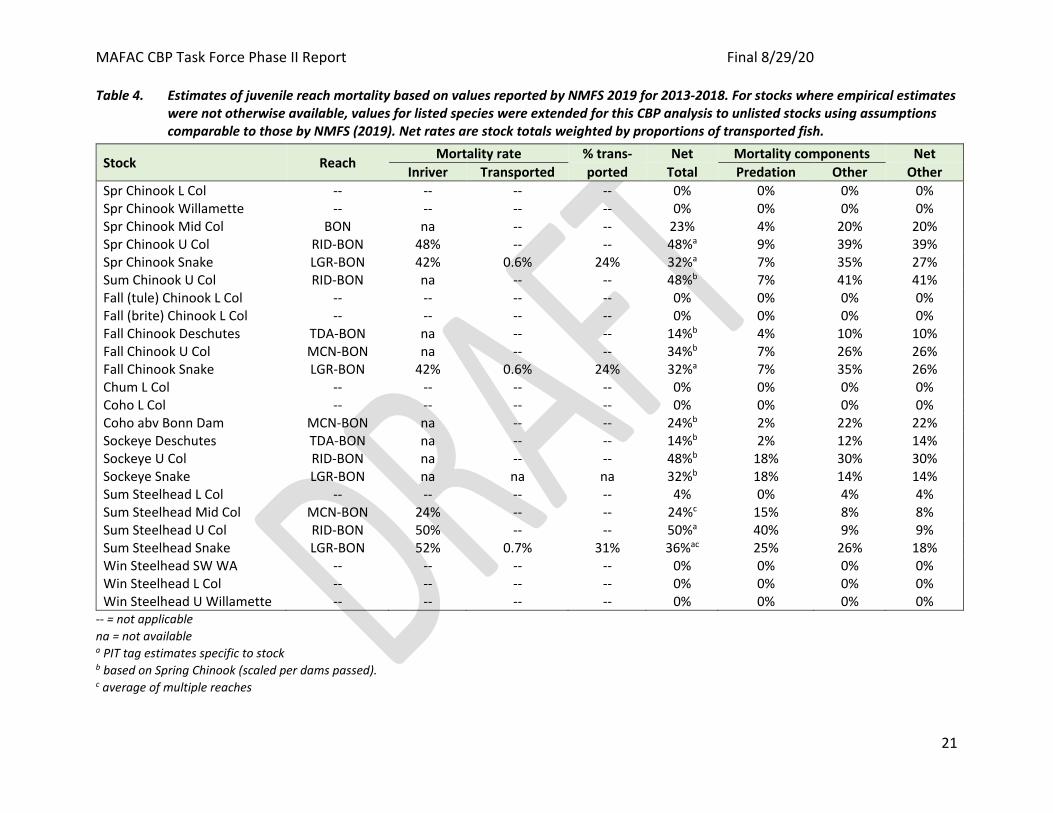
Table 4. Estimates of juvenile reach mortality based on values reported by NMFS 2019 for 2013-2018. For stocks where empirical estimates
were not otherwise available, values for listed species were extended for this CBP analysis to unlisted stocks using assumptions comparable to those by NMFS (2019). Net rates are stock totals weighted by proportions of transported fish.
Stock Reach Mortality rate % trans- Net Mortality components Net Inriver Transported ported Total Predation Other Other
Spr Chinook L Col -- -- -- -- 0% 0% 0% 0% Spr Chinook Willamette -- -- -- -- 0% 0% 0% 0% Spr Chinook Mid Col BON na -- -- 23% 4% 20% 20% Spr Chinook U Col RID-BON 48% -- -- 48%a 9% 39% 39% Spr Chinook Snake LGR-BON 42% 0.6% 24% 32%a 7% 35% 27% Sum Chinook U Col RID-BON na -- -- 48%b 7% 41% 41% Fall (tule) Chinook L Col -- -- -- -- 0% 0% 0% 0% Fall (brite) Chinook L Col -- -- -- -- 0% 0% 0% 0% Fall Chinook Deschutes TDA-BON na -- -- 14%b 4% 10% 10% Fall Chinook U Col MCN-BON na -- -- 34%b 7% 26% 26% Fall Chinook Snake LGR-BON 42% 0.6% 24% 32%a 7% 35% 26% Chum L Col -- -- -- -- 0% 0% 0% 0% Coho L Col -- -- -- -- 0% 0% 0% 0% Coho abv Bonn Dam MCN-BON na -- -- 24%b 2% 22% 22% Sockeye Deschutes TDA-BON na -- -- 14%b 2% 12% 14% Sockeye U Col RID-BON na -- -- 48%b 18% 30% 30% Sockeye Snake LGR-BON na na na 32%b 18% 14% 14% Sum Steelhead L Col -- -- -- -- 4% 0% 4% 4% Sum Steelhead Mid Col MCN-BON 24% -- -- 24%c 15% 8% 8% Sum Steelhead U Col RID-BON 50% -- -- 50%a 40% 9% 9% Sum Steelhead Snake LGR-BON 52% 0.7% 31% 36%ac 25% 26% 18% Win Steelhead SW WA -- -- -- -- 0% 0% 0% 0% Win Steelhead L Col -- -- -- -- 0% 0% 0% 0% Win Steelhead U Willamette -- -- -- -- 0% 0% 0% 0%
-- = not applicable na = not available a PIT tag estimates specific to stock b based on Spring Chinook (scaled per dams passed). c average of multiple reaches
MAFAC CBP Task Force Phase II Report Final 8/29/20
22
Adult Reach Mortality
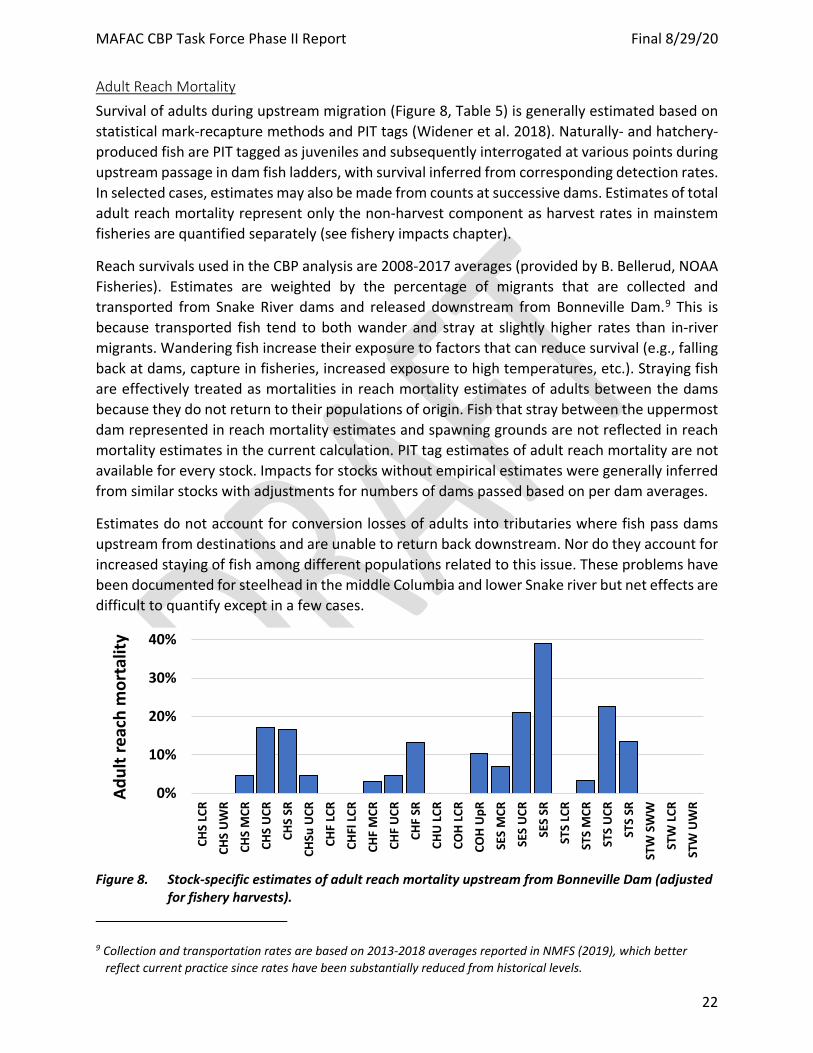
Survival of adults during upstream migration (Figure 8, Table 5) is generally estimated based on statistical mark-recapture methods and PIT tags (Widener et al. 2018). Naturally- and hatchery-produced fish are PIT tagged as juveniles and subsequently interrogated at various points during upstream passage in dam fish ladders, with survival inferred from corresponding detection rates. In selected cases, estimates may also be made from counts at successive dams. Estimates of total adult reach mortality represent only the non-harvest component as harvest rates in mainstem fisheries are quantified separately (see fishery impacts chapter).
Reach survivals used in the CBP analysis are 2008-2017 averages (provided by B. Bellerud, NOAA Fisheries). Estimates are weighted by the percentage of migrants that are collected and transported from Snake River dams and released downstream from Bonneville Dam.9 This is because transported fish tend to both wander and stray at slightly higher rates than in-river migrants. Wandering fish increase their exposure to factors that can reduce survival (e.g., falling back at dams, capture in fisheries, increased exposure to high temperatures, etc.). Straying fish are effectively treated as mortalities in reach mortality estimates of adults between the dams because they do not return to their populations of origin. Fish that stray between the uppermost dam represented in reach mortality estimates and spawning grounds are not reflected in reach mortality estimates in the current calculation. PIT tag estimates of adult reach mortality are not available for every stock. Impacts for stocks without empirical estimates were generally inferred from similar stocks with adjustments for numbers of dams passed based on per dam averages.
Estimates do not account for conversion losses of adults into tributaries where fish pass dams upstream from destinations and are unable to return back downstream. Nor do they account for increased staying of fish among different populations related to this issue. These problems have been documented for steelhead in the middle Columbia and lower Snake river but net effects are difficult to quantify except in a few cases.
Figure 8. Stock-specific estimates of adult reach mortality upstream from Bonneville Dam (adjusted
for fishery harvests).
9 Collection and transportation rates are based on 2013-2018 averages reported in NMFS (2019), which better reflect current practice since rates have been substantially reduced from historical levels.
0%
10%
20%
30%
40%
CHS
LCR
CHS
UW
R
CHS
MCR
CHS
UCR
CHS
SR
CHSu
UCR
CHF
LCR
CHFl
LCR
CHF
MCR
CHF
UCR
CHF
SR
CHU
LCR
COH
LCR
COH
UpR
SES
MCR
SES
UCR
SES
SR
STS
LCR
STS
MCR
STS
UCR
STS
SR
STW
SW
W
STW
LCR
STW
UW
R
Adul
t rea
ch m
orta
lity
MAFAC CBP Task Force Phase II Report Final 8/29/20
23
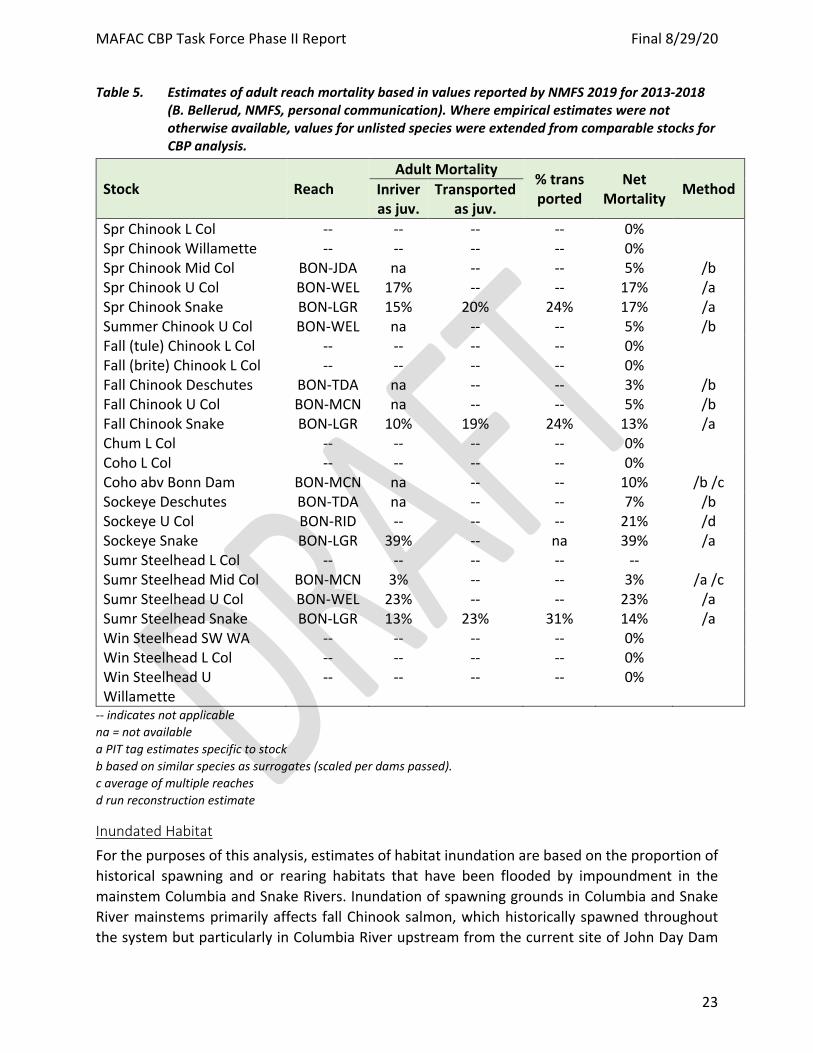
Table 5. Estimates of adult reach mortality based in values reported by NMFS 2019 for 2013-2018
(B. Bellerud, NMFS, personal communication). Where empirical estimates were not otherwise available, values for unlisted species were extended from comparable stocks for CBP analysis.
Stock Reach Adult Mortality % trans
ported Net
Mortality Method Inriver as juv.
Transported as juv.
Spr Chinook L Col -- -- -- -- 0% Spr Chinook Willamette -- -- -- -- 0% Spr Chinook Mid Col BON-JDA na -- -- 5% /b Spr Chinook U Col BON-WEL 17% -- -- 17% /a Spr Chinook Snake BON-LGR 15% 20% 24% 17% /a Summer Chinook U Col BON-WEL na -- -- 5% /b Fall (tule) Chinook L Col -- -- -- -- 0% Fall (brite) Chinook L Col -- -- -- -- 0% Fall Chinook Deschutes BON-TDA na -- -- 3% /b Fall Chinook U Col BON-MCN na -- -- 5% /b Fall Chinook Snake BON-LGR 10% 19% 24% 13% /a Chum L Col -- -- -- -- 0% Coho L Col -- -- -- -- 0% Coho abv Bonn Dam BON-MCN na -- -- 10% /b /c Sockeye Deschutes BON-TDA na -- -- 7% /b Sockeye U Col BON-RID -- -- -- 21% /d Sockeye Snake BON-LGR 39% -- na 39% /a Sumr Steelhead L Col -- -- -- -- -- Sumr Steelhead Mid Col BON-MCN 3% -- -- 3% /a /c Sumr Steelhead U Col BON-WEL 23% -- -- 23% /a Sumr Steelhead Snake BON-LGR 13% 23% 31% 14% /a Win Steelhead SW WA -- -- -- -- 0% Win Steelhead L Col -- -- -- -- 0% Win Steelhead U Willamette
-- -- -- -- 0%
-- indicates not applicable na = not available a PIT tag estimates specific to stock b based on similar species as surrogates (scaled per dams passed). c average of multiple reaches d run reconstruction estimate
Inundated Habitat
For the purposes of this analysis, estimates of habitat inundation are based on the proportion of historical spawning and or rearing habitats that have been flooded by impoundment in the mainstem Columbia and Snake Rivers. Inundation of spawning grounds in Columbia and Snake River mainstems primarily affects fall Chinook salmon, which historically spawned throughout the system but particularly in Columbia River upstream from the current site of John Day Dam
MAFAC CBP Task Force Phase II Report Final 8/29/20
24
and in the Snake River upstream from the current site of Ice harbor Dam.10 To a lesser extent, Bonneville Dam inundated habitat for Columbia River chum salmon.
Information is limited on potential production from inundated areas of the currently accessible range of stocks that spawn in the mainstem. The CBP analysis assumed inundation impacts of 50 percent, 25 percent, and 5 percent for UCR Fall Chinook, Snake River Fall Chinook, and Lower Columbia River Chum Salmon, respectively.
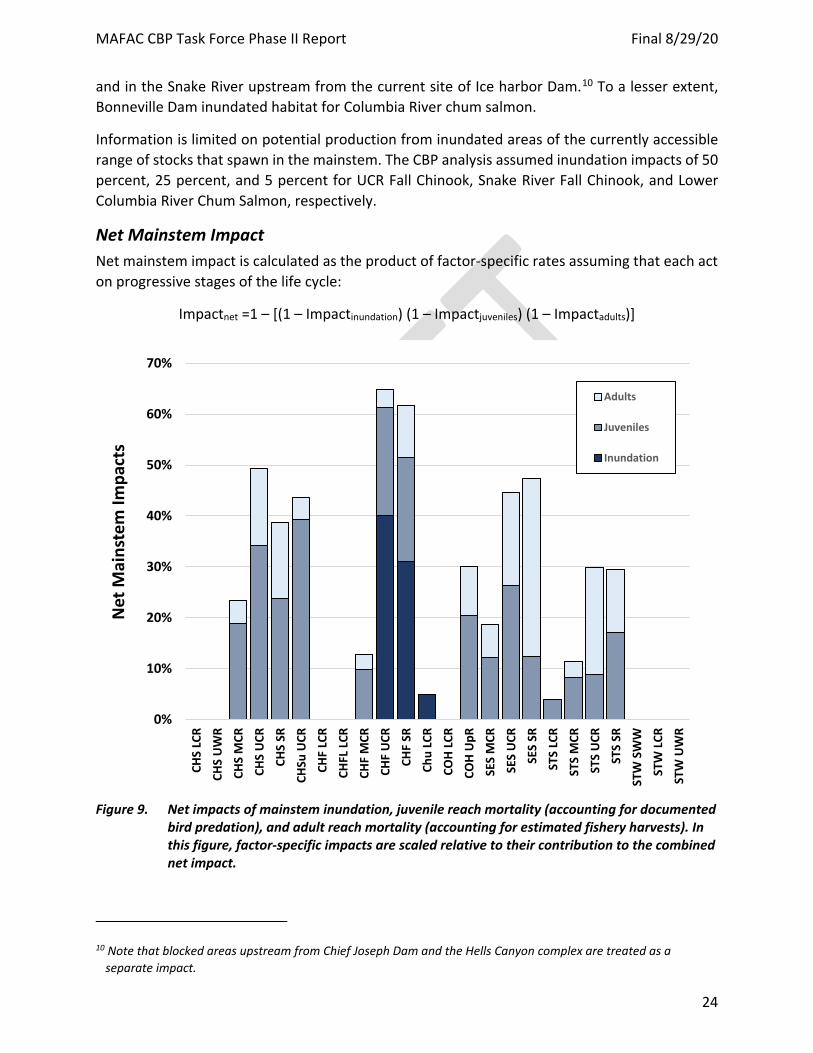
Net Mainstem Impact Net mainstem impact is calculated as the product of factor-specific rates assuming that each act on progressive stages of the life cycle:
Impactnet =1 – [(1 – Impactinundation) (1 – Impactjuveniles) (1 – Impactadults)]
Figure 9. Net impacts of mainstem inundation, juvenile reach mortality (accounting for documented
bird predation), and adult reach mortality (accounting for estimated fishery harvests). In this figure, factor-specific impacts are scaled relative to their contribution to the combined net impact.
10 Note that blocked areas upstream from Chief Joseph Dam and the Hells Canyon complex are treated as a separate impact.
0%
10%
20%
30%
40%
50%
60%
70%
CHS
LCR
CHS
UW
RCH
S M
CRCH
S U
CRCH
S SR
CHSu
UCR
CHF
LCR
CHFL
LCR
CHF
MCR
CHF
UCR
CHF
SRCh
u LC
RCO
H LC
RCO
H U
pRSE
S M
CRSE
S U
CRSE
S SR
STS
LCR
STS
MCR
STS
UCR
STS
SRST
W S
WW
STW
LCR
STW
UW
R
Net
Mai
nste
m Im
pact
s
Adults
Juveniles
Inundation
MAFAC CBP Task Force Phase II Report Final 8/29/20
25
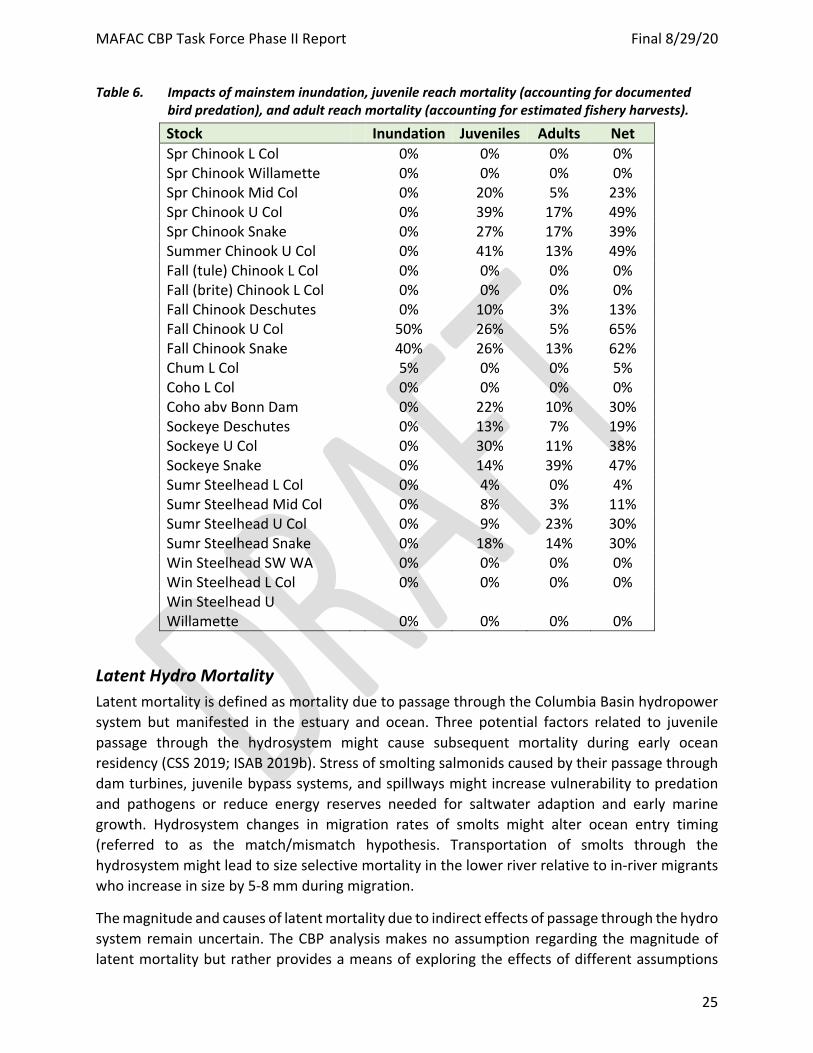
Table 6. Impacts of mainstem inundation, juvenile reach mortality (accounting for documented
bird predation), and adult reach mortality (accounting for estimated fishery harvests).
Stock Inundation Juveniles Adults Net Spr Chinook L Col 0% 0% 0% 0% Spr Chinook Willamette 0% 0% 0% 0% Spr Chinook Mid Col 0% 20% 5% 23% Spr Chinook U Col 0% 39% 17% 49% Spr Chinook Snake 0% 27% 17% 39% Summer Chinook U Col 0% 41% 13% 49% Fall (tule) Chinook L Col 0% 0% 0% 0% Fall (brite) Chinook L Col 0% 0% 0% 0% Fall Chinook Deschutes 0% 10% 3% 13% Fall Chinook U Col 50% 26% 5% 65% Fall Chinook Snake 40% 26% 13% 62% Chum L Col 5% 0% 0% 5% Coho L Col 0% 0% 0% 0% Coho abv Bonn Dam 0% 22% 10% 30% Sockeye Deschutes 0% 13% 7% 19% Sockeye U Col 0% 30% 11% 38% Sockeye Snake 0% 14% 39% 47% Sumr Steelhead L Col 0% 4% 0% 4% Sumr Steelhead Mid Col 0% 8% 3% 11% Sumr Steelhead U Col 0% 9% 23% 30% Sumr Steelhead Snake 0% 18% 14% 30% Win Steelhead SW WA 0% 0% 0% 0% Win Steelhead L Col 0% 0% 0% 0% Win Steelhead U Willamette 0% 0% 0% 0%
Latent Hydro Mortality Latent mortality is defined as mortality due to passage through the Columbia Basin hydropower system but manifested in the estuary and ocean. Three potential factors related to juvenile passage through the hydrosystem might cause subsequent mortality during early ocean residency (CSS 2019; ISAB 2019b). Stress of smolting salmonids caused by their passage through dam turbines, juvenile bypass systems, and spillways might increase vulnerability to predation and pathogens or reduce energy reserves needed for saltwater adaption and early marine growth. Hydrosystem changes in migration rates of smolts might alter ocean entry timing (referred to as the match/mismatch hypothesis. Transportation of smolts through the hydrosystem might lead to size selective mortality in the lower river relative to in-river migrants who increase in size by 5-8 mm during migration.
The magnitude and causes of latent mortality due to indirect effects of passage through the hydro system remain uncertain. The CBP analysis makes no assumption regarding the magnitude of latent mortality but rather provides a means of exploring the effects of different assumptions

MAFAC CBP Task Force Phase II Report Final 8/29/20
26
about the magnitude of latent mortality. Toward this end, the recovery scenario analyzer has identified latent mortality as a specific factor that can be independently manipulated.
In 2007, the Independent Scientific Advisory Board reviewed a variety of hypotheses about the causative factors that contribute to latent mortality (ISAB 2007). The ISAB concluded that the hydrosystem causes some fish to experience latent mortality, but advised against continuing to try to measure absolute latent mortality. They found that latent mortality relative to a damless reference is not measurable. Instead, the ISAB recommended that the focus should be on the total mortality of in-river migrants and transported fish, which they deemed to be the critical issue for recovery of listed salmonids. In 2012, the ISAB re-examined a variety of analyses of whether the route of dam passage affects subsequent survival (“latent mortality”) of in-river migrants. This review found that competing hypotheses have different implications for hydrosystem operations and recommended that alternative explanations be considered and further research conducted to resolve related issues. The ISAB (2019b) has also recommended that a complete assessment should include information that both supports and refutes the importance or existence of delayed mortality.
Schaller and Petrosky (2007) inferred the existence of significant delayed mortality of stream-type Chinook populations based on spatial and temporal patterns of productivity. They found that Snake River populations survived only one-fourth to one-third as well as their downriver counterparts. Delayed mortality of in-river migrants was estimated to average 64% for brood years 1975-1990 and 81% for brood years 1991-1998. Subsequent analyses documented differences in productivity declines between middle and upper basin populations concurrent with hydropower system development (Schaller et al. In press).
Extensive analyses of salmon survival rates at various life history stages have been conducted by a Comparative Survival Study (CSS) initiated in 1996 by the states, tribes and US Fish and Wildlife Service (CSS 2019). This study: (1) measures and monitors juvenile Chinook, steelhead, and sockeye travel time and mortality rates through the hydrosystem; (2) examines associations between environmental factors and travel time and mortality rates; and (3) develops models that explain variation in travel time and mortality rates through the hydrosystem. Data collected includes juvenile travel times, in-river survival rates of juveniles, juvenile routes of passage at dams, smolt-to-adult survival rates (SAR), and adult upstream conversion rates. Since 2010, the ISAB has conducted annual reviews of Comparative Survival Study annual reports (e.g., ISAB 2019b).
The CSS does not estimate the magnitude of latent mortality but has hypothesized that increased spill would substantially reduce latent mortality (MCann et al. 2017; CSS 2019). This empirically supported hypothesis is based on correlations between migration conditions, including spill, and salmon survival. This information can be interpreted to provide evidence for the occurrence of some level of latent mortality. For instance, the sum of spill-adjusted powerhouse contact values (NPH) was negatively correlated with survival below BON and during the first year in the ocean (Petrosky and Schaller 2010; CSS 2017). Based on these correlations, the CSS (McCann et al. 2017) estimated that.
MAFAC CBP Task Force Phase II Report Final 8/29/20
27
• increasing spill to a 125 percent TDG level could lead to about a 2 to 2.5 -fold increase, and.
• Breaching the lower four Snake River dams and spilling to 125 percent TDG at the remaining four Middle Columbia River projects would lead to up to 4 times higher SARs.
CSS (2019) subsequently completed additional analysis of alternatives identified were modeled as part of the Columbia River System Operations Environmental Impact Statement review process (USACE 2020). The CSS models estimated that:
• Spilling to 125% TDG would produce a 1.6 to 2.0-fold increase in SAR. • Breaching the lower four Snake River dams and spilling to 125 percent TDG at the
remaining four Middle Columbia River projects would produce a 1.9 -2.7-fold increase.
NOAA’s Northwest Fisheries Science Center (NWFSC) has also evaluated the effects of alternative hydro operations using a Life Cycle Model (LCM) which includes the Comparative Passage (COMPASS) model. These results are documented in the 2019 Biological Opinion (NMFS 2019) and the 2020 draft Environmental Impact Statement (USACE 2020) for Columbia River system operations. Modeling by NMFS identified three latent mortality reduction scenarios that were deemed to roughly represent the ranges of potential outcomes (increased productivity) for Snake River spring Chinook indicated by the CSS (2017) for the up to 120 percent flexible spill operation compared to recent spill operations. These included outcomes of 10 percent increased productivity (1.10 survival multiplier, equivalent to a 9 percent mortality)11, 25 percent increased productivity, (1.25 survival multiplier, equivalent to a 20 percent mortality), and 50 percent (1.50 survival multiplier, equivalent to a 33 percent mortality). Values are not estimates of total latent mortality but rather a range in potential reductions in latent mortality (productivity or survival improvements) associated with the proposed operation. NWFSC numbers are related to, but not directly comparable to, improvement increments identified by the CSS. Where the CSS estimates include both in-river and latent effects, the NWFSC analysis treats latent and in-river effects as separate variables. The NMFS LCM does not predict the same magnitude of increases in SARs or adult returns with alternative operations as the CSS model due to differences in assumptions.
The CBP salmon analyzer does not attempt to resolve uncertainties in the magnitude of latent mortality but rather identifies a range of potential values generally consistent with existing information to allow users to explore the implications of different estimates. Because direct estimates of latent mortality are not available, we used incremental improvements associated with spill operation scenarios for Snake River Spring Chinook as a proxy. Initial input values were identified to reflect a range of possible assumptions.
• At the low end, a 9 percent mortality value was identified consistent with the low-end value identified by the 2019 NWFSC scenario analysis (NMFS 2019; USACE 2020).
• At the high end, a 67 percent latent mortality impact value was identified consistent with the 3.0-fold potential for improvement. This value is consistent with high end projections by the CSS for a four-dam breach and 125 percent TDG operation in the most recent
11 Relative survival improvement = (1-mortalitynew)/(1-mortalityold)
MAFAC CBP Task Force Phase II Report Final 8/29/20
28
analysis (CSS 2019). This value is also similar to Schaller and Petrosky's (2007) estimate of a 69% latent mortality for 1975-1998 brood years of Snake River stream-type spring Chinook.
• Mid-range values (38 percent) simply split the difference between high and low numbers.
• Information is not available for the significance of latent mortality for stocks in other areas of the region. For non-Snake River stocks including the mid and upper Columbia, we scaled Snake River values proportional to the number of average number of dams affecting each stock for stocks originating in the upper and middle Columbia River.
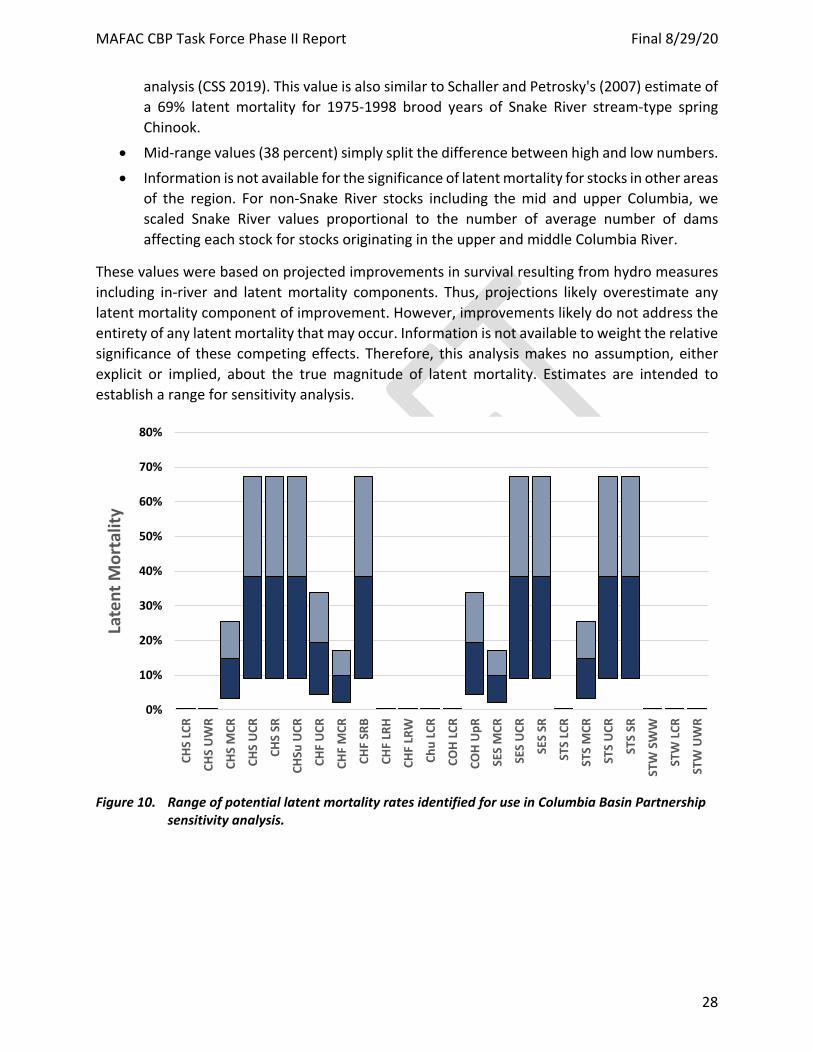
These values were based on projected improvements in survival resulting from hydro measures including in-river and latent mortality components. Thus, projections likely overestimate any latent mortality component of improvement. However, improvements likely do not address the entirety of any latent mortality that may occur. Information is not available to weight the relative significance of these competing effects. Therefore, this analysis makes no assumption, either explicit or implied, about the true magnitude of latent mortality. Estimates are intended to establish a range for sensitivity analysis.
Figure 10. Range of potential latent mortality rates identified for use in Columbia Basin Partnership
sensitivity analysis.
0%
10%
20%
30%
40%
50%
60%
70%
80%
CHS
LCR
CHS
UW
R
CHS
MCR
CHS
UCR
CHS
SR
CHSu
UCR
CHF
UCR
CHF
MCR
CHF
SRB
CHF
LRH
CHF
LRW
Chu
LCR
COH
LCR
COH
UpR
SES
MCR
SES
UCR
SES
SR
STS
LCR
STS
MCR
STS
UCR
STS
SR
STW
SW
W
STW
LCR
STW
UW
R
Late
nt M
orta
lity
MAFAC CBP Task Force Phase II Report Final 8/29/20
29
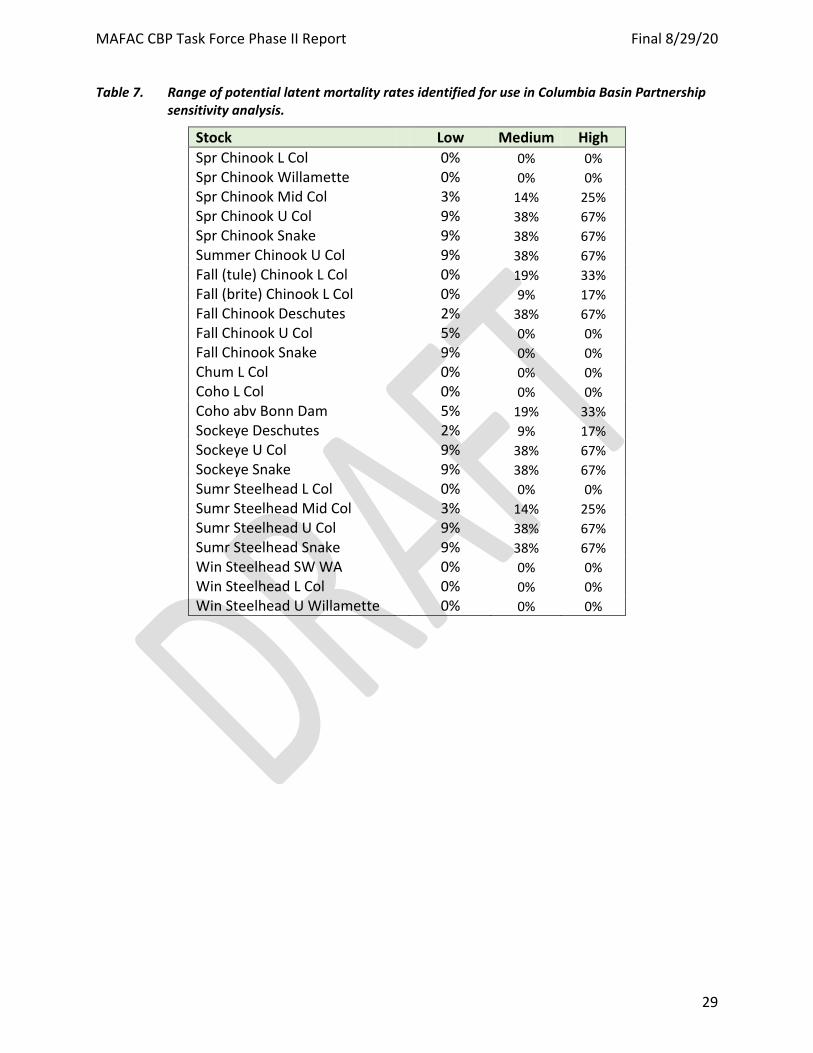
Table 7. Range of potential latent mortality rates identified for use in Columbia Basin Partnership
sensitivity analysis.
Stock Low Medium High Spr Chinook L Col 0% 0% 0% Spr Chinook Willamette 0% 0% 0% Spr Chinook Mid Col 3% 14% 25% Spr Chinook U Col 9% 38% 67% Spr Chinook Snake 9% 38% 67% Summer Chinook U Col 9% 38% 67% Fall (tule) Chinook L Col 0% 19% 33% Fall (brite) Chinook L Col 0% 9% 17% Fall Chinook Deschutes 2% 38% 67% Fall Chinook U Col 5% 0% 0% Fall Chinook Snake 9% 0% 0% Chum L Col 0% 0% 0% Coho L Col 0% 0% 0% Coho abv Bonn Dam 5% 19% 33% Sockeye Deschutes 2% 9% 17% Sockeye U Col 9% 38% 67% Sockeye Snake 9% 38% 67% Sumr Steelhead L Col 0% 0% 0% Sumr Steelhead Mid Col 3% 14% 25% Sumr Steelhead U Col 9% 38% 67% Sumr Steelhead Snake 9% 38% 67% Win Steelhead SW WA 0% 0% 0% Win Steelhead L Col 0% 0% 0% Win Steelhead U Willamette 0% 0% 0%
MAFAC CBP Task Force Phase II Report Final 8/29/20
30
Impact Estimates - Blocked Areas Definition For the purposes of this analysis, blocked area impacts are defined as the percentage loss in potential production due to dams that block access or inundate historically accessible habitat. Affected areas include the Upper Columbia Basin (above Chief Joseph and Grand Coulee Dams), the Upper Snake River basin (above Hells Canyon Dam), tributaries to the Willamette River (dams on the Santiam, Middle Fork, and McKenzie Rivers), tributaries to the Columbia River (dams on the Cowlitz, Lewis, Deschutes, Yakima, Okanagan Rivers), and tributaries to the Snake River (Wallowa and North Fork Clearwater Rivers). Smaller-scale blockages due to culverts and diversion dams are incorporated under freshwater habitat.
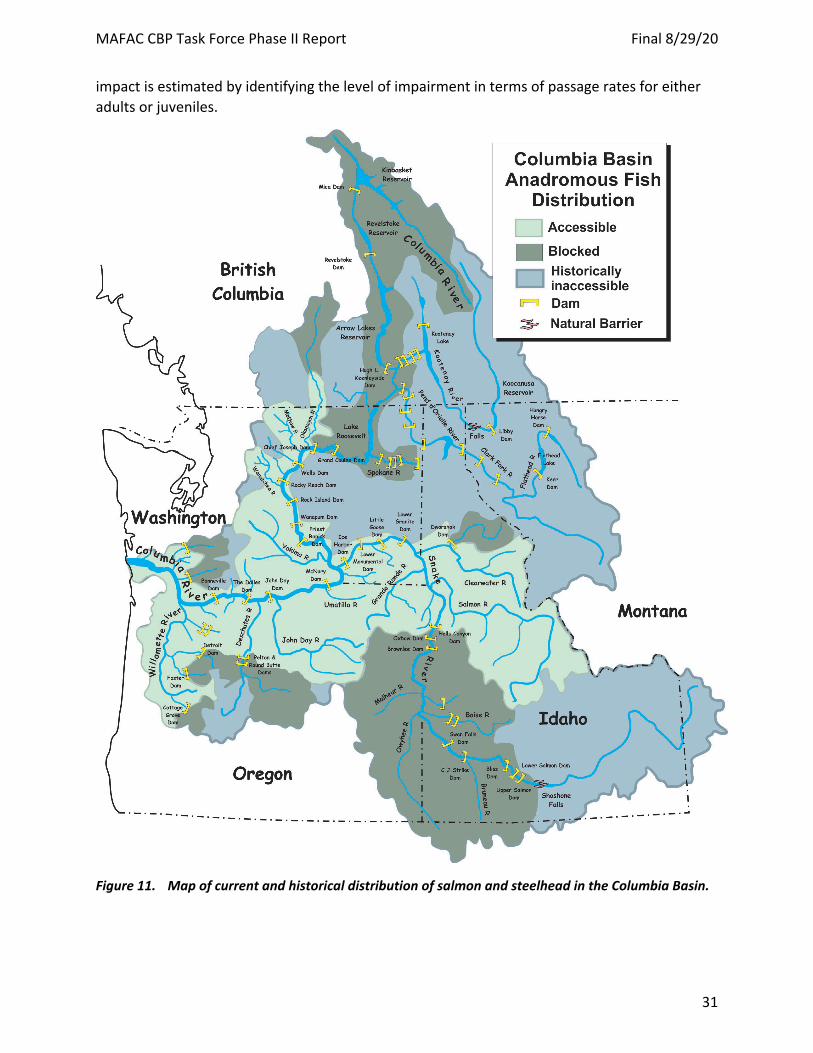
Background Construction and operation of dozens of hydropower, flood control and irrigation storage dams and reservoirs has severely impacted anadromous salmon and steelhead runs across the Columbia Basin (NRC 1996). The effect of dams without fish passage is clear: the upstream habitat is lost. Large mainstem dams in the upper Columbia and Snake Rivers and numerous tributaries completely block access to portions of the historical range (Figure 11). Dam-related impacts also include “mainstem effects,” which are addressed in a separate section.
Estimation Methods The general approach used by the CBP Partnership to estimate impacts for blocked areas is to identify the historical adult abundance for areas that were once accessible but are currently partially or fully blocked to access for anadromous salmon and steelhead. Blockages generally results from several mechanisms including: 1) lack of access to spawning habitat for returning spawning adults, 2) lack of downstream passage for migrating juveniles or 3) inundation for historically productive habitat in blocked areas. Depending on the severity of the conditions the blockage can be complete or partial.
As defined for CBP Partnership purposes adult abundance is the measure that is used to estimate impacts at the stock level, as per the following formula:
Impact = Adult Abundance in Blocked Area / Total Historical Adult Abundance
Estimation of impacts at the stock level includes two steps: 1) calculate impacts for blocked areas individually at the population scale and 2) combine impact estimates for multiple populations to estimate impact at the stock scale.
For many populations, the entirety of their historically accessible geographic range is blocked and, in these situations, estimates of the impact is 100%. For other populations, a portion of the basin is blocked to access while the remainder of the basin is fully accessible. For these populations, the impact is result of the amount of habitat that is blocked in comparison to the historically accessible habitat. Reintroduction efforts are underway for a few populations in the basins and for these populations juvenile escapement past the blockage is the typical method for estimating impacts. Similarly, some populations have impaired access to the basin and the
MAFAC CBP Task Force Phase II Report Final 8/29/20
31
impact is estimated by identifying the level of impairment in terms of passage rates for either adults or juveniles.
Figure 11. Map of current and historical distribution of salmon and steelhead in the Columbia Basin.
MAFAC CBP Task Force Phase II Report Final 8/29/20
32
Historical abundance estimates were based on the best available information as detailed for each stock. Historical is defined as pre-development, and corresponding numbers were estimated by a variety of methods including historical records, inferences from habitat models such as EDT, and relative numbers of fish population or stream miles in blocked and accessible areas.
For basins where reintroduction programs with juvenile collection facilities are operating the access impact estimate will vary between populations. For other basins, the impact rate is typically the same for all populations within a given basin. Modelling efforts, such as EDT or CATAS are commonly used for these kinds of analyses. EDT modeling results are typically in the form of adult abundance while the CATAS model provide impact estimates in term of percent of basin that is blocked to access. For many populations impact estimates are not readily accessible via modeling and in these situations, professional judgement and expert opinion typically provided impact estimates, and in a few cases abundance estimates.
A fuller description of these methodologies can be found in the “Impact Estimates – Tributary Habitat” section of this Appendix. Additionally, a more complete description of the EDT analytical methodology is presented in the Appendix E of the Washington Lower Columbia Salmon Recovery and Fish & Wildlife Subbasin Plan and a more complete description of the CATAS modeling approach can be found in Chapter 4, Chapter 6 and Appendix C of the Lower Columbia River Conservation & Recovery Plan for Oregon Populations of Salmon and Steelhead.
Lower Columbia –Multi-dam complexes block access to a portion of the basin for six of nine stocks in this area. Spring Chinook, Coho, and winter steelhead reintroduction programs for are underway in both the Cowlitz and Lewis basins. Adult access to blocked areas occurs through trap and haul programs and collection facilities are operating to provide passage for outmigrant juveniles. Blocked area for fall (tule) Chinook occur in the upper Cowlitz and in the upper Lewis for fall (bright) Chinook and summer steelhead. The recently implemented reintroduction for fall (tule) Chinook in the upper Cowlitz basin has been discontinued. No reintroduction programs are being implemented for fall (bright) Chinook or summer steelhead in the North Fork Lewis basin. Additional information regarding reintroduction programs and associated juvenile collection facilities is provided in annual reports completed by Fishery and Hatchery Management Plan (FHMP) for the Cowlitz Hydroelectric Project and Lewis River Fish Passage Program Annual Report Lewis River Hydroelectric Project.
Upper Willamette – Spring Chinook and winter steelhead stocks are blocked by dams from a significant portion of their historical range in Willamette tributaries. Six of eight spring Chinook and two of four winter steelhead populations are affected. These include the North Santiam, South Santiam, McKenzie and Middle Fork Willamette for spring Chinook and the North Santiam and South Santiam for winter steelhead. Reintroduction programs are very limited or non-existent for these stocks. Juvenile passage facilities do not exist for any of these stocks and only a limited trap and haul program for adults occurs in the South Santiam.
Middle Columbia – Four of five stocks have some amount of blocked areas. Dams in the middle portion of the Deschutes basin block upstream access to spring Chinook, summer steelhead, and sockeye. A juvenile collection facility has recently been constructed and reintroduction
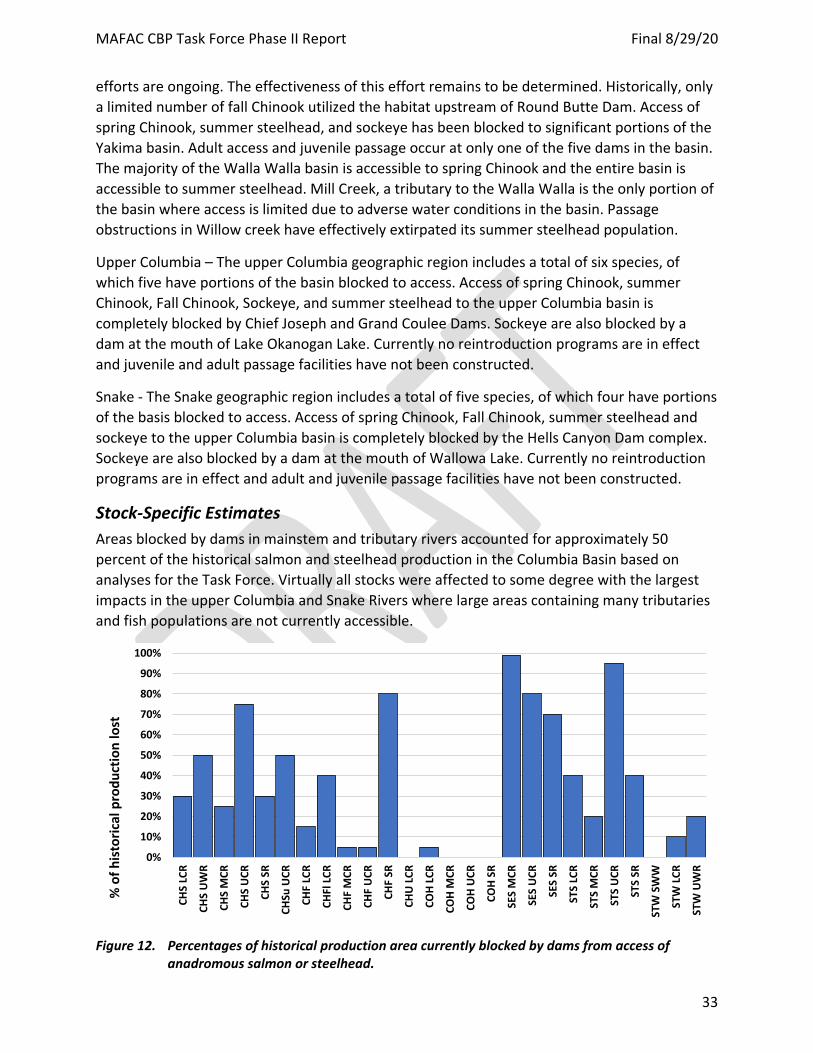
MAFAC CBP Task Force Phase II Report Final 8/29/20
33
efforts are ongoing. The effectiveness of this effort remains to be determined. Historically, only a limited number of fall Chinook utilized the habitat upstream of Round Butte Dam. Access of spring Chinook, summer steelhead, and sockeye has been blocked to significant portions of the Yakima basin. Adult access and juvenile passage occur at only one of the five dams in the basin. The majority of the Walla Walla basin is accessible to spring Chinook and the entire basin is accessible to summer steelhead. Mill Creek, a tributary to the Walla Walla is the only portion of the basin where access is limited due to adverse water conditions in the basin. Passage obstructions in Willow creek have effectively extirpated its summer steelhead population.
Upper Columbia – The upper Columbia geographic region includes a total of six species, of which five have portions of the basin blocked to access. Access of spring Chinook, summer Chinook, Fall Chinook, Sockeye, and summer steelhead to the upper Columbia basin is completely blocked by Chief Joseph and Grand Coulee Dams. Sockeye are also blocked by a dam at the mouth of Lake Okanogan Lake. Currently no reintroduction programs are in effect and juvenile and adult passage facilities have not been constructed.
Snake - The Snake geographic region includes a total of five species, of which four have portions of the basis blocked to access. Access of spring Chinook, Fall Chinook, summer steelhead and sockeye to the upper Columbia basin is completely blocked by the Hells Canyon Dam complex. Sockeye are also blocked by a dam at the mouth of Wallowa Lake. Currently no reintroduction programs are in effect and adult and juvenile passage facilities have not been constructed.
Stock-Specific Estimates Areas blocked by dams in mainstem and tributary rivers accounted for approximately 50 percent of the historical salmon and steelhead production in the Columbia Basin based on analyses for the Task Force. Virtually all stocks were affected to some degree with the largest impacts in the upper Columbia and Snake Rivers where large areas containing many tributaries and fish populations are not currently accessible.
Figure 12. Percentages of historical production area currently blocked by dams from access of
anadromous salmon or steelhead.
0%
10%
20%
30%
40%
50%
60%
70%
80%
90%
100%
CHS
LCR
CHS
UW
R
CHS
MCR
CHS
UCR
CHS
SR
CHSu
UCR
CHF
LCR
CHFl
LCR
CHF
MCR
CHF
UCR
CHF
SR
CHU
LCR
COH
LCR
COH
MCR
COH
UCR
COH
SR
SES
MCR
SES
UCR
SES
SR
STS
LCR
STS
MCR
STS
UCR
STS
SR
STW
SW
W
STW
LCR
STW
UW
R
% o
f his
toric
al p
rodu
ctio
n lo
st
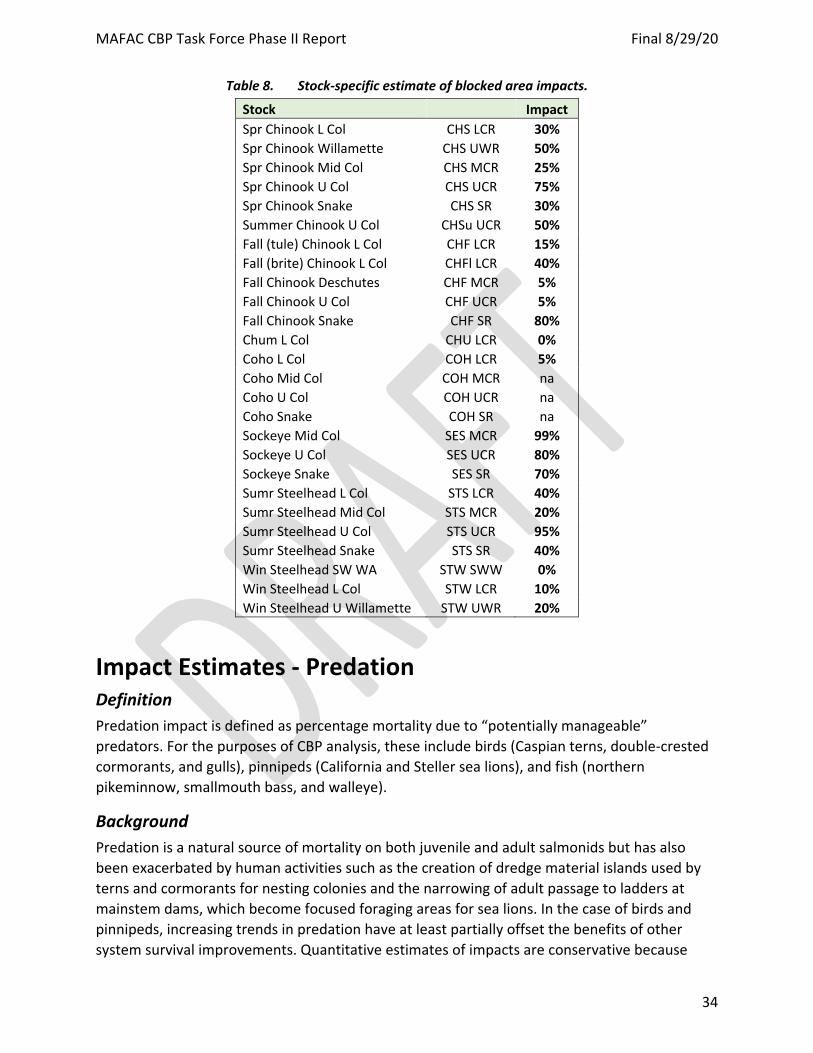
MAFAC CBP Task Force Phase II Report Final 8/29/20
34
Table 8. Stock-specific estimate of blocked area impacts.
Stock Impact Spr Chinook L Col CHS LCR 30% Spr Chinook Willamette CHS UWR 50% Spr Chinook Mid Col CHS MCR 25% Spr Chinook U Col CHS UCR 75% Spr Chinook Snake CHS SR 30% Summer Chinook U Col CHSu UCR 50% Fall (tule) Chinook L Col CHF LCR 15% Fall (brite) Chinook L Col CHFl LCR 40% Fall Chinook Deschutes CHF MCR 5% Fall Chinook U Col CHF UCR 5% Fall Chinook Snake CHF SR 80% Chum L Col CHU LCR 0% Coho L Col COH LCR 5% Coho Mid Col COH MCR na Coho U Col COH UCR na Coho Snake COH SR na Sockeye Mid Col SES MCR 99% Sockeye U Col SES UCR 80% Sockeye Snake SES SR 70% Sumr Steelhead L Col STS LCR 40% Sumr Steelhead Mid Col STS MCR 20% Sumr Steelhead U Col STS UCR 95% Sumr Steelhead Snake STS SR 40% Win Steelhead SW WA STW SWW 0% Win Steelhead L Col STW LCR 10% Win Steelhead U Willamette STW UWR 20%
Impact Estimates - Predation Definition Predation impact is defined as percentage mortality due to “potentially manageable” predators. For the purposes of CBP analysis, these include birds (Caspian terns, double-crested cormorants, and gulls), pinnipeds (California and Steller sea lions), and fish (northern pikeminnow, smallmouth bass, and walleye).
Background Predation is a natural source of mortality on both juvenile and adult salmonids but has also been exacerbated by human activities such as the creation of dredge material islands used by terns and cormorants for nesting colonies and the narrowing of adult passage to ladders at mainstem dams, which become focused foraging areas for sea lions. In the case of birds and pinnipeds, increasing trends in predation have at least partially offset the benefits of other system survival improvements. Quantitative estimates of impacts are conservative because
MAFAC CBP Task Force Phase II Report Final 8/29/20
35
research and monitoring have tended to examine subsets of juvenile and adult salmonids, and a subset of predators, resulting in uneven coverage and a dearth of information on certain combinations of species and life histories (ISAB 2019).
Estimation Methods Birds
Piscivorous colonial waterbirds, especially terns, cormorants, and gulls, are having a significant impact on the survival of juvenile salmonids in the Columbia River (ISAB 2019; NMFS 2019). Predation occurs in both the Columbia River estuary and the mainstem throughout the interior basin. Various estimates of predation rates have been reported, primarily based on recoveries of PIT tags at nesting colonies. These estimates can generally be considered to be underestimates of avian predation, accounting for predation by only a portion of the total bird populations.
Caspian Terns Estuary - Caspian terns (Hydropogne caspia) have nested in large colonies on islands in the lower Columbia River estuary where they feed on fish including juvenile salmon. Numbers of Caspian terns in the lower Columbia River increased substantially after 1984 (Figure 13), when terns first nested on East Sand Island near Chinook, WA, following the deposition of fresh dredged material at the eastern tip of the island in 1983 (NMFS 2019). By 1985, vegetation covered the nesting site, making it unsuitable for terns and by 1986 the colony had shifted to Rice Island, a dredged-material disposal site located 16 miles upriver.
Terns nesting on Rice Island were estimated to consume about 5.4-14.2 million juvenile salmon per year in 1997 and 1998, or 5-15% of all the smolts reaching the estuary (Roby et al. 2017). Tern predation rates were generally higher for juvenile steelhead than for salmon. The Corps of Engineers relocated the tern colony in 1999 and 2000 downstream to East Sand Island in an effort to reduce predation on salmon. Terns nesting on East Sand Island forage closer to the ocean, where they utilize more diverse diet of marine fish. This relocation effort was successful. During 2001-2015, estimated consumption by terns on East Sand Island averaged 5.1 million smolts per year, about a 59% reduction compared to when the colony was on Rice Island (Roby et al. 2017).
Beginning in 2006, additional effort was made to redistribute half to two-thirds of East Sand Island tern colony to alternative sites in Oregon and California, with a goal of reducing smolt loss another 50% while still maintaining a viable tern population (ISAB 2019). Tern numbers and distribution have been dynamic in the post-management period. The average number of tern nests at East Sand Island has been reduced to about 5,000, but the number is still above the target of 3,125 nests set by the U.S. Army Corps of Engineers (USACE2015a, 2015b). Predation rates for East Sand Island terns have generally decreased, but in 2017 this improvement was offset to an unknown degree by terns roosting farther upstream on Rice Island (Evans et al. 2018a).
Stock-specific predation rates by terns are estimated based on PIT-tag recoveries at East Sand Island and the number of tagged smolts that pass Bonneville Dam (or Sullivan Dam at Willamette Falls on the lower Willamette River) (Evans et al. 2018a). Additional PIT tag
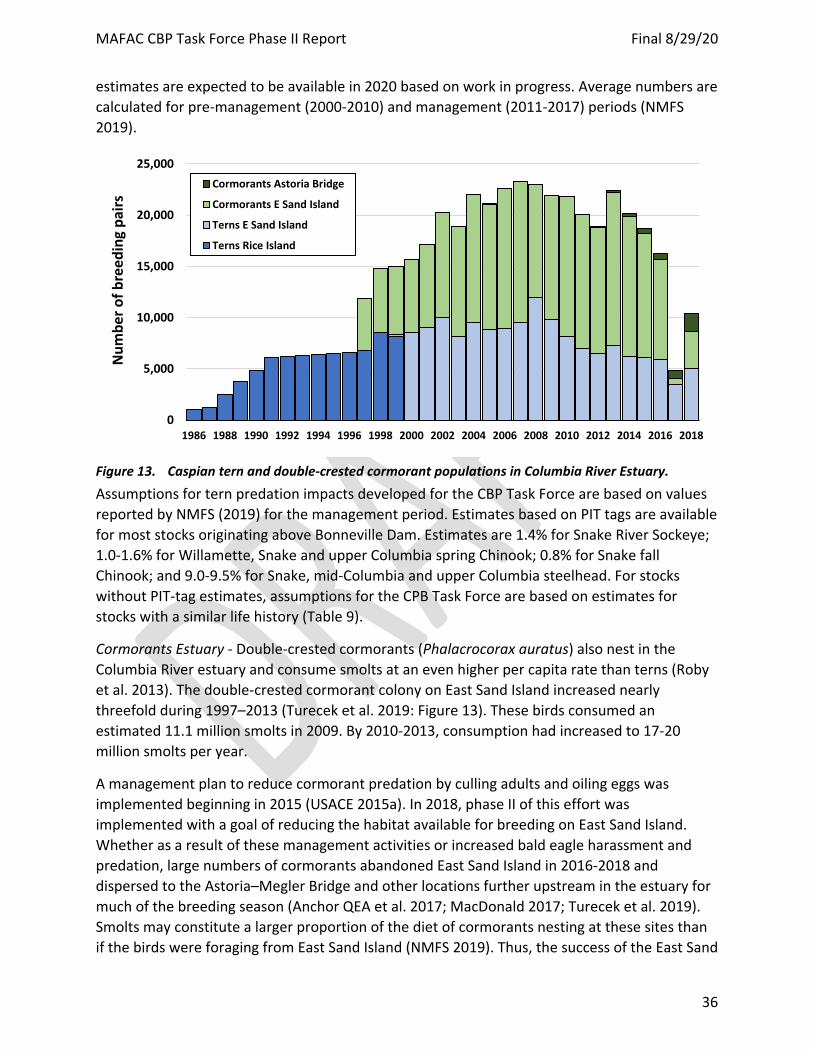
MAFAC CBP Task Force Phase II Report Final 8/29/20
36
estimates are expected to be available in 2020 based on work in progress. Average numbers are calculated for pre-management (2000-2010) and management (2011-2017) periods (NMFS 2019).
Figure 13. Caspian tern and double-crested cormorant populations in Columbia River Estuary. Assumptions for tern predation impacts developed for the CBP Task Force are based on values reported by NMFS (2019) for the management period. Estimates based on PIT tags are available for most stocks originating above Bonneville Dam. Estimates are 1.4% for Snake River Sockeye; 1.0-1.6% for Willamette, Snake and upper Columbia spring Chinook; 0.8% for Snake fall Chinook; and 9.0-9.5% for Snake, mid-Columbia and upper Columbia steelhead. For stocks without PIT-tag estimates, assumptions for the CPB Task Force are based on estimates for stocks with a similar life history (Table 9).
Cormorants Estuary - Double-crested cormorants (Phalacrocorax auratus) also nest in the Columbia River estuary and consume smolts at an even higher per capita rate than terns (Roby et al. 2013). The double-crested cormorant colony on East Sand Island increased nearly threefold during 1997–2013 (Turecek et al. 2019: Figure 13). These birds consumed an estimated 11.1 million smolts in 2009. By 2010-2013, consumption had increased to 17-20 million smolts per year.
A management plan to reduce cormorant predation by culling adults and oiling eggs was implemented beginning in 2015 (USACE 2015a). In 2018, phase II of this effort was implemented with a goal of reducing the habitat available for breeding on East Sand Island. Whether as a result of these management activities or increased bald eagle harassment and predation, large numbers of cormorants abandoned East Sand Island in 2016-2018 and dispersed to the Astoria–Megler Bridge and other locations further upstream in the estuary for much of the breeding season (Anchor QEA et al. 2017; MacDonald 2017; Turecek et al. 2019). Smolts may constitute a larger proportion of the diet of cormorants nesting at these sites than if the birds were foraging from East Sand Island (NMFS 2019). Thus, the success of the East Sand
0
5,000
10,000
15,000
20,000
25,000
1986 1988 1990 1992 1994 1996 1998 2000 2002 2004 2006 2008 2010 2012 2014 2016 2018
Num
ber o
f bre
edin
g pa
irs
Cormorants Astoria Bridge
Cormorants E Sand Island
Terns E Sand Island
Terns Rice Island
MAFAC CBP Task Force Phase II Report Final 8/29/20
37
Island tern and cormorant management plans at meeting their underlying goals of reducing salmonid predation is uncertain at this time (NMFS 2019).
Stock-specific predation rates by cormorants are estimated based on PIT-tag recoveries at East Sand Island and the number of tagged smolts that pass Bonneville Dam (or Sullivan Dam on the lower Willamette River) (Evans et al. 2018a). Average numbers are calculated for the pre-management period (2013-2015) (NMFS 2019). No estimates of predation rates are available since management of that colony began.
CBP Task Force assumptions for cormorant predation impacts are based on values reported by NMFS (2019) for the pre-management period. Estimates based on PIT tags are available for most stocks originating above Bonneville Dam. Estimates are 3.6% for Snake River Sockeye; 1.3-5.2% for Willamette, upper Columbia and Snake spring Chinook; 3.0% for Snake fall Chinook; and 5.1-9.3% for upper Columbia, mid-Columbia and Snake steelhead. For the CBP Task Force, values for other stocks without PIT-tag estimates are based on estimates for stocks with a similar life history (Table 9).
Caspian Terns Inland - Caspian terns have also nested in significant numbers on islands in John Day Reservoir, McNary Reservoir, the Hanford Reach, Banks Lake, and Potholes Reservoir. These birds consume significant numbers of juvenile salmonids migrating through the mid-Columbia River (NMFS 2019). For instance, annual predation rates on Upper Columbia River (UCR) steelhead by terns nesting at Potholes Reservoir, Banks Lake, and the Blalock Islands (John Day Reservoir) averaged 15.7% in the pre-management period (2007-14; Collis et al. 2018).
A management program has been implemented with the goal of reducing predation rates to less than 2 percent per listed ESU/DPS per tern colony per year (USACE 2014). Passive dissuasion, hazing, and revegetation are being employed to keep terns from nesting on Goose Island in Potholes Reservoir and on Crescent Island in McNary Reservoir. As a result, predation rates on UCR steelhead by Caspian terns nesting at these two sites declined to <1.0% after 2014-2015 (Collis et al. 2018). However, the number of tern nests at the Blalock Islands in John Day Reservoir increased ten-fold in 2015 as large numbers of terns moved there from Crescent Island. Annual predation rates on UCR steelhead at this site averaged 4.7% in 2015–18 (Collis et al. 2019).
CBP Task Force assumptions for inland tern predation are based on values reported for terns in Potholes Reservoir, McNary Reservoir, and Banks Lake during 2014-2017 (NMFS 2019). Estimates are 3.9% for Snake River Sockeye; 0.9% for upper Columbia and Snake spring Chinook; 0.6% for Snake fall Chinook; and 5.6-7.7% for upper Columbia and Snake steelhead. For the CBP Task Force, values for other stocks without PIT-tag estimates are based on estimates for stocks with a similar life history (Table 9). For CBP purposes, juvenile reach mortality estimates were adjusted to account for inland tern predation estimates so as not to double count.
Gulls Inland - California and ring-billed gulls are also known to consume significant numbers of juvenile salmonids. Based on a review of various estimates, the ISAB (2019) concluded that
MAFAC CBP Task Force Phase II Report Final 8/29/20
38
predation on smolts by the gulls may be more serious than that of managed terns and cormorants. It should also be noted that gulls may be more likely to consume fish that are already dead (hence, some portion of this is likely compensatory).
Ruggerone (1986) studied ring-billed gull predation at Wanapum Dam and estimated, based on visual observations, that they consumed over 100,000 salmonids or 2% of the estimated spring migration during the 25-day peak migration period. Predation by gulls in mainstem dam tailraces is being discouraged using several effective strategies, including: wire arrays that crisscross the tailrace areas, spike strips along the concrete, water sprinklers at juvenile bypass outfalls, pyrotechnics, propane cannons, and limited amounts of lethal take.
Average annual predation of salmonids by the gull colony at Miller Rocks in The Dalles Reservoir was estimated to be less than 2% in 2007-2010 (Lyons et al. 2011; USACE 2014). However, the probability of detecting PIT-tags from smolts consumed by California and ring-billed gulls and subsequently deposited in nesting colonies may be as low as one in seven (Hostetter et al. 2015, Evans et al. 2016a).
PIT tag recoveries at four gull colonies in McNary, John Day, and The Dalles reservoirs in 2015-2016 indicate that annual colony-specific predation rates on smolts ranged up to 7.4% for Sockeye Salmon, 3.5% for spring Chinook Salmon, and 13.2% for steelhead (Roby et al. 2016, 2017). These predation rates were adjusted to account for tag loss due to on-colony detection efficiencies and deposition rates. These estimates are the basis for CBP Task Force assumptions for inland gull predation impacts. For CBP purposes, juvenile reach mortality estimates were adjusted to account for inland gull predation estimates so as not to double count.
Limited efforts have been made to affect gull colonies in the interior basin. Some effort was made to prevent nesting by California and ring-billed gulls on Goose (Potholes Reservoir) and Crescent (McNary Reservoir) Islands concurrent with tern control (USACE 2014; Roby et al. 2016). Gulls dispersed from Crescent Island to add to numbers at the colonies on Miller Rocks, Island 20 (McNary Reservoir), and the Blalock Islands. The gull colony on Goose Island has remained relatively stable in recent years) (Collis et al. 2018). There are no regional plans to manage these colonies at this time (NMFS 2019).
Seals & Sea Lions
Abundance of seals and sea lions has increased considerably along the northwest United States coast and in the Columbia River since the Marine Mammal Protection Act (MMPA) was enacted in 1972 (Carretta et al. 2014). California sea lions (CSL; Zalophus californianus), Steller sea lions (SSL; Eumetopias jubatus), and harbor seals (Phoca vitulina) consume adult and juvenile salmonids from the mouth of the Columbia River to Bonneville Dam and in some tributaries (e.g. Willamette River, Cowlitz River).
Estuary - The Oregon Department of Fish and Wildlife (ODFW) has been counting the number of individual California and Steller sea lions at haul-out sites near Astoria, Oregon, since 1997. CSLs are present year-round but are currently most abundant in the spring. Their abundance has increased dramatically since 2013, with a nearly tenfold increase in spring relative to the preceding years. Monthly maximum counts peaked at 3,800 individuals in March of 2016. This
MAFAC CBP Task Force Phase II Report Final 8/29/20
39
increase is thought to be a response to recent ocean conditions and prey availability (Rub et al. 2019).
Increasing pinniped abundance in the Columbia River estuary has likely resulted in an increased loss of spring Chinook Salmon in recent years based on recent pinniped count data and mark-recapture estimates of survival (Rub et al. 2019). Annual non-harvest mortality in this reach ranged from 20 to 44% in 2010-2015. Rub et al. (2019) found up to 50% of the mortality from pinnipeds of adult spring-run Chinook Salmon destined for tributaries above Bonneville Dam occurred within the ten-mile reach just below the dam. While all the mortality is not attributable to pinnipeds, early migrating spring Chinook Salmon populations experienced a 22% reduction in survival in 2013–2015 relative to a baseline period of 1998–2012, while survival of later-migrating populations declined by only 4–16% (Sorel et al. 2017).
Predation estimates have also been made based on bioenergetic and life cycle models of CSLs (Chasco et al. 2017). Estimates generated for 2015 are less than empirical estimates by Rub et al. (2018).12 The bioenergetic estimate generally corroborate the conclusion that CSL predation on salmon in the lower Columbia River is significant.
Harbor seals are also now abundant in the lower Columbia River. Index counts in May and June at haul-out sites near Astoria have increased from an average of 200 per year in 1977-1986 to 1,000-2,000 per year since 2000 (ODFW unpublished data). Harbor seals consume salmon smolts and adults (Chasco et al. 2017) although corresponding mortality rates appear to be quite small in relation to other predators.
Consistent with an authorization under the Marine Mammal Protection Act, management agencies have implemented numerous measures, from hazing to lethal removal, to reduce predation at Bonneville Dam and Astoria. From 2008–2017, a total of 15 California sea lions at Bonneville Dam were captured and placed in captivity (Brown et al. 2017). During that same period, 163 California sea lions were euthanized at Bonneville Dam and five at Astoria (Brown et al. 2017). An authorization to lethally remove sea lions has also been issued for Willamette Falls and the trapping and removal activities have begun.
For CBP Task Force purposes, we used an average of early and later migrating population values (16%) reported by (Sorel et al. 2017) as an estimate of pinniped predation mortality on spring Chinook Salmon between the estuary and Bonneville Dam. We assumed that Bonneville tailrace mortality was included in this value.13 We assumed values of half that for lower Columbia and Willamette spring Chinook which migrate through only a portion of the Columbia River mainstem (Table 9). Pinniped predation for other salmon and steelhead stocks was not quantified outside of Bonneville tailrace for CBP purposes due to a lack of empirical estimates.
12 A fairly large increase in pinniped counts in Astoria since 2015 that may have contributed to the disparity. 13 This approach is appropriate for coarse-scale analysis of the impact to all spring Chinook salmon, but if the
analysis is attempting to look at individual populations, 16% is likely an overestimate for some, and an underestimate for others.
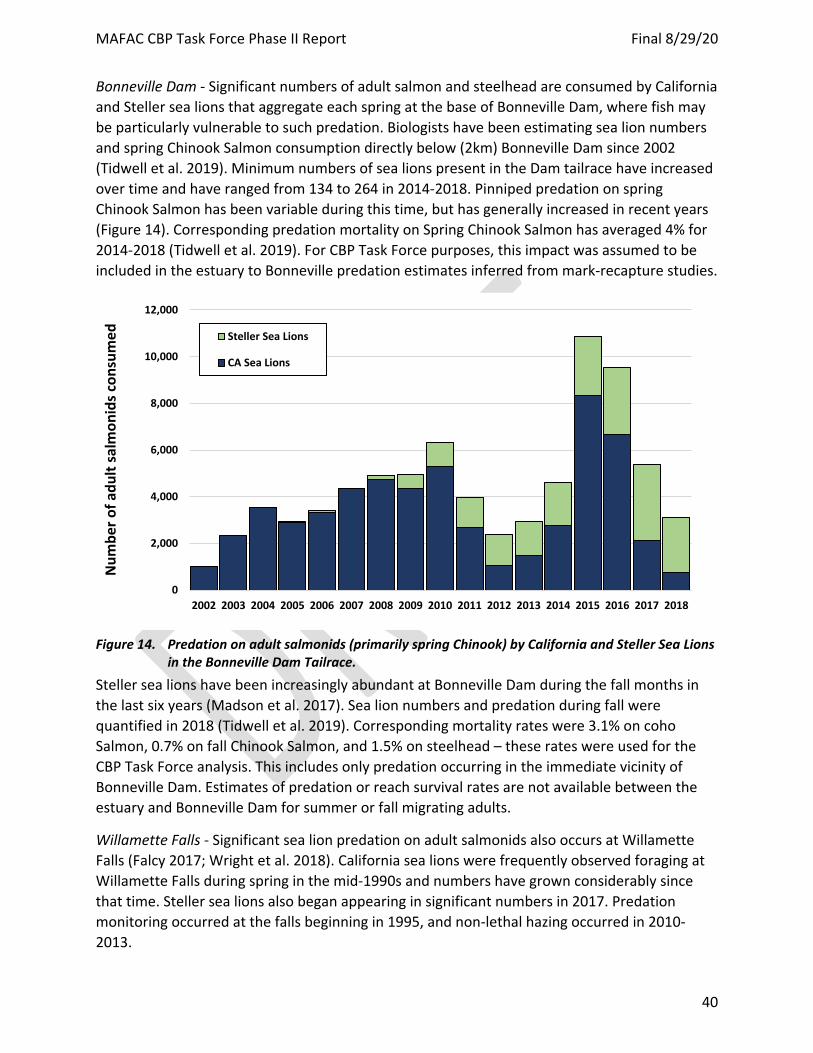
MAFAC CBP Task Force Phase II Report Final 8/29/20
40
Bonneville Dam - Significant numbers of adult salmon and steelhead are consumed by California and Steller sea lions that aggregate each spring at the base of Bonneville Dam, where fish may be particularly vulnerable to such predation. Biologists have been estimating sea lion numbers and spring Chinook Salmon consumption directly below (2km) Bonneville Dam since 2002 (Tidwell et al. 2019). Minimum numbers of sea lions present in the Dam tailrace have increased over time and have ranged from 134 to 264 in 2014-2018. Pinniped predation on spring Chinook Salmon has been variable during this time, but has generally increased in recent years (Figure 14). Corresponding predation mortality on Spring Chinook Salmon has averaged 4% for 2014-2018 (Tidwell et al. 2019). For CBP Task Force purposes, this impact was assumed to be included in the estuary to Bonneville predation estimates inferred from mark-recapture studies.
Figure 14. Predation on adult salmonids (primarily spring Chinook) by California and Steller Sea Lions
in the Bonneville Dam Tailrace. Steller sea lions have been increasingly abundant at Bonneville Dam during the fall months in the last six years (Madson et al. 2017). Sea lion numbers and predation during fall were quantified in 2018 (Tidwell et al. 2019). Corresponding mortality rates were 3.1% on coho Salmon, 0.7% on fall Chinook Salmon, and 1.5% on steelhead – these rates were used for the CBP Task Force analysis. This includes only predation occurring in the immediate vicinity of Bonneville Dam. Estimates of predation or reach survival rates are not available between the estuary and Bonneville Dam for summer or fall migrating adults.
Willamette Falls - Significant sea lion predation on adult salmonids also occurs at Willamette Falls (Falcy 2017; Wright et al. 2018). California sea lions were frequently observed foraging at Willamette Falls during spring in the mid-1990s and numbers have grown considerably since that time. Steller sea lions also began appearing in significant numbers in 2017. Predation monitoring occurred at the falls beginning in 1995, and non-lethal hazing occurred in 2010-2013.
0
2,000
4,000
6,000
8,000
10,000
12,000
2002 2003 2004 2005 2006 2007 2008 2009 2010 2011 2012 2013 2014 2015 2016 2017 2018
Num
ber o
f adu
lt sa
lmon
ids c
onsu
med Steller Sea Lions
CA Sea Lions
MAFAC CBP Task Force Phase II Report Final 8/29/20
41
Predation at the falls has been quantified annually from 2014 to the present. Annual predation mortality in 2014-2018 averaged 17% on winter steelhead and 8% on spring Chinook Salmon (Wright and Murtagh 2018). Willamette River salmon and steelhead are also vulnerable to predation throughout the lower Columbia River. This vulnerability is primarily for spring-run populations that migrate during May and June when pinniped abundance is highest. Oregon has also initiated similar removals of California sea lions preying on threatened fish below Willamette Falls.
CBP task force estimates for Willamette stocks include estimates for the Columbia mainstem and Willamette Falls (Table 9).
Piscivorous Fish
Resident fish predators are a significant source of mortality of juvenile salmonids during outmigration through the Columbia and Snake river mainstems and reservoirs (ISAB 2019; NMFS 2019). Predators include northern pikeminnow (Ptychocheilus oregonensis), which are native to the system and the non-native smallmouth bass, walleye, and channel catfish. In the mainstem of the Columbia and Snake Rivers, the altered habitats in project reservoirs reduce smolt migration rates, create more favorable habitat conditions for fish predators, and enhance conditions for predation in reservoirs and tailraces.
Research during the 1980s and early 1990s estimated that pikeminnow eat about 8% of the 200 million juvenile salmonids that migrated downstream in the Columbia River basin each year (Beamesderfer et al. 1996). Over half of this mortality was estimated to occur between the estuary and Bonneville Dam. From 1991 to present, pikeminnow have been harvested in an effort to reduce predation losses (Friesen and Ward 1999; Williams et al. 2017). This program has been estimated to have reduced systemwide predation by 30% (Williams et al. 2017).
Only limited information is available on the scale of predation by other fish predators. Both the Oregon and Washington Departments of Fish and Wildlife have removed size and bag limits for these species in their sport fishing regulations in an effort to reduce predation pressure on juvenile salmonids.
Impact estimates developed for the CBP Task Force incorporate estimates of pikeminnow predation based on a 30% reduction from historical system-wide estimates of 8% mortality. Estimates are scaled by stock, depending on the portion of the system through which juveniles migrate (Table 9). These values are intended to show the approximate order of magnitude of pikeminnow predation in relation to other sources of predation mortality. Corresponding mortality is a component of reach mortality estimates which are reported for mainstem migration (except for the reach downstream from Bonneville Dam). For CBP purposes, reach mortality estimates were adjusted to account for pikeminnow predation estimates so as not to double count. Other fish sources of predation were not quantified.
Potential for Compensation Estimates of the impact of juvenile predation on adult returns have the potential to overestimate net effect if other factors intervene to compensate for the change in mortality
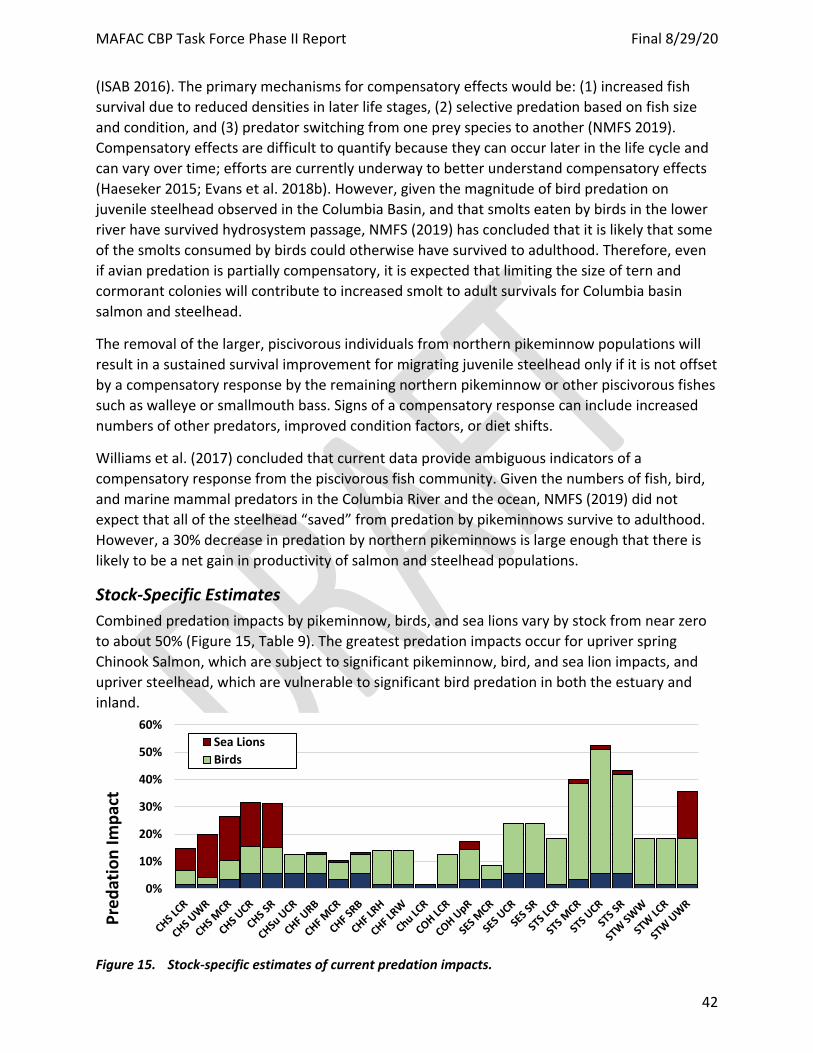
MAFAC CBP Task Force Phase II Report Final 8/29/20
42
(ISAB 2016). The primary mechanisms for compensatory effects would be: (1) increased fish survival due to reduced densities in later life stages, (2) selective predation based on fish size and condition, and (3) predator switching from one prey species to another (NMFS 2019). Compensatory effects are difficult to quantify because they can occur later in the life cycle and can vary over time; efforts are currently underway to better understand compensatory effects (Haeseker 2015; Evans et al. 2018b). However, given the magnitude of bird predation on juvenile steelhead observed in the Columbia Basin, and that smolts eaten by birds in the lower river have survived hydrosystem passage, NMFS (2019) has concluded that it is likely that some of the smolts consumed by birds could otherwise have survived to adulthood. Therefore, even if avian predation is partially compensatory, it is expected that limiting the size of tern and cormorant colonies will contribute to increased smolt to adult survivals for Columbia basin salmon and steelhead.
The removal of the larger, piscivorous individuals from northern pikeminnow populations will result in a sustained survival improvement for migrating juvenile steelhead only if it is not offset by a compensatory response by the remaining northern pikeminnow or other piscivorous fishes such as walleye or smallmouth bass. Signs of a compensatory response can include increased numbers of other predators, improved condition factors, or diet shifts.
Williams et al. (2017) concluded that current data provide ambiguous indicators of a compensatory response from the piscivorous fish community. Given the numbers of fish, bird, and marine mammal predators in the Columbia River and the ocean, NMFS (2019) did not expect that all of the steelhead “saved” from predation by pikeminnows survive to adulthood. However, a 30% decrease in predation by northern pikeminnows is large enough that there is likely to be a net gain in productivity of salmon and steelhead populations.
Stock-Specific Estimates Combined predation impacts by pikeminnow, birds, and sea lions vary by stock from near zero to about 50% (Figure 15, Table 9). The greatest predation impacts occur for upriver spring Chinook Salmon, which are subject to significant pikeminnow, bird, and sea lion impacts, and upriver steelhead, which are vulnerable to significant bird predation in both the estuary and inland.
Figure 15. Stock-specific estimates of current predation impacts.
0%
10%
20%
30%
40%
50%
60%
Pred
atio
n Im
pact
Sea LionsBirds
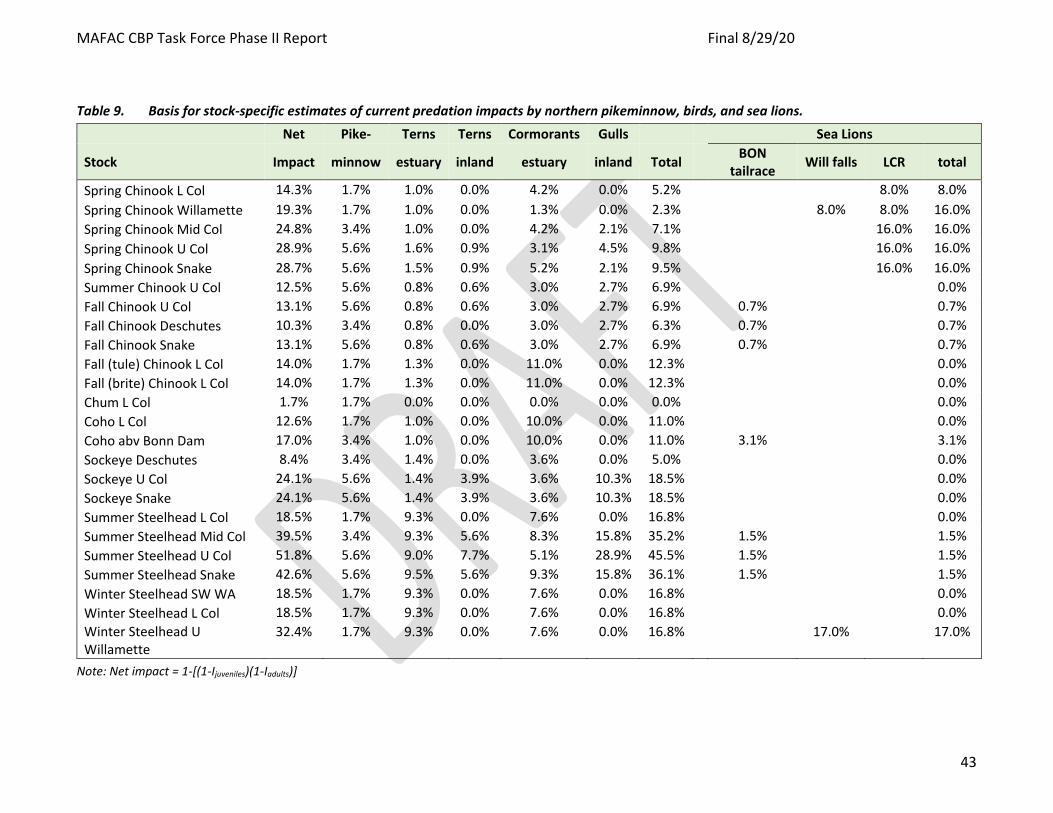
MAFAC CBP Task Force Phase II Report Final 8/29/20
43
Table 9. Basis for stock-specific estimates of current predation impacts by northern pikeminnow, birds, and sea lions.
Net Pike- Terns Terns Cormorants Gulls Sea Lions
Stock Impact minnow estuary inland estuary inland Total BON tailrace Will falls LCR total
Spring Chinook L Col 14.3% 1.7% 1.0% 0.0% 4.2% 0.0% 5.2% 8.0% 8.0% Spring Chinook Willamette 19.3% 1.7% 1.0% 0.0% 1.3% 0.0% 2.3%
8.0% 8.0% 16.0%
Spring Chinook Mid Col 24.8% 3.4% 1.0% 0.0% 4.2% 2.1% 7.1%
16.0% 16.0% Spring Chinook U Col 28.9% 5.6% 1.6% 0.9% 3.1% 4.5% 9.8%
16.0% 16.0%
Spring Chinook Snake 28.7% 5.6% 1.5% 0.9% 5.2% 2.1% 9.5%
16.0% 16.0% Summer Chinook U Col 12.5% 5.6% 0.8% 0.6% 3.0% 2.7% 6.9%
0.0%
Fall Chinook U Col 13.1% 5.6% 0.8% 0.6% 3.0% 2.7% 6.9% 0.7%
0.7% Fall Chinook Deschutes 10.3% 3.4% 0.8% 0.0% 3.0% 2.7% 6.3% 0.7%
0.7%
Fall Chinook Snake 13.1% 5.6% 0.8% 0.6% 3.0% 2.7% 6.9% 0.7%
0.7% Fall (tule) Chinook L Col 14.0% 1.7% 1.3% 0.0% 11.0% 0.0% 12.3%
0.0%
Fall (brite) Chinook L Col 14.0% 1.7% 1.3% 0.0% 11.0% 0.0% 12.3%
0.0% Chum L Col 1.7% 1.7% 0.0% 0.0% 0.0% 0.0% 0.0%
0.0%
Coho L Col 12.6% 1.7% 1.0% 0.0% 10.0% 0.0% 11.0%
0.0% Coho abv Bonn Dam 17.0% 3.4% 1.0% 0.0% 10.0% 0.0% 11.0% 3.1%
3.1%
Sockeye Deschutes 8.4% 3.4% 1.4% 0.0% 3.6% 0.0% 5.0%
0.0% Sockeye U Col 24.1% 5.6% 1.4% 3.9% 3.6% 10.3% 18.5%
0.0%
Sockeye Snake 24.1% 5.6% 1.4% 3.9% 3.6% 10.3% 18.5%
0.0% Summer Steelhead L Col 18.5% 1.7% 9.3% 0.0% 7.6% 0.0% 16.8%
0.0%
Summer Steelhead Mid Col 39.5% 3.4% 9.3% 5.6% 8.3% 15.8% 35.2% 1.5%
1.5% Summer Steelhead U Col 51.8% 5.6% 9.0% 7.7% 5.1% 28.9% 45.5% 1.5%
1.5%
Summer Steelhead Snake 42.6% 5.6% 9.5% 5.6% 9.3% 15.8% 36.1% 1.5%
1.5% Winter Steelhead SW WA 18.5% 1.7% 9.3% 0.0% 7.6% 0.0% 16.8%
0.0%
Winter Steelhead L Col 18.5% 1.7% 9.3% 0.0% 7.6% 0.0% 16.8%
0.0% Winter Steelhead U Willamette
32.4% 1.7% 9.3% 0.0% 7.6% 0.0% 16.8%
17.0%
17.0%
Note: Net impact = 1-[(1-Ijuveniles)(1-Iadults)]
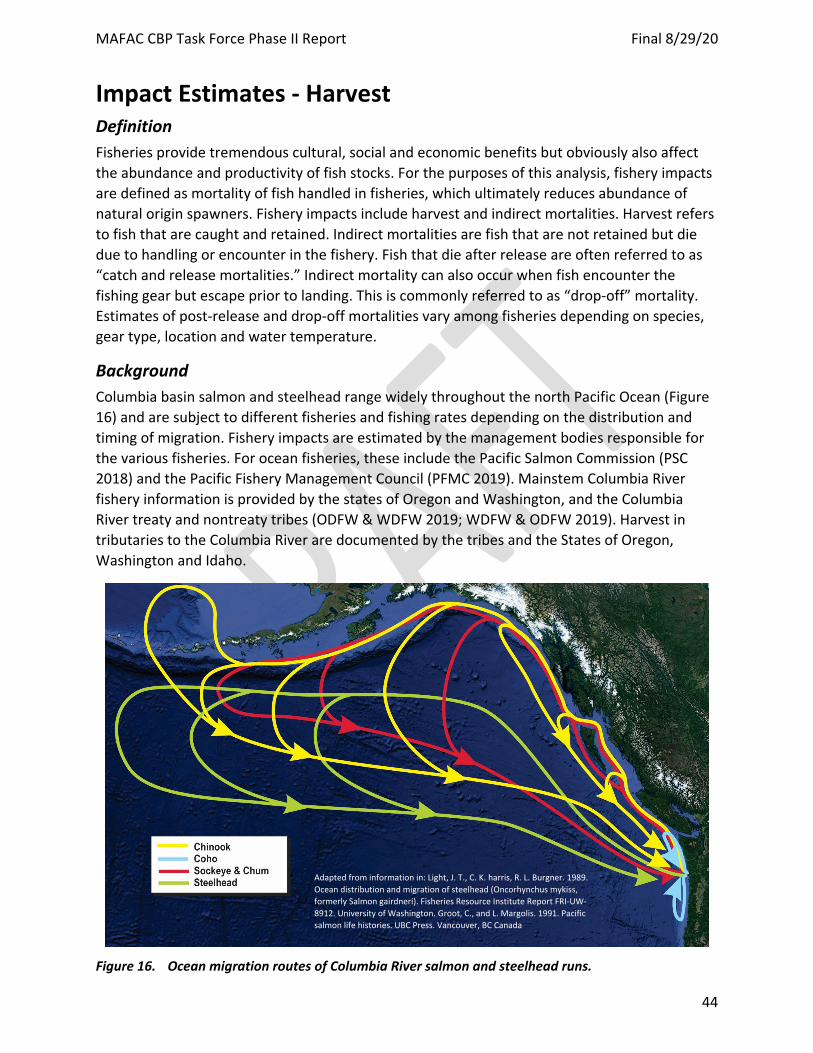
MAFAC CBP Task Force Phase II Report Final 8/29/20
44
Impact Estimates - Harvest Definition Fisheries provide tremendous cultural, social and economic benefits but obviously also affect the abundance and productivity of fish stocks. For the purposes of this analysis, fishery impacts are defined as mortality of fish handled in fisheries, which ultimately reduces abundance of natural origin spawners. Fishery impacts include harvest and indirect mortalities. Harvest refers to fish that are caught and retained. Indirect mortalities are fish that are not retained but die due to handling or encounter in the fishery. Fish that die after release are often referred to as “catch and release mortalities.” Indirect mortality can also occur when fish encounter the fishing gear but escape prior to landing. This is commonly referred to as “drop-off” mortality. Estimates of post-release and drop-off mortalities vary among fisheries depending on species, gear type, location and water temperature.
Background Columbia basin salmon and steelhead range widely throughout the north Pacific Ocean (Figure 16) and are subject to different fisheries and fishing rates depending on the distribution and timing of migration. Fishery impacts are estimated by the management bodies responsible for the various fisheries. For ocean fisheries, these include the Pacific Salmon Commission (PSC 2018) and the Pacific Fishery Management Council (PFMC 2019). Mainstem Columbia River fishery information is provided by the states of Oregon and Washington, and the Columbia River treaty and nontreaty tribes (ODFW & WDFW 2019; WDFW & ODFW 2019). Harvest in tributaries to the Columbia River are documented by the tribes and the States of Oregon, Washington and Idaho.
Figure 16. Ocean migration routes of Columbia River salmon and steelhead runs.
Adapted from information in: Light, J. T., C. K. harris, R. L. Burgner. 1989. Ocean distribution and migration of steelhead (Oncorhynchus mykiss, formerly Salmon gairdneri). Fisheries Resource Institute Report FRI-UW-8912. University of Washington. Groot, C., and L. Margolis. 1991. Pacific salmon life histories. UBC Press. Vancouver, BC Canada
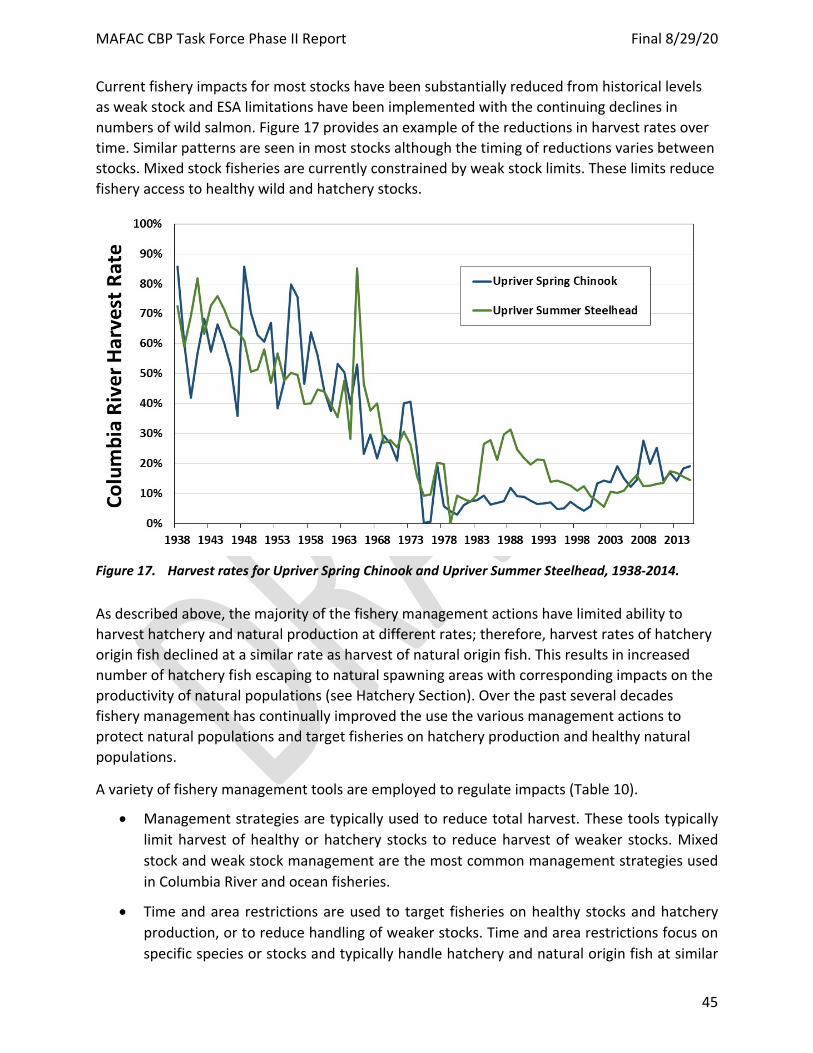
MAFAC CBP Task Force Phase II Report Final 8/29/20
45
Current fishery impacts for most stocks have been substantially reduced from historical levels as weak stock and ESA limitations have been implemented with the continuing declines in numbers of wild salmon. Figure 17 provides an example of the reductions in harvest rates over time. Similar patterns are seen in most stocks although the timing of reductions varies between stocks. Mixed stock fisheries are currently constrained by weak stock limits. These limits reduce fishery access to healthy wild and hatchery stocks.
Figure 17. Harvest rates for Upriver Spring Chinook and Upriver Summer Steelhead, 1938-2014. As described above, the majority of the fishery management actions have limited ability to harvest hatchery and natural production at different rates; therefore, harvest rates of hatchery origin fish declined at a similar rate as harvest of natural origin fish. This results in increased number of hatchery fish escaping to natural spawning areas with corresponding impacts on the productivity of natural populations (see Hatchery Section). Over the past several decades fishery management has continually improved the use the various management actions to protect natural populations and target fisheries on hatchery production and healthy natural populations.
A variety of fishery management tools are employed to regulate impacts (Table 10).
• Management strategies are typically used to reduce total harvest. These tools typically limit harvest of healthy or hatchery stocks to reduce harvest of weaker stocks. Mixed stock and weak stock management are the most common management strategies used in Columbia River and ocean fisheries.
• Time and area restrictions are used to target fisheries on healthy stocks and hatchery production, or to reduce handling of weaker stocks. Time and area restrictions focus on specific species or stocks and typically handle hatchery and natural origin fish at similar
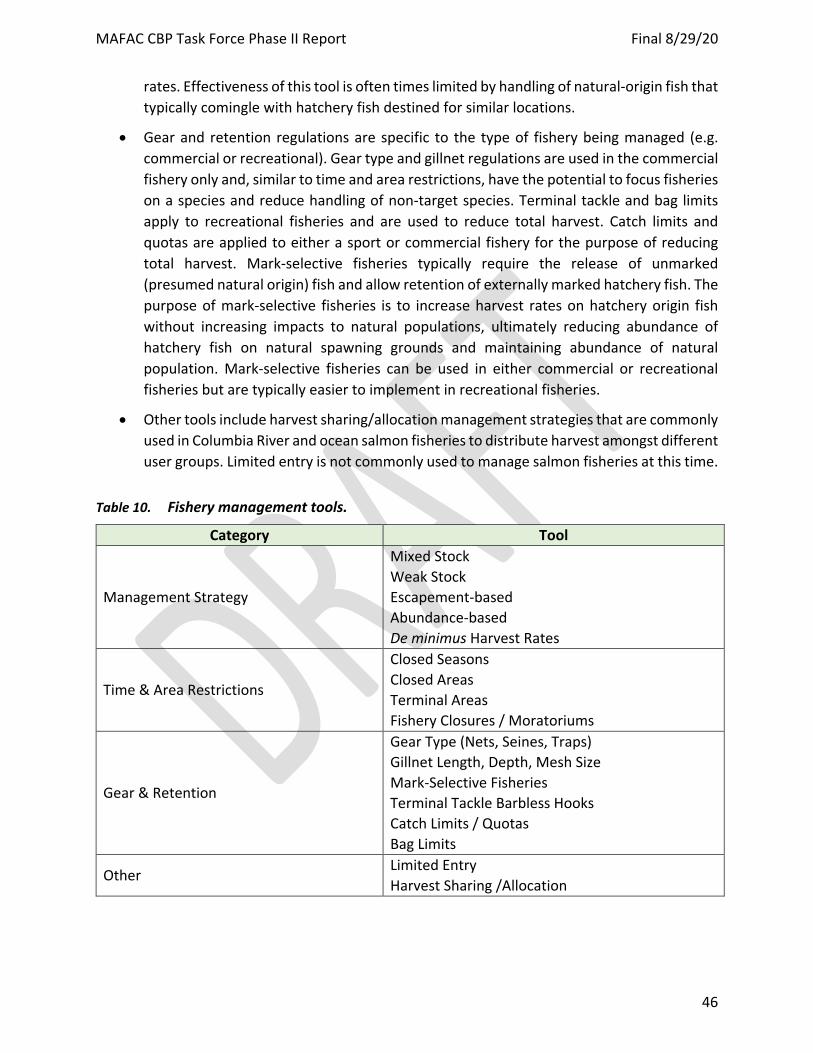
MAFAC CBP Task Force Phase II Report Final 8/29/20
46
rates. Effectiveness of this tool is often times limited by handling of natural-origin fish that typically comingle with hatchery fish destined for similar locations.
• Gear and retention regulations are specific to the type of fishery being managed (e.g. commercial or recreational). Gear type and gillnet regulations are used in the commercial fishery only and, similar to time and area restrictions, have the potential to focus fisheries on a species and reduce handling of non-target species. Terminal tackle and bag limits apply to recreational fisheries and are used to reduce total harvest. Catch limits and quotas are applied to either a sport or commercial fishery for the purpose of reducing total harvest. Mark-selective fisheries typically require the release of unmarked (presumed natural origin) fish and allow retention of externally marked hatchery fish. The purpose of mark-selective fisheries is to increase harvest rates on hatchery origin fish without increasing impacts to natural populations, ultimately reducing abundance of hatchery fish on natural spawning grounds and maintaining abundance of natural population. Mark-selective fisheries can be used in either commercial or recreational fisheries but are typically easier to implement in recreational fisheries.
• Other tools include harvest sharing/allocation management strategies that are commonly used in Columbia River and ocean salmon fisheries to distribute harvest amongst different user groups. Limited entry is not commonly used to manage salmon fisheries at this time.
Table 10. Fishery management tools.
Category Tool
Management Strategy
Mixed Stock Weak Stock Escapement-based Abundance-based De minimus Harvest Rates
Time & Area Restrictions
Closed Seasons Closed Areas Terminal Areas Fishery Closures / Moratoriums
Gear & Retention
Gear Type (Nets, Seines, Traps) Gillnet Length, Depth, Mesh Size Mark-Selective Fisheries Terminal Tackle Barbless Hooks Catch Limits / Quotas Bag Limits
Other Limited Entry Harvest Sharing /Allocation
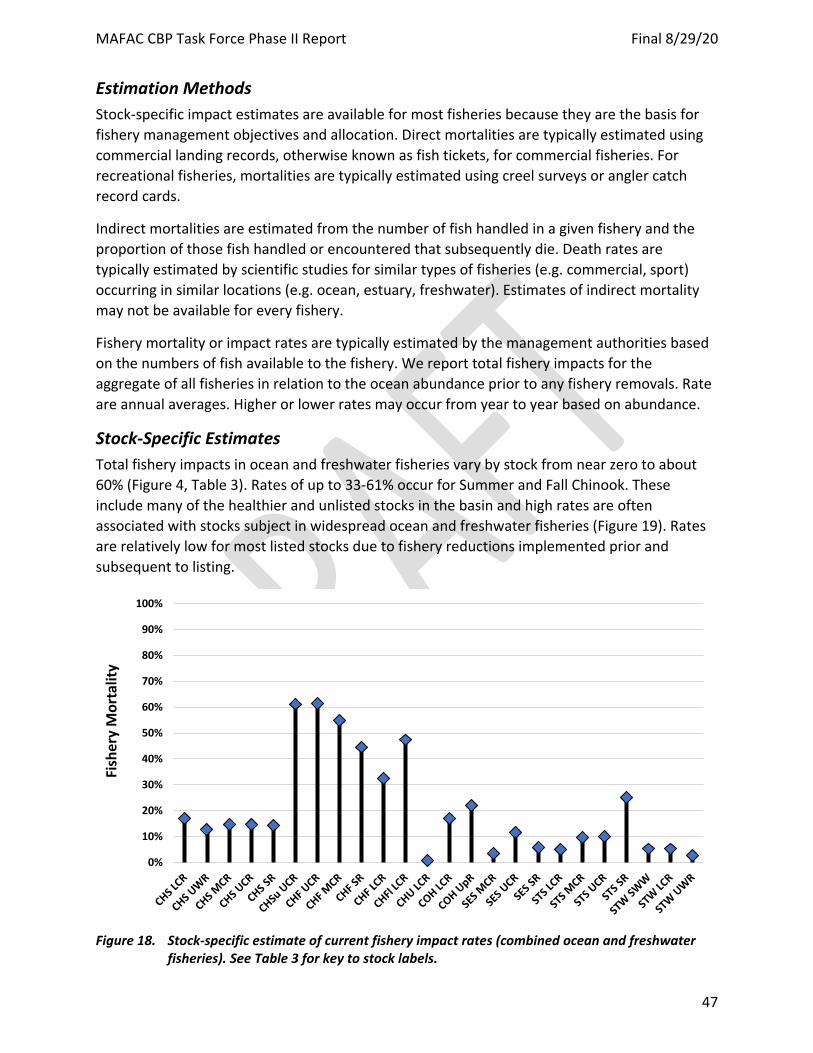
MAFAC CBP Task Force Phase II Report Final 8/29/20
47
Estimation Methods Stock-specific impact estimates are available for most fisheries because they are the basis for fishery management objectives and allocation. Direct mortalities are typically estimated using commercial landing records, otherwise known as fish tickets, for commercial fisheries. For recreational fisheries, mortalities are typically estimated using creel surveys or angler catch record cards.
Indirect mortalities are estimated from the number of fish handled in a given fishery and the proportion of those fish handled or encountered that subsequently die. Death rates are typically estimated by scientific studies for similar types of fisheries (e.g. commercial, sport) occurring in similar locations (e.g. ocean, estuary, freshwater). Estimates of indirect mortality may not be available for every fishery.
Fishery mortality or impact rates are typically estimated by the management authorities based on the numbers of fish available to the fishery. We report total fishery impacts for the aggregate of all fisheries in relation to the ocean abundance prior to any fishery removals. Rate are annual averages. Higher or lower rates may occur from year to year based on abundance.
Stock-Specific Estimates Total fishery impacts in ocean and freshwater fisheries vary by stock from near zero to about 60% (Figure 4, Table 3). Rates of up to 33-61% occur for Summer and Fall Chinook. These include many of the healthier and unlisted stocks in the basin and high rates are often associated with stocks subject in widespread ocean and freshwater fisheries (Figure 19). Rates are relatively low for most listed stocks due to fishery reductions implemented prior and subsequent to listing.
Figure 18. Stock-specific estimate of current fishery impact rates (combined ocean and freshwater
fisheries). See Table 3 for key to stock labels.
0%
10%
20%
30%
40%
50%
60%
70%
80%
90%
100%
Fish
ery
Mor
talit
y
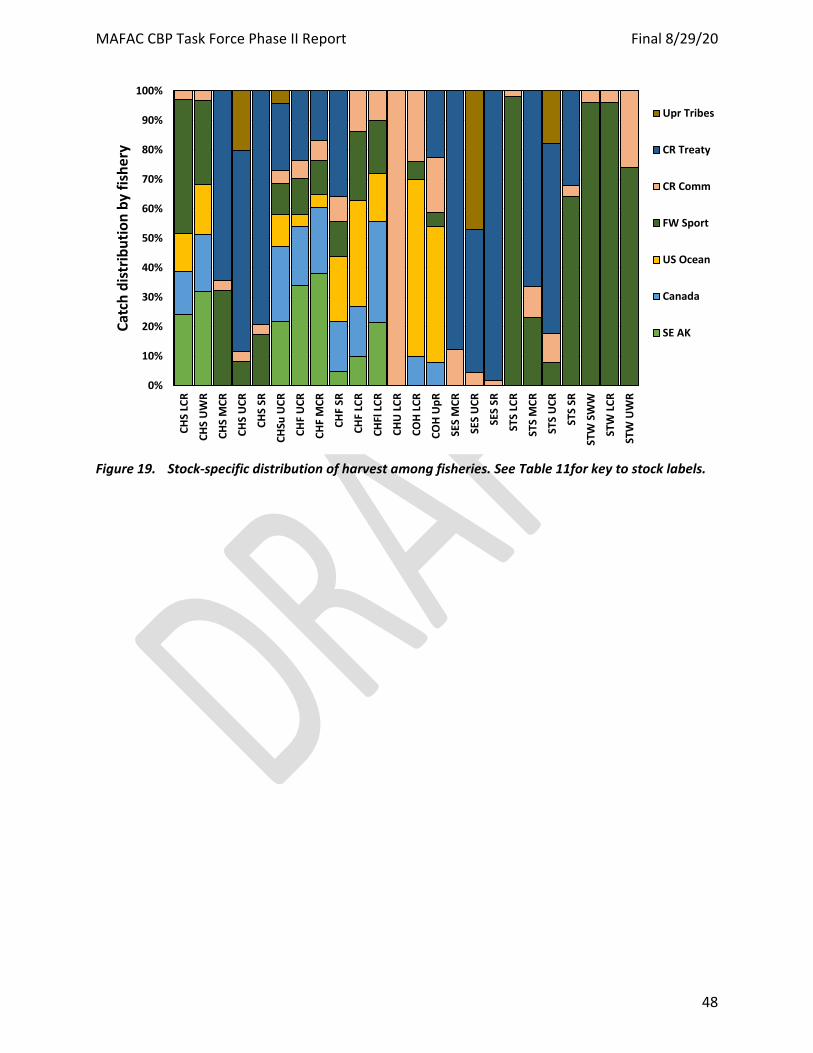
MAFAC CBP Task Force Phase II Report Final 8/29/20
48
Figure 19. Stock-specific distribution of harvest among fisheries. See Table 11for key to stock labels.
0%
10%
20%
30%
40%
50%
60%
70%
80%
90%
100%
CHS
LCR
CHS
UW
R
CHS
MCR
CHS
UCR
CHS
SR
CHSu
UCR
CHF
UCR
CHF
MCR
CHF
SR
CHF
LCR
CHFl
LCR
CHU
LCR
COH
LCR
COH
UpR
SES
MCR
SES
UCR
SES
SR
STS
LCR
STS
MCR
STS
UCR
STS
SR
STW
SW
W
STW
LCR
STW
UW
R
Catc
h di
strib
utio
n by
fish
ery
Upr Tribes
CR Treaty
CR Comm
FW Sport
US Ocean
Canada
SE AK
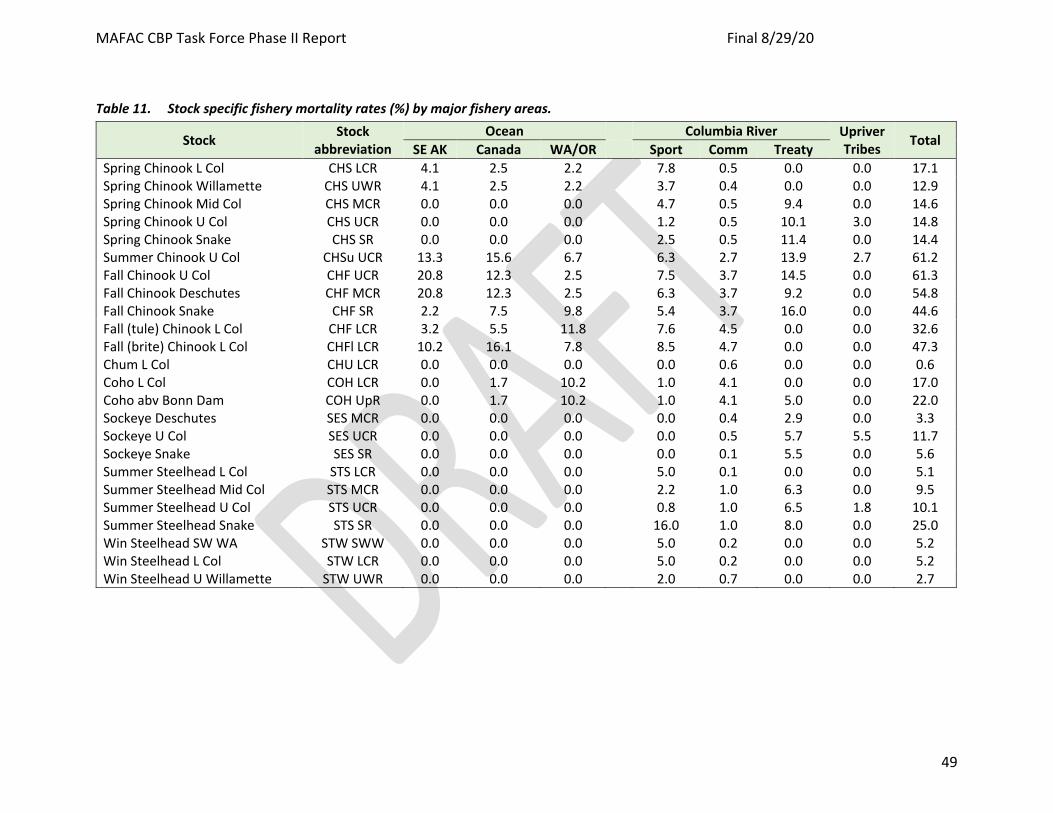
MAFAC CBP Task Force Phase II Report Final 8/29/20
49
Table 11. Stock specific fishery mortality rates (%) by major fishery areas.
Stock Stock abbreviation
Ocean Columbia River Upriver Tribes Total
SE AK Canada WA/OR Sport Comm Treaty Spring Chinook L Col CHS LCR 4.1 2.5 2.2 7.8 0.5 0.0 0.0 17.1 Spring Chinook Willamette CHS UWR 4.1 2.5 2.2 3.7 0.4 0.0 0.0 12.9 Spring Chinook Mid Col CHS MCR 0.0 0.0 0.0 4.7 0.5 9.4 0.0 14.6 Spring Chinook U Col CHS UCR 0.0 0.0 0.0 1.2 0.5 10.1 3.0 14.8 Spring Chinook Snake CHS SR 0.0 0.0 0.0 2.5 0.5 11.4 0.0 14.4 Summer Chinook U Col CHSu UCR 13.3 15.6 6.7 6.3 2.7 13.9 2.7 61.2 Fall Chinook U Col CHF UCR 20.8 12.3 2.5 7.5 3.7 14.5 0.0 61.3 Fall Chinook Deschutes CHF MCR 20.8 12.3 2.5 6.3 3.7 9.2 0.0 54.8 Fall Chinook Snake CHF SR 2.2 7.5 9.8 5.4 3.7 16.0 0.0 44.6 Fall (tule) Chinook L Col CHF LCR 3.2 5.5 11.8 7.6 4.5 0.0 0.0 32.6 Fall (brite) Chinook L Col CHFl LCR 10.2 16.1 7.8 8.5 4.7 0.0 0.0 47.3 Chum L Col CHU LCR 0.0 0.0 0.0 0.0 0.6 0.0 0.0 0.6 Coho L Col COH LCR 0.0 1.7 10.2 1.0 4.1 0.0 0.0 17.0 Coho abv Bonn Dam COH UpR 0.0 1.7 10.2 1.0 4.1 5.0 0.0 22.0 Sockeye Deschutes SES MCR 0.0 0.0 0.0 0.0 0.4 2.9 0.0 3.3 Sockeye U Col SES UCR 0.0 0.0 0.0 0.0 0.5 5.7 5.5 11.7 Sockeye Snake SES SR 0.0 0.0 0.0 0.0 0.1 5.5 0.0 5.6 Summer Steelhead L Col STS LCR 0.0 0.0 0.0 5.0 0.1 0.0 0.0 5.1 Summer Steelhead Mid Col STS MCR 0.0 0.0 0.0 2.2 1.0 6.3 0.0 9.5 Summer Steelhead U Col STS UCR 0.0 0.0 0.0 0.8 1.0 6.5 1.8 10.1 Summer Steelhead Snake STS SR 0.0 0.0 0.0 16.0 1.0 8.0 0.0 25.0 Win Steelhead SW WA STW SWW 0.0 0.0 0.0 5.0 0.2 0.0 0.0 5.2 Win Steelhead L Col STW LCR 0.0 0.0 0.0 5.0 0.2 0.0 0.0 5.2 Win Steelhead U Willamette STW UWR 0.0 0.0 0.0 2.0 0.7 0.0 0.0 2.7
MAFAC CBP Task Force Phase II Report Final 8/29/20
Page 50 of 87
Impact Estimates - Hatcheries Definition Hatchery impacts are defined as the percentage reduction in natural productivity due to the effects of hatchery fish on natural population diversity, productivity, and fitness, as well as effects on fish health and effects resulting from complex ecological interactions. This definition is conservative from the perspective of natural production in that it captures only potential detrimental effects of hatcheries. Hatcheries may also benefit natural production in certain circumstances, particularly in the short term.
Background Columbia basin hatcheries currently release about 140 juvenile salmon and steelhead per year, primarily as mitigation for declining numbers of wild fish associated with increasing development throughout the basin. Hatcheries account for an average annual return of about 1.5 million adults per year or about two thirds of the current total return.
The scale and significance of hatchery fish interactions with natural production remains a source of substantial uncertainty and no small amount of controversy. Net effects include a complex of both negative and positive contributions that depend on the status of the natural populations and characteristics of the hatchery fish. The Northwest Power and Conservation Council's scientific bodies have identified three critical uncertainties regarding salmon and steelhead hatchery impacts on natural populations (ISAB/ISRP 2016). The first uncertainty concerns the cumulative effects of basinwide hatchery production on natural populations given the various ways that hatchery fish can interact, both directly and indirectly, with natural origin fish. The second uncertainty concerns the extent to which production by natural populations can be improved by supplementation. The last uncertainty is about the genetic or epigenetic changes that occur in cultured populations, and the impacts of such changes on the fitness of natural populations.
Hatchery conservation and supplementation programs have proven to be successful strategies for increasing the number of naturally spawning, natural-origin fish, at least in the short term NMFS (2014). Benefits may outweigh risks under circumstances where demographic or short-term extinction risk to the population is greater than risks to population diversity and productivity(NMFS 2019). Conversely, the long-term use of artificial propagation may pose risks to natural productivity and diversity (NMFS 2019). Demographic benefits are sustainable only if they exceed the predicted reductions in genetic viability and reproductive fitness of natural-origin fish in subsequent generations (HSRG 2009). The long-term success in recovering a self-sustaining, naturally spawning population is yet to be demonstrated and may be difficult without commensurate improvements in the condition of natural habitat (NMFS 2014).
A primary benefit conferred by hatchery programs is an increase in the total abundance of a salmon population that returns to spawn naturally (NMFS 2014). Freshwater, habitat-related factors limiting the survival and productivity of a natural-origin population can be circumvented by spawning, incubating, rearing, and releasing fish from the population in a hatchery facility (NMFS 2014). Safety net or conservation hatchery programs can provide short-term
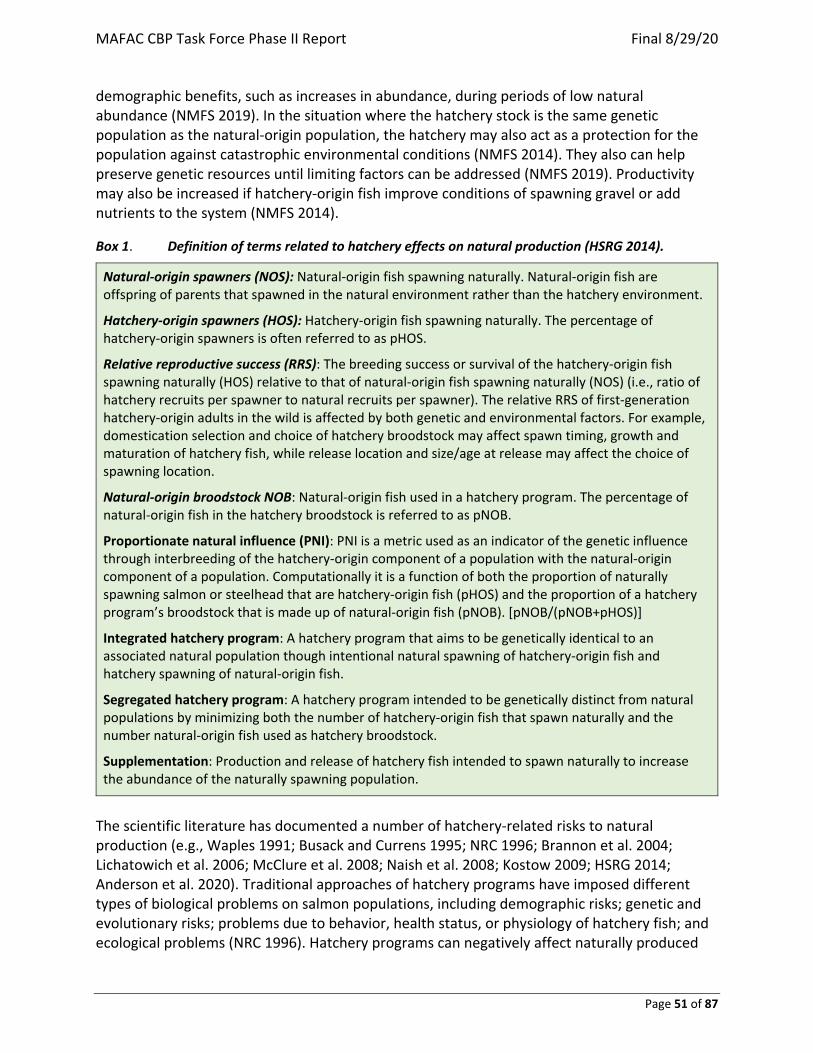
MAFAC CBP Task Force Phase II Report Final 8/29/20
Page 51 of 87
demographic benefits, such as increases in abundance, during periods of low natural abundance (NMFS 2019). In the situation where the hatchery stock is the same genetic population as the natural-origin population, the hatchery may also act as a protection for the population against catastrophic environmental conditions (NMFS 2014). They also can help preserve genetic resources until limiting factors can be addressed (NMFS 2019). Productivity may also be increased if hatchery-origin fish improve conditions of spawning gravel or add nutrients to the system (NMFS 2014). Box 1. Definition of terms related to hatchery effects on natural production (HSRG 2014).
Natural-origin spawners (NOS): Natural-origin fish spawning naturally. Natural-origin fish are offspring of parents that spawned in the natural environment rather than the hatchery environment.
Hatchery-origin spawners (HOS): Hatchery-origin fish spawning naturally. The percentage of hatchery-origin spawners is often referred to as pHOS.
Relative reproductive success (RRS): The breeding success or survival of the hatchery-origin fish spawning naturally (HOS) relative to that of natural-origin fish spawning naturally (NOS) (i.e., ratio of hatchery recruits per spawner to natural recruits per spawner). The relative RRS of first-generation hatchery-origin adults in the wild is affected by both genetic and environmental factors. For example, domestication selection and choice of hatchery broodstock may affect spawn timing, growth and maturation of hatchery fish, while release location and size/age at release may affect the choice of spawning location.
Natural-origin broodstock NOB: Natural-origin fish used in a hatchery program. The percentage of natural-origin fish in the hatchery broodstock is referred to as pNOB.
Proportionate natural influence (PNI): PNI is a metric used as an indicator of the genetic influence through interbreeding of the hatchery-origin component of a population with the natural-origin component of a population. Computationally it is a function of both the proportion of naturally spawning salmon or steelhead that are hatchery-origin fish (pHOS) and the proportion of a hatchery program’s broodstock that is made up of natural-origin fish (pNOB). [pNOB/(pNOB+pHOS)]
Integrated hatchery program: A hatchery program that aims to be genetically identical to an associated natural population though intentional natural spawning of hatchery-origin fish and hatchery spawning of natural-origin fish.
Segregated hatchery program: A hatchery program intended to be genetically distinct from natural populations by minimizing both the number of hatchery-origin fish that spawn naturally and the number natural-origin fish used as hatchery broodstock.
Supplementation: Production and release of hatchery fish intended to spawn naturally to increase the abundance of the naturally spawning population.
The scientific literature has documented a number of hatchery-related risks to natural production (e.g., Waples 1991; Busack and Currens 1995; NRC 1996; Brannon et al. 2004; Lichatowich et al. 2006; McClure et al. 2008; Naish et al. 2008; Kostow 2009; HSRG 2014; Anderson et al. 2020). Traditional approaches of hatchery programs have imposed different types of biological problems on salmon populations, including demographic risks; genetic and evolutionary risks; problems due to behavior, health status, or physiology of hatchery fish; and ecological problems (NRC 1996). Hatchery programs can negatively affect naturally produced
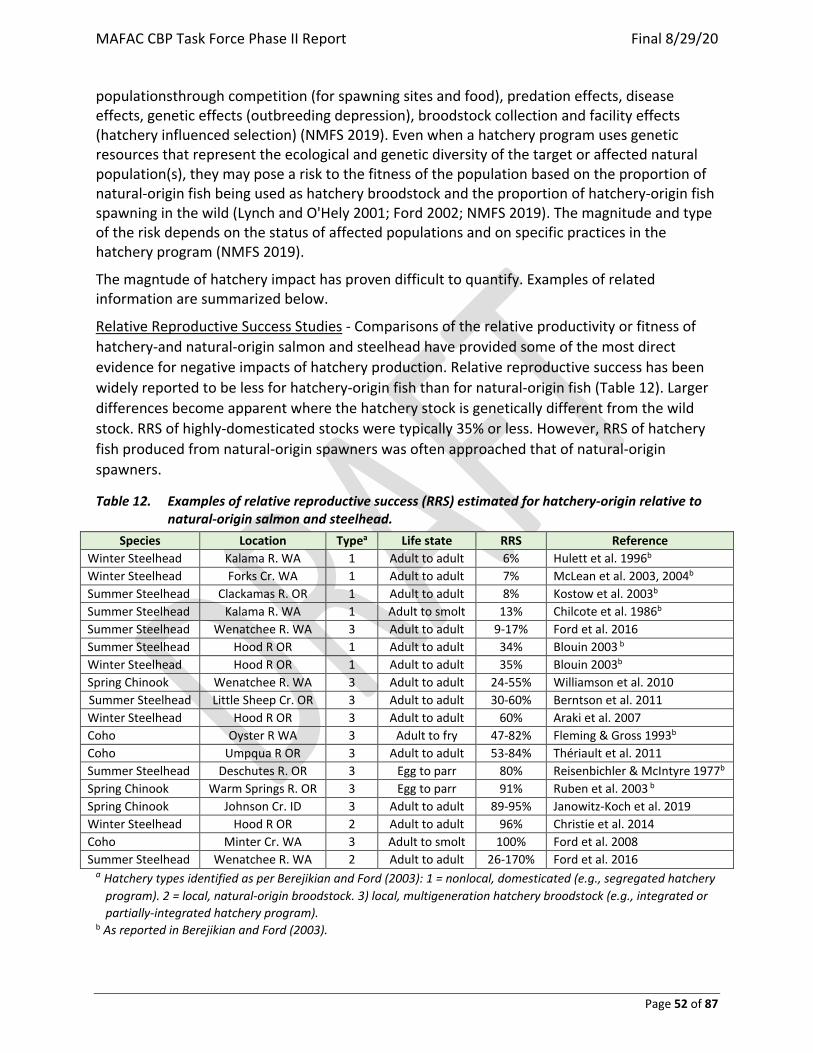
MAFAC CBP Task Force Phase II Report Final 8/29/20
Page 52 of 87
populationsthrough competition (for spawning sites and food), predation effects, disease effects, genetic effects (outbreeding depression), broodstock collection and facility effects (hatchery influenced selection) (NMFS 2019). Even when a hatchery program uses genetic resources that represent the ecological and genetic diversity of the target or affected natural population(s), they may pose a risk to the fitness of the population based on the proportion of natural-origin fish being used as hatchery broodstock and the proportion of hatchery-origin fish spawning in the wild (Lynch and O'Hely 2001; Ford 2002; NMFS 2019). The magnitude and type of the risk depends on the status of affected populations and on specific practices in the hatchery program (NMFS 2019).
The magntude of hatchery impact has proven difficult to quantify. Examples of related information are summarized below.
Relative Reproductive Success Studies - Comparisons of the relative productivity or fitness of hatchery-and natural-origin salmon and steelhead have provided some of the most direct evidence for negative impacts of hatchery production. Relative reproductive success has been widely reported to be less for hatchery-origin fish than for natural-origin fish (Table 12). Larger differences become apparent where the hatchery stock is genetically different from the wild stock. RRS of highly-domesticated stocks were typically 35% or less. However, RRS of hatchery fish produced from natural-origin spawners was often approached that of natural-origin spawners.
Table 12. Examples of relative reproductive success (RRS) estimated for hatchery-origin relative to natural-origin salmon and steelhead.
Species Location Typea Life state RRS Reference Winter Steelhead Kalama R. WA 1 Adult to adult 6% Hulett et al. 1996b Winter Steelhead Forks Cr. WA 1 Adult to adult 7% McLean et al. 2003, 2004b Summer Steelhead Clackamas R. OR 1 Adult to adult 8% Kostow et al. 2003b Summer Steelhead Kalama R. WA 1 Adult to smolt 13% Chilcote et al. 1986b Summer Steelhead Wenatchee R. WA 3 Adult to adult 9-17% Ford et al. 2016 Summer Steelhead Hood R OR 1 Adult to adult 34% Blouin 2003 b Winter Steelhead Hood R OR 1 Adult to adult 35% Blouin 2003b Spring Chinook Wenatchee R. WA 3 Adult to adult 24-55% Williamson et al. 2010 Summer Steelhead Little Sheep Cr. OR 3 Adult to adult 30-60% Berntson et al. 2011 Winter Steelhead Hood R OR 3 Adult to adult 60% Araki et al. 2007 Coho Oyster R WA 3 Adult to fry 47-82% Fleming & Gross 1993b Coho Umpqua R OR 3 Adult to adult 53-84% Thériault et al. 2011 Summer Steelhead Deschutes R. OR 3 Egg to parr 80% Reisenbichler & McIntyre 1977b Spring Chinook Warm Springs R. OR 3 Egg to parr 91% Ruben et al. 2003 b Spring Chinook Johnson Cr. ID 3 Adult to adult 89-95% Janowitz-Koch et al. 2019 Winter Steelhead Hood R OR 2 Adult to adult 96% Christie et al. 2014 Coho Minter Cr. WA 3 Adult to smolt 100% Ford et al. 2008 Summer Steelhead Wenatchee R. WA 2 Adult to adult 26-170% Ford et al. 2016
a Hatchery types identified as per Berejikian and Ford (2003): 1 = nonlocal, domesticated (e.g., segregated hatchery program). 2 = local, natural-origin broodstock. 3) local, multigeneration hatchery broodstock (e.g., integrated or partially-integrated hatchery program).
b As reported in Berejikian and Ford (2003).
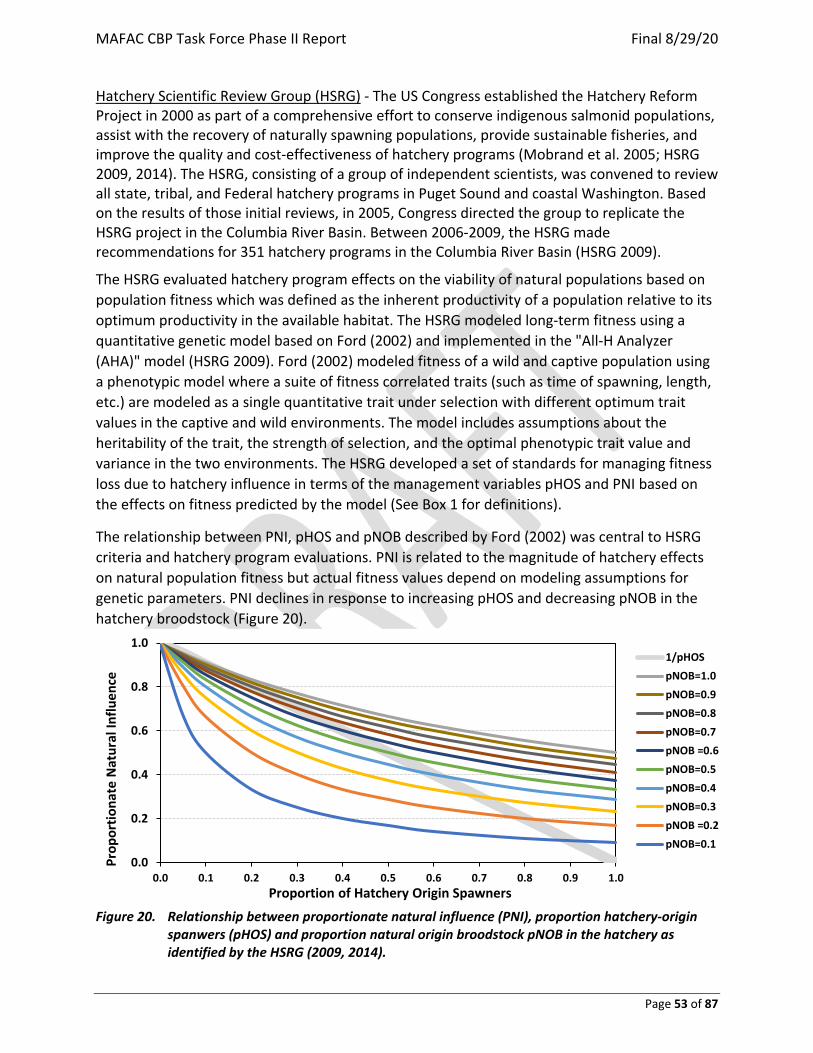
MAFAC CBP Task Force Phase II Report Final 8/29/20
Page 53 of 87
Hatchery Scientific Review Group (HSRG) - The US Congress established the Hatchery Reform Project in 2000 as part of a comprehensive effort to conserve indigenous salmonid populations, assist with the recovery of naturally spawning populations, provide sustainable fisheries, and improve the quality and cost-effectiveness of hatchery programs (Mobrand et al. 2005; HSRG 2009, 2014). The HSRG, consisting of a group of independent scientists, was convened to review all state, tribal, and Federal hatchery programs in Puget Sound and coastal Washington. Based on the results of those initial reviews, in 2005, Congress directed the group to replicate the HSRG project in the Columbia River Basin. Between 2006-2009, the HSRG made recommendations for 351 hatchery programs in the Columbia River Basin (HSRG 2009).
The HSRG evaluated hatchery program effects on the viability of natural populations based on population fitness which was defined as the inherent productivity of a population relative to its optimum productivity in the available habitat. The HSRG modeled long-term fitness using a quantitative genetic model based on Ford (2002) and implemented in the "All-H Analyzer (AHA)" model (HSRG 2009). Ford (2002) modeled fitness of a wild and captive population using a phenotypic model where a suite of fitness correlated traits (such as time of spawning, length, etc.) are modeled as a single quantitative trait under selection with different optimum trait values in the captive and wild environments. The model includes assumptions about the heritability of the trait, the strength of selection, and the optimal phenotypic trait value and variance in the two environments. The HSRG developed a set of standards for managing fitness loss due to hatchery influence in terms of the management variables pHOS and PNI based on the effects on fitness predicted by the model (See Box 1 for definitions).
The relationship between PNI, pHOS and pNOB described by Ford (2002) was central to HSRG criteria and hatchery program evaluations. PNI is related to the magnitude of hatchery effects on natural population fitness but actual fitness values depend on modeling assumptions for genetic parameters. PNI declines in response to increasing pHOS and decreasing pNOB in the hatchery broodstock (Figure 20).
Figure 20. Relationship between proportionate natural influence (PNI), proportion hatchery-origin
spanwers (pHOS) and proportion natural origin broodstock pNOB in the hatchery as identified by the HSRG (2009, 2014).
0.0
0.2
0.4
0.6
0.8
1.0
0.0 0.1 0.2 0.3 0.4 0.5 0.6 0.7 0.8 0.9 1.0
Prop
ortio
nate
Nat
ural
Influ
ence
Proportion of Hatchery Origin Spawners
1/pHOSpNOB=1.0pNOB=0.9pNOB=0.8pNOB=0.7pNOB =0.6pNOB=0.5pNOB=0.4pNOB=0.3pNOB =0.2pNOB=0.1
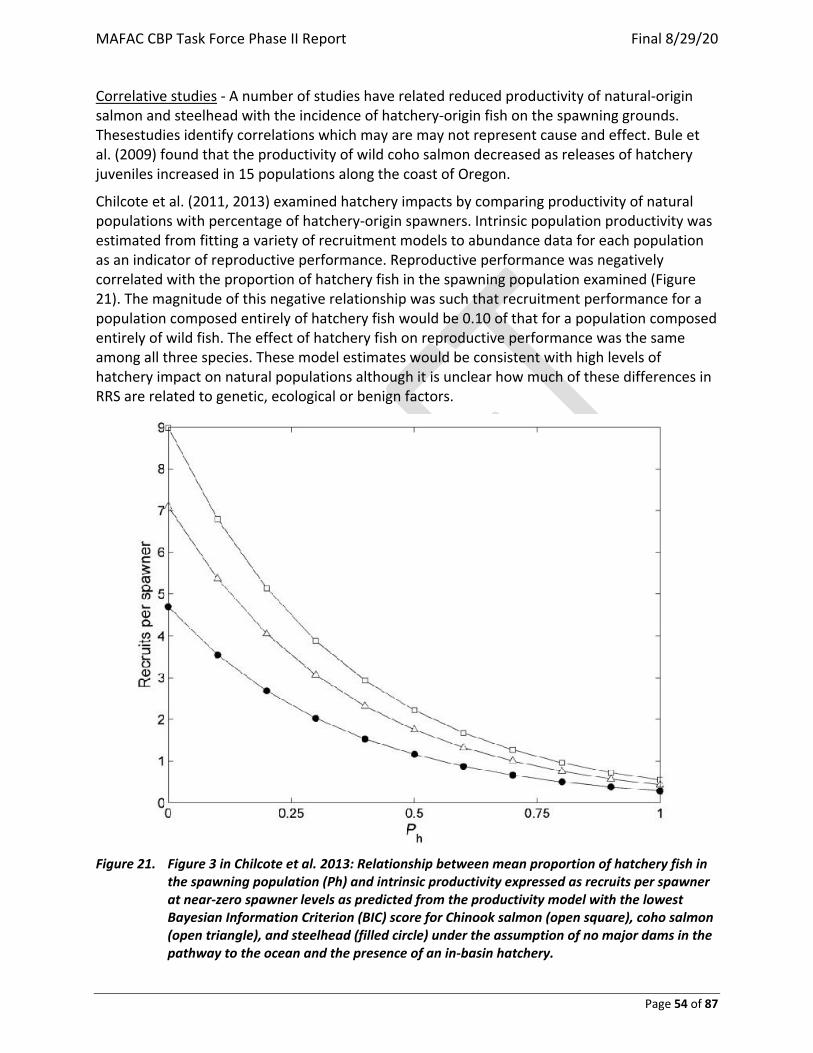
MAFAC CBP Task Force Phase II Report Final 8/29/20
Page 54 of 87
Correlative studies - A number of studies have related reduced productivity of natural-origin salmon and steelhead with the incidence of hatchery-origin fish on the spawning grounds. Thesestudies identify correlations which may are may not represent cause and effect. Bule et al. (2009) found that the productivity of wild coho salmon decreased as releases of hatchery juveniles increased in 15 populations along the coast of Oregon.
Chilcote et al. (2011, 2013) examined hatchery impacts by comparing productivity of natural populations with percentage of hatchery-origin spawners. Intrinsic population productivity was estimated from fitting a variety of recruitment models to abundance data for each population as an indicator of reproductive performance. Reproductive performance was negatively correlated with the proportion of hatchery fish in the spawning population examined (Figure 21). The magnitude of this negative relationship was such that recruitment performance for a population composed entirely of hatchery fish would be 0.10 of that for a population composed entirely of wild fish. The effect of hatchery fish on reproductive performance was the same among all three species. These model estimates would be consistent with high levels of hatchery impact on natural populations although it is unclear how much of these differences in RRS are related to genetic, ecological or benign factors.
Figure 21. Figure 3 in Chilcote et al. 2013: Relationship between mean proportion of hatchery fish in
the spawning population (Ph) and intrinsic productivity expressed as recruits per spawner at near-zero spawner levels as predicted from the productivity model with the lowest Bayesian Information Criterion (BIC) score for Chinook salmon (open square), coho salmon (open triangle), and steelhead (filled circle) under the assumption of no major dams in the pathway to the ocean and the presence of an in-basin hatchery.
MAFAC CBP Task Force Phase II Report Final 8/29/20
Page 55 of 87
Idaho Supplementation Study - The Idaho Supplementation Studies (ISS) was designed to measure the population effects of dedicated, intentional supplementation on the abundance and productivity of Chinook Salmon during and after supplementation (Venditti et al. 2015; ISRP 2016). Supplementation is defined as the attempt to use artificial propagation to maintain or increase natural production. The ISS examined this question by looking at how supplementation affected abundance and productivity at juvenile and adult stages in the life cycle. The ISS took place in the Salmon and Clearwater subbasins, involved 27 streams (13 supplemented and 14 reference streams) and spanned 23 years. The sheer length and breadth of the study make it one of the biggest manipulative experiments ever attempted in the fisheries field (Venditti et al. 2015).
Results showed that supplementation increased (a) redd numbers, (b) juvenile emigrants, (c) smolts at Lower Granite Dam, and (d) returning adult progeny. Differences in broodstock composition in different areas also showed the value of integrating locally adapted fish into supplementation broodstocks. Natural-origin females had the largest effect on population abundance followed by supplementation and then non-treatment hatchery females. These results would support the hypothesis that relative fitness of natural-origin females is greater than that of hatchery-origin females as has been documented in other studies.
Productivity and abundance generally returned to pre-supplementation levels after supplementation ceased. These results indicated that increases in abundance will not continue if factors originally limiting a population are not addressed (ISRP 2016). At least in this study, no lasting reductions in abundance or productivity were detected for Chinook salmon. This is an important management finding because it implies that supplementation can occur in a population without incurring lasting reductions in fitness (ISRP 2016). Scheuerell et al. (2015) similarly reported that natural production of Snake River spring Chinook was not strongly affected by supplementation with hatchery fish.
Response to hatchery elimination - If hatchery fish have a large impact on natural production, then abundance and productivity of natural populations should increase following elimination the hatchery program. Experiments or case histories for hatchery removals are rare. However, a recent study by Courter et al. (2019) does not appear to suggest a hypothesis for a large hatchery impact, at least in one particular circumstance. This study analyzed steelhead population census data (1958–2017) to determine whether elimination of summer steelhead stocking in the upper Clackamas River in 1998 increased the productivity of natural-origin winter steelhead. A stock–recruitment model was fitted to the adult steelhead data set, and productivity was estimated as a function of hatchery-origin spawner abundance as well as other environmental factors. When used as a predictive variable in the model, the abundance of hatchery summer steelhead spawners (1972–2001) did not have a negative effect on winter steelhead recruitment. Winter steelhead abundance in the upper Clackamas River basin failed to rebound to abundances observed in years prior to the hatchery program, and fluctuations in winter steelhead abundance were correlated with those of other regional winter steelhead stocks.
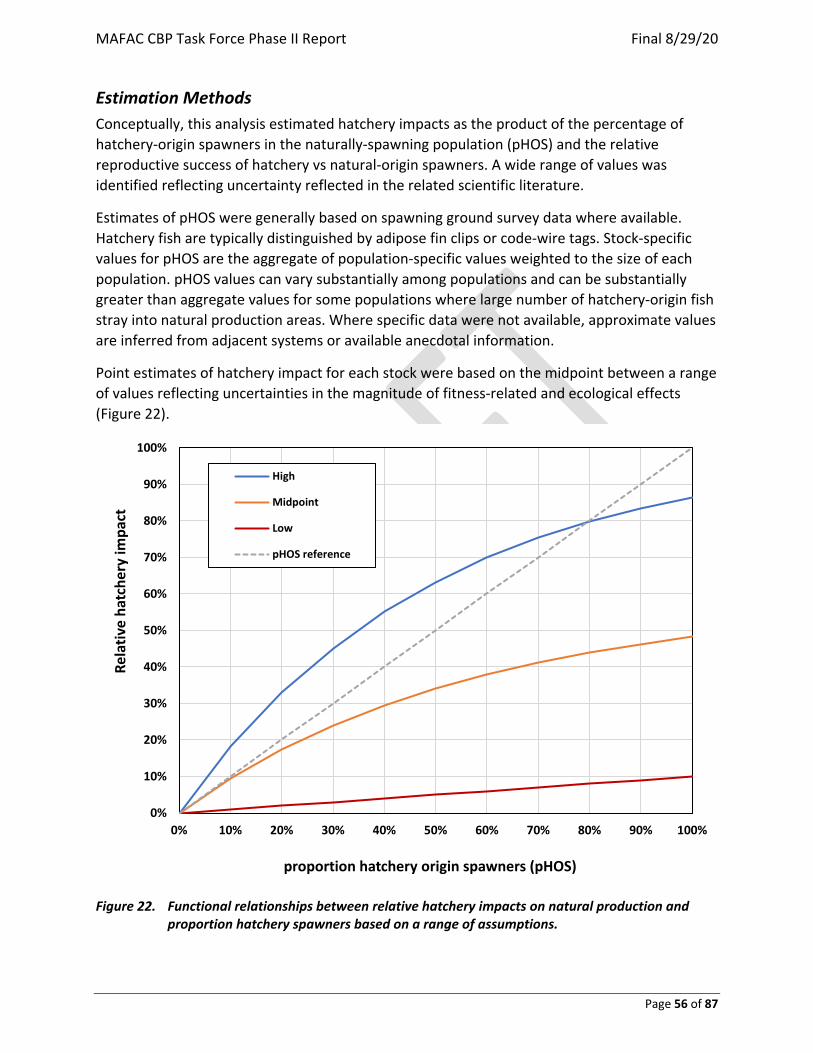
MAFAC CBP Task Force Phase II Report Final 8/29/20
Page 56 of 87
Estimation Methods Conceptually, this analysis estimated hatchery impacts as the product of the percentage of hatchery-origin spawners in the naturally-spawning population (pHOS) and the relative reproductive success of hatchery vs natural-origin spawners. A wide range of values was identified reflecting uncertainty reflected in the related scientific literature.
Estimates of pHOS were generally based on spawning ground survey data where available. Hatchery fish are typically distinguished by adipose fin clips or code-wire tags. Stock-specific values for pHOS are the aggregate of population-specific values weighted to the size of each population. pHOS values can vary substantially among populations and can be substantially greater than aggregate values for some populations where large number of hatchery-origin fish stray into natural production areas. Where specific data were not available, approximate values are inferred from adjacent systems or available anecdotal information.
Point estimates of hatchery impact for each stock were based on the midpoint between a range of values reflecting uncertainties in the magnitude of fitness-related and ecological effects (Figure 22).
Figure 22. Functional relationships between relative hatchery impacts on natural production and
proportion hatchery spawners based on a range of assumptions.
0%
10%
20%
30%
40%
50%
60%
70%
80%
90%
100%
0% 10% 20% 30% 40% 50% 60% 70% 80% 90% 100%
Rela
tive
hatc
hery
impa
ct
proportion hatchery origin spawners (pHOS)
High
Midpoint
Low
pHOS reference
MAFAC CBP Task Force Phase II Report Final 8/29/20
Page 57 of 87
Low range values for hatchery impacts were based on the product of an assumed 10% RRS effect and pHOS for the stock [e.g., 0.1 x pHOS). These values reflect a RRS for hatchery fish that might be expected in a fully-integrated program as identified in Table 12 and are also consistent with results of the Idaho Supplementation Study and Courter et al.'s (2019) hatchery elimination response (Venditti et al. 2015; ISRP 2016). Low range values primarily reflect fitness effects but might also underestimate the influence of ecological effects.
High range values were based on RRS derived from the relationship between pHOS and productivity in Chilcote et al. (2011) as depicted in Figure 21 above. Chilcote et al.'s (2011) model can be formulated:
P = P0 e(-2 pHOS)
where P = productivity in the presence of hatchery effects (recruits per spawner) P0 = intrinsic productivity e = mathematical constant
thus, hatchery impact (Ihat) = [1 - P / P0] or [1- e(-2 pHOS)]
High range estimates are typically substantially greater than pHOS (Figure 22). High range values reflect both fitness and some level of fish health or ecological impact but might also be inflated by choice of spawning location by hatchery fish due to their release location and size/age at release.
These impact estimates generally assume that equilibrium conditions have been reached for the hatchery fraction in the wild and for relative fitness of hatchery and wild fish. This simplifying assumption was necessary because more detailed information is lacking on how far the current situation is from equilibrium. In practice, actual differences in fitness of hatchery and natural fish at any given time depend on inherent differences in fitness and the degree and period of interaction (Lynch and O’Hely 2001). The index may thus over or underestimate the true current impact of hatchery spawners on wild fitness depending on past history. Current numbers of hatchery releases in each basin are also summarized to place associated risks in perspective.
Stock-Specific Estimates Significant numbers of hatchery-origin spawners in natural production areas create a potential for significant negative impacts of most Columbia basin salmon and steelhead stocks (Figure 23, Table 13). Wide ranges around point estimates reflect uncertainties regarding the potential magnitude of hatchery effects. As previously discussed, hatchery numbers reflect only the potential negative effects on natural production. Impacts might be partially or entirely offset under some circumstances by demographic benefits which are proportional to the percentage of hatchery origin spawners.
Point estimates for most stocks are typically 30% or less although high range values are typically double point estimates. The highest values are associated with stocks where hatchery programs are being used in conservation or reintroduction programs to address severe declines. These include Snake River Bright Fall Chinook (CHF SRB), upriver coho (COH Upr), and Snake River
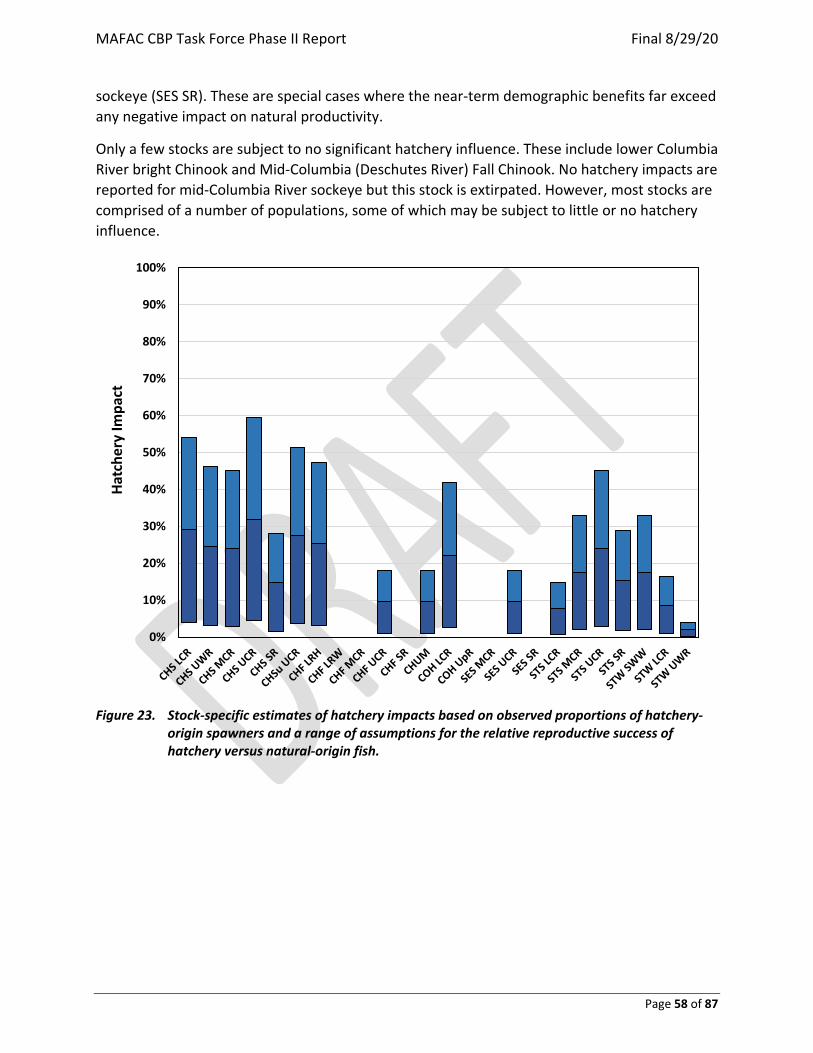
MAFAC CBP Task Force Phase II Report Final 8/29/20
Page 58 of 87
sockeye (SES SR). These are special cases where the near-term demographic benefits far exceed any negative impact on natural productivity.
Only a few stocks are subject to no significant hatchery influence. These include lower Columbia River bright Chinook and Mid-Columbia (Deschutes River) Fall Chinook. No hatchery impacts are reported for mid-Columbia River sockeye but this stock is extirpated. However, most stocks are comprised of a number of populations, some of which may be subject to little or no hatchery influence.
Figure 23. Stock-specific estimates of hatchery impacts based on observed proportions of hatchery-
origin spawners and a range of assumptions for the relative reproductive success of hatchery versus natural-origin fish.
0%
10%
20%
30%
40%
50%
60%
70%
80%
90%
100%
Hatc
hery
Impa
ct
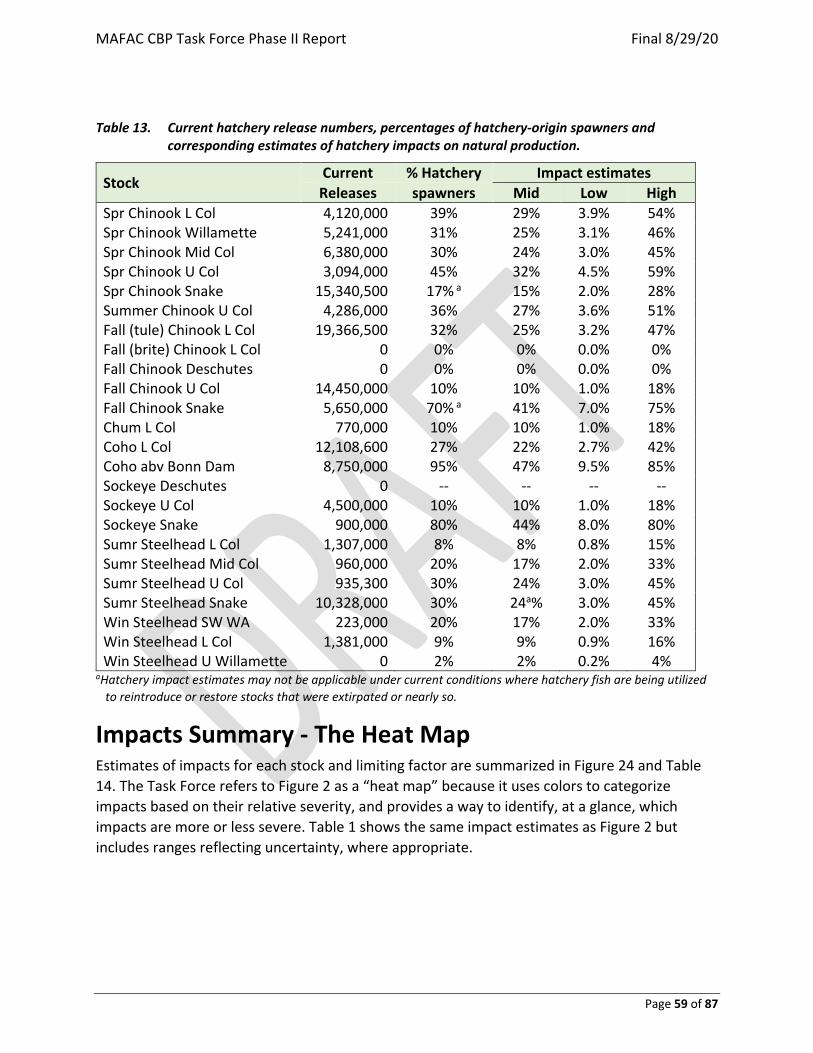
MAFAC CBP Task Force Phase II Report Final 8/29/20
Page 59 of 87
Table 13. Current hatchery release numbers, percentages of hatchery-origin spawners and corresponding estimates of hatchery impacts on natural production.
Stock Current % Hatchery Impact estimates Releases spawners Mid Low High
Spr Chinook L Col 4,120,000 39% 29% 3.9% 54% Spr Chinook Willamette 5,241,000 31% 25% 3.1% 46% Spr Chinook Mid Col 6,380,000 30% 24% 3.0% 45% Spr Chinook U Col 3,094,000 45% 32% 4.5% 59% Spr Chinook Snake 15,340,500 17% a 15% 2.0% 28% Summer Chinook U Col 4,286,000 36% 27% 3.6% 51% Fall (tule) Chinook L Col 19,366,500 32% 25% 3.2% 47% Fall (brite) Chinook L Col 0 0% 0% 0.0% 0% Fall Chinook Deschutes 0 0% 0% 0.0% 0% Fall Chinook U Col 14,450,000 10% 10% 1.0% 18% Fall Chinook Snake 5,650,000 70% a 41% 7.0% 75% Chum L Col 770,000 10% 10% 1.0% 18% Coho L Col 12,108,600 27% 22% 2.7% 42% Coho abv Bonn Dam 8,750,000 95% 47% 9.5% 85% Sockeye Deschutes 0 -- -- -- -- Sockeye U Col 4,500,000 10% 10% 1.0% 18% Sockeye Snake 900,000 80% 44% 8.0% 80% Sumr Steelhead L Col 1,307,000 8% 8% 0.8% 15% Sumr Steelhead Mid Col 960,000 20% 17% 2.0% 33% Sumr Steelhead U Col 935,300 30% 24% 3.0% 45% Sumr Steelhead Snake 10,328,000 30% 24a% 3.0% 45% Win Steelhead SW WA 223,000 20% 17% 2.0% 33% Win Steelhead L Col 1,381,000 9% 9% 0.9% 16% Win Steelhead U Willamette 0 2% 2% 0.2% 4%
aHatchery impact estimates may not be applicable under current conditions where hatchery fish are being utilized to reintroduce or restore stocks that were extirpated or nearly so.
Impacts Summary - The Heat Map Estimates of impacts for each stock and limiting factor are summarized in Figure 24 and Table 14. The Task Force refers to Figure 2 as a “heat map” because it uses colors to categorize impacts based on their relative severity, and provides a way to identify, at a glance, which impacts are more or less severe. Table 1 shows the same impact estimates as Figure 2 but includes ranges reflecting uncertainty, where appropriate.
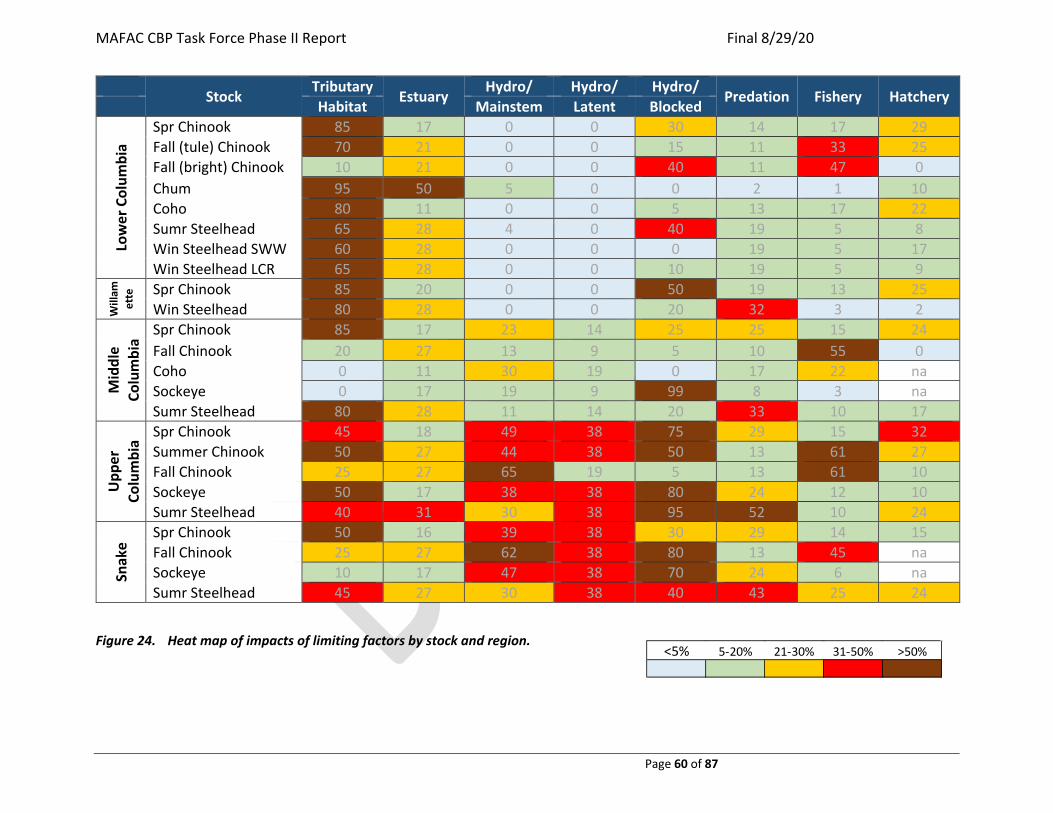
MAFAC CBP Task Force Phase II Report Final 8/29/20
Page 60 of 87
Stock
Tributary Estuary
Hydro/ Hydro/ Hydro/ Predation Fishery Hatchery Habitat Mainstem Latent Blocked
Low
er C
olum
bia
Spr Chinook 85 17 0 0 30 14 17 29 Fall (tule) Chinook 70 21 0 0 15 11 33 25 Fall (bright) Chinook 10 21 0 0 40 11 47 0 Chum 95 50 5 0 0 2 1 10 Coho 80 11 0 0 5 13 17 22 Sumr Steelhead 65 28 4 0 40 19 5 8 Win Steelhead SWW 60 28 0 0 0 19 5 17 Win Steelhead LCR 65 28 0 0 10 19 5 9
Will
amet
te Spr Chinook 85 20 0 0 50 19 13 25
Win Steelhead 80 28 0 0 20 32 3 2
Mid
dle
Colu
mbi
a
Spr Chinook 85 17 23 14 25 25 15 24 Fall Chinook 20 27 13 9 5 10 55 0 Coho 0 11 30 19 0 17 22 na Sockeye 0 17 19 9 99 8 3 na Sumr Steelhead 80 28 11 14 20 33 10 17
Upp
er
Colu
mbi
a
Spr Chinook 45 18 49 38 75 29 15 32 Summer Chinook 50 27 44 38 50 13 61 27 Fall Chinook 25 27 65 19 5 13 61 10 Sockeye 50 17 38 38 80 24 12 10 Sumr Steelhead 40 31 30 38 95 52 10 24
Snak
e
Spr Chinook 50 16 39 38 30 29 14 15 Fall Chinook 25 27 62 38 80 13 45 na Sockeye 10 17 47 38 70 24 6 na Sumr Steelhead 45 27 30 38 40 43 25 24
Figure 24. Heat map of impacts of limiting factors by stock and region. <5% 5-20% 21-30% 31-50% >50%

MAFAC CBP Task Force Phase II Report Final 8/29/20
Page 61 of 87
Table 14. Estimates of impacts for limiting factors by stock and region including ranges reflecting uncertainties, where appropriate. Units
are percentage reductions in equilibrium abundance (generally equivalent to mortality rates).
Stock Habitat Estuary Mainstem Latent Blocked Predation Fishery Hatchery LC
R
Spr Chinook 85 17 0 0 (0-0) 30 14 17 29 (4-54) Fall (tule) Chinook 70 21 0 0 (0-0) 15 11 33 25 (3-47) Fall (brite) Chinook 10 21 0 0 (0-0) 40 11 47 0 (0-0) Chum 95 50 5 0 (0-0) 0 2 1 10 (1-18) Coho 80 11 0 0 (0-0) 5 13 17 22 (3-42) Sumr Steelhead 65 28 4 0 (0-0) 40 19 5 8 (1-15) Win Steelhead SWW 60 28 0 0 (0-0) 0 19 5 17 (2-33) Win Steelhead LCR 65 28 0 0 (0-0) 10 19 5 9 (1-16)
Will
Spr Chinook 85 20 0 0 (0-0) 50 19 13 25 (3-46) Win Steelhead 80 28 0 0 (0-0) 20 32 3 2 (0-4)
MCR
Spr Chinook 85 17 23 14 (3-25) 25 25 15 24 (3-45) Fall Chinook 20 27 13 9 (2-17) 5 10 55 0 (0-0) Coho NA 11 30 19 (5-33) 0 17 22 NAa Sockeye 0 17 19 9 (2-17) 95 8 3 NAa Sumr Steelhead 80 28 11 14 (3-25) 20 33 10 17 (2-33)
UCR
Spr Chinook 45 18 49 38 (9-67) 75 29 15 32 (5-59) Summer Chinook 50 27 49 38 (9-67) 50 13 61 27 (4-51) Fall Chinook 25 27 65 19 (5-33) 5 13 61 10 (1-18) Sockeye 50 17 38 38 (9-67) 80 24 12 10 (1-18) Sumr Steelhead 40 31 30 38 (9-67) 95 52 10 24 (3-45)
Snak
e
Spr Chinook 50 16 39 38 (9-67) 30 29 14 15 (2-28) Fall Chinook 25 27 62 38 (9-67) 80 13 45 NAa Sockeye 10 17 47 38 (9-67) 70 24 6 NAa Sumr Steelhead 45 27 30 38 (9-67) 40 43 25 24 (3-45)
a Hatchery impact estimates may not be applicable under current conditions where hatchery fish are being utilized to reintroduce or restore stocks that were extirpated or nearly so.
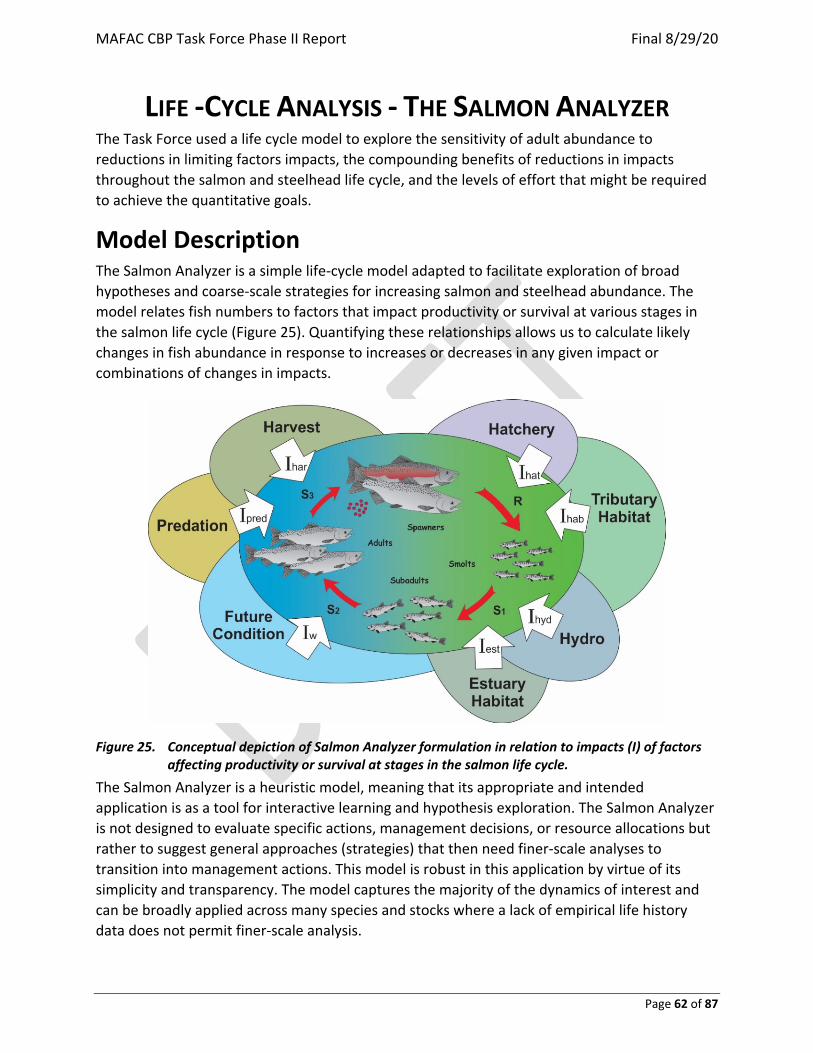
MAFAC CBP Task Force Phase II Report Final 8/29/20
Page 62 of 87
LIFE -CYCLE ANALYSIS - THE SALMON ANALYZER The Task Force used a life cycle model to explore the sensitivity of adult abundance to reductions in limiting factors impacts, the compounding benefits of reductions in impacts throughout the salmon and steelhead life cycle, and the levels of effort that might be required to achieve the quantitative goals.
Model Description The Salmon Analyzer is a simple life-cycle model adapted to facilitate exploration of broad hypotheses and coarse-scale strategies for increasing salmon and steelhead abundance. The model relates fish numbers to factors that impact productivity or survival at various stages in the salmon life cycle (Figure 25). Quantifying these relationships allows us to calculate likely changes in fish abundance in response to increases or decreases in any given impact or combinations of changes in impacts.
Figure 25. Conceptual depiction of Salmon Analyzer formulation in relation to impacts (I) of factors affecting productivity or survival at stages in the salmon life cycle.
The Salmon Analyzer is a heuristic model, meaning that its appropriate and intended application is as a tool for interactive learning and hypothesis exploration. The Salmon Analyzer is not designed to evaluate specific actions, management decisions, or resource allocations but rather to suggest general approaches (strategies) that then need finer-scale analyses to transition into management actions. This model is robust in this application by virtue of its simplicity and transparency. The model captures the majority of the dynamics of interest and can be broadly applied across many species and stocks where a lack of empirical life history data does not permit finer-scale analysis.
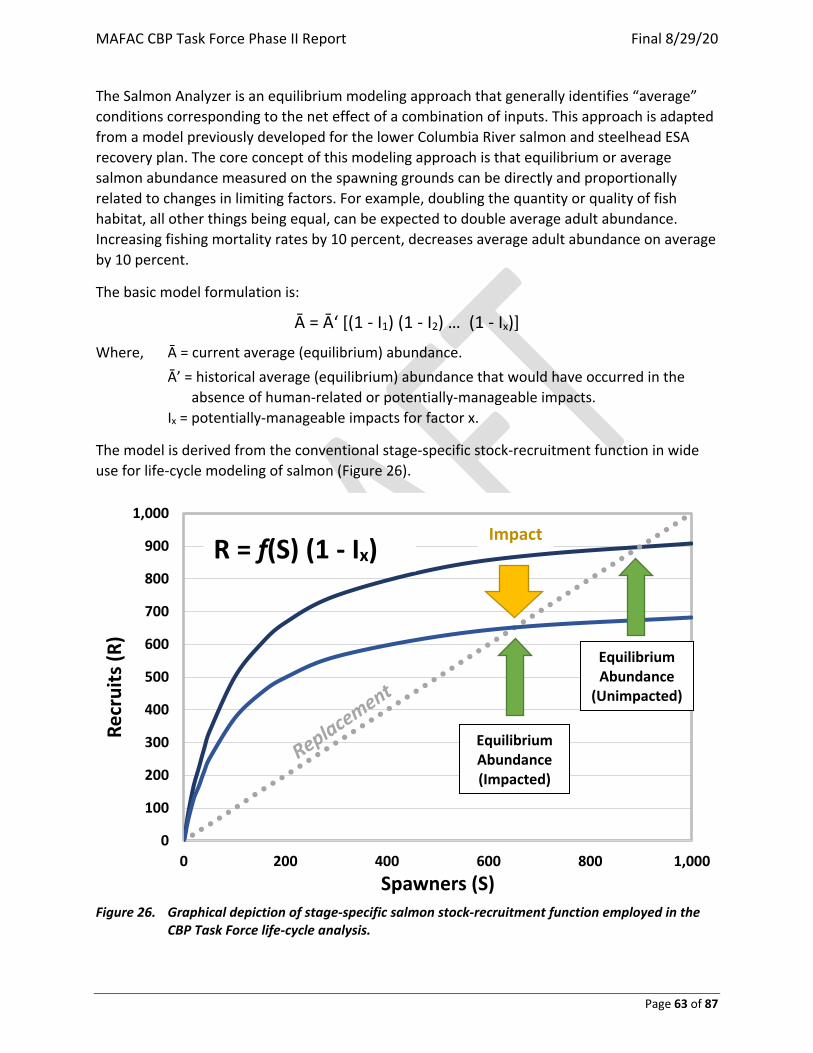
MAFAC CBP Task Force Phase II Report Final 8/29/20
Page 63 of 87
The Salmon Analyzer is an equilibrium modeling approach that generally identifies “average” conditions corresponding to the net effect of a combination of inputs. This approach is adapted from a model previously developed for the lower Columbia River salmon and steelhead ESA recovery plan. The core concept of this modeling approach is that equilibrium or average salmon abundance measured on the spawning grounds can be directly and proportionally related to changes in limiting factors. For example, doubling the quantity or quality of fish habitat, all other things being equal, can be expected to double average adult abundance. Increasing fishing mortality rates by 10 percent, decreases average adult abundance on average by 10 percent.
The basic model formulation is:
Ā = Ā‘ [(1 - I1) (1 - I2) … (1 - Ix)]
Where, Ā = current average (equilibrium) abundance. Ā’ = historical average (equilibrium) abundance that would have occurred in the
absence of human-related or potentially-manageable impacts. Ix = potentially-manageable impacts for factor x.
The model is derived from the conventional stage-specific stock-recruitment function in wide use for life-cycle modeling of salmon (Figure 26).
Figure 26. Graphical depiction of stage-specific salmon stock-recruitment function employed in the
CBP Task Force life-cycle analysis.
0
100
200
300
400
500
600
700
800
900
1,000
0 200 400 600 800 1,000
Recr
uits
(R)
Spawners (S)
Equilibrium Abundance
(Unimpacted)
Equilibrium Abundance (Impacted)
Impact R = f(S) (1 - Ix)

MAFAC CBP Task Force Phase II Report Final 8/29/20
Page 64 of 87
Model Derivation Population dynamics of salmon are typically described by a stock-recruitment function) where the number of recruits in any generation is density-dependent function of parents that produced them:
Rg = f (Pg-1) eqn 1 where Rg = Adult recruits in generation g Pg-1 = Adult parents in generation g-1
This relationship can also be written in terms of a series of life-stage specific survivals:
Og = f (Pg-1) eqn 2 Rg = Og S1 S2 … Sx eqn 314
where Og = Offspring of parents in generation g-1 Sx = Survival rate for life stage x
Under equilibrium conditions, recruitment can be redefined as average abundance (Ā) at replacement spawning levels which produce an average of Ō offspring:
Ā = Ō S1 S2 … Sx eqn 4 Stage-specific survival rates are inversely related to stage-specific mortality rates (Mx):
Sx = 1 - Mx eqn 5 Stage-specific survival rates may be further partitioned between natural mortality (Nx) and human-related impacts (Ix). Natural and human-related survivals can be expressed unconditionally for salmon and steelhead where density dependence largely occurs in the freshwater rearing stage of the life cycle and survival rates of subsequent stages are largely independent of cohort size:
Sx = (1 - Nx) (1 - Ix) eqn 6 Thus,
Ā = Ō [(1 - N1) (1 - I1)] [(1 - N2) (1 - I2)] … [(1 - Nx) (1 - Ix)] eqn 7 or
Ā = Ō [(1 - N1) (1 - N2) … (1 - Nx)] [(1 - I1) (1 - I2) … (1 - Ix)] eqn 8 Here we define Ā’ as the recruitment that would have occurred in the absence of human-related impacts:
Ā’ = Ō [(1 - N1) (1 - N2) … (1 - Nx)] eqn 9 Substituting eqn 9 in eqn 8 yields:
14 Note here that this formulation assumes that Ō is independent of out-of-basin survival. This critical assumption is relatively robust but may not be perfectly true under certain circumstances.

MAFAC CBP Task Force Phase II Report Final 8/29/20
Page 65 of 87
Ā = Ā‘ [(1 - I1) (1 - I2) … (1 - Ix)] eqn 10 Note that this function can also be written in the form of a conventional stock-recruitment relationship:
Rg = f (Pg-1) [(1 - I1) (1 - I2) … (1 - Ix)] eqn 11 Ultimately, the ratio between realized recruitment and recruitment in the absence of human-related impacts (mortalities) can be estimated as the product of the respect impacts expressed as a survival equivalent.
Ā / Ā‘ = [(1 - I1) (1 - I2) … (1 - Ix)] eqn 12 And the potential recruitment in the absence of human-related impacts can be inferred from the realized (current) recruitment by:
Ā‘ = Ā / [(1 - I1) (1 - I2) … (1 - Ix)] eqn 13 Similarly, changes in abundance levels (Ā’’) corresponding to due to changes in impact levels (I’) (associated with improvement actions for instance) can be calculated as the ratio of the respect impacts expressed as survival equivalents.
Ā’’ = Ā [Π(1 - Ix’) / Π(1 - Ix)] eqn 14
where Ā’’ = average or equilibrium abundance realized following changes in human-related factor impacts Ā = average or equilibrium abundance under baseline levels of human-related factor impacts Ix = Proportional reduction in stage-specific survival rate associated with a specific human-related factor. Equivalent to a mortality rate. May also be interpreted as a proportional reduction in potential production or survival in the case of a baseline condition such as capacity of salmon spawning and rearing habitats.
We can also calculate the net reduction in salmon numbers associated with the combined effect of all density-independent factors (Z) as:
Z = 1 - [(1 - I1) (1 - I2) … (1 - Ix)] eqn 15a or
Z = 1 - Π(1 - Ix) eqn 15b

MAFAC CBP Task Force Phase II Report Final 8/29/20
Page 66 of 87
Inputs, Outputs and Function Analysis inputs include:
1. Estimates of current average abundance of natural origin spawners for 24 Columbia Basin salmon and steelhead stocks
2. Current impact estimates of potentially-manageable factors. These are the same impacts described above for the limiting factors analysis (tributary habitat, estuary habitat, mainstem, latent, blocked areas, predation, fishery, hatchery, assumed future conditions).
3. Changes in impacts of potentially manageable factors (user option). 4. Columbia Basin Partnership low, medium and high range goals for natural-origin
spawners of a stock, which are input for reference purposes. 5. Percentage of hatchery-origin spawners, which is also input for reference purposes so
that the analysis can calculate both natural-origin and hatchery-origin abundance. Contributions of supplementation and reintroduction hatchery programs are reflected in the change in total number of spawners on the spawning grounds.
Analysis outputs include: 1. Equilibrium abundance of natural-origin spawners produced by changes in impacts of
potentially-manageable factors. 2. Number of hatchery-origin spawners and percentage of total spawners comprised of
hatchery-origin spawners (pHOS) resulting from changes in impacts of potentially-manageable factors.15
The model is operated through an interface designed to facilitate analysis. The Salmon Analyzer is constructed in MS Excel with macros constructed in Visual Basic to automate certain applications. Users may increase or decrease impacts relative to current reference values to examine incremental and aggregate effects on abundance. Elements of the user interface are numbered in Figure 27 to match descriptions in the list below.
1. Stocks may be selected from a drop-down list of 24 stocks as defined for CBP Task Force purposes. A stock is defined as a unique combination of species, life history type, and region, and includes both listed and unlisted species. In many cases a stock corresponds to an ESU, but ESUs that include more than one life history type were split into several stocks.
2. Projected abundance under a scenario is shown in both graphical and tabular form relative to the low, medium-, and high-range quantitative goals identified by the CBP Task Force.
15 Percentages of hatchery-origin spawners decrease in response to reductions in tributary habitat impacts which increase numbers of naturally-produced fish. Reductions in hatchery impacts reduce both numbers and percentage of hatchery-origin adults
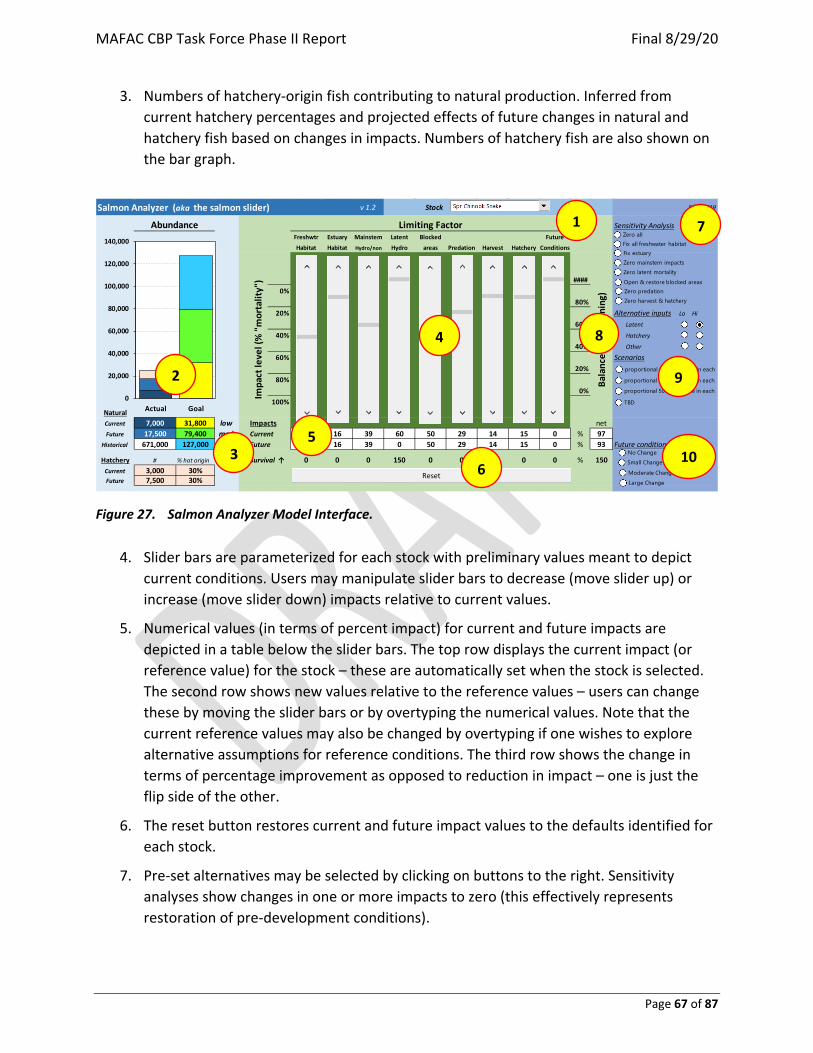
MAFAC CBP Task Force Phase II Report Final 8/29/20
Page 67 of 87
3. Numbers of hatchery-origin fish contributing to natural production. Inferred from current hatchery percentages and projected effects of future changes in natural and hatchery fish based on changes in impacts. Numbers of hatchery fish are also shown on the bar graph.
Figure 27. Salmon Analyzer Model Interface.
4. Slider bars are parameterized for each stock with preliminary values meant to depict current conditions. Users may manipulate slider bars to decrease (move slider up) or increase (move slider down) impacts relative to current values.
5. Numerical values (in terms of percent impact) for current and future impacts are depicted in a table below the slider bars. The top row displays the current impact (or reference value) for the stock – these are automatically set when the stock is selected. The second row shows new values relative to the reference values – users can change these by moving the slider bars or by overtyping the numerical values. Note that the current reference values may also be changed by overtyping if one wishes to explore alternative assumptions for reference conditions. The third row shows the change in terms of percentage improvement as opposed to reduction in impact – one is just the flip side of the other.
6. The reset button restores current and future impact values to the defaults identified for each stock.
7. Pre-set alternatives may be selected by clicking on buttons to the right. Sensitivity analyses show changes in one or more impacts to zero (this effectively represents restoration of pre-development conditions).
Salmon Analyzer (aka the salmon slider) v 1.2 Stock 9/14/2019
Abundance Limiting Factor Sensitivity AnalysisFreshwtr Estuary Mainstem Latent Blocked Future
Habitat Habitat Hydro/non Hydro areas Predation Harvest Hatchery Conditions
####0%
80%20% Alternative inputs Lo Hi
60% Latent
40% Hatchery
40% Other
60% Scenarios20%
80%0%
100%NaturalCurrent 7,000 31,800 low Impacts netFuture 17,500 79,400 med Current 49 16 39 60 50 29 14 15 0 % 97
Historical 671,000 127,000 high Future 49 16 39 0 50 29 14 15 0 % 93 Future conditions
Hatchery # % hat origin Survival ↑ 0 0 0 150 0 0 0 0 0 % 150Current 3,000 30%Future 7,500 30%
Impa
ct le
vel (
% "
mor
talit
y")
Bala
nce
(% re
mai
ning
)
0
20,000
40,000
60,000
80,000
100,000
120,000
140,000
Actual Goal
Reset
Zero all
Zero predation
Fix all freshwater habitatFix estuaryZero mainstem impactsZero latent mortalityOpen & restore blocked areas
Zero harvest & hatchery
No ChangeSmall Change
Moderate ChangeLarge Change
proportional 10% decrease in each
proportional 30% decrease in each
proportional 50% decrease in each
TBD
2
1
3
4
5
6
7
8
9
10
MAFAC CBP Task Force Phase II Report Final 8/29/20
Page 68 of 87
8. “Alternative Inputs” allows the user to select inputs for current impacts corresponding to low and high confidence values that reflect uncertainties in certain impact estimates.
9. “Scenarios” are various combinations of changes in impact values.
10. “Future conditions” automates an aggregate level of potential impact due to climate, future population growth or other long-term threats. Corresponding low, medium, and high values are identified for sensitivity analysis purposes.
Assumptions and Limitations All life-cycle models are necessarily abstractions of complex natural systems. The Salmon Analyzer employs a number of simplifying assumptions to provide broad and consistent applicability to all salmon and steelhead stocks throughout the region. Corresponding qualifications are as follows.
The analysis provides average results for an aggregate stock that may consist of multiple populations. Results provide a coarse-scale picture of the relative limitations and response of a stock. Population-specific analyses could also be conducted with the model using population-specific inputs for abundance and impacts.
The analysis assumes that impacts act independently at various stages of the life cycle and that impact rates are largely independent of each other. This assumption is generally robust because density-dependent processes are typically concentrated in the freshwater rearing stage of the salmon life cycle. If out-of-subbasin impacts are strongly density-dependent, the model would underestimate the net benefits of interacting factors. Some level of density-dependent interaction likely occurs but strong compensation has been documented primarily in freshwater spawning and rearing areas (ISAB 2015). However, we lack information for quantifying density dependent interactions outside of freshwater spawning and rearing areas. Few studies have tested for density dependence in the Columbia River estuary, and the evidence is too scant to draw conclusions (ISAB 2015). Very few studies have yet considered how the aggregate density of salmon from the Columbia River might affect their growth and survival during the ocean stage (ISAB 2015). The ISAB concludes that the lack of information about density dependence of Columbia River salmonids during their time in the ocean is a critical gap that hinders an understanding of factors affecting growth and survival of the Basin’s anadromous salmon. Predation mortality may be either depensatory or compensatory depending on circumstances (Beamesderfer et al. 1990; ISAB 2015). Density-independent mortality is suggested by a significant linear relationship between annual numbers of spring Chinook and Steelhead migrating from the Columbia River and number of adults recruited (Beamesderfer et al. 1996 based on data in Raymond 1988). Payton et. al (2020) also found that increases in bird predation in the estuary translated into reductions in steelhead returns.
The analysis is based generally on impacts and interactions that can be reasonably quantified or assumed. Quantitative information is lacking for a variety of limiting factors. For instance, toxic contaminants are known to affect fish survival but information to quantify the impact are lacking. Similarly, marine-derived nutrients from anadromous salmon may improve habitat productivity (Kohler et al. 2013; Scheuerell et al. 2005). Thus, interpretations of analytical
MAFAC CBP Task Force Phase II Report Final 8/29/20
Page 69 of 87
results must recognize that our knowledge base is not perfect, and critical uncertainties exist. However, the salmon analyzer also allows for exploration of the implications of alternative assumptions at a user's discretion.
The analysis explores the effect on abundance of changes in impacts but does not explicitly incorporate the feasibility and cost of any given impact reduction. For instance, while some impacts (e.g., harvest) could theoretically be reduced to zero, others (e.g., habitat) could not, since that would imply that the impact was re-set to pre-development conditions. It is left to the use to assess the feasibility of any given level of impact reduction.
The analysis does not explicitly incorporate estimates of parameter uncertainty such that statistical confidence intervals are quantified directly. Where impacts are particularly uncertain, estimates are presented as ranges in the limiting factors analysis. The primary application of the analysis is as a hypothesis testing or learning tool. The model can be used to examine the sensitivity of results to alternative inputs that reflect a range of uncertainty. Where concerns or disagreements on inputs exist, the modeling framework encourages users to articulate alternative assumptions, and it allows for exploration of the related implications in a systematic fashion.
The analysis does not explicitly incorporate a time component. In actuality, the time schedule of benefits can vary substantially from factor to factor. For instance, reductions in fishing rates can produce immediate benefits to numbers of fish surviving to reach the spawning grounds. However, some habitat improvements, particularly process-based improvements, can take many fish generations to realize a benefit. For instance, it might take decades for a seedling planted in a stream riparian zone to mature and then die to fall in a stream to provide a habitat benefit.
The Analyzer is intended to complement, but not substitute for, the wide array of analyses and models currently employed for salmon assessments throughout the region. The Salmon Analyzer is broadly applicable to all species and stocks in the basin and does not require estimates of or assumptions about a large number of uncertain input parameters for specific life stages and impact mechanisms that would be required in finer-scale analyses (e.g., fecundity, sex ratio, egg-to-parr survival, parr -to -smolt survival, natural components of mortality, etc.). The tradeoff for this general applicability is that the model does not provide for mechanistic assessments of the effects of specific conditions (e.g., water temperature) or actions (e.g., hydropower configuration). More-detailed, finer-scaled models have been developed for specific factors and selected species and populations, but existing data are not adequate to develop detailed models for all stocks or all factors. Depending on the type of questions or management decisions being evaluated, it is recommended that results from the Salmon Analyzer be further validated with additional finer-scale analysis.
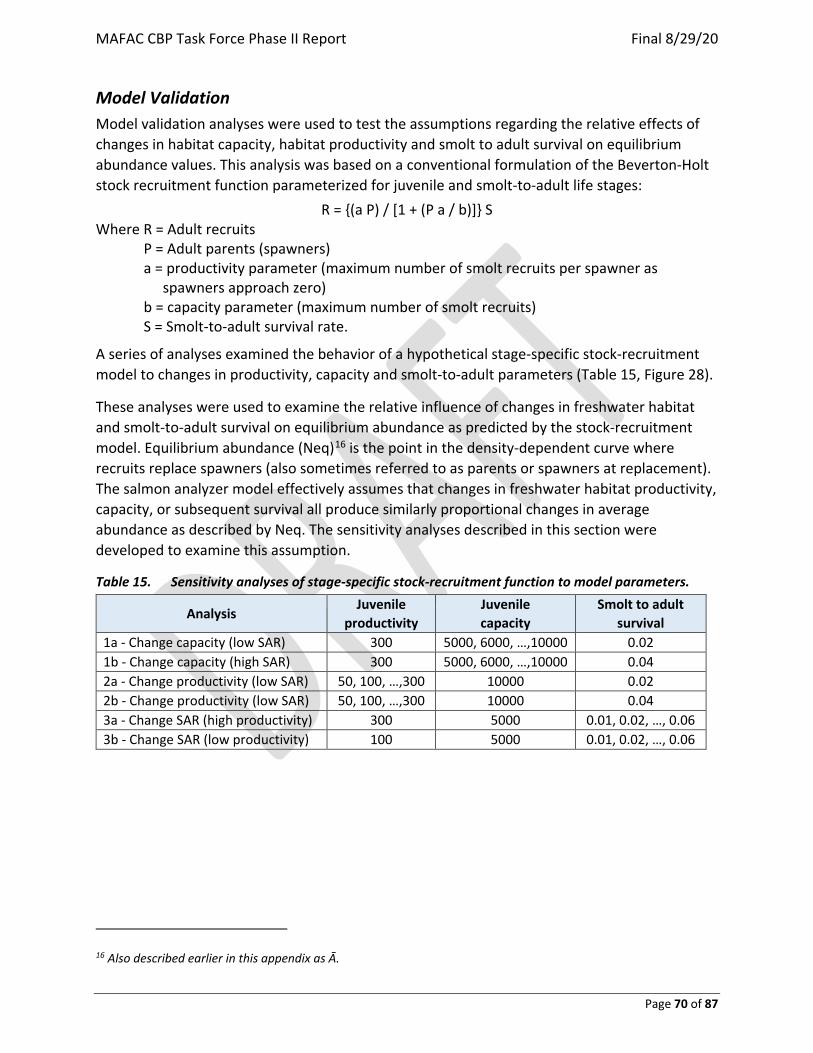
MAFAC CBP Task Force Phase II Report Final 8/29/20
Page 70 of 87
Model Validation Model validation analyses were used to test the assumptions regarding the relative effects of changes in habitat capacity, habitat productivity and smolt to adult survival on equilibrium abundance values. This analysis was based on a conventional formulation of the Beverton-Holt stock recruitment function parameterized for juvenile and smolt-to-adult life stages:
R = {(a P) / [1 + (P a / b)]} S Where R = Adult recruits P = Adult parents (spawners)
a = productivity parameter (maximum number of smolt recruits per spawner as spawners approach zero)
b = capacity parameter (maximum number of smolt recruits) S = Smolt-to-adult survival rate.
A series of analyses examined the behavior of a hypothetical stage-specific stock-recruitment model to changes in productivity, capacity and smolt-to-adult parameters (Table 15, Figure 28).
These analyses were used to examine the relative influence of changes in freshwater habitat and smolt-to-adult survival on equilibrium abundance as predicted by the stock-recruitment model. Equilibrium abundance (Neq)16 is the point in the density-dependent curve where recruits replace spawners (also sometimes referred to as parents or spawners at replacement). The salmon analyzer model effectively assumes that changes in freshwater habitat productivity, capacity, or subsequent survival all produce similarly proportional changes in average abundance as described by Neq. The sensitivity analyses described in this section were developed to examine this assumption.
Table 15. Sensitivity analyses of stage-specific stock-recruitment function to model parameters.
Analysis Juvenile
productivity Juvenile capacity
Smolt to adult survival
1a - Change capacity (low SAR) 300 5000, 6000, …,10000 0.02 1b - Change capacity (high SAR) 300 5000, 6000, …,10000 0.04 2a - Change productivity (low SAR) 50, 100, …,300 10000 0.02 2b - Change productivity (low SAR) 50, 100, …,300 10000 0.04 3a - Change SAR (high productivity) 300 5000 0.01, 0.02, …, 0.06 3b - Change SAR (low productivity) 100 5000 0.01, 0.02, …, 0.06
16 Also described earlier in this appendix as Ā.
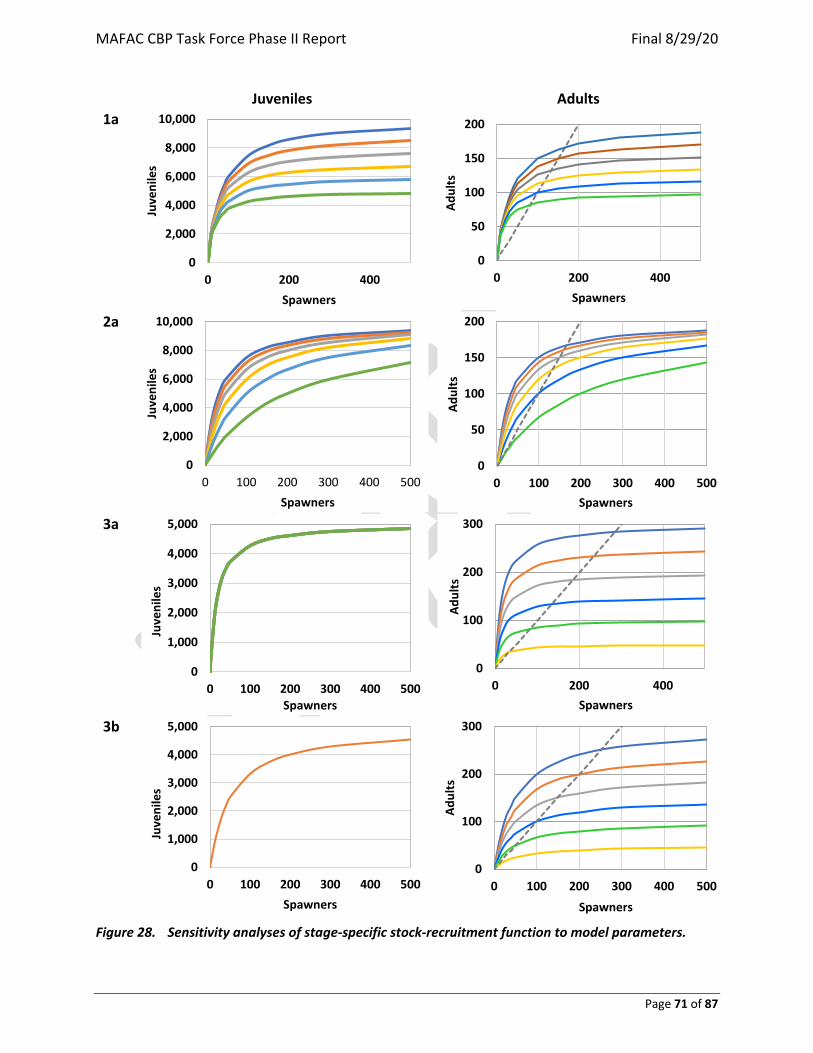
MAFAC CBP Task Force Phase II Report Final 8/29/20
Page 71 of 87
Juveniles Adults 1a
2a
3a
3b
Figure 28. Sensitivity analyses of stage-specific stock-recruitment function to model parameters.
0
2,000
4,000
6,000
8,000
10,000
0 200 400
Juve
nile
s
Spawners
0
50
100
150
200
0 200 400
Adul
ts
Spawners
0
2,000
4,000
6,000
8,000
10,000
0 100 200 300 400 500
Juve
nile
s
Spawners
0
50
100
150
200
0 100 200 300 400 500
Adul
ts
Spawners
0
1,000
2,000
3,000
4,000
5,000
0 100 200 300 400 500
Juve
nile
s
Spawners
0
100
200
300
0 200 400
Adul
ts
Spawners
0
1,000
2,000
3,000
4,000
5,000
0 100 200 300 400 500
Juve
nile
s
Spawners
0
100
200
300
0 100 200 300 400 500
Adul
ts
Spawners
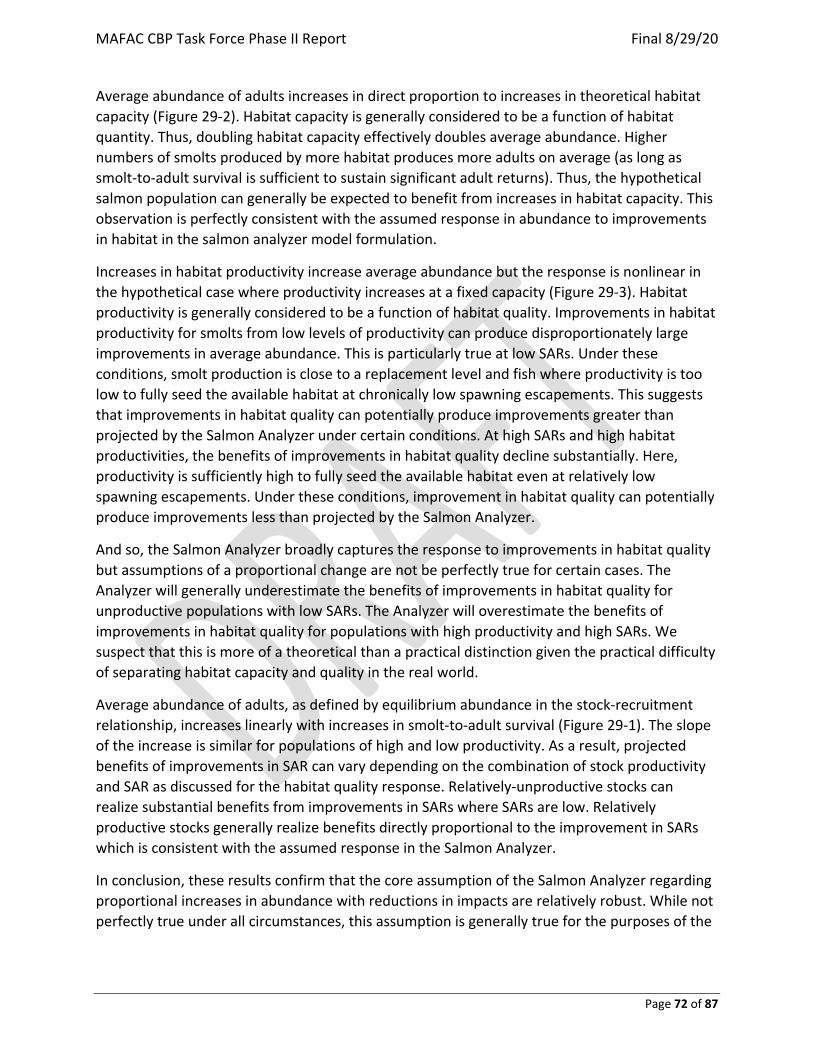
MAFAC CBP Task Force Phase II Report Final 8/29/20
Page 72 of 87
Average abundance of adults increases in direct proportion to increases in theoretical habitat capacity (Figure 29-2). Habitat capacity is generally considered to be a function of habitat quantity. Thus, doubling habitat capacity effectively doubles average abundance. Higher numbers of smolts produced by more habitat produces more adults on average (as long as smolt-to-adult survival is sufficient to sustain significant adult returns). Thus, the hypothetical salmon population can generally be expected to benefit from increases in habitat capacity. This observation is perfectly consistent with the assumed response in abundance to improvements in habitat in the salmon analyzer model formulation.
Increases in habitat productivity increase average abundance but the response is nonlinear in the hypothetical case where productivity increases at a fixed capacity (Figure 29-3). Habitat productivity is generally considered to be a function of habitat quality. Improvements in habitat productivity for smolts from low levels of productivity can produce disproportionately large improvements in average abundance. This is particularly true at low SARs. Under these conditions, smolt production is close to a replacement level and fish where productivity is too low to fully seed the available habitat at chronically low spawning escapements. This suggests that improvements in habitat quality can potentially produce improvements greater than projected by the Salmon Analyzer under certain conditions. At high SARs and high habitat productivities, the benefits of improvements in habitat quality decline substantially. Here, productivity is sufficiently high to fully seed the available habitat even at relatively low spawning escapements. Under these conditions, improvement in habitat quality can potentially produce improvements less than projected by the Salmon Analyzer.
And so, the Salmon Analyzer broadly captures the response to improvements in habitat quality but assumptions of a proportional change are not be perfectly true for certain cases. The Analyzer will generally underestimate the benefits of improvements in habitat quality for unproductive populations with low SARs. The Analyzer will overestimate the benefits of improvements in habitat quality for populations with high productivity and high SARs. We suspect that this is more of a theoretical than a practical distinction given the practical difficulty of separating habitat capacity and quality in the real world.
Average abundance of adults, as defined by equilibrium abundance in the stock-recruitment relationship, increases linearly with increases in smolt-to-adult survival (Figure 29-1). The slope of the increase is similar for populations of high and low productivity. As a result, projected benefits of improvements in SAR can vary depending on the combination of stock productivity and SAR as discussed for the habitat quality response. Relatively-unproductive stocks can realize substantial benefits from improvements in SARs where SARs are low. Relatively productive stocks generally realize benefits directly proportional to the improvement in SARs which is consistent with the assumed response in the Salmon Analyzer.
In conclusion, these results confirm that the core assumption of the Salmon Analyzer regarding proportional increases in abundance with reductions in impacts are relatively robust. While not perfectly true under all circumstances, this assumption is generally true for the purposes of the
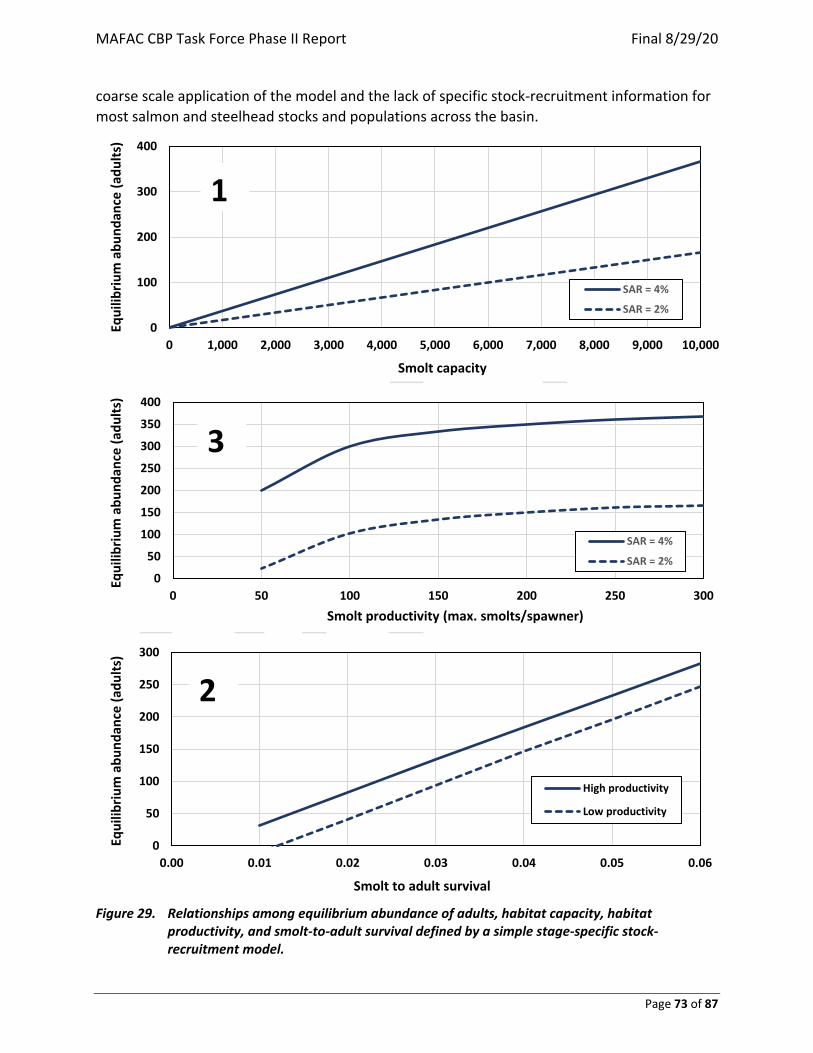
MAFAC CBP Task Force Phase II Report Final 8/29/20
Page 73 of 87
coarse scale application of the model and the lack of specific stock-recruitment information for most salmon and steelhead stocks and populations across the basin.
Figure 29. Relationships among equilibrium abundance of adults, habitat capacity, habitat
productivity, and smolt-to-adult survival defined by a simple stage-specific stock-recruitment model.
0
100
200
300
400
0 1,000 2,000 3,000 4,000 5,000 6,000 7,000 8,000 9,000 10,000
Equi
libriu
m a
bund
ance
(adu
lts)
Smolt capacity
SAR = 4%
SAR = 2%
0
50
100
150
200
250
300
350
400
0 50 100 150 200 250 300
Equi
libriu
m a
bund
ance
(adu
lts)
Smolt productivity (max. smolts/spawner)
SAR = 4%
SAR = 2%
0
50
100
150
200
250
300
0.00 0.01 0.02 0.03 0.04 0.05 0.06
Equi
libriu
m a
bund
ance
(adu
lts)
Smolt to adult survival
High productivity
Low productivity
3
1
2
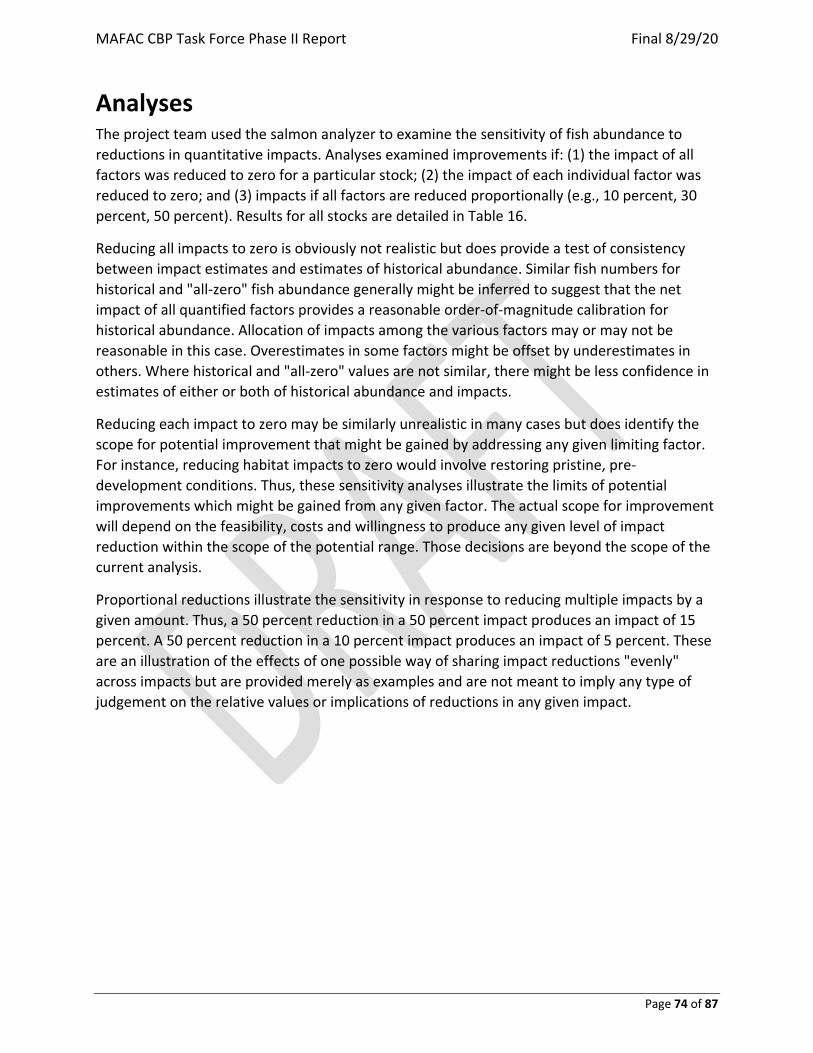
MAFAC CBP Task Force Phase II Report Final 8/29/20
Page 74 of 87
Analyses The project team used the salmon analyzer to examine the sensitivity of fish abundance to reductions in quantitative impacts. Analyses examined improvements if: (1) the impact of all factors was reduced to zero for a particular stock; (2) the impact of each individual factor was reduced to zero; and (3) impacts if all factors are reduced proportionally (e.g., 10 percent, 30 percent, 50 percent). Results for all stocks are detailed in Table 16.
Reducing all impacts to zero is obviously not realistic but does provide a test of consistency between impact estimates and estimates of historical abundance. Similar fish numbers for historical and "all-zero" fish abundance generally might be inferred to suggest that the net impact of all quantified factors provides a reasonable order-of-magnitude calibration for historical abundance. Allocation of impacts among the various factors may or may not be reasonable in this case. Overestimates in some factors might be offset by underestimates in others. Where historical and "all-zero" values are not similar, there might be less confidence in estimates of either or both of historical abundance and impacts.
Reducing each impact to zero may be similarly unrealistic in many cases but does identify the scope for potential improvement that might be gained by addressing any given limiting factor. For instance, reducing habitat impacts to zero would involve restoring pristine, pre-development conditions. Thus, these sensitivity analyses illustrate the limits of potential improvements which might be gained from any given factor. The actual scope for improvement will depend on the feasibility, costs and willingness to produce any given level of impact reduction within the scope of the potential range. Those decisions are beyond the scope of the current analysis.
Proportional reductions illustrate the sensitivity in response to reducing multiple impacts by a given amount. Thus, a 50 percent reduction in a 50 percent impact produces an impact of 15 percent. A 50 percent reduction in a 10 percent impact produces an impact of 5 percent. These are an illustration of the effects of one possible way of sharing impact reductions "evenly" across impacts but are provided merely as examples and are not meant to imply any type of judgement on the relative values or implications of reductions in any given impact.
MAFAC CBP Task Force Phase II Report Final 8/29/20
Page 75 of 87
Table 16. Life-cycle analysis of the sensitivity of salmon and steelhead abundance (thousands) to reductions in human-related or potentially-
manageable impacts.
Stock Hist
oric
al
Curr
ent
Low
go
al
Med
ium
go
al
High
go
al
Zero
All
Zero
Ha
bita
t
Zero
Es
tuar
y
Zero
M
ains
tem
Zero
La
tent
Zero
Bl
ocke
d
Zero
Pr
edat
ion
Zero
Ha
rves
t
Zero
Ha
tche
ry
10%
dec
r in
eac
h
30%
dec
r in
eac
h
50%
dec
r in
eac
h
LCR
Spr Chinook 101.7 2.2 9.8 21.6 33.3 51.5 14.9 2.7 2.2 2.2 8.6 2.6 2.7 3.2 4.6 10.6 18.7 Fall (tule) Chinook 169.7 12.3 28.0 54.1 82.0 136.5 41.1 15.6 12.3 12.3 19.6 13.8 18.3 16.5 17.9 32.7 53.0 Fall (brite) Chinook 33.0 10.8 11.1 16.7 22.2 54.0 12.0 13.7 10.8 10.8 18.8 12.1 20.5 10.8 13.3 19.3 26.8 Chum 461.3 11.8 16.5 33.0 49.5 560.3 235.2 23.5 12.4 12.4 11.8 12.0 11.8 13.0 38.2 108.1 202.5 Coho 301.9 31.5 67.9 129.6 191.4 331.9 157.6 35.6 31.5 31.5 39.8 36.1 38.0 40.5 48.5 89.7 141.9 Sumr Steelhead 61.2 10.6 21.1 29.8 38.1 103.0 30.3 14.8 11.0 10.6 30.8 13.0 11.2 11.5 15.8 28.4 44.5 Win Steelhead SWW 19.1 3.3 4.6 5.8 7.0 17.8 8.1 4.5 3.3 3.3 3.3 4.0 3.4 3.9 4.1 6.1 8.6 Win Steelhead LCR 41.9 6.0 19.0 27.9 36.4 37.6 17.1 8.4 6.0 6.0 7.9 7.4 6.3 6.6 7.9 12.4 17.9
Will
Spr Chinook 312.2 4.3 28.9 47.8 66.8 134.7 28.5 5.3 4.3 4.3 32.8 5.3 4.9 5.7 10.5 26.6 48.3 Win Steelhead 220.0 2.8 16.3 27.8 39.3 38.2 14.1 3.9 2.8 2.8 6.3 4.2 2.9 2.9 4.7 9.4 15.5
MCR
Spr Chinook 246.5 11.6 17.8 40.4 114.5 388.3 77.3 14.0 15.1 13.5 37.4 15.4 13.6 15.3 20.1 60.1 115.7 Fall Chinook 17.0 11.5 4.0 13.0 16.0 64.3 14.4 15.7 13.2 12.7 12.3 12.8 25.4 11.5 14.3 21.2 30.2 Coho 75.0 6.3 5.3 11.6 19.9 na na na na na na na na na na na na Sockeye 230.0 1.0 7.5 45.0 107.5 191.9 1.0 1.3 1.3 1.1 103.6 1.1 1.1 1.0 12.1 38.7 72.1 Sumr Steelhead 132.8 18.2 21.5 43.9 69.2 275.0 60.5 25.0 20.5 21.1 40.1 27.1 20.1 22.0 27.7 54.2 93.6
UCR
Spr Chinook 259.5 1.4 11.5 19.8 30.1 97.3 2.6 1.7 2.8 2.3 9.2 2.0 1.7 2.1 3.1 9.0 20.5 Summer Chinook 734.0 16.9 9.0 78.4 131.3 1,172.0 33.8 23.0 33.0 27.2 50.7 19.3 43.6 23.3 32.2 92.8 218.8 Fall Chinook 680.0 92.4 9.2 62.2 87.8 2,038.6 123.2 125.7 263.1 114.0 99.0 106.4 238.8 102.2 143.5 303.8 571.4 Sockeye 1,800.0 40.8 31.5 580.0 1,235.0 2,103.8 81.7 49.4 65.6 65.7 367.6 53.8 46.3 45.2 94.2 263.7 548.4 Sumr Steelhead 1,121.4 1.5 7.5 31.0 47.0 500.7 2.5 2.2 2.1 2.4 43.3 3.1 1.6 1.9 8.4 35.9 92.8
Snak
e
Spr Chinook 1,000.0 7.0 33.5 98.8 159.5 135.0 13.7 8.3 11.4 11.2 13.4 9.8 8.2 8.2 10.2 20.0 35.8 Fall Chinook 500.0 8.4 4.2 10.8 23.4 1,124.2 11.1 11.4 21.8 13.4 52.9 9.6 15.1 14.2 19.6 68.9 181.3 Sockeye 84.0 0.1 5.5 15.8 26.0 3.4 0.1 0.1 0.2 0.2 0.4 0.1 0.1 0.2 0.2 0.4 0.8 Sumr Steelhead 600.0 28.0 22.5 75.0 131.5 872.8 51.1 38.1 39.7 45.0 62.1 48.8 37.3 36.9 44.2 98.1 195.3
MAFAC CBP Task Force Phase II Report Final 8/29/20
Page 76 of 87
Discussion Life-cycle analyses based on quantitative impacts were intended to inform Task Force considerations of potential opportunities for achieving Quantitative Goals for natural production. Sensitivity analyses were used to examine the potential scope for improvements associated with reductions in impacts of factors that impact Columbia Basin salmon and steelhead.
The analysis highlighted broad differences among salmon and steelhead stocks across the Basin both in terms of status relative to Task Force goals and major limiting factors that must be addressed in order to reach the goals. While a few stocks are meeting low-range goals identified at levels consistent with long-term viability, the majority of stocks are not achieving minimum low-range goals, which of course is why most are listed under the U.S. Endangered Species Act. Even greater improvements will be needed to reach mid- to high-range goals consistent with restoration of healthy and harvestable salmon and steelhead throughout their historical range.
All stocks are impacted by a broad array of factors which are collectively responsible for the large-scale declines. In some stocks, impacts are shared relatively evenly among factors and effective strategies will require improvements across that address multiple factors. Among the stock examples presented above, mid-Columbia steelhead and upper Columbia summer Chinook generally fall into this category. In other stocks, significant improvements will depend on the ability to address very large impacts of specific factors. In the case of lower Columbia River coho, it will be difficult to make substantial gains without addressing severe impacts of habitat loss in tributary spawning and rearing areas. For Snake River spring/summer Chinook, hydro-related mortality in freshwater and marine areas is a substantial constraint. Both upper Columbia summer Chinook and Snake spring/summer Chinook have also be significantly impacted by loss of access to historical spawning and rearing areas that are currently blocked by large mainstem dams.
For the purposes of this sensitivity analysis, each stock was considered individually. In reality any given basinwide or region-specific strategy should consider complementary impacts for multiple stocks affected by any given factor (effects of mainstem hydro strategies on all stocks migrating through a given reach for instance). This might involve identification of common assumptions for impact reductions as inputs for multiple stocks.
While significant improvements will be needed in key limiting factors, the life-cycle analyses also demonstrate that the greatest potential for success comes from broad-based strategies that address multiple factors. Sensitivity analyses clearly demonstrate that it is rarely possible to achieve Task Force goals based on improvements in any single factor alone. No one solution will generally achieve the goals. In other words, addressing predation alone is not sufficient, nor is reducing harvest, increasing hatchery production, or improving habitat.
Sensitivity analyses also clearly demonstrate that improvements in multiple factors produce compounding benefits which can produce very large improvements from broad-based
MAFAC CBP Task Force Phase II Report Final 8/29/20
Page 77 of 87
restoration strategies. Benefits of multiple improvements create synergies which far surpass the contributions of the individual factors alone. For instance, improving habitat quantity and quality will increase productivity measured in terms of juveniles produced per adult spawner, but numbers will still be limited by out-of-basin factors that limit smolt-to-adult return rates. Conversely, improving smolt-to-adult return rates by addressing out-of-basin limitations will return greater numbers of spawners, but production will still ultimately depend on the habitat conditions they find. However, improving both habitat productivity and smolt-to-adult survivals multiples the value of each. More, better habitat allows larger numbers of fish surviving out-of-basin factors to realize much higher numbers than they would otherwise have produced by returning to less productive areas. Higher out-of-basin survival returns more fish that are better able to use the habitats available. This is just one example. The dynamic holds for all stocks and limiting factors.
Recognition of the power of compounding benefits from broad-based restoration strategies is one of the most important findings of modeling exercises like these. In modeling parlance, broad lessons such as this are called "emergent properties." These properties or behaviors emerge only when the parts interact in a wider whole. In the case of Columbia Basin salmon and steelhead, challenges of restoration are daunting due to the large scale of decline and the long list of responsible problems. Multiple and severe impacts acting across the life cycle have compounded to reduce fish numbers to very low levels. However, this life-cycle analysis demonstrates that shared strategies addressing multiple factors have to potential to make substantial improvements which could not be achieved by addressing any single factor by itself.
Interpretations of analytical results must recognize that our knowledge base is not perfect, and critical uncertainties remain. Our analysis was an attempt to broadly synthesize the results of decades of research by thousands of scientists at an investment of millions of dollars to provide a general foundation for considering pathways for salmon and steelhead restoration. This exercise also highlighted the effects and implications of substantial uncertainties in the level of impact for many limiting factors. In particular, these include magnitude of latent mortality associated with downstream migration of juveniles through the hydropower system and the tradeoffs between positive and negative effects of hatchery production on natural-origin fish. Even after all of this work, much remains unknown and some may well be unknowable. Therefore, effective long-term salmon and steelhead restoration must inevitably test and adapt.
The life-cycle analysis was primarily a hypothesis testing and learning exercise be used to examine the sensitivity of fish numbers to alternative inputs that reflect a range of uncertainty. Where concerns or disagreements on inputs exist, the modeling framework encourages users to articulate alternative assumptions, and it allows for exploration of the related implications in a systematic fashion.
Analyses are intended to complement, but not substitute for, the wide array of analyses and models currently employed for salmon assessments throughout the region. The Salmon Analyzer is broadly applicable to all species and stocks in the Basin. The tradeoff for this general
MAFAC CBP Task Force Phase II Report Final 8/29/20
Page 78 of 87
applicability is that the model does not provide for mechanistic assessments of the effects of specific conditions (e.g., water temperature) or actions (e.g., hydropower configuration). More-detailed, finer-scaled models have been developed for specific factors and selected species and populations, but existing data are not adequate to develop detailed models for all stocks or all factors. Depending on the type of questions or management decisions being evaluated, it is recommended that results from the Salmon Analyzer be further validated with additional finer-scale analysis.
REFERENCES Anchor QEA. 2017. Double-crested cormorant (DCCO) monitoring report: Avian Predation
Program Monitoring. 2016 Final technical report submitted to the U.S. Army Corps of Engineers, Portland District, Portland, OR. April 2017.
Anderson, J. H., K. I. Warheit, B. E. Craig, T. R. Seamons and A. H. Haukenes. 2020. A review of hatchery reform science in Washington State. Washington Department of Fish and Wildlife. Final report to the Washington Fish and Wildlife Commission.
Araki, H., B. Cooper, and M. S. Blouin. 2007. Genetic effects of captive breeding cause a rapid, cumulative fitness decline in the wild. Science 318:100-103.
Beamesderfer, R. C., B. E. Rieman, L. J. Bledsoe and S. Vigg. 1990. Management implications of a model of predation by a resident fish on juvenile salmonids migrating through a Columbia River Reservoir. North American Journal of Fisheries Management 10:290-304.
Beamesderfer, R. C. P., D. L. Ward, and A. A. Nigro. 1996. Evaluation of the biological basis for a predator control program on northern pikeminnow (Ptychocheilus oregonensis) in the Columbia and Snake Rivers. Canadian Journal of Fisheries and Aquatic Sciences 53:2898-2908.
Berejikian, B., and M. Ford. 2004. A review of relative fitness of hatchery and natural salmon. NOAA Technical Memorandum NMFS-NWFSC-61. Seattle WA.
Berntson, E.A., Carmichael R.W., Flesher M.W., Ward E.J. & Moran P. 2011. Diminished reproductive success of steelhead from a hatchery supplementation program (little sheep creek, Imnaha Basin, Oregon). Transactions of the American Fisheries Society, 140: 685- 698.
Blouin, M. 2003. Relative reproductive success of hatchery and wild steelhead in the Hood River. Final Report to the Bonneville Power Administration, Contract 9245. (Available from the Bonneville Power Administration, P.O. Box 3621, Portland, OR 97208.)
Brannon, E. L., D. F. Amend, M. A. Cronin, J. E. Lannan, S. LaPatra, W. J. McNeil, R. E. Noble, C. E. Smith, A. J. Talbot, G. A. Wedemeyer, and H. Westers. 2020. The controversy about salmon hatcheries. Fisheries 29(9):12-31.
Brophy, L. S., C. M. Greene, V. C. HareI, B. Holycross, A. Lanier, W. N. Heady, K. O’Connor, H. Imaki, T. Haddad, and R. Dana. 2019. Insights into estuary habitat loss in the western
MAFAC CBP Task Force Phase II Report Final 8/29/20
Page 79 of 87
United States using a new method for mapping maximum extent of tidal wetlands. PLoS ONE 14(8): e0218558. https://doi.org/10.1371/journal.pone.0218558
Brown, R., S. Jeffries, D. Hatch, and B. Wright. 2017. Field Report: 2017 Pinniped Research and Management Activities at Bonneville Dam, 10/31/2017.
Buhle, E. R., K. K. Holsman, M. D. Scheurell, and A. Albaugh. 2009. Using an unplanned experiment to evaluate the effects of hatcheries and environmental variation on threatened populations of wild salmon. Biological Conservation 142:2449-2455.
Busack, C. A., and K. P. Currens. 1995. Genetic risks and hazards in hatchery operations: fundamental concepts and issues. American Fisheries Society Symposium 15:71-80.
Carretta, J. V., E. M. Oleson, D. W. Weller, A. R. Lang, K. A. Forney, J. Baker, B. Hanson, K. Martien, M. M. Muto, A. J. Orr, H. Huber, M. S. Lowry, J. Barlow, D. Lynch, L. Carswell, R. L. Brownell Jr., and D. K. Mattila. 2014. U.S. Pacific Marine Mammal Stock Assessments: 2013, U.S. Department of Commerce, NOAA Technical Memorandum, NOAA-TM-NMFS-SWFSC-532. August 1, 2014.
Chasco, B., I.C. Kaplan, A. Thomas, A. Acevedo-Gutiérrez, D. Noren, M.J. Ford, M. B. Hanson, J. Scordino, S. Jeffries, S. Pearson, K.N. Marshall and E. J. Ward. 2017b. Estimates of Chinook salmon consumption in Washington State inland waters by four marine mammal predators from 1970 to 2015. Canadian Journal of Fisheries and Aquatic Sciences 74: 1173–1194.
Chilcote, M. W., K. W. Goodson, M. R. Falcy. 2011. Reduced recruitment performance in natural populations of anadromous salmonids associated with hatchery-reared fish. Canadian Journal of Fisheries and Aquatic Sciences 68:511-522.
Chilcote, M. W., K. W. Goodson, and M. R. Falcy. 2013. Corrigendum: Reduced recruitment performance in natural populations of anadromous salmonids associated with hatchery-reared fish. Canadian Journal of Fisheries and Aquatic Sciences 10: 1-3.
Chilcote, M.W., S.A. Leider, and J.J. Loch. 1986. Differential reproductive success of hatchery and wild summer-run steelhead under natural conditions. Transactions of the American Fisheries Society 115: 726-735.
Christie, M. R., R. A. French, M. L. Marine, and M. S. Blouin. 2014b. How much does inbreeding contribute to the reduced fitness of hatchery-born steelhead (Oncorhynchus mykiss) in the wild? Journal of Heredity 105:111-119.
Collis, K., A. Evans, B. Cramer, A. Turecek, Q. Payton, K. Kelly, F. Stetler, S. Fitzmaurice, and P. J. Loschl. 2018. Implementation of the Inland Avian Predation Management Plan, 2017. Final report. Prepared by Real Time Research for U.S. Army Corps of Engineers, Walla Walla District, Walla Walla, WA. May 8, 2018.
Collis, K., D. D. Roby, D. P. Craig, S. Adamany, J. Y. Adkins, and D. E. Lyons. 2002. Colony size and diet composition of piscivorous waterbirds on the lower Columbia River: implications for losses of juvenile salmonids to avian predation. Trans. Amer. Fish. Soc. 131:537-550.
MAFAC CBP Task Force Phase II Report Final 8/29/20
Page 80 of 87
Courter, I. I., G. J. Wyatt, R. W. Perry, J. M. Plumb, F. M. Carpenter, N. K. Ackerman, R. B. Lessard, and P. F. Galbreath. 2018. A Natural-Origin Steelhead Population's Response to Exclusion of Hatchery Fish. Transactions of the American Fisheries Society 148:339-351.
CSS (Comparative Survival Study Oversight Committee) 2017. Comparative Survival Study of PIT-tagged Spring/Summer/Fall Chinook, Summer Steelhead, and Sockeye. 2017 Annual Report, BPA Project #19960200 Contract #74406 (12/16-11/17) Prepared by Comparative Survival Study Oversight Committee and Fish Passage Center, 12/1/2017.
CSS (Comparative Survival Study Oversight Committee) 2019. Comparative Survival Study of PIT-tagged Spring/Summer/Fall Chinook, Summer Steelhead, and Sockeye. 2019 Annual Report, BPA Project #19960200 Contract #78040 (12-1-2018 to 11-30-2019). Prepared by Comparative Survival Study Oversight Committee and Fish Passage Center.
CSS (Comparative Survival Study Oversight Committee). 2018. Comparative Survival Study of PIT-tagged Spring/Summer/Fall Chinook, Summer Steelhead, and Sockeye. 2018 Annual Report, BPA Project #19960200 Contract #77836 (12-1-2017 to 11-30-2018). Prepared by Comparative Survival Study Oversight Committee and Fish Passage Center, 12/1/2018.
Evans, A., Q. Payton, B. Cramer, K. Collis, J. Tennyson, P. Loschl, and D. Lyons. 2018a. East Sand Island Passive integrated Transponder tag recovery and avian predation rate analysis, 2017. Final technical report. Submitted to the U.S. Army Corps of Engineers, Portland District, Portland, OR. February 15, 2018.
Evans, A., Q. Payton, K. Collis, and D. Roby. 2018b. Cumulative effects of avian predation on survival of Upper Columbia River steelhead: preliminary findings. Prepared for C. Dodson, Grant County Public Utility District and Priest Rapid Coordinating Committee, Ephrata, WA. September 13, 2018.
Falcy, M. 2017. Population Viability of Willamette River Winter Steelhead. An Assessment of the effect of sea lions at Willamette Falls. ODFW.
Faulkner, J. R., B. L. Bellerud, D. L. Widner and R. W. Zabel. 2019. Associations among fish length, dam passage history, and survival to adulthood in two at-risk species of Pacific salmon. Transactions of the American Fisheries Society 148:1069-1087.
Fleming, I. A., and M. R. Gross. 1993. Breeding success of hatchery and wild coho salmon (Oncorhynchus kisutch) in competition. Ecol. Appl. 3:230–245.
Ford, M. J. 2002. Selection in captivity during supportive breeding may reduce fitness in the wild. Conservation Biology 16:815-825.
Ford, M. J., A. R. Murdoch, M. S. Hughes, T. R. Seamons, and E. S. LaHood. 2016. Broodstock history strongly influences natural spawning success in hatchery steelhead (Oncorhynchus mykiss). PLoS One 11:e0164801.
Ford, M. J., J. J. Hard, B. Boelts, E. LaHood and J. Miller. 2008. Estimates of natural selection in a salmon population in captive and natural environments. Conservation Biology 22:783-794.
MAFAC CBP Task Force Phase II Report Final 8/29/20
Page 81 of 87
Friesen, T. A. and D. L. Ward. 1999. Management of Northern Pikeminnow and Implications for Juvenile Salmonid Survival in the Lower Columbia and Snake rivers. North American Journal of Fisheries Management 19:406-420.
GCPUD (Grant County Public Utility District No. 2). 2019. Calender Year 2018 Activities under Priest Rapids Hydroelectric Project License (FERC No. 2114).
HSRG (Hatchery Scientific Review Group). 2009. Columbia River hatchery reform system-wide report. http://hatcheryreform.us/wp-content/uploads/2016/05/01_HSRG-Final-Systemwide-Report.pdf
HSRG (Hatchery Scientific Review Group). 2014. On the Science of Hatcheries: An updated perspective on the role of hatcheries in salmon and steelhead management in the Pacific Northwest. A. Appleby, H.L. Blankenship, D. Campton, K. Currens, T. Evelyn, D. Fast, T. Flagg, J. Gislason, P. Kline, C. Mahnken, B. Missildine, L. Mobrand, G. Nandor, P. Paquet, S. Patterson, L. Seeb, S. Smith, and K. Warheit. June 2014; revised October 2014. http://hatcheryreform.us/wp-content/uploads/2016/05/On-the-Science-of-Hatcheries_HSRG_Revised-Oct-2014.pdf
Hulett, P. L., C. W. Wagemann, and S. A. Leider. 1996. Studies of hatchery and wild steelhead in the lower Columbia region. Progress report for fiscal year 1995, Report No. RAD 96-01. (Available from Washington Department of Fish and Wildlife, 600 Capitol Way N., Olympia, WA 98501.)
ISAB (Independent Scientific Advisory Board). 2007. Review of Hypotheses and Causative Factors Contributing to Latent Mortality and their Likely Relevance to the “Below Bonneville” Component of the COMPASS Model. Northwest Power and Conservation Council, Portland Oregon. ISAB-2007-1.
ISAB (Independent Scientific Advisory Board). 2012. Follow-up to ISAB reviews of three FPC memos and CSS annual reports regarding latent mortality of in-river migrants due to route of dam passage. Northwest Power and Conservation Council, Portland Oregon. ISAB-2012-1.
ISAB (Independent Scientific Advisory Board). 2015. Density Dependence and its Implications for Fish Management and Restoration in the Columbia River Basin. Northwest Power and Conservation Council, Portland Oregon. ISAB 2015-1. https://www.nwcouncil.org/fish-and-wildlife/fw-independent-advisory-committees/independent-scientific-advisory-board/density-dependence-and-its-implications-for-fish-management-and-restoration-in-the-columbia-river-basin-and-july-2016-addendum
ISAB (Independent Scientific Advisory Board). 2019a. A review of predation impacts and management effectiveness for the Columbia River Basin. Northwest Power and Conservation Council. Portland, OR.
ISAB (Independent Scientific Advisory Board). 2019b. Review of the comparative survival study (CSS) draft 2019 annual report. Northwest Power and Conservation Council, Portland
MAFAC CBP Task Force Phase II Report Final 8/29/20
Page 82 of 87
Oregon. ISAB-2019-2. https://www.nwcouncil.org/sites/default/files/ISAB%202019-2%20ReviewCSSdraft2019AnnualReport17Oct.pdf
ISAB/ISRP (Independent Scientific Advisory/ Independent Scientific Review Panel). 2016. Critical uncertainties for the Columbia River basin Fish and Wildlife Program. Northwest Power and Conservation Council ISAB/ISRP 2016-1.
ISRP (Independent Scientific Review Panel). 2016. Review of the Idaho Supplementation Studies Project Completion Report 1991-2014. Northwest Power and Conservation Council ISRP 2016-9.
Janowitz-Koch, I., C. Rabe, R. Kinzer, D. Nelson, M. A. Hess, and S. R. Narum. 2019. Long-term evaluation of fitness and demographic effects of a Chinook salmon supplementation program. Evolutionary Applications 12:456-469.
Kohler, A. E., P. C. Kusnierz, T. Copeland, D. A. Venditti, L. Denny, J. Gable, B. A. Lewis, R. Kinzer, B. Barnett and M. S. Wipfli. 2013. Salmon-mediated nutrient flux in selected streams of the Columbia River basin, USA. Canadian Journal of Fisheries and Aquatic Sciences 70:502-512.
Kostow, K. 2009. Factors that contribute to the ecological risks of salmon and steelhead hatchery programs and some mitigating strategies. Reviews in Fish Biology and Fisheries 19:9-31.
Kostow, K. E., A. R. Marshall, and S. R. Phelps. 2003. Naturally spawning hatchery steelhead contribute to smolt production but experience low reproductive success. Transactions of the American Fisheries Society 132:780–790.
LCREP (Lower Columbia River Estuary Partnership). 2017. Defining voluntary restoration targets for species survival: How much habitat is enough in the Lower Columbia River?
Lichatowich, J. A., M. S. Powell and R. N. Williams. 2006. Artificial production and the effects of fish culture on native salmonids. Pages 417 to 464 in R. N. Williams, editor. Return to the River: Restoring salmon to the Columbia River. Elsevier, Amsterdam.
Lynch, M., and M. O’Hely. 2001. Captive breeding and the genetic fitness of natural populations. Conservation Genetics 2:363-378.
Lyons, D.E., D.D. Roby, A.F. Evans, N.J. Hostetter, and K. Collis. 2011. Benefits to Columbia River anadromous salmonids from potential reductions in avian predation on the Columbia plateau. Final report. Prepared for the U.S. Army Corps of Engineers, Walla Walla District, Walla Walla, Washington. Sept. 7, 2011.
Madson, P. L., B. K. van der Leeuw, K. M. Gibbons, et al. 2017. Evaluation of Pinniped Predation on Adult Salmonids and Other Fish in the Bonneville Dam Tailrace, 2016. U.S. Army Corps of Engineers, Cascade Locks, Oregon, 2/9/2017.
Marcoe, K. and S. Pilson. 2017. Habitat change in the lower Columbia River Estuary. Journal of Coastal Conservation Planning and Management DOI 10.1007/s11852-017-0523-7
MAFAC CBP Task Force Phase II Report Final 8/29/20
Page 83 of 87
McCann, J., B. Chockley, E. Cooper, B. Hsu, H. Schaller, S. Haeseker, R. Lessard, C. Petrosky, T. Copeland, E. Tinus, E. Van Dyke, A. Storch, and D. Rawding. 2017. Comparative Survival Study of PIT-Tagged Spring/Summer/Fall Chinook, Summer Steelhead, and Sockeye, 2017 Annual Report. BPA Project #19960200. http://www.fpc.org/documents/CSS/2017%20CSS%20Annual%20Report%20ver1-1.pdf
McClure, M. M., F. M. Utter, C. Baldwin, R, W. Carmichael, P. F. Hassemer, P. J. Howell, P. Spruell, T. D. Cooney, H. A. Schaller, and C. E. Petrosky. 2008. Evolutionary effects of alternative artificial propagation programs: implications for viability of endangered anadromous salmonids. Evolutionary Applications1:356–375.
McLean, J. E., P. Bentzen, and T. P. Quinn. 2003. Differential reproductive success of sympatric, naturally spawning hatchery and wild steelhead trout (Oncorhynchus mykiss) through the adult stage. Canadian Journal of Fisheries and Aquatic Sciences 60:433–440.
McLean, J. E., P. Bentzen, and T. P. Quinn. 2004. Differential reproductive success of sympatric naturally spawning hatchery and wild steelhead (Oncorhynchus mykiss). Environmental Biology of Fishes 69:359–369.
McMichael, G. A., R. A. Harnish, B. J. Bellgraph, J. A. Carter, K. D. Ham, P. S. Titzler, and M. S. Hughes. 2010. Survival and Migratory Behavior of Juvenile Salmonids in the Lower Columbia River Estuary in 2009. PNNL-19545, Pacific Northwest National Laboratory, Richland, Washington. https://waterpower.pnnl.gov/jsats/pdf/PNNL-19545.pdf
Mobrand, L. E., J. Barr, L. Blankenship, D. E. Campton, T. T. P. Evelyn, T. A. Flagg, C. V. M. Mahnken, L. W. Seeb, P. R. Seidel, and W. W. Smoker. 2005. Hatchery reform in Washington State Principles and emerging issues. Fisheries 30(6):11-23.
Muir, W. D., S. G. Smith, J. G. Williams, and B.P. Sandford. 2001. Survival of juvenile salmonids passing through bypass systems, turbines, and spillways with and without flow deflectors at Snake River dams. North American Journal of Fisheries Management 21:135-146.
Naish, K. A., J. E. Taylor III, P. S. Levin, T. P. Quinn, J. R. Winton, D. Huppert, and R. Hilborn. 2008. An evaluation of the effects of conservation and fishery enhancement hatcheries on wild populations of salmon. Advances in Marine Biology 53:61-194.
NMFS (Natural Marine Fisheries Service). 2011. Columbia River estuary ESA recovery plan module for salmon and steelhead. Northwest Region, Portland, Oregon. https://www.fisheries.noaa.gov/resource/document/columbia-river-estuary-esa-recovery-plan-module-salmon-and-steelhead
NMFS (National Marine Fisheries Service). 2014. Final Environmental Impact Statement to inform Columbia Bain Hatchery operations and the funding of Mitchell Act hatchery programs. Seattle WA.
NMFS (Natural Marine Fisheries Service). 2019. Endangered Species Act (ESA) Section 7(a)(2) Biological Opinion and Magnuson-Stevens Fishery Conservation and Management Act Essential Fish Habitat Response - Continued Operation and Maintenance of the Columbia River System. NMFS Consultation Number: WCRO-2018-00152.
MAFAC CBP Task Force Phase II Report Final 8/29/20
Page 84 of 87
https://www.westcoast.fisheries.noaa.gov/publications/hydropower/fcrps/master_2019_crs_biological_opinion__1_.pdf
NOAA Fisheries. 2017. ESA Recovery Plan for Snake River Fall Chinook Salmon (Oncorhynchus tshawytscha). West Coast Region, Portland Oregon.
NRC (National Research Council). 1996. Upstream: Salmon and society in the Pacific Northwest. National Academy Press. Washington, D. C.
ODFW (Oregon Department of Fish and Wildlife) and WDFW (Washington Department of Fish and Wildlife). 2019. Joint Staff Report: Stock status and fisheries for Spring Chinook, Summer Chinook, Sockeye, Steelhead and other species. https://www.dfw.state.or.us/fish/OSCRP/CRM/reports/19_reports/2019_spring_jsr.pdf
Payton, Q., A. F. Evans, N. J. Hostetter, D. D. Roby, B. Cramer and K. Collis. 2020. Measuring the additive effects of predation on prey survival across spatial scales. Ecological Applications https://esajournals.onlinelibrary.wiley.com/doi/abs/10.1002/eap.2193
Petrosky, C. E., H. S. Schaller, E. S. Tinus, T. Copeland, and A. J. Storch. In press. Achieving productivity to recover and restore Columbia River stream-type Chinook Salmon relies on increasing smolt-to-adult survival. North American Journal of Fisheries Management.
PFMC (Pacific Fishery Management Council). 2019. Review of 2018 ocean salmon fisheries – stock assessment and fishery evaluation document for the Pacific Coast salmon fishery management plan. https://www.pcouncil.org/wp-content/uploads/2019/02/2018_Review_of_Ocean_Salmon_Fisheries_Final_021419.pdf
PSC (Pacific Salmon Commission). 2018. 2017 Exploitation rate analysis and model calibration volume two: appendix supplement. Joint Chinook Technical Committee Report TCCHINOOK (18)-01 v.2. https://www.psc.org/download/35/chinook-technical-committee/11280/tcchinook-18-2.pdf
Reisenbichler, R. R., and S. P. Rubin. 1999. Genetic changes from artificial propagation of Pacific salmon affect the productivity and viability of supplemented populations. ICES J. Mar. Sci. 56:459–466.
Reisenbichler, R.R., and J.D. McIntyre. 1977. Genetic differences in growth and survival of juvenile hatchery and wild steelhead trout, Salmo gairdneri. Journal of the Fisheries Research Board of Canada 34: 123-128.
Roby, D. D., K. Collis, D. E. Lyons, D. P. Craig, J. Adkins, A. M. Myers, and R. M. Suryan. 2002. Effects of colony relocation on diet and productivity of Caspian terns. J. Wildlife Man. 66:662–673.
Roby, D. D., K. Collis, D. E. Lyons, J. Y. Adkins, Y. Suzuki, P. Loschl, T. Lawes, K. Bixler, A. Peck-Richardson, A. Patterson and 15 other authors. 2013. Research, monitoring, and evaluation of avian predation on salmonid smolts in the lower and mid-Columbia River. Final 2012
MAFAC CBP Task Force Phase II Report Final 8/29/20
Page 85 of 87
annual report. Prepared for the Bonneville Power Administration and U.S. Army Corps of Engineers, Portland, Oregon. October 9, 2013.
Roby, D. D., K. Collis, D. Lyons, T. Lawes, Y. Suzuki, P. Loschl, K. Bixler, E. Hanwacker, J. Mulligan, A. Munes and six other authors. 2016. Evaluation of foraging behavior, dispersal, and predation on ESA-listed salmonids by Caspian terns displaced from managed colonies in the Columbia Plateau Region. 2015 Final annual report. Prepared for the Grant County PUD/Priest Rapids Coordinating Committee, Ephrata, WA. April 27, 2016.
Roby, D. D., K. Collis, D. Lyons, T. Lawes, Y. Suzuki, P. Loschl, K. Bixler, K. Kelly, E. Schniedermeyer, A. Evans, and five other authors. 2017. Evaluation of foraging behavior, dispersal, and predation on ESA-listed salmonids by Caspian terns displaced from managed colonies in the Columbia Plateau Region. 2016 Final annual report. Prepared for the Grant County PUD/Priest Rapids Coordinating Committee, Ephrata, WA. March 31, 2017.
Rub A. M., N. A. Som, M. J. Henderson, B. P. Sandford, D. M. Van Doornik, D. J. Teel, M. J. Tennis, O. P. Langness, B. K. van der Leeuw, and D. D. Huff. 2019. Changes in adult Chinook salmon (Oncorhynchus tshawytscha) survival within the lower Columbia River amid increasing pinniped abundance.
Rubin, S., R. Reisenbichler, L. Wetzel, F. Leonetti, and B. Baker. 2003. Testing for genetic differences between wild spring Chinook salmon and a derived hatchery population continually supplemented with wild fish. Unpubl. manuscr. (Available from U.S. Geological Survey, Western Fisheries Research Center, 6506 NE 65th St., Seattle, WA 98115.)
Ruggerone, G.T. 1986. Consumption of migrating juvenile salmonids by gulls foraging below a Columbia River dam. Transactions of the American Fisheries Society 115:736-742.
Schaller, H. A., and C. E. Petrosky. 2007. Assessing hydrosystem influence on delayed mortality of Snake River stream-type Chinook Salmon. North American Journal of Fisheries Management 27:810-824.
Scheuerell, M. D., P. S. Levin, R. W. Zabel, J. G. Williams and Beth L. Sanderson. 2005. A new perspective on the importance of marine-derived nutrients to threatened stocks of Pacific salmon (Oncorhynchus spp.). Canadian Journal of Fisheries and Aquatic Sciences 62:961-964.
Scheuerell, M. D., E. R. Buhle, B. X. Semmens, M. J. Ford, T. Cooney, and R. W. Carmichael. 2015. Analyzing large-scale conservation interventions with Baysian hierarchical models: a case study of supplementing threatened Pacific Salmon. Ecology and Evolution https://doi.org/10.1002/ece3.1509.
Sorel, M. H., A. M. Wargo-Rub, and R. W. Zabel. 2017. Population-specific migration timing affects en route survival of Chinook salmon through a variable lower-river corridor.
MAFAC CBP Task Force Phase II Report Final 8/29/20
Page 86 of 87
Thériault, V., G. R. Moyer, L. S. Jackson, M. S. Blouin, and M. A. Banks. 2011. Reduced reproductive success of hatchery coho salmon in the wild: insights into most likely mechanisms. Molecular Ecology 20:1860-9.
Tidwell, K. S., B. A. Carrothers, K. N. Bayley, L. N. Magill, and B. K. van der Leeuw. 2019. Evaluation of pinniped predation on adult salmonids and other fish in the Bonneville Dam tailrace, 2018. U.S. Army Corps of Engineers, Portland District Fisheries Field Unit. Cascade Locks, OR.
Turecek, A., J. Tennyson, P. von Weller, K. Collis, and B. Cramer. 2019. Double-crested cormorant monitoring on East Sand Island, 2018. Final report. Real Time Research, Bend, OR. Submitted to U.S. Army Corps of Engineers, Portland District, Portland, Oregon. May 20, 2019.
USACE (U.S. Army Corps of Engineers). 2014. Inland Avian Predation Management Plan, Environmental Assessment. Walla Walla District, Walla Walla, WA. January, 2014.
USACE (U.S. Army Corps of Engineers). 2015a. Double-crested cormorant management plan to reduce predation on juvenile salmonids in the Columbia River Estuary: Final Environmental Impact Statement. Portland District, Portland, Oregon. February, 2015.
USACE (U.S. Army Corps of Engineers). 2015b. Final Environmental Assessment, Caspian tern nesting habitat management East Sand Island, Clatsop County, Oregon. Portland District, Portland, Oregon. April 17, 2015.
USACE (U.S. Army Corps of Engineers). 2020. Columbia River system operations draft environmental impact statement. Portland District, Portland, Oregon. https://www.nwd.usace.army.mil/CRSO/
Venditti, D. A., R. N. Kinzer, K. A. Apperson, B. Barnett, M. Belnap, T. Copeland, M. P. Corsi, W. T. Gross, L. Janssen, R. Santo, K. Tardy, and A. Teton. 2015. Idaho supplementation studies. Project completion report 1991-2014. Idaho Department of Fish and Game Report 15-18.
WDFW (Washington Department of Fish and Wildlife) and ODFW (Oregon Department of Fish and Wildlife). 2019. Joint Staff Report: Stock status and fisheries for Fall Chinook Salmon, Coho Salmon, Chum Salmon, Summer Steelhead and White Sturgeon. https://www.dfw.state.or.us/fish/OSCRP/CRM/reports/19_reports/2019falljsr.pdf
Welch, D. W., E. L. Rechisky, M. C. Melnychuk, A.D. Porter, C. J. Walters, S. Clements, B. J. Clemons, R. S. McKinley and C. Schreck. 2008. Survival of migrating salmon smolts in large rivers with and without dams. PLOS Biology 6(12): e314. https://doi.org/10.1371/journal.pbio.0060314
Widener, D. L., J. R. Faulkner, S. G. Smith, T. M. Marsh, and R. W. Zabel. 2018. Survival estimates for the passage of spring-migrating juveniles salmonds through Snake and Columbia River dams and reservoirs. National Marine Fisheries Service.
MAFAC CBP Task Force Phase II Report Final 8/29/20
Page 87 of 87
https://www.nwfsc.noaa.gov/assets/26/9359_02262018_135356_Widener.et.al.2018-Spring-Survival-2017.pdf
Williams, S., E. Winther, C. M. Barr, and C. Miller. 2017. Report on the predation index, predator control fisheries, and program evaluation for the Columbia River basin Northern Pikeminnow Sport Reward Program. 2017 Annual report, April 1, 2017 thru March 31, 2018. Pacific States Marine Fisheries Commission, Portland, Oregon.
Williamson, K. S., A. R. Murdoch, T. N. Pearsons, E. J. Ward, and M. J. Ford. 2010. Factors influencing the relative fitness of hatchery and wild spring Chinook salmon (Oncorhynchus tshawytscha) in the Wenatchee River, Washington, USA. Canadian Journal of Fisheries and Aquatic Sciences 67:1840-1851.
Wright, B., and T. Murtagh. 2018. Willamette Falls pinniped monitoring project, 2018. Oregon Department of Fish and Wildlife.