Embed Size (px)
Citation preview
Appendix B1 - Reports of NMI-VSL July 31st, 2003
Appendix B1
Reports of NMi-VSL
Euromet project 600Final report NMi VSL
Date: 25-04-2003
Richard Koops

Euromet Project 600 – Comparison of Surface Roughness Standards 2/22
Appendix B1 - Reports of NMI-VSL July 31st, 2003
Description of the measuring instrument 3Type of instrument...................................................................................................................................... 3Environment characterisation ..................................................................................................................... 3Calibration of the instrument ...................................................................................................................... 3Characterising the guiding mechanism ....................................................................................................... 4Characterising noise.................................................................................................................................... 4Data analysis ............................................................................................................................................... 4
Notes on the analysis of the measurement results of the depth settingstandard of type A2. 5Notes on the analysis of the softgauges 6
Notes on the analysis of the files “1001.smd” and “505.smd”.................................................................... 6Notes on the analysis of the file “7080.smd”.............................................................................................. 6
Uncertainty of the measurements 7Results and measurement conditions 21
Euromet Project 600 – Comparison of Surface Roughness Standards 3/22
Appendix B1 - Reports of NMI-VSL July 31st, 2003
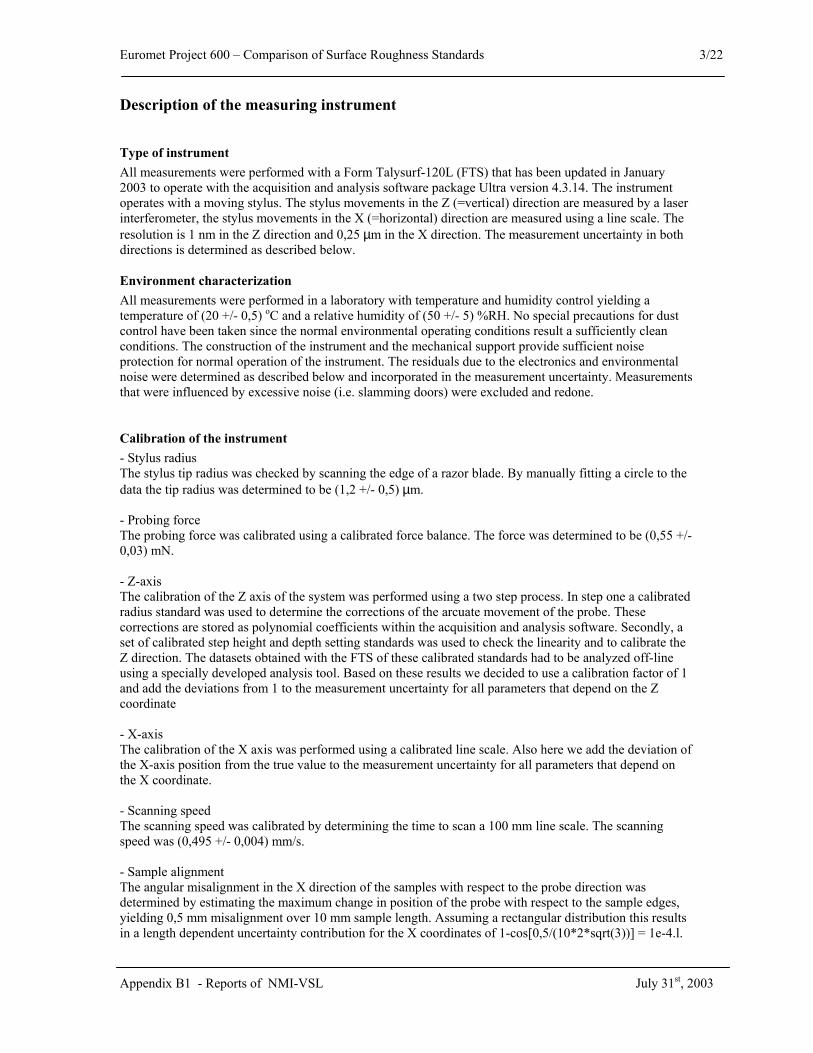
Description of the measuring instrument
Type of instrumentAll measurements were performed with a Form Talysurf-120L (FTS) that has been updated in January2003 to operate with the acquisition and analysis software package Ultra version 4.3.14. The instrumentoperates with a moving stylus. The stylus movements in the Z (=vertical) direction are measured by a laserinterferometer, the stylus movements in the X (=horizontal) direction are measured using a line scale. Theresolution is 1 nm in the Z direction and 0,25 µm in the X direction. The measurement uncertainty in bothdirections is determined as described below.
Environment characterizationAll measurements were performed in a laboratory with temperature and humidity control yielding atemperature of (20 +/- 0,5) oC and a relative humidity of (50 +/- 5) %RH. No special precautions for dustcontrol have been taken since the normal environmental operating conditions result a sufficiently cleanconditions. The construction of the instrument and the mechanical support provide sufficient noiseprotection for normal operation of the instrument. The residuals due to the electronics and environmentalnoise were determined as described below and incorporated in the measurement uncertainty. Measurementsthat were influenced by excessive noise (i.e. slamming doors) were excluded and redone.
Calibration of the instrument- Stylus radiusThe stylus tip radius was checked by scanning the edge of a razor blade. By manually fitting a circle to thedata the tip radius was determined to be (1,2 +/- 0,5) µm.
- Probing forceThe probing force was calibrated using a calibrated force balance. The force was determined to be (0,55 +/-0,03) mN.
- Z-axisThe calibration of the Z axis of the system was performed using a two step process. In step one a calibratedradius standard was used to determine the corrections of the arcuate movement of the probe. Thesecorrections are stored as polynomial coefficients within the acquisition and analysis software. Secondly, aset of calibrated step height and depth setting standards was used to check the linearity and to calibrate theZ direction. The datasets obtained with the FTS of these calibrated standards had to be analyzed off-lineusing a specially developed analysis tool. Based on these results we decided to use a calibration factor of 1and add the deviations from 1 to the measurement uncertainty for all parameters that depend on the Zcoordinate
- X-axisThe calibration of the X axis was performed using a calibrated line scale. Also here we add the deviation ofthe X-axis position from the true value to the measurement uncertainty for all parameters that depend onthe X coordinate.
- Scanning speedThe scanning speed was calibrated by determining the time to scan a 100 mm line scale. The scanningspeed was (0,495 +/- 0,004) mm/s.
- Sample alignmentThe angular misalignment in the X direction of the samples with respect to the probe direction wasdetermined by estimating the maximum change in position of the probe with respect to the sample edges,yielding 0,5 mm misalignment over 10 mm sample length. Assuming a rectangular distribution this resultsin a length dependent uncertainty contribution for the X coordinates of 1-cos[0,5/(10*2*sqrt(3))] = 1e-4.l.

Euromet Project 600 – Comparison of Surface Roughness Standards 4/22
Appendix B1 - Reports of NMI-VSL July 31st, 2003
The angular misalignment in the Z direction of the samples with respect to the probe direction depends onthe parallelism of the specimen surface with respect to the support. Since we do not check the parallelismthe maximum angular misalignment was estimated by the maximum angular misalignment of the support.The value was 0,2 mm on a support base of 30 mm yielding a length dependent uncertainty contribution forthe Z coordinates of 1-cos[0,2/(30*2*sqrt(3))] = 2e-6.l.
Characterizing the guiding mechanismThe influence of the guiding mechanism of the FTS was evaluated by scanning an optical flat on differentpositions using the same part of the guiding mechanism. By averaging 24 different data sets thecharacteristics of the guiding mechanism were extracted. This dataset was then used to evaluate the valuesof all relevant parameters for the comparison and these values were used as uncertainty contributions due tothe guiding mechanism.
Characterizing noiseMeasurement noise (i.e. electronic and environmental) was evaluated by repeated scanning of an opticalflat on the same position using the same part of the guiding mechanism of the FTS. The difference betweenthe data sets excludes the influence of the guiding mechanism and the optical flat leaving only theinstrumental noise. This dataset was then used to evaluated the values of all relevant parameters for thecomparison and these values were used as uncertainty contributions due to instrumental noise.
Data analysis Most analysis could be performed by Ultra software. For the analysis of the depth setting standard data andthe softgauges additional tools were developed in order to extract the desired parameters. Also some toolshad to be developed to subtract and average profile data sets and to process the stylus radius data.
Euromet Project 600 – Comparison of Surface Roughness Standards 5/22
Appendix B1 - Reports of NMI-VSL July 31st, 2003
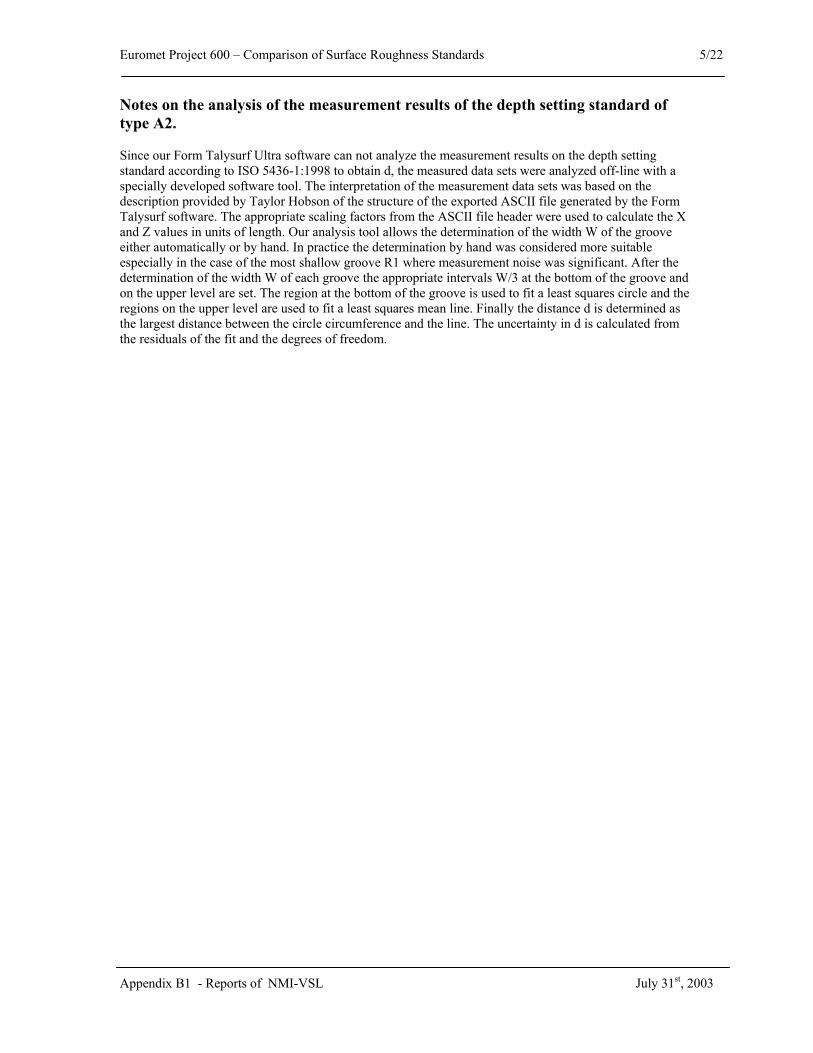
Notes on the analysis of the measurement results of the depth setting standard oftype A2.
Since our Form Talysurf Ultra software can not analyze the measurement results on the depth settingstandard according to ISO 5436-1:1998 to obtain d, the measured data sets were analyzed off-line with aspecially developed software tool. The interpretation of the measurement data sets was based on thedescription provided by Taylor Hobson of the structure of the exported ASCII file generated by the FormTalysurf software. The appropriate scaling factors from the ASCII file header were used to calculate the Xand Z values in units of length. Our analysis tool allows the determination of the width W of the grooveeither automatically or by hand. In practice the determination by hand was considered more suitableespecially in the case of the most shallow groove R1 where measurement noise was significant. After thedetermination of the width W of each groove the appropriate intervals W/3 at the bottom of the groove andon the upper level are set. The region at the bottom of the groove is used to fit a least squares circle and theregions on the upper level are used to fit a least squares mean line. Finally the distance d is determined asthe largest distance between the circle circumference and the line. The uncertainty in d is calculated fromthe residuals of the fit and the degrees of freedom.
Euromet Project 600 – Comparison of Surface Roughness Standards 6/22
Appendix B1 - Reports of NMI-VSL July 31st, 2003
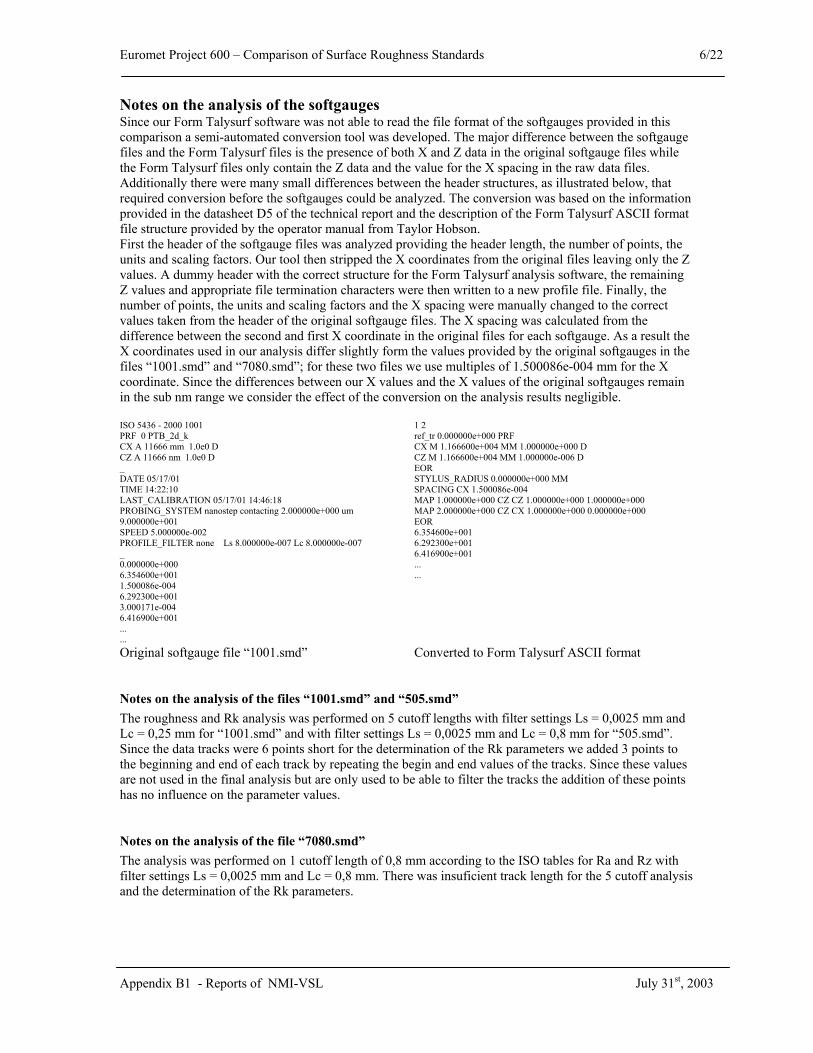
Notes on the analysis of the softgaugesSince our Form Talysurf software was not able to read the file format of the softgauges provided in thiscomparison a semi-automated conversion tool was developed. The major difference between the softgaugefiles and the Form Talysurf files is the presence of both X and Z data in the original softgauge files whilethe Form Talysurf files only contain the Z data and the value for the X spacing in the raw data files.Additionally there were many small differences between the header structures, as illustrated below, thatrequired conversion before the softgauges could be analyzed. The conversion was based on the informationprovided in the datasheet D5 of the technical report and the description of the Form Talysurf ASCII formatfile structure provided by the operator manual from Taylor Hobson.First the header of the softgauge files was analyzed providing the header length, the number of points, theunits and scaling factors. Our tool then stripped the X coordinates from the original files leaving only the Zvalues. A dummy header with the correct structure for the Form Talysurf analysis software, the remainingZ values and appropriate file termination characters were then written to a new profile file. Finally, thenumber of points, the units and scaling factors and the X spacing were manually changed to the correctvalues taken from the header of the original softgauge files. The X spacing was calculated from thedifference between the second and first X coordinate in the original files for each softgauge. As a result theX coordinates used in our analysis differ slightly form the values provided by the original softgauges in thefiles “1001.smd” and “7080.smd”; for these two files we use multiples of 1.500086e-004 mm for the Xcoordinate. Since the differences between our X values and the X values of the original softgauges remainin the sub nm range we consider the effect of the conversion on the analysis results negligible.
ISO 5436 - 2000 1001 PRF 0 PTB_2d_k CX A 11666 mm 1.0e0 DCZ A 11666 nm 1.0e0 D_DATE 05/17/01 TIME 14:22:10 LAST_CALIBRATION 05/17/01 14:46:18 PROBING_SYSTEM nanostep contacting 2.000000e+000 um9.000000e+001SPEED 5.000000e-002PROFILE_FILTER none Ls 8.000000e-007 Lc 8.000000e-007_0.000000e+0006.354600e+0011.500086e-0046.292300e+0013.000171e-0046.416900e+001......
1 2ref_tr 0.000000e+000 PRFCX M 1.166600e+004 MM 1.000000e+000 DCZ M 1.166600e+004 MM 1.000000e-006 DEORSTYLUS_RADIUS 0.000000e+000 MMSPACING CX 1.500086e-004MAP 1.000000e+000 CZ CZ 1.000000e+000 1.000000e+000MAP 2.000000e+000 CZ CX 1.000000e+000 0.000000e+000EOR6.354600e+0016.292300e+0016.416900e+001......
Original softgauge file “1001.smd” Converted to Form Talysurf ASCII format
Notes on the analysis of the files “1001.smd” and “505.smd”The roughness and Rk analysis was performed on 5 cutoff lengths with filter settings Ls = 0,0025 mm andLc = 0,25 mm for “1001.smd” and with filter settings Ls = 0,0025 mm and Lc = 0,8 mm for “505.smd”.Since the data tracks were 6 points short for the determination of the Rk parameters we added 3 points tothe beginning and end of each track by repeating the begin and end values of the tracks. Since these valuesare not used in the final analysis but are only used to be able to filter the tracks the addition of these pointshas no influence on the parameter values.
Notes on the analysis of the file “7080.smd”The analysis was performed on 1 cutoff length of 0,8 mm according to the ISO tables for Ra and Rz withfilter settings Ls = 0,0025 mm and Lc = 0,8 mm. There was insuficient track length for the 5 cutoff analysisand the determination of the Rk parameters.
Euromet Project 600 – Comparison of Surface Roughness Standards 7/22
Appendix B1 - Reports of NMI-VSL July 31st, 2003
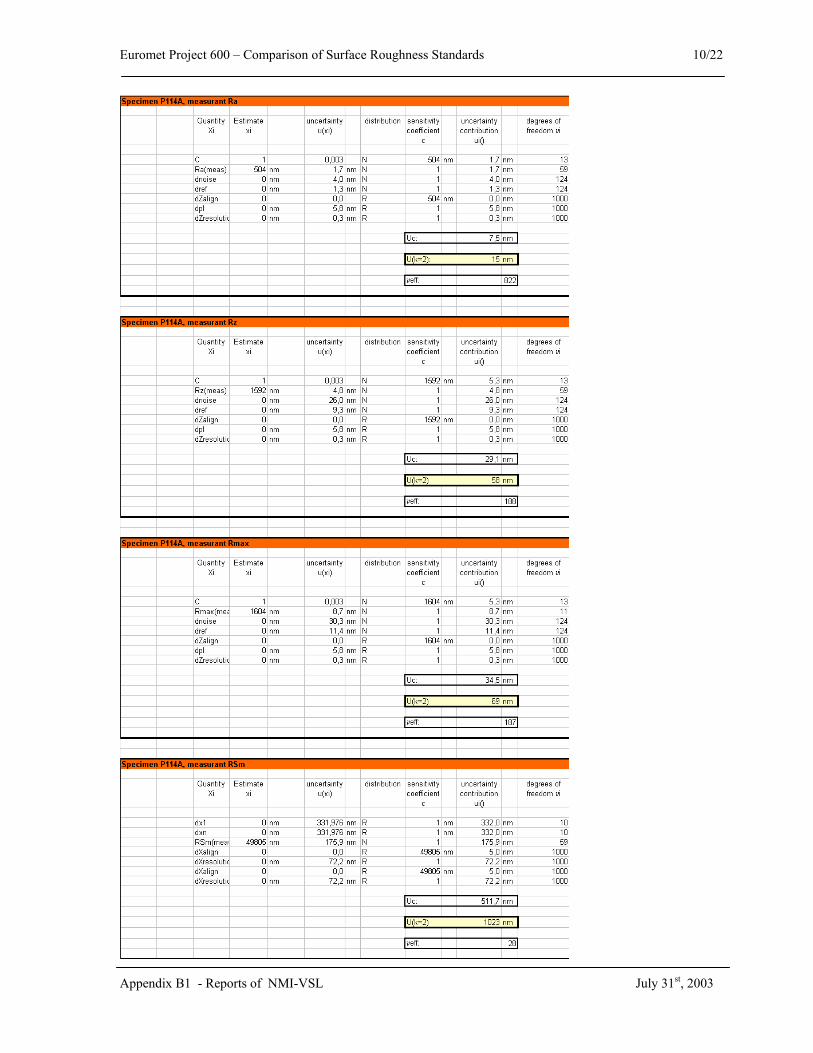
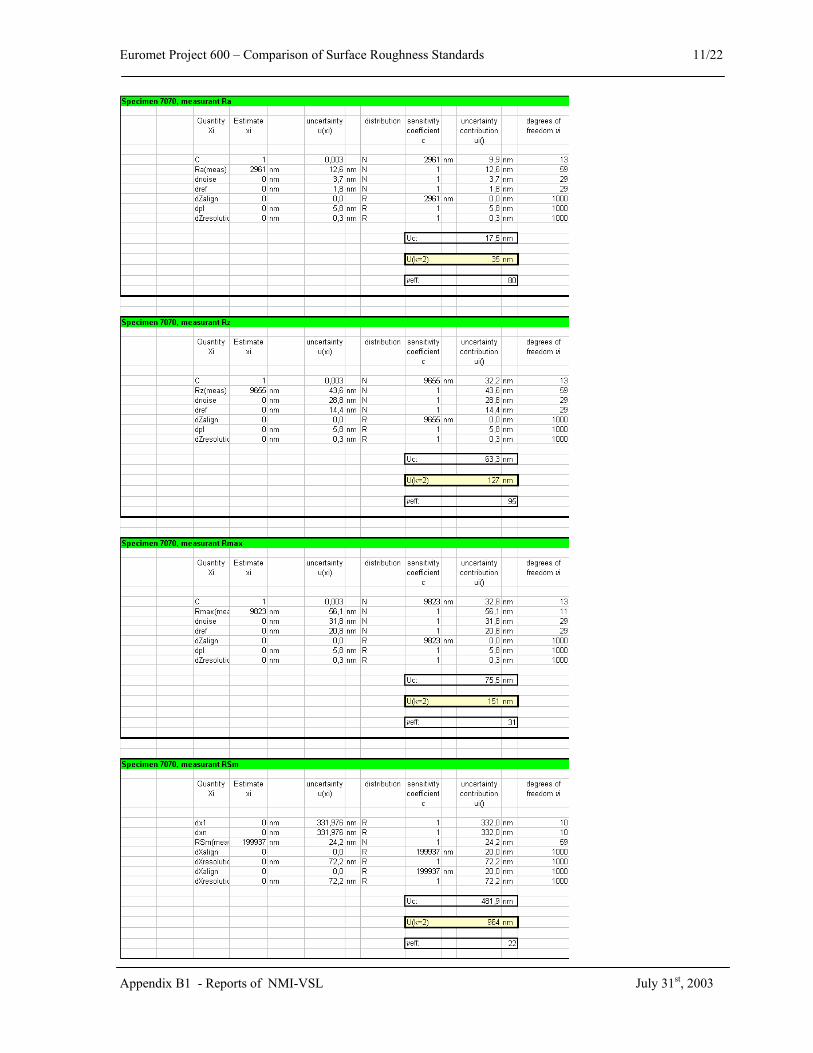
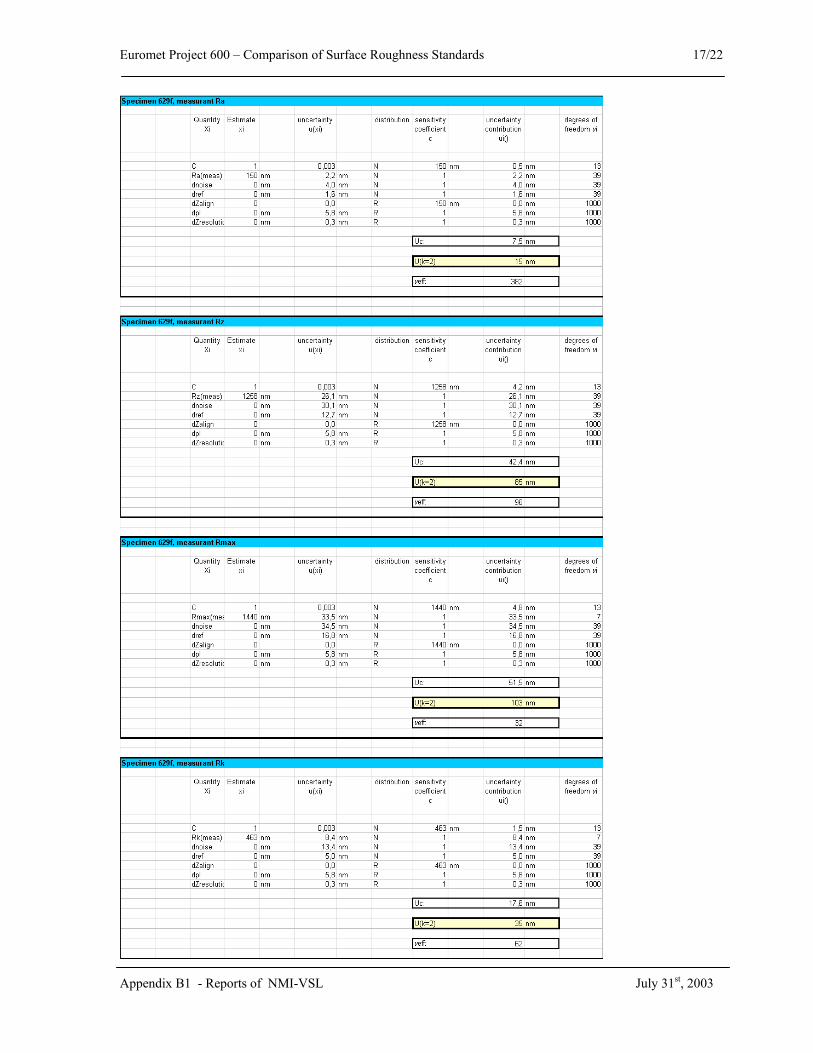
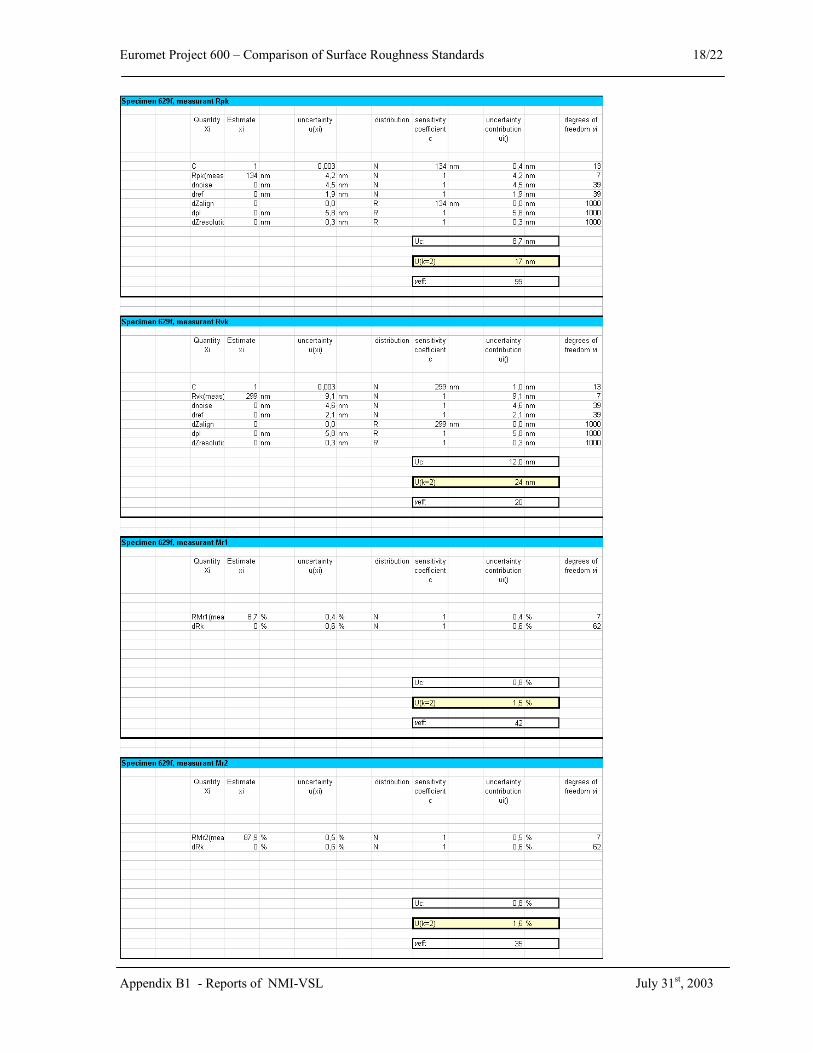
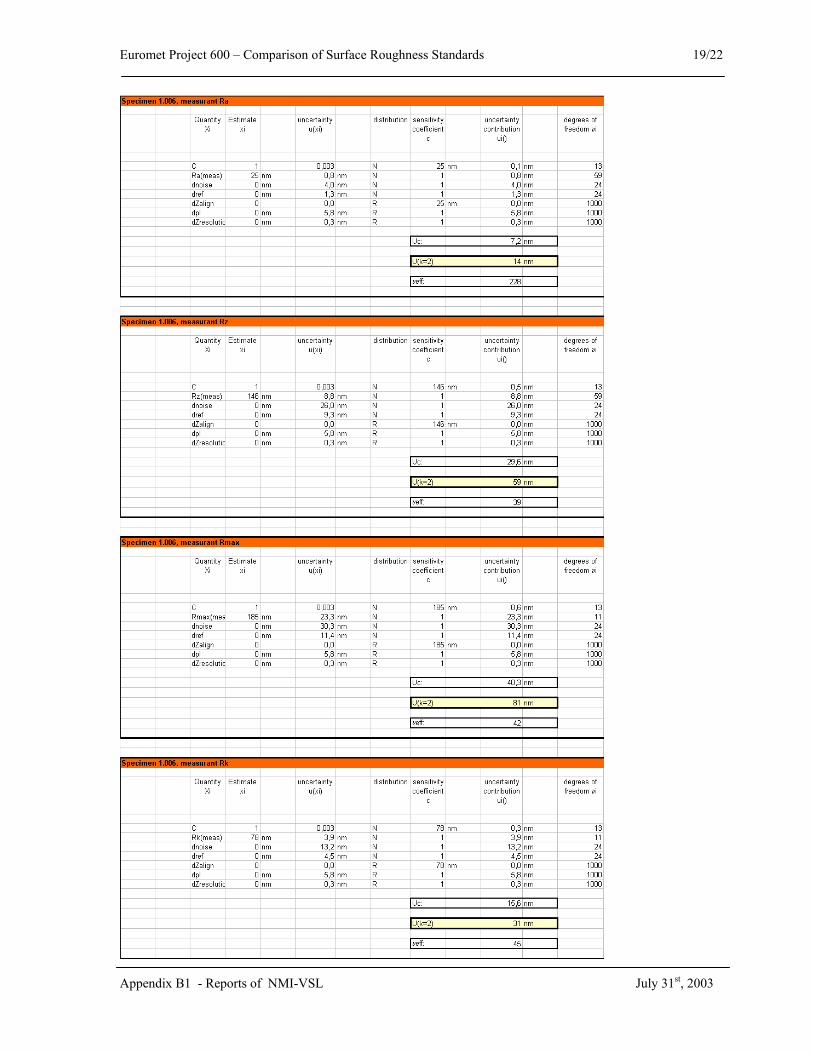
Uncertainty of the measurementsThe uncertainty analysis was based on experimental data and on data taken from literature. The onlyparameter we could not measure was the effect of the plastic deformation of the specimen surfaces as aresult of the probing tip. The uncertainty due to plastic deformation was therefore taken from [1].
The general equation for the determination of a parameters P was:
P = C(Pm + Pref + Pnoise + Ppl)
withP : the parameter to be determinedC : the calibration factor for the Z and X direction. We have set these factors to 1 and added the
deviation from 1 to the uncertainty.Pm : the value of the parameter as generated by the instrument. The standard deviation was used as
uncertainty in this value.Pref : the influence of the guiding mechanism of the instrument. We do not correct for the influence of
the guiding mechanism but add the influence to the measurement uncertainty. We do this bycalculating the parameter value from a profile that represents the guiding mechanism.
Pnoise : the influence of noise (both instrumental and environmental). As with Pref, the influence ofnoise is added to the measurement uncertainty by calculating the parameter value from a profilethat represents the noise only.
Ppl : the plastic deformation of the specimen surface as a result of the probing tip. This value wastaken from [1].
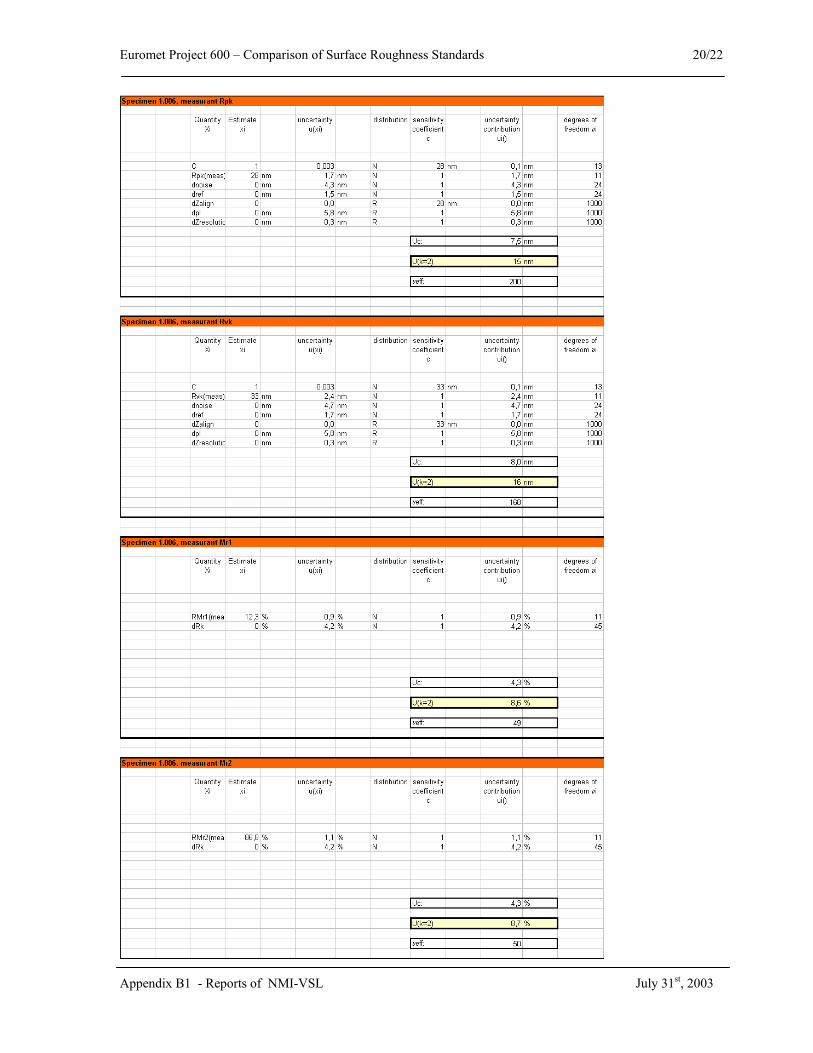
Depending on the specific parameter, uncertainty contributions due to instrumental resolution and specimenalignment were taken into account where necessary. Specifically we estimated the uncertainty in RSm byincorporating the calibration uncertainty for the X-axis and X-alignment for both the start value and endvalue of the X-region that was used to calculate RSm. The uncertainty in the MR parameters was calculatedusing two uncertainty contributions. First the standard deviation of the values generated by the instrumentand secondly the uncertainty in Rk using the following reasoning. We assume that the ordinate axis of theAbbott-Firestone curve can be normalized to 100% using Rmax. We then have percentages on both axis.We further assume a slope of 1 of the curve at the region defined by Rk. Finally we estimate the uncertaintyin MR1 and MR2 due to Rk by half the normalized uncertainty in Rk. Since the uncertainty in Rk includes allother uncertainty sources they are also incorporated in the uncertainty of MR1 and MR2 this way.
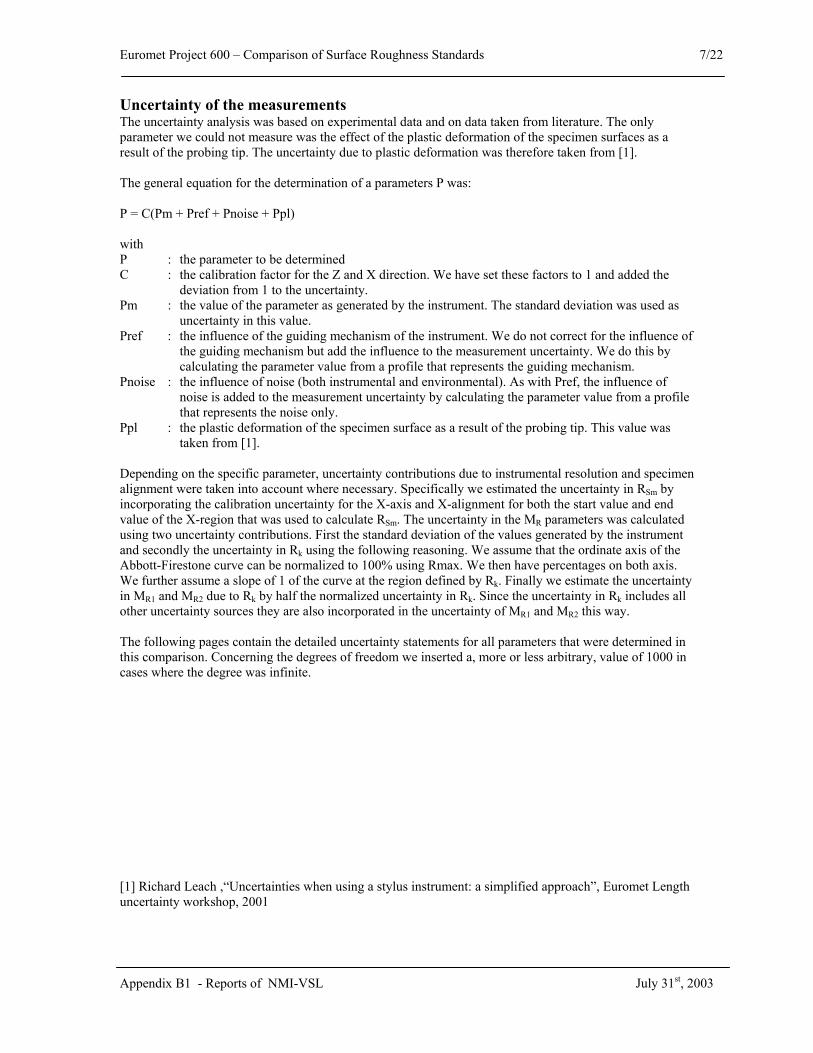
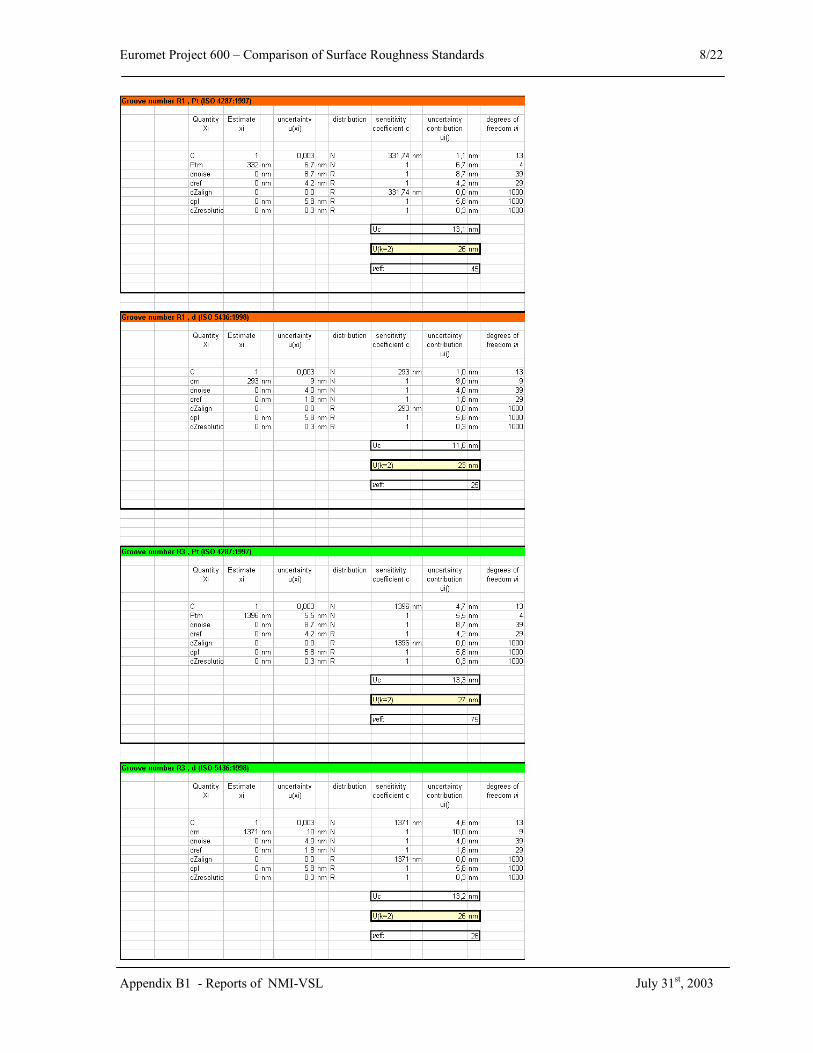
The following pages contain the detailed uncertainty statements for all parameters that were determined inthis comparison. Concerning the degrees of freedom we inserted a, more or less arbitrary, value of 1000 incases where the degree was infinite.
[1] Richard Leach ,“Uncertainties when using a stylus instrument: a simplified approach”, Euromet Lengthuncertainty workshop, 2001
Euromet Project 600 – Comparison of Surface Roughness Standards 8/22
Appendix B1 - Reports of NMI-VSL July 31st, 2003
Euromet Project 600 – Comparison of Surface Roughness Standards 9/22
Appendix B1 - Reports of NMI-VSL July 31st, 2003
Euromet Project 600 – Comparison of Surface Roughness Standards 10/22
Appendix B1 - Reports of NMI-VSL July 31st, 2003
Euromet Project 600 – Comparison of Surface Roughness Standards 11/22
Appendix B1 - Reports of NMI-VSL July 31st, 2003

Euromet Project 600 – Comparison of Surface Roughness Standards 12/22
Appendix B1 - Reports of NMI-VSL July 31st, 2003

Euromet Project 600 – Comparison of Surface Roughness Standards 13/22
Appendix B1 - Reports of NMI-VSL July 31st, 2003

Euromet Project 600 – Comparison of Surface Roughness Standards 14/22
Appendix B1 - Reports of NMI-VSL July 31st, 2003

Euromet Project 600 – Comparison of Surface Roughness Standards 15/22
Appendix B1 - Reports of NMI-VSL July 31st, 2003

Euromet Project 600 – Comparison of Surface Roughness Standards 16/22
Appendix B1 - Reports of NMI-VSL July 31st, 2003
Euromet Project 600 – Comparison of Surface Roughness Standards 17/22
Appendix B1 - Reports of NMI-VSL July 31st, 2003
Euromet Project 600 – Comparison of Surface Roughness Standards 18/22
Appendix B1 - Reports of NMI-VSL July 31st, 2003
Euromet Project 600 – Comparison of Surface Roughness Standards 19/22
Appendix B1 - Reports of NMI-VSL July 31st, 2003
Euromet Project 600 – Comparison of Surface Roughness Standards 20/22
Appendix B1 - Reports of NMI-VSL July 31st, 2003
Euromet Project 600 – Comparison of Surface Roughness Standards 21/22
Appendix B1 - Reports of NMI-VSL July 31st, 2003
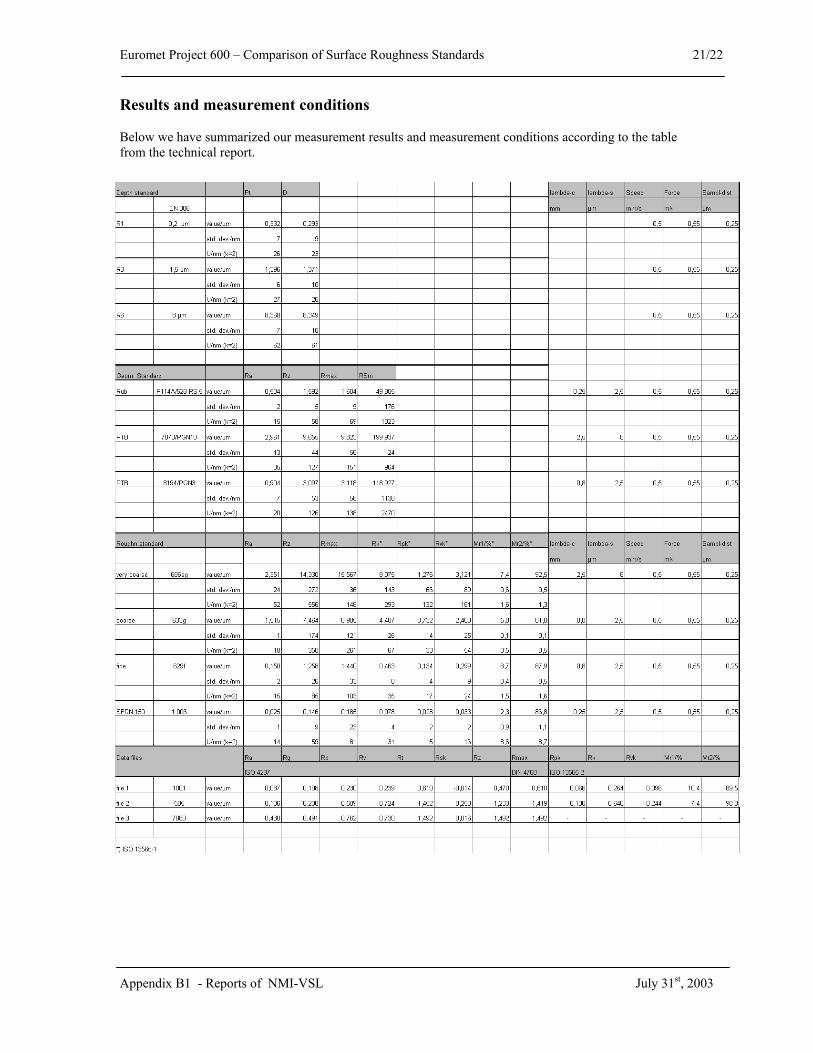
Results and measurement conditions
Below we have summarized our measurement results and measurement conditions according to the tablefrom the technical report.
Euromet Project 600 – Comparison of Surface Roughness Standards 22/22
Appendix B1 - Reports of NMI-VSL July 31st, 2003
Comment from NMi-VSL
What we have done so far is to check all relevant measurement data and the uncertaintycontributions derived for this comparison. In our case two values were, based on the Encriterion, excluded for the calculation of the reference values: Pt for the EN806 depthstandard and Rmax for the 686sg roughness standard. After examining the measurementdata and the uncertainty calculation for these parameters and we were not able to find anyirregularities. However, since Pt is strongly influenced by noise one might argue that wehave estimated the uncertainty contribution due to noise a bit on the low side. For Rmaxwe have measured an exceptionally low standard deviation on the 686sg standard andtherefore a low overall measurement uncertainty. This seems to have been measured alsoby other contributers. So far we can not explain this effect other than that it might be thestandard itself.
When looking at the results of the software standards it is surprising to see the variance inthe results and in other cases the good agreement without matching the PTB referencevalue. This might be a starting point for a discussion with the software suppliers in orderto reach agreement on the correct implementation on the calculation of the variousparameters.